
Abstract
Objectives
The aim of the study was to assess simultaneous pharmacokinetics and thermal and mechanical antinociception after intramuscular methadone (0.6 mg/kg) in 10 cats.
Methods
Thermal and mechanical threshold (TT and MT, respectively) testing and blood collection were conducted at baseline and up to 24 h after administration. Methadone plasma concentrations were determined by liquid chromatography–tandem mass spectrometry and pharmacokinetic parameters were estimated by a non-compartmental method. TT and MT were analysed using ANOVA (P <0.05). Time of maximum plasma concentration (Tmax), time of onset of antinociception and time of reaching cut-out threshold (TT 55°C; MT 30 Newtons [N]) were determined.
Results
TT and MT increased above baseline from 20–240 mins and 5–40 mins, respectively, after intramuscular (IM) administration (P <0.005). Mean maximum delta T (measured as TT minus baseline threshold) was 7.9°C (95% confidence interval [CI] 4.3–11.6) at 60 mins and mean maximum delta F (measured as MT minus baseline threshold) was 4.2 (95% CI 1.6–6.7) N at 45 mins. IM methadone concentration–time data decreased curvilinearly, and gave a clearance estimate of mean 9.1 ml/kg/min (range 5.2–15.7) with median Tmax at 20 mins (range 5–360 mins).
Conclusions and relevance
IM data followed classical disposition and elimination in all cats. Plasma concentrations after IM administration were associated with an antinociceptive effect, including negative hysteresis. These data can be used for devising dosing schedules for methadone in clinical feline practice.
Introduction
Methadone is structurally unrelated to other opium-derived analgesics and exists as a racemic mixture. Each enantiomer has a separate mode of action; the
There is only one report of the kinetics of methadone data in the cat, 2 and no data enabling the relationship between methadone pharmacokinetics and dynamic endpoints to be assessed. While administration of drugs intravenously is the most reliable route to ensure full uptake, this is not always practical in a clinical setting; for example, when used as anaesthetic premedication where intravenous (IV) access may not be possible. The present study evaluated the kinetics and dynamics of a single dose of intramuscular (IM) methadone (0.6 mg/kg) in the cat. Thermal and mechanical threshold (TT and MT, respectively) were measured at the same time as blood sampling to 24 h after drug administration. The study was undertaken in order to provide registration data for an indication for use of IM racemic methadone in the cat.
Material and methods
All studies were conducted after approval by the local institutional review board and according to UK Home Office licence; in-life data were collected in September 2009.
Pharmacokinetics of methadone
Twelve adult neutered cats (three male, nine female; identified as M to X; mean weight 4.4 kg [range 2.9–6.1 kg]) aged 34 months received methadone (0.6 mg/kg) administered intramuscularly into the quadriceps femoris muscle. The day prior to the testing procedure, the cats were anaesthetised with sevoflurane delivered in oxygen (induction by face mask followed by endotracheal intubation for maintenance). Over-the-needle catheters were placed in both cephalic veins for ease of access in case non-protocol IV administration of substances was required during the study and as a back-up for/as the main route for blood sampling. A modified Seldinger technique was used to place 5.5 cm V catheters in the jugular vein in six cats (cats O, Q, S, U, V, X) and the saphenous vein in two cats (cats M, W); the remaining four cats (N,P, R, T) were blood sampled using the second cephalic catheter. Once the catheter was securely fixed the cats were returned to their holding cages for recovery from anaesthesia. On the day of testing, blood samples were withdrawn from the (IV; jugular, saphenous or cephalic) catheter before and at 5, 20, 40 and 60 mins, and then at 2, 3, 4, 6, 8, 12 and 24 h after drug dosing. The volume of blood taken was adjusted for each individual cat, such that over the 24 h sampling period, the total blood volume taken was <10% blood volume. An equal volume of 0.9% saline was injected after each sample was withdrawn. Blood was taken into lithium heparin tubes, and centrifuged (2000 g) for 10 mins. Plasma was separated and stored at −20°C for a maximum of 4 months.
Plasma methadone concentrations were measured at a commercial assay laboratory (Quotient Bioresearch) using liquid chromatography–tandem mass spectrometry. In the concentration range 0.5–150 ng/ml, the inter- and intra-assay coefficients of variation were between 0.8% and 4.3%. Plasma methadone concentrations were linear over the range 0.5–150 ng/ml. The limit of detection for a 1 ml sample was 0.5 ng/ml.
The maximum plasma concentration (Cmax) and time of maximum concentration (Tmax) were observed values. Pharmacokinetic parameters were determined by a non-compartmental method. 3 Drug concentration–time profiles were subjected to non-linear least squares regression of at least three plasma concentrations in order to calculate the elimination half-life (t1/2z). The area under the concentration–time curve (AUC) was calculated to the final concentration time point of 24 h (Ct) by the linear trapezoidal rule. The residual area to infinity was calculated as Ct/kz, where z is the terminal or elimination rate constant. From these values, other kinetic parameters were calculated: apparent clearance (Cl/F) and apparent volume of distribution during the elimination phase (Vz/F) (which are given as Cl/F and and Vz/F because we do not know the bioavailability [F] after IM dosing). Two sets of data for Cl/F and Vz/F are shown in Table 1 – per kg body weight and weight independent. Vz (volume of distribution during the elimination phase, also known as Varea) was used rather than Vdss (steady-state volume of distribution) as it is difficult to calculate the latter for the IM route.
Pharmacokinetic parameters for 10 cats after intramuscular administration of 0.6 mg/kg methadone. Apparent clearance (Cl/F) and apparent volume of distribution during the elimination phase (Vz/F) are shown as both body weight-dependent and body weight-independent

AUC24 = area under the curve to 24 h; Cep = cephalic; Jug = jugular; Sap = saphenous; Cmax = maximum plasma concentration; Tmax = time of maximum concentration; t1/2z = elimination half-life
Pharmacodynamics of methadone
TT and MT were used to determine the dynamic effects of methadone.
TT testing
Thermal nociceptive thresholds were measured using a remote (infrared) controlled system. 4 The testing device (WTT1; Topcat Metrology) is attached over the cat’s back with a Velcro and elastic strap. A small heating and temperature-sensing probe is held against the shaved thorax of the cat with a pressure bladder inside the strap. The starting skin temperature (SST) is recorded on the integral display and then the heat activated so that temperature increases at 0.8°C/s. At the cat’s response (skin twitch accompanied by a behavioural response such as head turn or body shift) heating is stopped immediately and the temperature at the response is held on the display and recorded as the TT. The probe rapidly returns to the SST after the heating is stopped. There is a safety cut-out of 55°C.
MT testing
MTs were measured using a silent, pneumatic system (MTT1; Topcat Metrology), which employs a rolling diaphragm actuator attached to a forelimb using a Velcro and elastic bracelet. 5 The actuator was placed on shaved skin on the dorsolateral aspect of the forelimb between carpus and elbow. Three hemispherical tipped pins (2.5 mm diameter) held in the actuator were advanced against the skin at 2 Newtons (N)/s by increasing the pressure in the actuator manually, using an air-filled syringe. A cage-mounted set of LED lights guides the rate of inflation (red = too fast, green = too slow, lights off = correct rate). Inflation is terminated as soon as the cat’s response is seen (leg shake, biting at the leg, picking up the leg) and the force (N) applied by the actuator at this point is held on the display and recorded as the MT. There is a safety cut-out of 30 N.
Four baseline thresholds were recorded at 15 min intervals before treatment. The mean of these four readings was taken as the baseline TT or MT. Thereafter, TT and MT were measured at each sampling point to 24 h after drug administration. The increase in threshold at the various time points following methadone administration was determined as delta T (calculated as the TT minus the pretreatment TT for each cat) and delta F (MT minus the pretreatment MT).
The same investigator (LS) performed all the TT and MT tests. There was no blinding as this was a single dose study.
Pupil dilation, sedation scores, monitoring of adverse events
Pupil dilation and sedation were recorded at each study time-point with four-point scores as follows. Pupil dilation: 1 = constricted, 2 = normal, 3 = partially dilated, 4 = fully dilated; sedation: 0 = none, 1 = mild (cat was relaxed but could be roused and could walk with no ataxia), 2 = moderate (cat was in sternal or lateral recumbency but could be roused and had obvious signs of ataxia), 3 = no response to stimulation.
Any other behaviours or adverse events were recorded as and when they occurred.
Statistical analyses
Repeated measures ANOVA was performed on the mechanical and thermal dynamic data with post-hoc Dunnett’s test; P values <0.05 were deemed to be statistically significant.
Three indices of methadone’s antinociceptive effect were determined: (1) Tmax; (2) time to onset of antinociceptive effect of the drug and the related methadone plasma concentration (using a conventional method to define biological reference intervals, 6 antinociceptive effect in our model was defined as the baseline threshold [mechanical or thermal] plus 2 SDs, all calculated from the grouped data); (3) time to first achieving the cut-off temperature or mechanical pressure. These data are presented as median (range) unless otherwise stated.
AUCs for plasma drug concentration and dynamic endpoints delta T and delta F were calculated using the linear trapezoidal method, and were compared against each other using regression analysis.
Results
Prior to dosing, most cats had mildly constricted or normal diameter pupils. Administration of IM methadone resulted in profound thermal antinociception with no side effects. It caused pupillary dilation, which persisted for up to 12 h, but no detectable sedation. Owing to various issues full data from two cats (O and X) could not be collected; for this reason although 12 cats started the study, only data from 10 cats are presented.
Kinetics of methadone in the cat
Unless stated otherwise all data presented are mean (SD).
Following the 0.6 mg/kg IM dose of methadone, plasma concentration Tmax occurred at 5–120 mins post-dosing in nine of the cats (median 20 mins), as presented in Table 1. The exception was cat U, which is discussed below.
The Cmax in the 10 cats was 105 (28) ng/ml (range 54–139 ng/ml). The sensitivity of the assay allowed all cats to have measurable plasma methadone concentrations to the last sample point of 24 h. The AUCs to 24 h and to infinity were 52,803 (14,885) and 74,464 (25,142) ng/ml/min, respectively.
Examination of the derived kinetic parameters showed a normal distribution. The estimates for systemic clearance (Cl) and Vz are shown as a ratio of parameter divided by F as an estimate for the latter was not measured or cited in the literature following IM dosing. The disposition data for the 10 cats are shown in Table 1, including the location of the IV catheter for blood sampling. There were no apparent differences seen using one-way ANOVA for the main pharmacokinetic values between animals where blood sampling had been via the cephalic, jugular or saphenous veins. However, the present study was not aimed at or powered to examine this variation.
Dynamics of methadone in the cat
The delta values for MT and TT (ie, threshold minus baseline) are shown in Figure 1a,b. There was no clinically significant change in the SST over the time period 0–24 h (variation by <1ºC). The group pretreatment TT was 43.4 (2.0)ºC. After IM methadone dosing, the TT increased significantly from 20 mins to 4 h. The peak TT was 54.9 (0.3)ºC. The maximum threshold (safety cut-out) of 55ºC was reached in nine cats at 22 (33) mins after treatment and remained at this value for periods between 20 mins and 2 h in these cats.
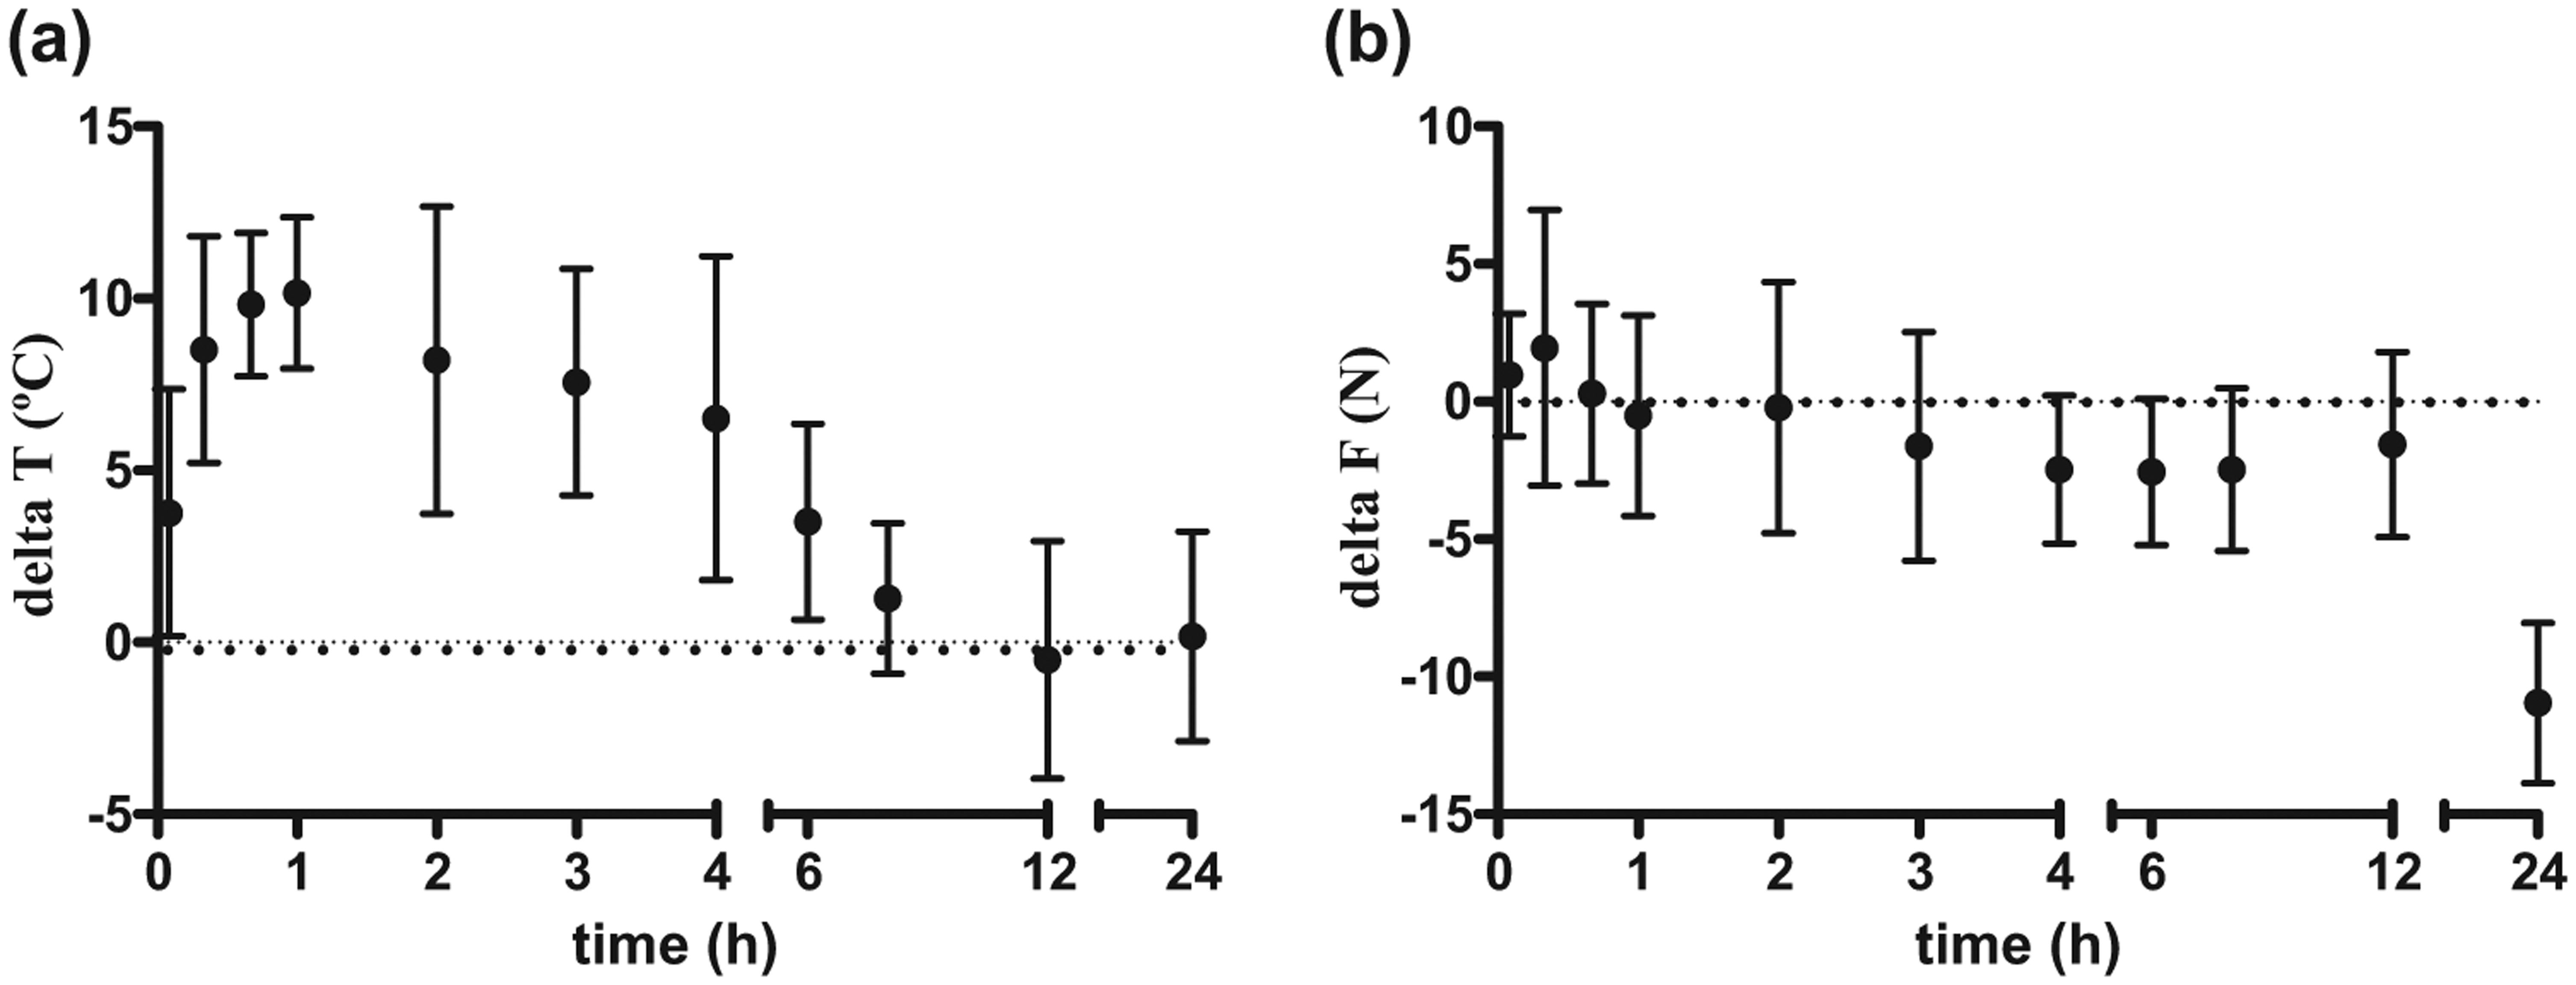
(a) Delta T (change in thermal threshold [TT]) and (b) delta F (change in mechanical threshold [MT]) values for 10 cats after administration of methadone 0.6 mg/kg (mean and SD). Significant differences (a) from baseline TT from 20 mins up to and including 4 h and (b) from baseline MT at 5, 20 and 40 mins
The maximum delta T values in the individual cats ranged between 8.7ºC and 14.8ºC, and occurred between 33 and 150 mins after dosing. Where cats remained at the same delta T for more than one time point, then the closest study time point to the average was taken. The plasma methadone concentration at the time of maximum delta T ranged between 46.7 and 104.0 ng/ml. TT Tmax values were difficult to estimate in the cats that spent a period of time with thresholds that exceeded the cut-out temperature. Individual Tmax values (where there is a range, this indicates the time spent at cut out) were: M, 40 mins; N, 40 mins; P, 20–120 mins; Q, 40–60 mins; R, 120 mins; S, 20–180 mins; T, 40–240 mins; U, 120 mins; V, 60 mins; W 5–60 mins.
Mechanical thresholds varied significantly over time, with MT significantly raised at 5, 20 and 40 mins compared with baseline. The pretreatment MT was 8.4 (1.6) N. The largest delta F ranged in the individual cats between 3.2 and 13.2 N, and occurred between 5 and 240 mins after dosing. The plasma methadone concentration at the time of maximum delta F ranged between 23.4 and 139.0 ng/ml.
The AUC (of delta T over time) for the period 0–1440 mins was 3772.8 (1436.9)ºC/min for the IM dosing; while the corresponding AUC (of delta F over time) for the same period was 1769.3 (1375.6) N/min. Correlation analysis between the AUC (of plasma methadone concentration over time) and AUC (of antinociceptiveeffects over time) to 1440 mins (24 h) postdosing indicated significance for the delta T vs concentration measurement (r = 0.8573) but not for delta F vs concentration (r = −0.4156). There was no significant correlation between the AUCs for the two antinociceptive measures (r = −0.2086).
Kinetic–dynamic relationships
When the measures delta T, delta F and plasma methadone concentration were plotted together against time (Figure 2), there was little difference between kinetic and dynamic profiles. There did not appear to be any significant separation between drug concentration and effect – although the Tmax (median) was 20 mins for concentration (40 mins for MT and for TT).

Methadone plasma concentration and changes in thermal and mechanical threshold (delta T and F, respectively)
As with most drug responses the plasma concentration–time profile and the effect–time relationship were not in phase and there was an anticlockwise hysteresis loop (Figure 3).

Plasma concentration–time profile and the effect–time relationship showing anticlockwise hysteresis loop (effect data derived when concentrations were increasing are called ‘up’ and those when concentrations were decreasing are called ‘down’) Delta T = change in thermal threshold; delta F = change in mechanical threshold; plasma conc = plasma concentration
Both stimulus modalities also showed a dip in response between 360 and 720 mins (Figure 2).
The plasma drug concentrations associated with the onset of antinociception baseline plus 2 SD ranged between 39.2 and 124 ng/ml for temperature, and between 23.4 and 139 ng/ml for mechanical pressure. The comparable values for the offset of antinociception were 13.9–105.0 ng/ml and 15.1–102.0 ng/ml, respectively.
Discussion
Methadone is a synthetic full agonist opioid, but studies have revealed that it also acts on NMDA receptors, 7 and it has been used as an alternative to morphine and hydromorphone in human patients with severe pain. Clinically, in cats, methadone is used for analgesia, often administered as part of anaesthetic premedication where it can assist in the production of sedation in combination with tranquilisers or sedatives. Most comparable clinical studies have used feline ovariohysterectomy as a surgical model, with methadone administered with the premedication and pain/analgesia scored by a variety of methods, including wound palpation and behavioural and physiological observations. An early study examined use of methadone 0.5 mg/kg IM where analgesia was reported for 1.5–6.0 h from administration of methadone; 8 a later study with 0.6 mg/kg IM at premedication reported that 18/19 cats has adequate analgesia for the entire study period of 4 h after surgery and only a single cat required rescue analgesia after 90 mins; 9 a third study using 0.5 mg/kg IM reported good analgesia for the study period of 6 h in 6/8 cats with 1/8 requiring rescue analgesic at4 h and 1/8 at 5 h. 10 Preanaesthetic sedation with anacepromazine–methadone combination was reported to be poor but similar to that seen with an acepromazine–butorphanol combination. 10
The current study used threshold testing tools to assess antinociception rather than a surgical stimulus to assess pain/analgesia. The physiological processes behind a thermal stimulus applied to the thoracic skin or a mechanical stimulus applied to a forelimb are not the same as the pain caused by surgery so their clinical relevance could be questioned. However, nociceptive threshold testing tools are widely used and accepted for pain/analgesia research in laboratory species and in human volunteers. Our study has demonstrated clear differences between the effects of methadone on the two stimulus modalities of heat and pressure; significant effects on MT were much shorter acting than those on TT. This is not unknown in analgesia research and may be owing to a number of factors, including device design and/or different physiological pathways for the two stimuli. As the TT testing tool has already demonstrated similar thermal antinociceptive profiles compared with the well-documented clinical analgesic profile of commonly used opioid analgesics such as buprenorphine, we would suggest that, for whatever reason, the TT data are more likely to be similar to the clinical profile of methadone than the MT.
Comparison of the time courses of kinetic and dynamic effects of the opioid show a lag between increasing plasma concentrations and an increase in observable effects. This is in keeping with the site of action of methadone being at opioid receptors in tissues rather than in plasma (Figure 3), with the lag being the time taken for methadone to move across the blood–brain barrier to opioid receptors in the central nervous system. Many other drugs demonstrate a similar ‘out-of-phase’ concentration–time and the effect–time relationship.
Much less individual variation relating to drug disposition was seen in this study compared with previous studies of other opioids (buprenorphine, morphine and pethidine) in cats.11,12 Cmax and Tmax were very consistent for all cats except for animal U. In this cat there was a late peak in concentration at 360 mins, which could indicate slow absorption or perhaps injection into a poorly vascularised area of the body. The quadriceps muscle was used as the site of injection and should be well vascularised, but this cat was noticeably fatter than the other cats and hence injection of drug into fat tissue might be associated with a reduced rate of absorption.
Median plasma Tmax was at 20 mins. The absorption was less rapid than that seen in a presently unpublished parallel study in dogs (range 5–15 mins), although prolonged absorption time was seen in dogs when administered a higher dose of 0.5 mg/kg compared with 0.3 mg/kg. Other studies with opioids in cats have demonstrated the plasma Tmax after IM injection were 15, 3 and 10 mins for morphine, buprenorphine and pethidine, respectively, 11 and 21 mins for butorphanol. 13
In the present study, racemic methadone was administered at 0.6 mg/kg IM, and as this was the only route of administration, and the cats were not also administered an IV dose, it was not possible to calculate F, which is why our data have been corrected for F. At the time of analysis we were not aware of directly measured data for the F of methadone after IM administration in the cat. Recently published data give a value for F of 44.2% after buccal dosing, with the kinetics for a 0.3 mg/kg IV dose being quoted as Cl 7.2 ml/kg/min and Vz 2.4/kg. 14 Using the AUC in their study and applying it to our data, the estimated F in our study would be between 80%and 85%. Using the data from a study in cats where0.3 mg/kg methadone was administered intravenously, 2 we have calculated the Cl as 4.3 ml/kg/min and half-life (t½) as 278.4 mins (4.6 h). The pharmacokinetic values from these two studies are comparable with the values we have reported herein (Cl/F = 9.1 [3.3] ml/ kg/min and Vz/F = 7.8 [2.7] l/kg; t½ = 627.9 [212.2] mins).
Although Hedges et al found differences in the disposition after buccal administration of buprenorphine in cats depending on the site of blood sampling, 15 we have not found any significant differences in the systemicCl of methadone when comparing data from the three sites used for blood sampling in this study. However, the sample size of each group of cats was small, and to examine it further a properly powered study would be needed. There are also differences in the route of drug dosing (intramuscular vs buccal) between the two studies.
The plasma methadone pharmacokinetics reported here for the cat resemble those seen in dogs. After IV administration of 0.45 mg/kg racemic methadone base to Greyhounds, 16 systemic Cl was 56.0 (9.4) ml/kg/min and Vz was 7.8 (1.9) l/kg; after administration of1 mg/kg IV to Beagles, total body Cl was 24.1 (9.8) ml/kg/min and Vz was 3.7 (1.1) l/kg. 17
When reviewing the literature in humans it becomes clear that while there are many published studies, most publications relate to aspects of its use as a heroinreplacement substance rather than a first-line analgesic and therefore the number of pharmacokinetic studies of methadone in healthy, non-opiate users are limited. There is also a difficulty in making direct comparisons as most animal studies report values adjusted for body weight, whereas those in humans do not. Cl adjusted for F (Cl/F) after oral administration in opiate-naive humans was 115 ml/min (data reported as 6.9 l/h) and t½ estimates were 33–46 h. 18 In these individuals, weight as a co-variable had no significant relationship to Cl/F and using the median body weight, the calculated Cl/F would be about 2 ml/kg/min. Another study reported mean Cl after a 5 mg IV dose as 8.3 l/h (138 ml/min) and after a 10 mgoral dose Cl/F was 9.8 l/h (163 ml/min); 19 adjustment for mean volunteer weight (84 kg) gives a Cl (IV) of1.6 ml/kg/min and Cl/F (oral) of 1.9 ml/kg/min. The estimate for oral F in this study was calculated as 86%, making Cl (oral) 2.2 ml/kg/min, and the t½ was reported as 32 and 31 h in the IV and oral groups, respectively. Terminal t½ in humans, however, are substantially greater than in the cat, for example after effectively a 0.05 mg/kg dose in humans, the t½ was 32 h, whereas after 0.6 mg/kg in the cat the t½ was 10 h; this might be owing to the large Vdss in humans.
A number of studies have investigated plasma concentration with respect to the antinociceptive or analgesic action of methadone in humans; they appear to be similar for acute pain stimuli such as antinociceptive tests and surgery, although much higher concentrations were required for patients with chronic pain.20,21 Postoperative minimum analgesic concentrations in humans were 30–33 ng/ml, 22 whereas the EC50 (half maximal effective concentration – the concentration of a drug which induces a response halfway between the baseline and maximum) in eight patients with chronic pain (five with cancer) was 290 ng/ml. 20 Our study findings of plasma methadone concentrations for onset (39.2–124.0 ng/ml) and offset (13.9–105.0 ng/ml) of thermal antinociception, and onset (23.4–139.0 ng/ml) and offset (15.1–102.0 ng/ml) of mechanical antinociception are similar to those required in humans for acute pain stimuli.
Conclusions
Pharmacokinetics can be defined as what the body does with an administered drug and pharmacodynamics as what the drug does to the body. The aim when investigating potentially useful clinical analgesics is to determine the optimum plasma concentration associated with analgesia; pharmacokinetic and pharmacodynamic data may then be used to determine the optimum route of administration, dose and dosing interval in order to maintain this analgesic plasma concentration. In this study, we have shown that the kinetics of a single dose of IM methadone in the cat are similar to that reported in the dog. Drug uptake is rapid in the cat, but systemicCl for both species is greater than that reported for humans. We have also determined analgesic plasmaconcentrations of methadone. These data may be used in combination to suggest that analgesia from an IMdose of methadone at 0.6 mg/kg would be expected to provide 4 h of analgesia and that the target plasma concentration for onset of analgesia lies between 40 and 124 ng/ml.
Footnotes
Conflict of interest
The authors declared no potential conflicts of interest with respect to the research, authorship, and/or publication of this article.
Funding
This study was funded by Eurovet Animal Health BV.