
Abstract
Objectives
Diagnosis of early feline chronic kidney disease (CKD) is challenging. Glomerular filtration rate (GFR) is the best overall indicator of kidney function, but multisample plasma clearance methods to determine GFR are labour intensive, time consuming and stressful for feline patients. This study aimed to develop simplified methods to detect decreased GFR in cats.
Methods
Data from a nine-sample combined plasma exogenous creatinine–iohexol clearance test of 73 cats were used. Limited sampling strategies were developed by comparing all sampling time combinations with the complete nine sampling times set and selecting the best sampling time combinations based on maximum relative error. By regression analysis, the ability of routine blood (serum creatinine, serum urea) and urine (urine specific gravity, urinary protein:creatinine ratio) variables to predict GFR or identify cats with low or borderline GFR was examined. Cut-off clearance marker concentrations to predict low or borderline GFR was determined at three time points after marker injection. All procedures were analysed for three clearance markers (exo-iohexol, creatinine, endo-iohexol).
Results
For reliable estimation of GFR, at least three blood samples for clinical purposes and five blood samples for research purposes are required. Regression formulae based on routine variables did not reliably predict GFR, but accurately identified cats with low (sensitivity 96.5–98.2%; specificity 60–91.3%) or borderline (sensitivity 91.1–96%; specificity 76.5–81.8%) GFR. Clearance marker concentrations exceeding given marker cut-off concentrations also identified cats with low or borderline GFR with high sensitivities and specificities.
Conclusions and relevance
These simplified methods will facilitate the detection of early kidney dysfunction in cats. Early diagnosis allows timely therapeutic intervention, and future studies must reveal whether this improves the long-term outcome of cats with CKD.
Introduction
Routine blood and urine variables, namely serum creatinine concentration (sCreat), serum urea concentration (sUrea), urinary specific gravity (USG) and urinary protein:creatinine ratio (UPC), do not allow detection of early kidney dysfunction in small animals. It is generally accepted that more than two-thirds of functional renal mass must be lost before kidneys lose their ability to concentrate urine, and more than three-quarters must be lost before an animal becomes azotaemic.1,2 Glomerular filtration rate (GFR) is considered the best overall indicator of kidney function and plasma clearance of an intravenously administered marker is commonly used to estimate feline GFR.2–4 However, evaluation of GFR by multisample plasma clearance methods is labour intensive and time consuming mainly because repeated blood sampling is required for accurate GFR estimation. Multi-sampling techniques can be stressful or even painful, which limits the practical use, especially in cats. 5 Thus, simplified methods to detect cats with decreased GFR are needed. 6 Several limited sampling strategies (LSSs) have been described to estimate feline GFR,5,7–16 but most of these methods are not sufficiently validated in cats with chronic kidney disease (CKD) to be used in practice.
Thus, reliable simplified methods to identify cats with early kidney dysfunction are important. 6 For research purposes, estimating the true GFR with an acceptable margin of error is important. Conversely, knowledge of the actual GFR is often not needed in daily practice. More importantly, clinicians need to be able to predict which patients have a decreased GFR based on routine blood and urine variables, or based on other methods, requiring only a minimal number of blood samples.
In this study, a population of cats with a wide range of GFR values was evaluated. First, we aimed to develop LSSs, both for daily practice and for research purposes, for creatinine, exo-iohexol and endo-iohexol clearances. Secondly, we aimed to evaluate if routine variables (sUrea, sCreat, USG, UPC, systolic blood pressure [SBP]) can predict the actual GFR value of a cat or can identify cats with low or borderline GFR. Finally, we aimed to develop cut-off concentrations for creatinine, exo-iohexol and endo-iohexol at three time points after intravenous bolus administration of creatinine and iohexol to identify cats with low or borderline GFRs.
Materials and methods
Data from cats that underwent a combined plasma exogenous creatinine–iohexol clearance test (PEC–ICT) at the Department of Small Animal Medicine and Clinical Biology, Ghent University, Belgium were used. All animal work was conducted according to guidelines for animal care, with the consent of the ethical committee of the Faculty of Veterinary Medicine, Ghent University, Belgium, and with informed owner consent. Data from several cats have been previously published.17–19 If cats underwent several clearance tests, only one clearance test was used for the present study. The PEC–ICT was performed as previously reported.17,18 Briefly, all cats received 40.0 mg/kg creatinine and 64.7 mg/kg iohexol intravenously. Blood samples were taken in tubes with EDTA as anticoagulant before, and 5, 15, 30, 60, 120, 180, 360, 480 and 600 mins after, injection. Plasma creatinine was assayed by an in-house validated enzymatic method (Vettest analyser; IDEXX Laboratories Europe), and exo-iohexol and endo-iohexol concentrations were determined by a validated high-performance liquid chromatography method with ultraviolet detection.17,20 Pharmacokinetic analyses were performed using WinNonlin version 4.0.1 (Scientific Consulting). The plasma data were subjected to non-compartmental analysis with a statistical moment approach. The area under the plasma concentration vs time curve (AUC) was calculated by the trapezoidal rule with extrapolation to infinity, as described by Watson et al. 21 Plasma clearance of creatinine, exo-iohexol and endo-iohexol was determined by dividing dose administered by AUC and indexed to bodyweight (ml/min/kg).
The following information was retrieved from the medical records of the cats: health status, signalment, sCreat, sUrea, total thyroxine concentration (TT4), USG, UPC and SBP. This information was available on the day the GFR was performed or a maximum of 2 weeks earlier. Healthy was defined as the absence of clinical signs and significant abnormalities on physical examination, complete blood count, serum biochemistry profile (including TT4 in cats older than 6 years) and routine urinalysis (including UPC and bacterial culture). CKD was diagnosed based on compatible history and clinical findings, sCreat >140 µmol/l and USG <1.035. 22 Cats that had both CKD and diabetes mellitus (DM), both CKD and hyperthyroidism, or cats that developed CKD after treatment for hyperthyroidism were included in the CKD group and excluded from the hyperthyroid or DM group. Hyperthyroidism was diagnosed based on compatible clinical signs and increased TT4. The diagnosis of DM was made based on compatible clinical signs, hyperglycaemia, glucosuria and increased serum fructosamine concentrations. Cats without DM or hyperthyroidism that were suspected to have renal disease but with doubtful routine blood (sUrea, sCreat) and urine (USG, UPC) variables were allocated to a separate group of cats with ‘doubtful renal status’.
Statistical analysis
All statistical tests (see below) were performed with Systat 12 (Systat Software) and Excel 2007 (Microsoft), and at the 0.05 significance level.
Simplified methods for estimating GFR
To develop LSSs, 510 sampling time combinations (ie, all possible combinations) were compared with the entire nine blood sampling times set for each clearance marker (creatinine, exo-iohexol and endo-iohexol) by calculation of AUC values by the trapezoidal rule. The maximum relative error was calculated and used to select the best sampling time combination for each number of samples.
A general linear model was used to evaluate if routine variables (SBP, sUrea, sCreat, USG, UPC) could predict feline GFR values.
Simplified methods to identify cats with borderline or low GFR
Method 1
Logistic regression analysis was used to evaluate if routine variables (SBP, sUrea, sCreat, USG, UPC) are able to differentiate cats with GFR below a certain threshold from cats with GFR equal to or above this threshold. By looking at the GFR data and health status of the cats, the range in which the GFR results of cats with CKD overlapped with the GFR results of other groups was identified for each clearance marker (creatinine, exo-iohexol and endo-iohexol). Within these ranges of GFR values, several GFR cut-off values were evaluated by binary logit analysis. Clinically useful GFR cut-off values to discriminate between cats with GFRs below and above these cut-off GFR values were determined based on sensitivity, specificity and receiver operating characteristic (ROC) curve analysis.
Method 2
To develop cut-off concentrations for creatinine, exo-iohexol and endo-iohexol after marker injection to identify cats with decreased GFRs, borderline and low GFR cut-off values were selected for each clearance marker. The borderline GFR cut-off values were arbitrarily selected by looking at the sCreat–GFR relationship curves and selecting a cut-off value in the area in which the curve started to bend (ie, where decreasing GFR resulted in increasing sCreat concentrations) and where GFR values of CKD cats and cats with doubtful renal function overlapped with the other groups. We ensured that the GFR values of all CKD cats were below this cut-off (except the outlier for endo-iohexol clearance) (Figure 1). Borderline GFR cut-off values were defined as 1.7 ml/min/kg for exo-iohexol, and 1.9 ml/min/kg for creatinine and endo-iohexol clearances. The lower GFR cut-off value was selected based on the GFR results of CKD and healthy cats in a previous study using the same PEC–ICT. 19 A GFR cut-off value between the GFR results of CKD and healthy cats was selected, resulting in low GFR cut-off values of 1.2 ml/min/kg for exo-iohexol and 1.4 ml/min/kg for creatinine and endo-iohexol clearances.

Relationship between glomerular filtration rate (GFR) and serum creatinine concentration (sCreat) measured by a modified Jaffe assay for (a) exo-iohexol, (b) creatinine and (c) endo-iohexol clearances for the complete study population (n = 73). Each cat represents a dot on the figure. The cats with chronic kidney disease are presented with a red dot and the cats of the other groups with a blue dot. The diamond-shaped dots represent cats for which sCreat was measured with a modified Jaffe assay (n = 68). For cats for which sCreat measured with this modified Jaffe assay was not recorded (n = 5), the baseline creatinine concentration of the clearance test, measured with an enzymatic assay, was used. These cats are presented as circles. The GFR cut-off values that were selected based on these GFR vs sCreat curves (borderline GFR cut-off; dotted line) and based on the literature (low GFR cut-off; dashed line) are also shown
Using these selected borderline and lower GFR cut-off values, sensitivities, specificities, and positive (PPV) and negative (NPV) predictive values were calculated for various creatinine, exo-iohexol and endo-iohexol concentrations 60 (t60), 120 (t120) and 180 (t180) mins after marker injection. The sensitivities and specificities were used to draw ROC curves for each clearance marker at these three time points for both the borderline and low GFR cut-off value. For PPV and NPV calculation, 23 the pre-test probability that the animal is diseased was set between 40% and 60% because a veterinarian will only evaluate kidney function more thoroughly in cats for which routine blood and urine variables give doubtful results. Clinically useful cut-off creatinine, exo-iohexol and endo-iohexol concentrations at t60, t120 and t180 were identified based on their sensitivities, specificities, PPVs and NPVs.
Results
Study population
Seventy-three cats were included: 16 healthy cats, 20 with CKD (13 with CKD only, six with CKD after treatment for hyperthyroidism, one with CKD and DM), 19 with DM, 16 untreated hyperthyroid cats and two with doubtful renal status. None of the cats had combined DM and hyperthyroidism. According to the International Renal Interest Society (IRIS) staging system, 22 10 cats with CKD were in IRIS stage 2 and 10 were in IRIS stage 3. The study population involved 63 domestic short- or longhair cats and nine purebred cats (three Siamese, three British Shorthairs, one Burmese, one Persian, one Oriental); 34 cats were female (one intact, 33 neutered) and 38 were male (three intact, 35 neutered). For one cat, breed, sex and age were not recorded. The mean ± SD age was 10.4 ± 4.6 years (range 1–20 years) and mean ± SD bodyweight was 4.6 ± 1.2 kg (range 2.3–7.8 kg). The mean ± SD SBP was 137 ± 24 mmHg (range 91–210 mmHg; n = 59), mean ± SD sUrea was 11.0 ± 4.7 mmol/l (range 5.3–28.3 mmol/l; n = 68), mean ± SD sCreat was 135.1 ± 70.9 µmol/l (range 40.7–382.8 µmol/l; n = 68), mean ± SD TT4 was 51.7 ± 60.6 nmol/l (range <6.5–200.0 nmol/l; n = 58), mean ± SD USG was 1.034 ± 0.015 (range 1.008–1.060; n = 68) and mean ± SD UPC was 0.34 ± 0.30 (range 0.06–1.29; n = 69). For the five cats for which sCreat (modified Jaffe assay) was not recorded, the baseline creatinine concentration of the PEC–ICT was used to assess renal status. These cats were excluded from the general linear model to predict GFR and from the logistic regression analysis to identify cats with decreased GFR.
Clearance
The GFR values for the complete population, healthy cats, hyperthyroid cats, cats with CKD, cats with DM and cats with doubtful renal status are presented in Table 1. Within the CKD group, the mean ± SD exo-iohexol clearance was 1 ± 0.2 ml/min/kg for IRIS stage 2 cats and 0.7 ± 0.2 ml/min/kg for IRIS stage 3 cats. The mean ± SD (range) extrapolated area of the AUC was 5.7 ± 5.5% (0.2–20.7%) for exo-iohexol, 6.3 ± 4.9% (0.6–19.0%) for endo-iohexol and 14.9 ± 14.9% (0.2–61.4%) for creatinine clearance. This extrapolated area exceeded 20% for exo-iohexol clearance in two cats with CKD and for creatinine clearance in 16 cats with CKD, two diabetic cats, one healthy old cat and one of the cats with unknown renal status. The GFR vs sCreat relationship for the three clearance markers is shown in Figure 1. The relationships between GFR vs sUrea, USG, UPC and SBP for exo-iohexol clearance are presented in Figure 2. For creatinine and endo-iohexol clearances, comparable relationships were found (data not shown).
Overview of glomerular filtration rates (GFRs) for the complete study population and the subgroups. GFRs (ml/min/kg) for creatinine, exo-iohexol and endo-iohexol clearance for the complete population (n = 73) and subgroups of healthy cats (n = 16), untreated hyperthyroid cats (n = 16), cats with chronic kidney disease (CKD; n = 20), cats with diabetes mellitus (DM; n = 19) and cats with doubtful renal status based on routine blood and urine parameters (n = 2)

Results are presented as mean ± SD (range), except for the cats with doubtful renal status where the actual GFR values are shown

Relationship between glomerular filtration rate (GFR) and other routine parameters. The relationship between GFR and (a) serum urea concentration (sUrea), (b) urine specific gravity (USG), (c) urinary protein:creatinine ratio (UPC) and (d) systolic blood pressure (SBP) for exo-iohexol clearance for the complete study population (n = 73). Each cat represents a blue diamond-shaped dot on the graphs. Cats for which sUrea (n = 5), USG (n = 5), UPC (n = 4) or SBP (n = 14) was not available are not shown on these graphs
Simplified methods for estimating GFR
The absolute value of maximum relative errors on the GFR calculation for all limited sampling time combinations compared with the GFR based on the complete nine-sample data set is shown in Figure 3. The best sampling time combinations and maximum relative errors for LSS with one to eight blood samples for all three clearance markers are presented in Table 2.

Maximum errors for limited sampling strategies (LSSs). Absolute value of maximum errors (%) on the calculation of plasma exo-iohexol clearance with a LSS compared with the clearances calculated based on the complete set of nine blood samples. Each blue circle on the plot represents the maximum relative error for a given number of blood samples. Similar curves could be drawn for LSS of creatinine and endo-iohexol clearances (data not shown)
Best sampling time combinations and maximum relative errors for limited sampling strategies (LSSs) with one to eight blood samples for three clearance markers (creatinine, exo-iohexol, endo-iohexol) compared with the entire nine blood sampling times set of the plasma exogenous creatinine–iohexol clearance test of 73 cats
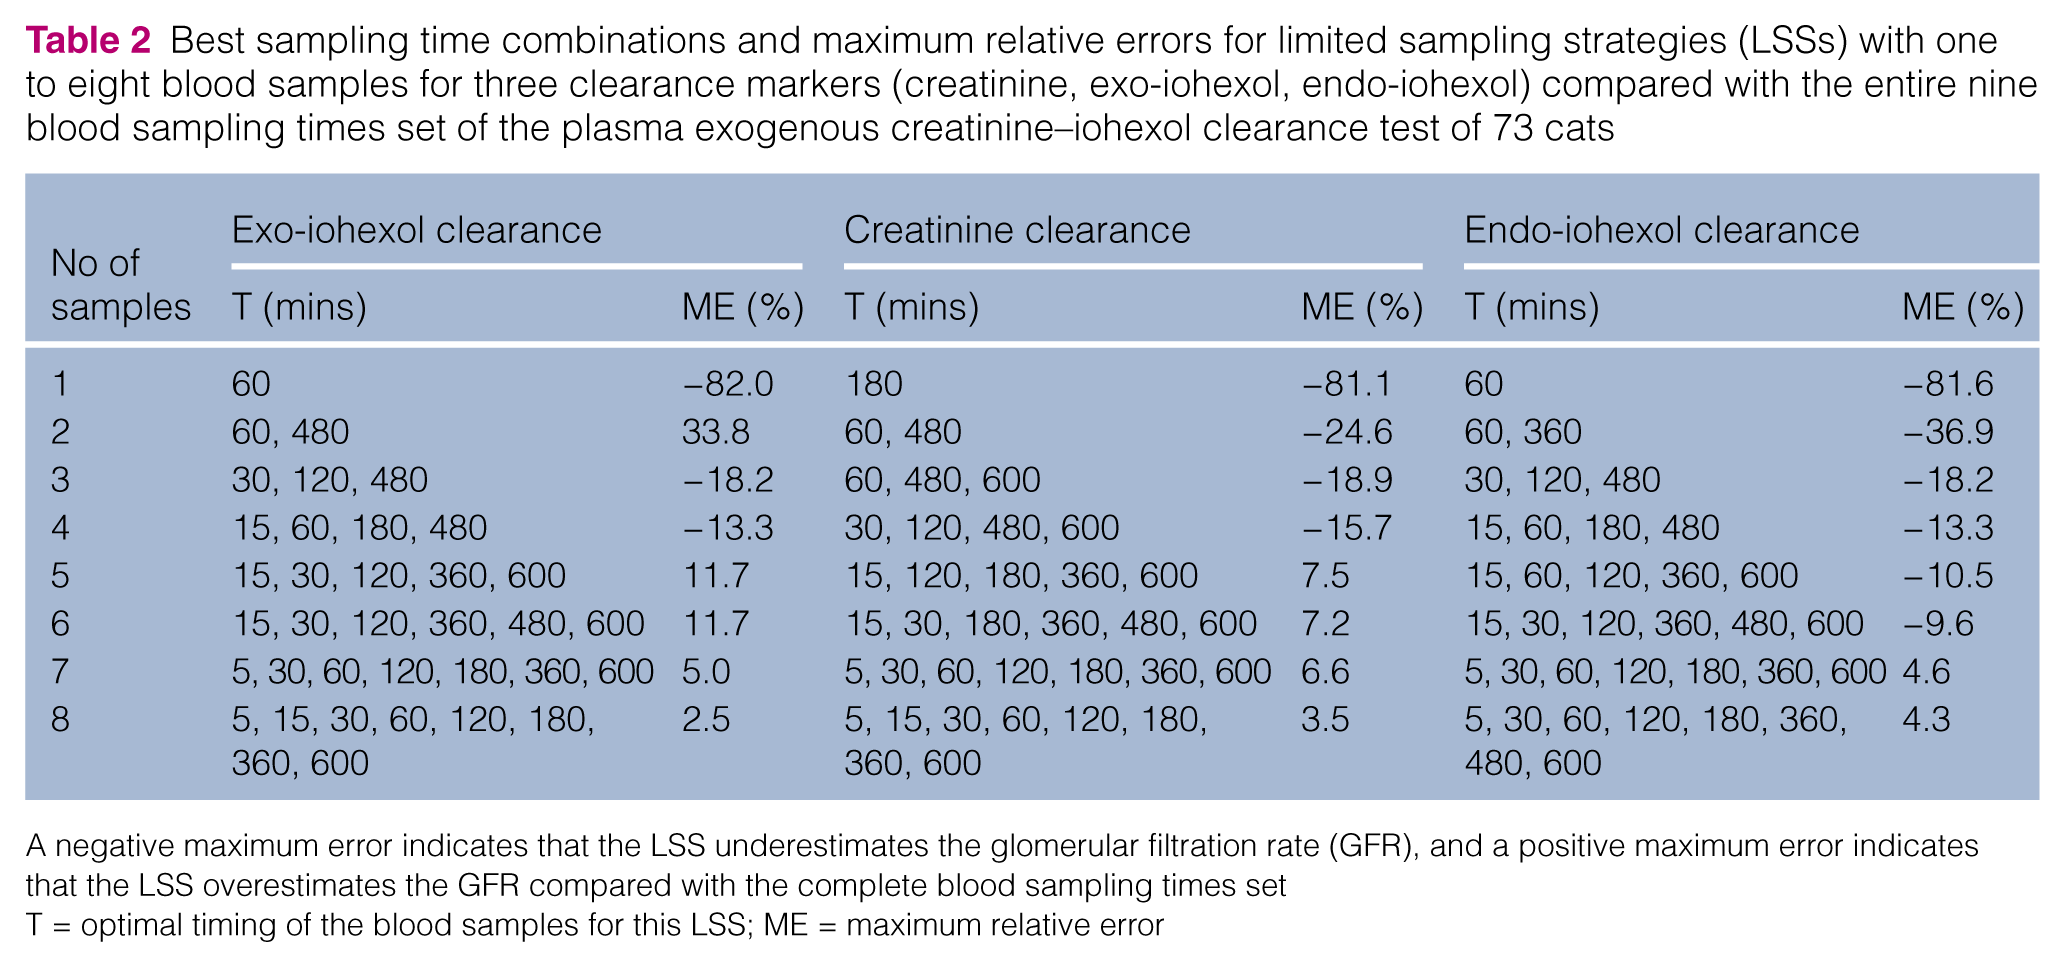
A negative maximum error indicates that the LSS underestimates the glomerular filtration rate (GFR), and a positive maximum error indicates that the LSS overestimates the GFR compared with the complete blood sampling times set
T = optimal timing of the blood samples for this LSS; ME = maximum relative error
The best regression formulae to predict GFR values based on routine variables (SBP, sUrea, sCreat, USG, UPC) and associated R2 values are shown in Table 3.
Best regression models to predict the glomerular filtration rate (GFR) based on the routine parameters systolic blood pressure, serum creatinine concentration (sCreat), serum urea concentration (sUrea ), urine specific gravity and urinary protein:creatinine ratio (UPC). The associated R2 values to judge the goodness of fit of the models are also shown

Simplified methods to identify cats with borderline or low GFR
Method 1
For prediction of borderline or low GFR based on routine variables (sUrea, sCreat, USG, UPC), the regression formulae, the GFR range for which binary logit regression analysis was evaluated, the most appropriate cut-off values and associated sensitivities, specificities and area under ROC curve are shown in Table 4. Adding SBP to these routine variables gave very similar results (data not shown).
Regression formulae for prediction of low glomerular filtration rate (GFR; ml/min/kg) for three clearance markers (creatinine, exo-iohexol, endo-iohexol) based on routine blood (serum urea concentration in mmol/l [sUrea]; serum creatinine concentration in µmol/l [sCreat]) and urine (urine specific gravity [USG]; urinary protein:creatinine ratio [UPC]) parameters in a population of cats (n = 67), for which all these parameters were available. The GFR range for which the logistic regression was performed and two clinically useful GFR cut-off values (low and borderline GFR cut-off) are presented. If eu/1+eu <0.5, the cat has a high probability of having a GFR below the given cut-off (in this formula e relates to the mathematical constant e and u relates to the u of the regression formula). The associated sensitivities (Sens; %), specificities (Spec; %) and area under receiver operating characteristic (ROC) curves (%) are also shown

Method 2
The sensitivities, specificities, PPV and NPV for clinically useful cut-off creatinine, exo-iohexol and endo-iohexol concentrations at t60, t120 and t180 after marker injection to predict borderline or low GFR are presented in Tables 5 and 6. The ROC curves to identify cats with borderline or low GFR for the evaluated exo-iohexol, creatinine and endo-iohexol concentrations at t60, t120 and t180 are shown in Figure 4. The creatinine concentration for one cat at t60, and exo-iohexol and endo-iohexol concentrations for two cats at t180 were not available because of insufficient sample. Thus, the calculations of cut-off concentrations were based on the data set of 73 cats, except for t60 for creatinine clearance (n = 72), and for t180 for exo-iohexol and endo-iohexol clearances (n = 71).
Cut-off marker concentrations to predict low glomerular filtration rate (GFR). Sensitivities (Sens), specificities (Spec), positive (PPVs) and negative predictive values (NPVs) to identify cats with GFR above a certain threshold if marker concentrations are similar to or exceed the presented cut-off creatinine (Creat), exo-iohexol (Exo) and endo-iohexol (Endo) concentrations 60, 120 and 180 mins after marker injection. For the predictive values, the pre-test probability was set at 40–60% and the mean PPV and NPV for this range of pre-test probabilities is shown. A low GFR cut-off value is used as the GFR threshold and set at 1.2 ml/min/kg for exo-iohexol and at 1.4 ml/min/kg for creatinine and endo-iohexol clearances

t60 = blood sample 60 mins after clearance marker injection; t120 = blood sample 120 mins after clearance marker injection; t180 = blood sample 180 mins after clearance marker injection
Cut-off marker concentrations to predict borderline glomerular filtration rate (GFR). Sensitivities (Sens), specificities (Spec), positive (PPVs) and negative predictive values (NPVs) to identify cats with GFRs above a certain threshold if marker concentrations are similar to or exceed the presented cut-off creatinine (Creat), exo-iohexol (Exo) and endo-iohexol (Endo) concentrations 60, 120 and 180 mins after marker injection. For the predictive values, the pre-test probability was set at 40–60% and the mean PPV and NPV for this range of pre-test probabilities is shown. A borderline GFR cut-off value is used as the GFR threshold and set at 1.7 ml/min/kg for exo-iohexol and at 1.9 ml/min/kg for creatinine and endo-iohexol clearances.

t60 = blood sample 60 mins after clearance marker injection; t120 = blood sample 120 mins after clearance marker injection; t180 = blood sample 180 mins after clearance marker injection

The receiver operating characteristic (ROC) curves identify cats with GFR below borderline GFR cut-off values for the evaluated concentrations of exo-iohexol (Exo), creatinine (Creat) and endo-iohexol (Endo) at 60 (T60), 120 (T120) and 180 (T180) mins after creatinine and iohexol injection. The borderline GFR cut-off values were defined as 1.7 ml/min/kg for exo-iohexol and 1.9 ml/min/kg for creatinine and endo-iohexol clearance. For all graphs, specificity (%) is shown at the x-axis and sensitivity (%) at the y-axis. Similar ROC curves could be drawn to identify cats with GFR below low GFR cut-off values, namely 1.2 ml/min/kg for exo-iohexol and 1.4 ml/min/kg for creatinine and endo-iohexol clearance (data not shown)
Discussion
One of the major goals of this study was to develop a LSS to estimate GFR with an acceptable margin of error. The present study has important advantages compared with other studies that have described feline LSSs. Firstly, cats with a wide range of GFR were involved, namely cats with glomerular hyperfiltration (hyperthyroid cats), normal GFR (healthy cats, most diabetic cats) and glomerular hypofiltration (CKD cats). Therefore, our study population is representative of the range of GFR values that can be encountered in practice. In other reports concerning simplified methods for GFR estimation, no or only few renal-impaired or hyperfiltrating cats were included.5,7–11,13,14,16 Secondly, all possible time combinations were evaluated. This contrasts with other studies evaluating LSSs with blood sampling on arbitrarily selected time points, often without judging if the selected time points were the most appropriate ones for the GFR method used.11,12,14,16 However, our data clearly showed that, for a fixed number of samples, the maximum relative error can seriously differ based on the timing of blood sampling (Figure 3). Thirdly, LSSs were compared with a GFR estimate that was calculated using a non-compartmental approach and based on multiple blood samples over a 10 h period, both in the distribution and elimination phases of the clearance marker. In several previous studies evaluating single or two-sample approaches, the reference GFR estimate was based on a maximum of five blood samples collected over a relatively short time period (4–5 h) and/or calculated using a one- or two-compartmental model.5,11,12,14,16 Non-compartmental analysis is assumption free, unlike compartmental analysis. Both pharmacokinetic approaches are scarcely compared in cats, but it is known that a one-compartmental model overestimates true feline GFR. 13 This means that in some of these studies, single- or two-sample approaches to estimate GFR have been compared with another GFR estimate that was prone to errors. To correct for these errors, correction formulae have been used.11,12,14 However, these formulae were based on human medicine or on dogs, and their use in cats has not been properly evaluated. Recently, a feline correction formula was reported to predict accurately multisample clearance in cats and with smaller errors than human- or dog-based formulae. Unfortunately, only healthy cats were enrolled in that study. 13 Finally, LSSs were developed for several clearance markers, which has previously only been reported in one study and only in healthy cats. 11
Our findings indicate that, based on a non-compartmental approach, GFR cannot be reliably estimated based on a single sample for all three markers. At least three or four blood samples after injection of the clearance marker are needed to estimate GFR with an acceptable margin of error (error <20%). For research purposes smaller margins of error are required, preferably ⩽10%, and five or more samples after marker injection are needed to maintain the error in the GFR estimate ⩽10% in most cats. Our results also indicate that the optimal timing for blood sampling for LSS depends on the marker that is used for the clearance test. Also, a blood sample 10 h after marker injection is almost always part of the optimal sampling time combination. This implies that, by performing LSS, the number of blood samples can be reduced but not the time needed to perform the clearance test. The same has been found in dogs, 21 and this may be explained because the timing of the last sample determines the percentage of AUC extrapolated. The larger this proportion, the more inaccurate the GFR estimate, and the extrapolated area should never exceed 20% of the total area. 21 In the present study, this criterion was met for almost all cats for exo- and endo-iohexol clearances, but not for creatinine clearance, particularly not in CKD cats. Prolonged sampling, between 10 and 24 h after creatinine injection, may be required in cats with renal dysfunction for more accurate GFR estimation based on creatinine clearance, as has been reported for dogs with surgically induced renal impairment. 21
Besides LSS, we evaluated the ability of routine blood and urine variables SBP, sCreat, sUrea, USG and UPC to predict the GFR value. However, logistic regression analysis indicated that these variables did not predict GFR values accurately. A possible explanation is the lack of strong relationships between GFR and these routine variables (Figures 1 and 2). We found an inverse curvilinear relationship between GFR and sCreat and sUrea for each clearance marker, with a stronger relationship for sCreat compared with sUrea. This is in agreement with the literature in dogs and cats.24,25 The GFR vs sCreat curves for our population indicated that for a sCreat concentration up to >200 µmol/l and a minimal change in sCreat concentration can be associated with a serious change in GFR. For concentrations of sCreat >200 µmol/l, further decline of GFR results in concurrent increase of sCreat concentration. In this study, mildly positive correlations between GFR and USG were found. However, several cats with normal-to-high GFR values had poorly concentrated urine (USG <1.035), which confirms that cats with normal renal function can have wide variations in USG. 24 Also in previous studies, several healthy cats had USG <1.035.26,27 Conversely, some cats with decreased GFR had concentrated urine (USG ⩾1.035). This is in line with the finding that some cats with severe experimental loss of renal functional mass retained their concentrating ability. 28 Our data also indicated a mildly positive relationship between UPC and GFR. This was unexpected because we suspected more severe proteinuria with decreasing kidney function, as reported in humans and in dogs.29–31 However, an increased UPC could also result from increased filtration pressure associated with higher GFR values. Finally, no relationship between SBP and GFR was found. Also, a previous study did not find an association between the severity of azotaemia and the presence of hypertension. 32
Because, in daily practice, it is more important to detect cats with early renal dysfunction than to know the exact GFR value, we also proposed two new methods to identify cats with low or borderline GFR. First, with the regression formulae that we developed for each clearance marker (method 1), veterinarians can determine if a cat has a high likelihood of having a GFR below the proposed cut-off values based on routine variables (sUrea, sCreat, USG, UPC). These regression formulae could predict, with very good sensitivity and moderate-to-good specificity, if a cat had a GFR value below the proposed GFR cut-offs. Adding SBP to these variables did not have a major impact on these sensitivities and specificities, probably because there was no clear relationship between SBP and GFR. Also, because of more missing data for SBP than for the other variables, adding SBP to these variables reduced the number of cats available for the logistic regression analysis.
The second simplified method (method 2) to identify cats with borderline or low GFR requires clearance marker injection, one blood sample 60, 120 or 180 mins after marker injection, and determination of the clearance marker concentration in that blood sample. Important advantages are that multiple sample analysis and mathematics for GFR calculation are not needed, which makes this method both simple and cost-effective. Based on the ROC curves, time points t120 and t180 seem to be more appropriate than t60 for all three clearance markers. Depending on the clearance marker concentration, sensitivities, specificities, PPVs and NPVs vary. For each time point and for each clearance marker, three cut-off marker concentrations are given, which allows the veterinarian to choose a cut-off marker concentration depending if he/she wants to predict borderline or low GFR with high sensitivity, high specificity or both. The higher the cut-off marker concentration at a certain time point, the more likely a cat with a value above this threshold has low to borderline GFR (higher specificity and PPV) because higher marker concentrations are associated with slower clearance rates. It is important to remember that predictive values change with disease prevalence or pre-test probability. For example, for disease prevalence <40%, PPV will decrease and NPV will improve compared with the reported values in this study. 33
For both new simplified methods, we presented both low and borderline GFR cut-off values so that veterinarians can choose which cut-off GFR value they will use, depending on the case. The low GFR cut-offs (method 1: 1.2 ml/min/kg for creatinine clearance, 1.1 ml/min/kg for exo-iohexol and endo-iohexol clearance; method 2: 1.2 ml/min/kg for exo-iohexol clearance, 1.4 ml/min/kg for creatinine and endo-iohexol clearance) indicate renal dysfunction. Initiating treatment for renal disease may be indicated in these cats. The majority (n = 17) of the 20 cats with CKD included in this study had an exo-iohexol GFR <1.1 ml/min/kg. The three others – all cats with IRIS stage 2 CKD – had an exo-iohexol GFR between 1.1 and 1.4 ml/min/kg. The borderline GFR cut-offs (method 1: 1.7 ml/min/kg for creatinine clearance, 1.5 ml/min/kg for exo-iohexol and endo-iohexol clearance; method 2: 1.7 ml/min/kg for exo-iohexol clearance, 1.9 ml/min/kg for creatinine and endo-iohexol clearance) indicate reduced-to-low normal renal function. Several of these cats will have routine blood and urine variables within reference intervals. Thus, both methods may be used as additional tests to improve the detection of cats with early kidney dysfunction. If these simplified methods suggest that a cat has a high likelihood of having GFR below this borderline cut-off value, closer monitoring of routine blood and urine variables or additional tests to estimate GFR are warranted. Further studies should explore whether treatment of CKD at this stage has any beneficial effect. The reason that the cut-off GFR concentrations differ for both methods to identify cats with borderline or low GFR is that these cut-offs were defined prior to statistical analysis for method 2, but not for method 1.
Possible strategies to identify renal dysfunction in cats with doubtful routine blood and urine variables are shown in Figure 5. A cost-effective approach is to combine the second simplified method to identify borderline or low GFR with GFR estimation based on LSS. The veterinarian can perform a three- or four-sample clearance test on the time points presented in Table 2 and initially analyse creatinine, exo-iohexol or endo-iohexol concentration only in one sample (t120 for three-sample exo-iohexol and endo-iohexol clearance, and for four-sample creatinine clearance; t180 for four-sample exo-iohexol and endo-iohexol clearance). If the marker concentration suggests that this cat likely has a GFR below the cut-off value, clearance marker concentrations should be determined in the other two or three samples, and the GFR calculated. Currently, routine use of these methods is hampered because iohexol assays are expensive and not widely available, and because injectable creatinine is not available for practitioners. As creatinine assays are inexpensive and easily accessible, a medical-grade formulation of creatinine should be commercialised for use in clearance tests.

Tentative diagnosis algorithm to screen for renal dysfunction in cats that need further assessment of kidney function. This scheme is designed for creatinine clearance. For exo-iohexol and endo-iohexol clearances, the cut-offs for the glomerular filtration rate (GFR) and time points for sampling for limited sampling strategies need to be adjusted. CKD = chronic kidney disease; IRIS = International Renal Interest Society; USG = urinary specific gravity; LSS = limited sampling strategy; RP = routine parameters (namely serum creatinine concentration, serum urea concentration, USG and urine protein:creatinine ratio); T = time point of blood sampling after clearance marker injection (mins)
A study limitation is that the cut-offs were developed and evaluated in the same cat population, which may result in overestimation of the ability to predict correctly new observations. 34 An important further step is to evaluate the accuracy of these cut-offs in a different cat population.
Conclusions
In this cat population, which is representative of the range in GFR that can be encountered in practice, we developed simplified methods to estimate GFR or to identify cats with decreased GFR. These simplified methods will facilitate the detection of cats with early kidney dysfunction, allowing for timely treatment and improved prognosis of cats with CKD. The simplified methods to identify low or borderline GFR are a new and practical approach to identify kidney dysfunction. The methodology used might be valuable in detecting early CKD in humans, particularly in patients in which equations to estimate GFR are less reliable and determination of GFR has practical limitations (eg, paediatric patients).35–37
Footnotes
Acknowledgements
Partially presented at the 28th American College of Veterinary Internal Medicine (ACVIM) Forum in Anaheim, CA, USA in June 2010, and published as an abstract in the 28th ACVIM Scientific Proceedings Research Abstracts, pp 20–21. Also published as an abstract in Journal of Veterinary Internal Medicine 2010; 24: 679–680. Partially presented as a research report at the 31st ACVIM Forum in Seattle, WA, USA and published in the 31st ACVIM Scientific Proceedings, p 506.
Conflict of interest
The authors do not have any potential conflicts of interest to declare.
Funding
This research received no grant from any funding agency in the public, commercial or not-for-profit sectors.