
Abstract
Physical orthopaedic examination in cats does not always reveal signs of lameness and no objective gait analysis method has yet been standardised for use in cats. The aims of the present study were to define appropriate parameters for pressure mat analyses during walk and jump, and to define reference values for gait parameters of healthy cats. Further, the distribution of the vertical force within the paws and the influence of a non-centred head position were investigated. The hypothesis was that cats have a symmetrical gait, a front/hindlimb asymmetry similar to dogs, and that peak vertical force (PVF) and vertical impulse (VI) have high intraclass correlation coefficients, confirming the reliability of these parameters. Data for walking (n = 46) showed gait symmetry indices of close to 1.0, besides PVF front/hind (1.3 ± 0.2). The PVF front/hind for jumping cats (n = 16) was 1.7 ± 0.6. Results from the distribution of the vertical force within the paw (n = 39) showed that the main weight during a strike is transferred from the caudal towards the craniomedial part of the paw. The findings support the hypothesis that healthy cats have similar gait symmetry to healthy dogs and that PVF and VI are reliable gait parameters. In conclusion, the present study provides a reference interval for healthy cats. Further studies are needed to investigate gait parameters in cats with orthopaedic disease.
Introduction
The life expectancy of cats has increased over the last few decades and many cats reach an advanced age where they can be defined as geriatric. 1 The change in feline demographics influences the disease panorama that the clinician faces. There are several recent publications showing that osteoarthritis is common, but underdiagnosed, in older cats.2–7 Cats in pain due to osteoarthritis present a challenge to clinically practising veterinarians. Most cats with chronic pain due to osteoarthritis do not show signs of visually overt lameness that can be detected during physical orthopaedic examination,2–5,7 and no objective gait analysis method has yet been standardised for use in cats. Several authors have reported a mismatch between radiographic findings and clinical signs of osteoarthritis in cats.2,8 Thus, there is a great need for validated and reliable methods for objective gait analyses in this species.
Gait analysis using force plates has been performed in both healthy dogs and dogs with orthopaedic conditions;9–25 however, it has less frequently been used in cats.26–30 A pressure-sensitive walkway provides additional information to a force plate, as it provides information during several step cycles. 31 Several authors have performed gait analysis with healthy dogs on pressure mats in order to validate the technique, establish what parameters are reliable for objective gait analysis and create reference values.32–36 A few studies have been performed using the pressure mat in cats.37–45 The majority of these have been done on cats with orthopaedic disorders, and only two studies have looked at clinically normal or healthy cats.39,43
In order to be used as a diagnostic tool, it is necessary to ensure that the data received from the cats are reproducible and reliable. The aims of the present study were to (1) establish an intraclass correlation coefficient (ICC) for gait analysis parameters; 46 (2) establish a reference material for walking (including distribution of the vertical force within the paws) and jumping; and (3) to investigate the influence of non-centred head position during walk, by use of a pressure mat system in a group of healthy cats. The hypothesis was that healthy cats have a symmetrical gait, a front/hindlimb asymmetry similar to healthy dogs and that the gait parameters peak vertical force (PVF) and vertical impulse (VI) have high ICCs.
Materials and methods
Animals
Fifty-eight clinically sound client-owned pet cats were enrolled. The cats were judged clinically sound based on a complete physical and orthopaedic examination, lameness examination, medical history and the owners’ completion of quality of life questionnaires. The examinations were performed by the same veterinarian, who also scored the cats’ body conditions. Prior to inclusion, each cat owner signed an informed client consent form. The experimental procedure was approved by the local ethical review board on animal experiments. Of the 58 cats, 74% were domestic shorthairs and 26% were purebred. The purebred cats consisted of six Somalis, three Burmas, two Sacred Birmas, two Ragdolls and two Norwegian Forest Cats. Thirty-one of the cats were male and 27 were female. Seven of the participating cats were intact and the rest were either neutered or spayed. Data are presented as a mean ± SD. The cats had a mean body condition score (BCS) of 3.4 ± 0.6 on a five-point scale, 47 and had a mean body weight (BW) of 4.5 ± 1.2 kg. The cats had a mean age of 5.0 ± 2.7 years.
Technical equipment
The kinetic data were collected with a pressure-sensitive walkway (Walkway High Resolution HRV4; Tekscan Inc). The portable mat measured 1.95 × 0.45 m and consisted of a low-profile floor mat (0.57 cm). The walkway was connected to a laptop computer (Siemens Fujitsu Lifebook; Hewlett Packard Elite Book) and the received data analysed using specific software (Walkway Research BETA; Tekscan Inc) provided by the manufacturer. The mat was placed in the middle of and beside a 6.0 m long wall. The other long side of the mat was limited by two transparent plexiglas screens, each 1.0 m long. The walkway was covered with a 1.0 mm thick plastic mat to avoid the slick surface, extending 0.3 m on either side of the end/starting points for the sensors. The actual endpoints of the walkway were demarcated with white tape (Figure 1). The cat was filmed from the cranial, caudal and lateral aspect. Prior to commencing data acquisition the walkway sensors were equilibrated and calibrated. The data acquisition parameter was set to a frequency of 60 Hz.

Experimental set-up with cat walking on pressure mat
Experimental design
The study was performed in a quiet room, with only the authors and the cat owner(s) present. The cat was weighed on an electronic scale and allowed to acclimatise itself with the surroundings for 5–10 mins before walking on the mat. The cat was encouraged to walk and jump by being called, using toys or treats or by using the transport carrier placed at the end of the mat. The cat walked until two valid trials were attained within 30 mins. A trial was considered valid when the cat walked straight ahead, at an even pace, with the head centred straight forward. Every trial consisted of two consecutive step cycles, where each cat was allowed to walk at its preferred velocity. The jump registrations were collected by placing the cat on a 1.0 m high examination table. It was considered a valid jump when the cat landed on the mat and then continued walking straight forward. The maximum number of jumps performed was five.
Data analysis
The data were evaluated for normal distribution using normal probability plots for the residuals. The analyses (using freely available statistical software) 48 were based on mixed linear models with random effects for every cat. ICCs were used to investigate the accuracy of gait parameters. ANOVA was used to compare intercat variability and the level of significance was set at P <0.05. The correlation between the parameters sex, age, weight and BCS was analysed using ICCs. When analysing the distribution of the vertical forces within a paw, measurements of PVF (%BW) and VI (%BW*sec) were obtained by dividing the pawprint into four equally sized areas: craniolateral, craniomedial, caudolateral and caudomedial (Figure 2). To define the influence of a non-centred head position as a source of error during walk, an analysis of excluded recordings was performed. A non-centred head position was defined as both eyes being visible from the lateral video recordings.
Distribution of the vertical force during one strike, right front paw. The pawprint was divided into four equally sized areas for analysis
Results
Gait analyses
Fifty-eight cats were recruited between January 2011 and March 2013. Forty-six of the 58 cats contributed data. Twelve cats were excluded owing to the following reasons: one of the cats was a statistical outlier, one cat’s video film was lost and 10 cats would not walk at a sufficiently slow pace. Variables from the pressure mat were obtained from two passes for each cat walking at a mean velocity of 0.68 ± 0.17 m/s (range 0.43–1.42 m/s). On average, the analysis was performed on a mean of 11.2 ± 2.1 strikes (range 8.0–16.0 strikes) per cat. The left/right symmetry and the front/hind asymmetry are shown in Table 1.
Symmetry indices between front and hind paws, and left and right paws for 46 cats during walk

ICC was used as a measure of the accuracy of the gait parameters. As there was no difference between data from right front and left front limb, and right hind and left hindlimb, the results are presented as a mean for front limbs and hindlimbs, respectively (Figure 3). Looking at the effect of sex, age, BW and BCS on the gait parameters, there was only a significant correlation between increased BW and longer stride length (ICC 0.597; P <0.01).

Intraclass correlation coefficients (ICCs) for the front and hindlimbs. An ICC of 0–0.2 indicates poor agreement; 0.3–0.4 indicates fair agreement; 0.5–0.6 indicates moderate agreement; 0.7–0.8 indicates strong agreement; and >0.8 indicates almost perfect agreement. Bars indicate the SEM (P <0.01 for all bars)
Distribution of the vertical forces in the paws
Thirty-nine of the 46 cats contributed valid data. In seven cats it was not possible to separate overlapping pawprints. For every cat, one step cycle from two different registrations was analysed. During a strike the main weight was transferred from the caudal part of the paw towards the craniomedial part (Figure 4a,b).

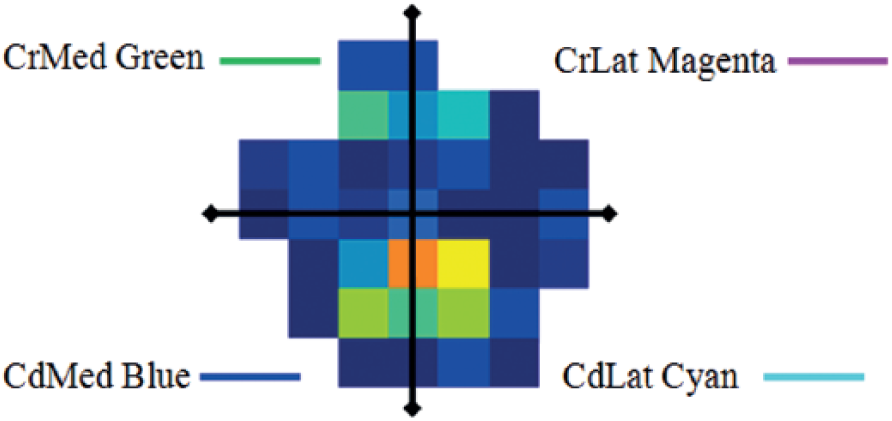
(a) Vertical force (% body weight [BW]) vs time (sec) in each of the four quadrants of the front paws. (b) Vertical force (% BW) vs time (sec) in each of the four quadrants of the hind paws. Dotted lines indicate SD. CrLat = craniolateral (magenta); CrMed = craniomedial (green); CdLat = caudolateral (cyan); CdMed = caudomedial (blue)
Jump analysis
Of the 28 cats that jumped from a height of 1.0 m, 16 contributed data. The cats that were excluded did not continue walking straight ahead after landing. Sixteen cats produced 55 valid jumps. Looking exclusively at the front paws, the cats landed with both the front paws simultaneously in 89% of jumps. Three outliers were removed and the remaining cats (n = 13) had a symmetry index for the PVF left/right paw of 1.38 ± 1.98. Looking at all four paws, the cats landed with the front paws simultaneously and the hind paws simultaneously in 65% of jumps (n = 16). The time difference between the front and the hind paws hitting the ground was 0.12 ± 0.02 s. The symmetry index for the PVF front/hind paws was 1.68 ± 0.57, and the symmetry index for the PVF for the left/right paws was 1.04 ± 0.30 (n = 13).
Source of error: ‘non-centred head position during walk’
The results are based on 12 trials from 10 cats. There was no difference in the results whether the cat walked with the head positioned to the right or to the left; therefore, the results from right front and left front limb, and right hind and left hindlimb, are presented as a mean for front limbs and hindlimbs, respectively. The PVF (% BW) of the front limb to which side the head was positioned increased by a factor of 1.73 ± 0.53 (P <0.001).
Discussion
The present study has established a reference material for gait parameters in clinically sound cats using a pressure mat system, which will be essential in the future diagnostics of diseases affecting the musculoskeletal system and in the evaluation of therapeutic interventions.
The results show that the most reliable gait parameters were PVF (% BW) and VI (% BW*sec), which is in accordance with previous results from studies on clinically normal or clinically healthy dogs and cats.32,34,35,39 Orthopaedic disease is known to redistribute the BW supported by the limbs in dogs and cats,16,22,38,40,49,50 but is generally hard to detect visually.23,51 Further, the results support the hypothesis that cats have a symmetrical gait and a front/hindlimb asymmetry similar to the one in dogs. 35 The results of a correlation between BW and stride length can explain a previously shown correlation between stride length and body size. 43
To the best of our knowledge, there are no studies on weight distribution within the paws of cats. Orthopaedic conditions in the elbows of dogs have been shown to alter the pressure within the paws.16,52 In diseases like feline osteoarthritis, with a high incidence of bilateral manifestations, it is essential to further distinguish the distribution of PVF (% BW) and VI (% BW*sec) within the paws. Thus, the results of the present study enable an improved ability to optimise diagnostics and to monitor the effect of different therapeutic interventions.
The results from the cats that jumped showed that the majority of the cats landed with both front paws horizontally and at the same time, and that they landed with the hind paws symmetrically in relation to the front paws. The time between the front and hind paws hitting the ground could be an additional indicator in the diagnosis of cats with painful orthopaedic conditions. As these data are retrieved from 16 cats, the results need to be verified by further studies.
In order to interpret accurately the pressure mat recordings, it is important to establish sources of error. With regard to cats walking with a non-centred head position, the present study showed a significant increase in the PVF (% BW) of the front limb to which side the head was positioned. This has been shown in dogs standing on scales, 53 and it is likely that it also occurs in other species during motion. Defining the inclusion criteria ‘clinically sound’ for the participating cats could be another source of error. Despite thorough physical examination and detailed quality of life questionnaires, it is still possible that cats with subclinical or undiagnosed osteoarthritis were not detected. It has been shown that the sensitivity of orthopaedic clinical examination to detect osteoarthritis in cats can be fairly low. 8 Radiography is an important tool in diagnosing feline osteoarthritis, but radiographically normal joints can still have pathological changes. 2 The pressure mat seems to be a promising objective tool that can facilitate diagnosing osteoarthritis in cats.
To reduce the degree of study limitations, the whole experiment was videotaped to enable detailed studies of the nature of the walk and jump. The influence of non-centred head positioning on weight distribution shows the importance of standardising the registration of the cat by videotaping.
Variation in velocity is a well-known factor that influences the results from both force plates and pressure mats as it is correlated to the vertical force.54,55 To limit this effect, the results of the present study are based on analyses of trials that had similar velocity (0.68 ± 0.17 m/s).
Within the area of objective gait analysis there is a rapid ongoing development of new techniques. Wireless systems using accelerometer–gyroscopic equipment for detecting gait abnormalities in dogs and horses will probably be of major importance in the future. The inability of cats to accept devices attached to their skin or fur probably limits this kind of equipment in this species. Therefore, the pressure mat seems to have an additional value, particularly in cats. The future work of in validating and establishing reference material for cats with musculoskeletal diseases can serve as a knowledge base for additional development of clinically simpler evaluation tools, like quality of life and chronic pain scoring systems, to be used in a clinical setting or a home environment.
Conclusions
The present study provides reference material for gait parameters in clinically sound cats. Further studies are needed to provide information regarding gait parameters in cats with orthopaedic disease.
Footnotes
Acknowledgements
We would like to thank all the cats that contributed to this study and their owners for allowing them. Thanks also to Professor Duncan Lascelles for contributing with valuable input regarding the analyses of the jumps, Dr Mikael Andersson Franko for the statistical processing of the collected data and to Professor Görel Nyman for continuous support.
Conflict of interest
The authors do not have any potential conflicts of interest to declare.
Funding
The authors received no specific grant from any funding agency in the public, commercial or non-for-profit sectors.