
Abstract
In-house analysers are commonplace in small animal practices but cannot be calibrated by the operator; therefore, any bias in the generated plasma analyte values cannot be corrected. Guidelines such as grading of renal disease and published reference intervals (RIs) in veterinary textbooks assume plasma biochemistry values generated by different analysers are equivalent. This study evaluated the degree of bias, as well as if bias was constant or proportional, for feline plasma biochemical analytes assessed by three in-house biochemistry analysers compared with a commercial laboratory analyser. Blood samples were collected on 101 occasions from 94 cats and, after centrifugation, plasma was divided into four aliquots. One aliquot was sent to the commercial laboratory and the remaining three were tested using the in-house biochemistry analysers. Results from each analyser were compared with the commercial laboratory results by difference plots and analyses, and by comparing percentages of results within provided RIs. Substantial bias was evident relative to the results of the commercial analyser for at least half of the analytes tested for each machine. In most cases, bias was proportional, meaning that the difference between the methods varied with the concentration of the analyte. The results demonstrate that values obtained from these analysers should not be directly compared and that RIs are not transferable between these analysers. Potential effects of bias on clinical decision-making may be overcome by use of appropriately generated RIs, or reference change values which, for most biochemistry analytes, are more appropriate than subject-based RIs.
Introduction
In-house veterinary biochemistry analysers are commonplace in small animal practice. While such analysers provide useful information for point-of-care decision-making, they cannot be calibrated by the end user (veterinary practice personnel). Analytical methodologies often differ between in-house and commercial laboratory analysers, and manufacturers of in-house analysers often provide reference intervals (RIs) that vary from published RIs1,2 for many analytes. The fact that there is variation of RIs between analyser types suggests there are systematic differences (or ‘bias’) between results generated by different analyser models. Bias can be classified as constant where the average difference in results from an established method remains the same, regardless of the concentration being measured, or proportional, where the average difference in results increases (or decreases) with increasing analyte concentration. Other studies have indicated that in-house analysers show bias for several analytes compared with results determined by commercial laboratory analysers when analysing feline samples.3–8 However, these studies have mostly been small (≤26 cats)3,4 or assessed less commonly used analysers.5–7 None of these studies assessed multiple analysers concurrently, nor specifically assessed or categorised bias. Bias between analysers is important because, in feline veterinary practice, many recommendations assume biochemistry results generated from different analysers are equivalent. Examples of this include the International Renal Interest Society (IRIS) renal disease grading system, 9 diagnosis of diabetes mellitus, 10 the American College of Veterinary Internal Medicine proteinuria consensus statement 11 and published RIs in textbooks.1,2 Additionally, practitioners who use a particular model of in-house analyser may be required to interpret results from another analyser (eg, when receiving results from another practice or a commercial laboratory). In this situation, anecdotally, most practitioners seem to interpret results on the basis of if they are within, above or below the provided RI.
Unlike method comparison studies, which aim to determine the amount of error that exists in the instrument being evaluated compared with that of a well-characterised instrument/method, 12 the aim of this study was to assess whether bias existed for routine feline biochemical analytes in plasma by three commonly used in-house veterinary analysers when compared with a commercial laboratory analyser, and further, if bias existed, to assess whether it was constant or proportional.
Materials and methods
Subjects and sampling
All plasma samples (n = 101) that were collected from 94 cats seen in a primary accession, feline-only veterinary practice (Paddington Cat Hospital, Sydney, Australia) over a 2 month period were included. Cats ranged in age from 16 weeks to 20 years; 49 cats were male (six entire) and 45 were female (five entire); 48 were domestic shorthairs, 14 were Burmese, six were Siamese, five were Russian Shorthairs and the remainder were other breeds (Devon Rex, Cornish Rex, Maine Coon, Persian or Himalayan). At the time of testing, cats were clinically healthy (63 samples) or clinically unwell (38 samples).
Blood was collected from each cat by single jugular venepuncture into a lithium heparin tube. Each tube was centrifuged at 4000 rpm (1790 × g) for 5 mins within 30 mins of collection, and then the plasma was immediately divided into four aliquots. One aliquot was sent by courier to a commercial laboratory (Gribbles Veterinary Laboratory, Rhodes, Sydney, Australia) and processed by a Cobas-Integra 400 biochemical analyte analyser; the remaining three were immediately tested on three in-house biochemistry analysers: Abaxis Vetscan VS-2 Point of Care Analyser, Heska Dri-Chem Veterinary Chemistry Analyser, and an IDEXX VetTest VT8008 and an IDEXX VetLyte (IDEXX has a separate instrument to measure electrolytes) for the following 13 biochemistry analytes: albumin, alkaline phosphatase (ALP), alanine amino transferase (ALT), total bilirubin, calcium, chloride (not available for Abaxis), creatinine, glucose, phosphate, potassium, sodium, total protein and urea. This resulted in a total of 38 analyte determinations across all three in-house analysers (three determinations for 12 analytes and two determinations for one analyte [chloride]). When a result was ‘out of range’, the sample was diluted with 0.9% saline and the particular analyte was re-analysed.
Laboratory methods
The methods by which each instrument determined the concentration for each analyte are summarised in Table 1.
Assay method for analyte concentrations by the Abaxis VetScan, IDEXX VetTest/VetLyte and Heska Dri-Chem analysers, and by a Cobas-Integra biochemistry analyser at a commercial laboratory

‘as for Cobas-Integra’ indicates the same method as the commercial laboratory
p-NPP = p-nitrophenylphosphate; CPC = o-cresolphthalein complexone; PNP = purine-nucleoside phosphorylase
The Cobas-Integra 400 analyser at the commercial laboratory was calibrated according to manufacturer’s recommendations. The Heska and Abaxis analysers were installed to the manufacturers’ specifications by their respective local agents. Although 10 years old and already present at the testing site, the IDEXX analysers had been serviced (by the manufacturer) 3 months prior to the assessment period.
The precision of all four analysers was assessed using commercial quality control materials (at two concentrations) approximately every second day over a 1 month period and was found to be similar for all four analysers. 13
Statistical analyses
Descriptive analyses were conducted for each analyte. The results for each analyte on each analyser were compared with the commercial laboratory results using the Bland–Altman approach. 14 Difference (limits of agreement; Bland–Altman) plots (scatterplots of differences between results from each in-house analyser and the commercial laboratory for the sample plotted against the means of the two results) were assessed. The average difference was calculated as the mean of the differences in results between each in-house analyser and the commercial laboratory.
The mean and SD of the differences in results between each in-house analyser and the commercial laboratory for each analyte were then used to calculate 95% limits of agreement (mean difference ± 1.96 × SD). The mean difference in results between each in-house analyser and the commercial laboratory for each analyte was also expressed as a percentage of the mean result for each analyte on each analyser, thus enabling comparison between analytes. The range of the 95% limits of agreement was similarly expressed as a percentage of the mean result for each analyte on each analyser.
Proportional bias was assessed by determining the correlation coefficient for the association between the differences and the mean of the two measurements and an F-test of equality of means and variances. 15 Proportional bias was considered to be present when the correlation coefficient was markedly different from zero and the P value for the F-test was low.
A system was devised to categorise the presence or absence, type and degree of bias for each analyte from each analyser (Table 2).
Categorisation system for presence, type and degree of bias. Mean difference percentage was calculated as absolute mean difference divided by mean result for the analyte on the same analyser. Note that the mean difference has no bearing on whether proportional bias is present or not

Analyses were performed with Stata (version 11; Statacorp) and R (http://www.r-project.org/).
Although some cats contributed more than one plasma sample (seven cats contributed two samples), because the mean number of samples per cat was close to 1, results from each sample were assumed to be statistically independent of results from all other samples.
Additionally, to assess whether the provided RIs account for any bias, percentages of results for each analyte that were below, within and above the RIs supplied by manufacturers of each in-house analyser (for results from their analyser), or by the laboratory (for results from its analyser), were calculated.
Results
Although 101 samples were collected, the number of samples processed by each analyser for each analyte varied between 80 and 101; some samples were not processed for logistical reasons such as insufficient supply of test ‘slides’ on individual days, insufficient sample quantity, exceeding the provided number of tests or, on one occasion, instrument failure to report a result. Results obtained by dilution of samples (one creatinine, one phosphate and one urea result from both the Heska and IDEXX equipment) were excluded as dilution introduced human error and may have influenced the results. Additionally, glucose concentrations determined by the commercial laboratory for the first 12 samples collected were substantially lower than those from all three in-house analysers. These results were excluded because it was suspected that red blood cells were accidentally aspirated into the plasma for these samples. This would have affected the commercial laboratory results owing to the delay between blood sample collection and analysis, while any effect on the in-house analyser results would have been minimal as samples were tested immediately after collection. No subsequent samples had such dramatic variation in glucose results.
Distributions of results for each analyte are summarised in Table 3, difference plots for each analyte are shown in Figure 1, and numerical analyses are shown in Tables 4 and 5. Bias is indicated by deviation of the mean difference from zero (Table 4) and/or if there is evidence of proportional bias. When assessed as a percentage of the mean result for each analyte on each analyser (Table 5), for 26/38 analytes, mean differences were within 10%, with 17 of these within 5%. This is demonstrated graphically by the deviation of the observed average agreement (dashed line) from zero; for example, in Figure 1, the difference plot of sodium values from the IDEXX analyser compared with the commercial laboratory analyser shows the in-house analyser results were, on average, approximately 12.5 mmol/l higher (8% of the mean result for sodium on the IDEXX analyser) than those from the commercial laboratory analyser.
Summary of distributions of results from all analysers, showing number of samples tested (n), minimum (Min), median (Med) and maximum (Max) results, as well as lower quartile (25th percentile), upper quartile (75th percentile), mean and SD
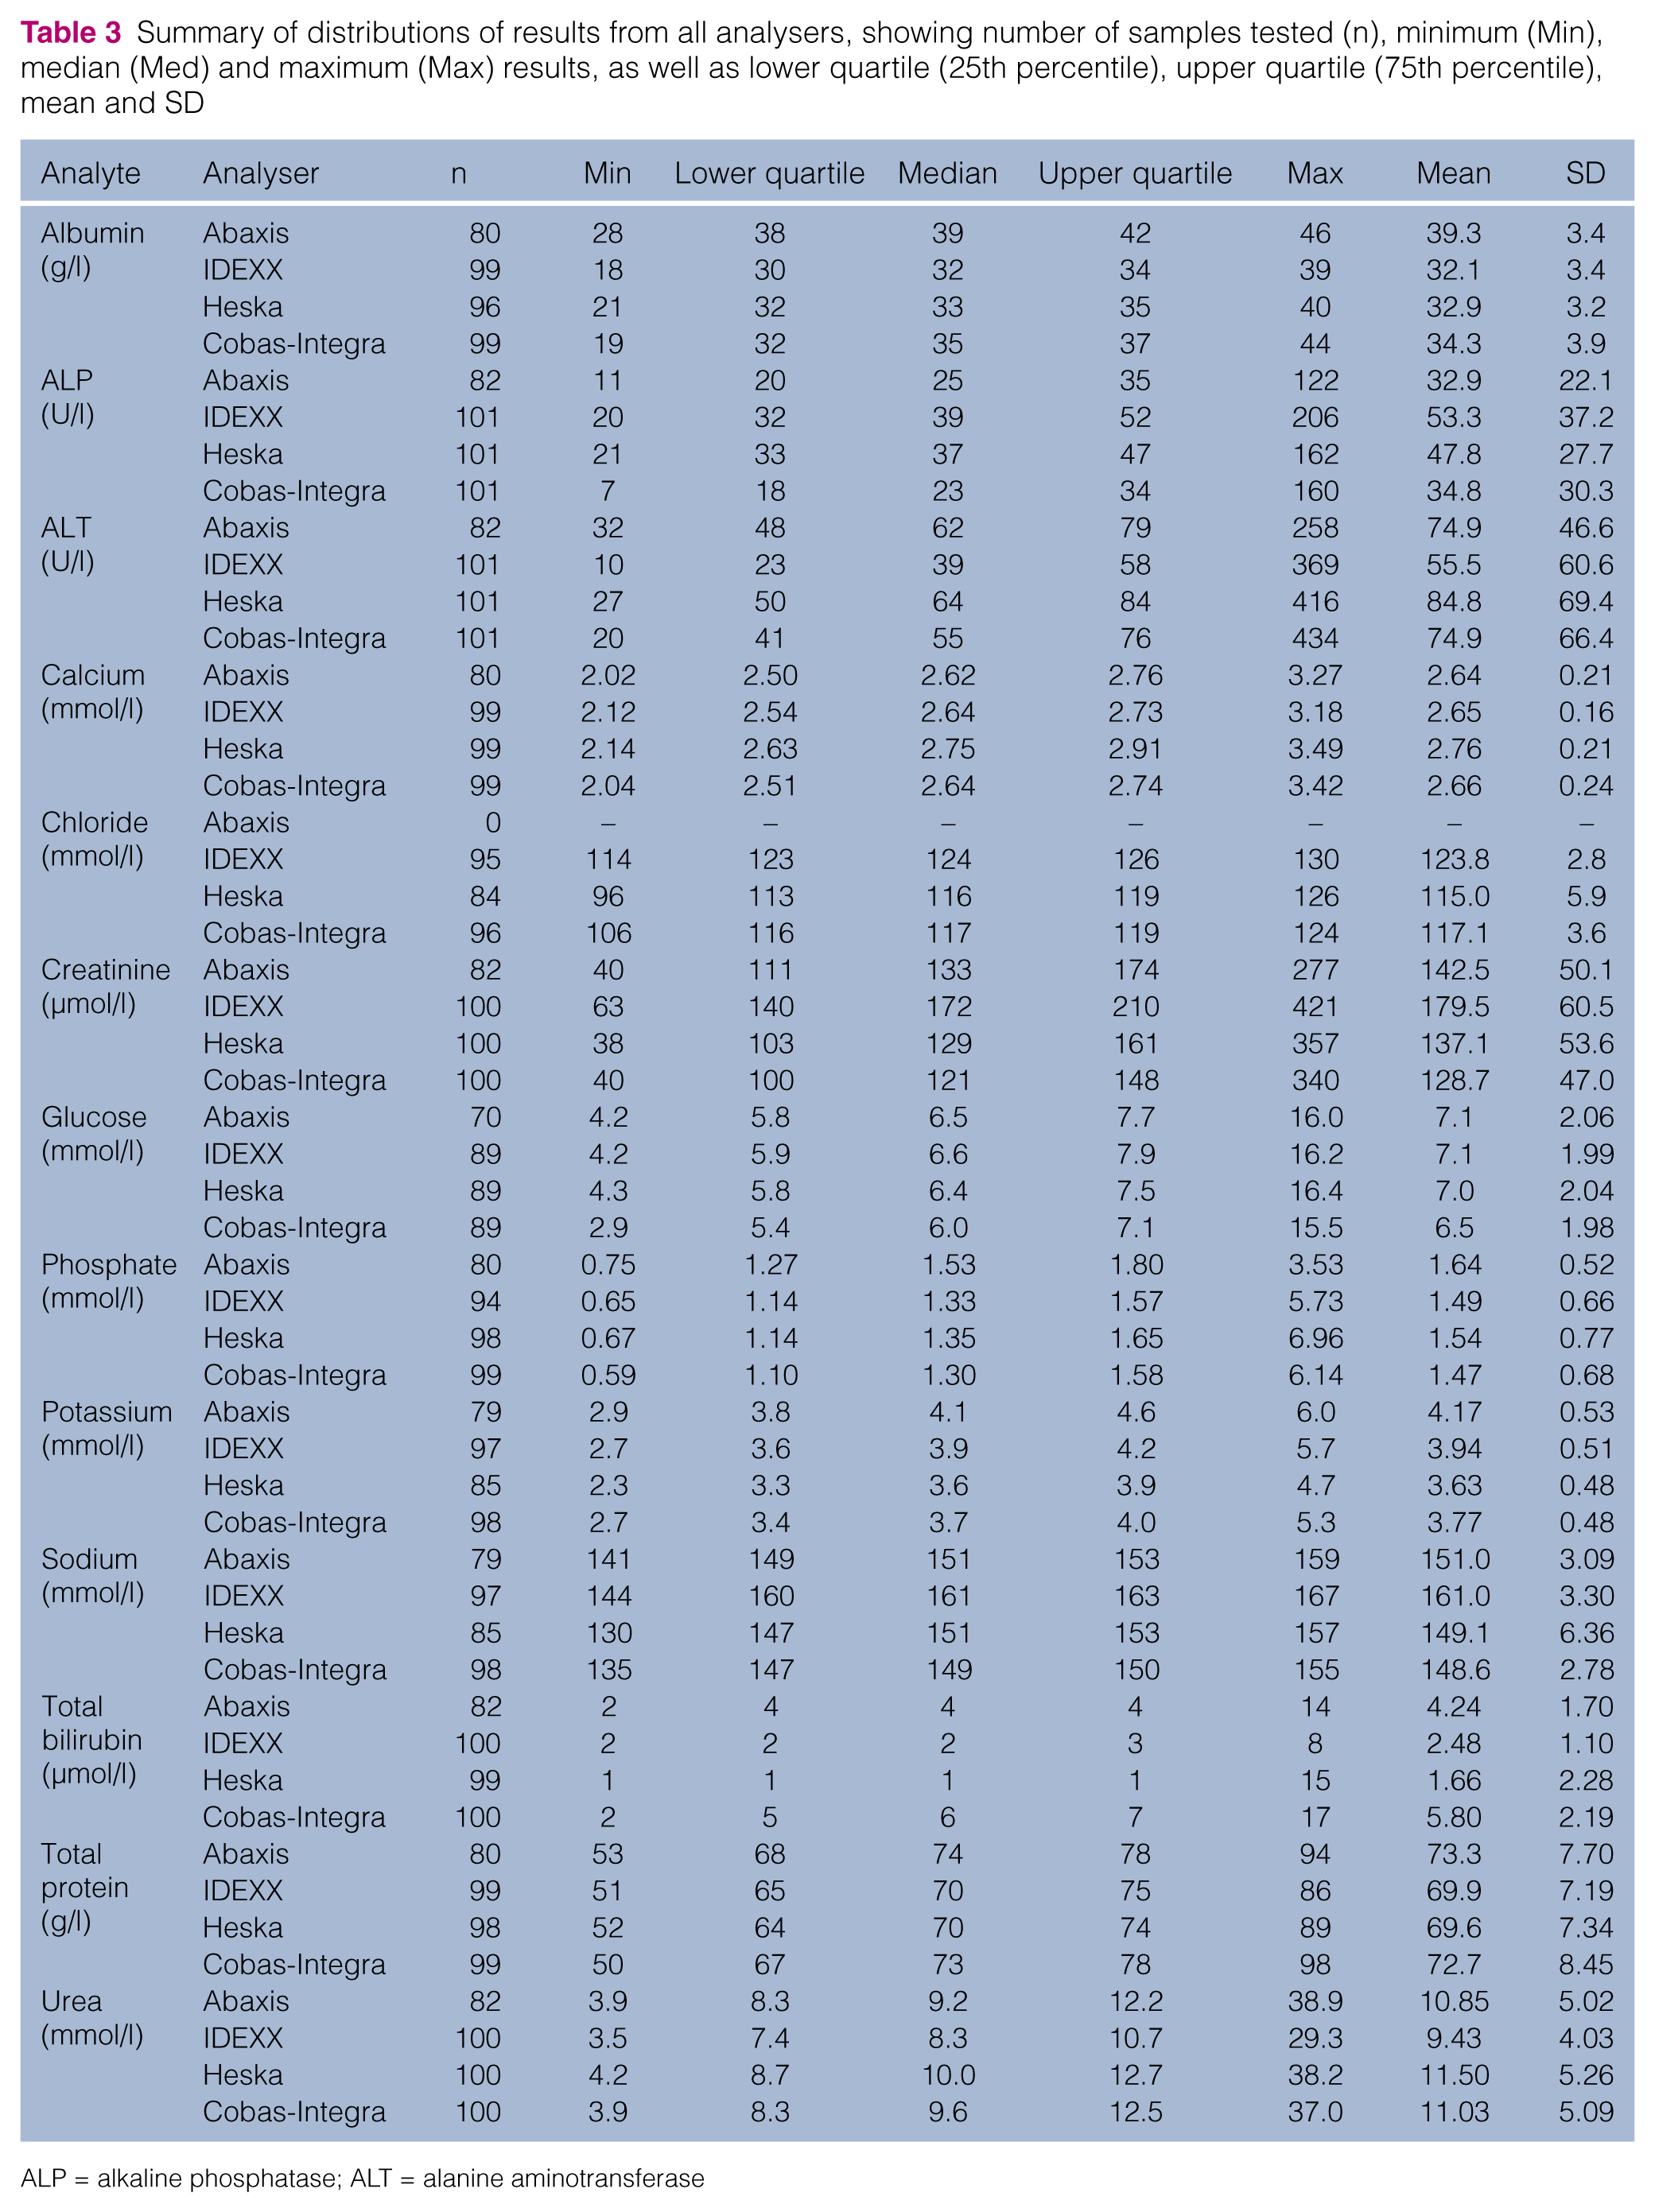
ALP = alkaline phosphatase; ALT = alanine aminotransferase

Difference plots comparing analyte results by each in-house analyser to the results found by the commercial laboratory analyser (‘CobasIntegra’) from the same sample. The long dashed line indicates the (observed) mean difference; the short dashed lines indicate the 95% confidence limits for this mean. The solid lines are the reduced major axis regression lines between differences and means; with proportional bias, the slope of this line deviates from zero (horizontal). Note that the units apply to both x- and y-axes.
Results of Bland–Altman approach analyses. The mean difference describes the average difference between results found on each in-house analyser and those found on the commercial laboratory analyser. The subsequent column shows the difference between the upper limit of the reference interval (RI) on the commercial laboratory analyser and each in-house analyser (as provided by the manufacturer of each analyser); mean difference should agree with this result if the provided RI correctly accounts for the bias found. The correlation coefficients for the association between difference and mean results (second last column) give a quantitative assessment of the degree of proportional bias determined by Bland–Altman analyses. If the value is 0, there is no proportional bias and the regression line on the difference plot (solid lines in Figure 1) is horizontal. A positive value means that the average difference in results (in-house analyser minus commercial laboratory) increases with increasing analyte concentration, and the regression line will slope upwards to the right. A negative value means that the average difference in results (in-house analyser minus commercial laboratory) becomes more negative with increasing analyte concentration, and the regression line will slope downwards to the right. A low P value for equality of means and variances supports rejecting the null hypothesis that the variance does not vary with the mean and hence concluding that proportional bias is present
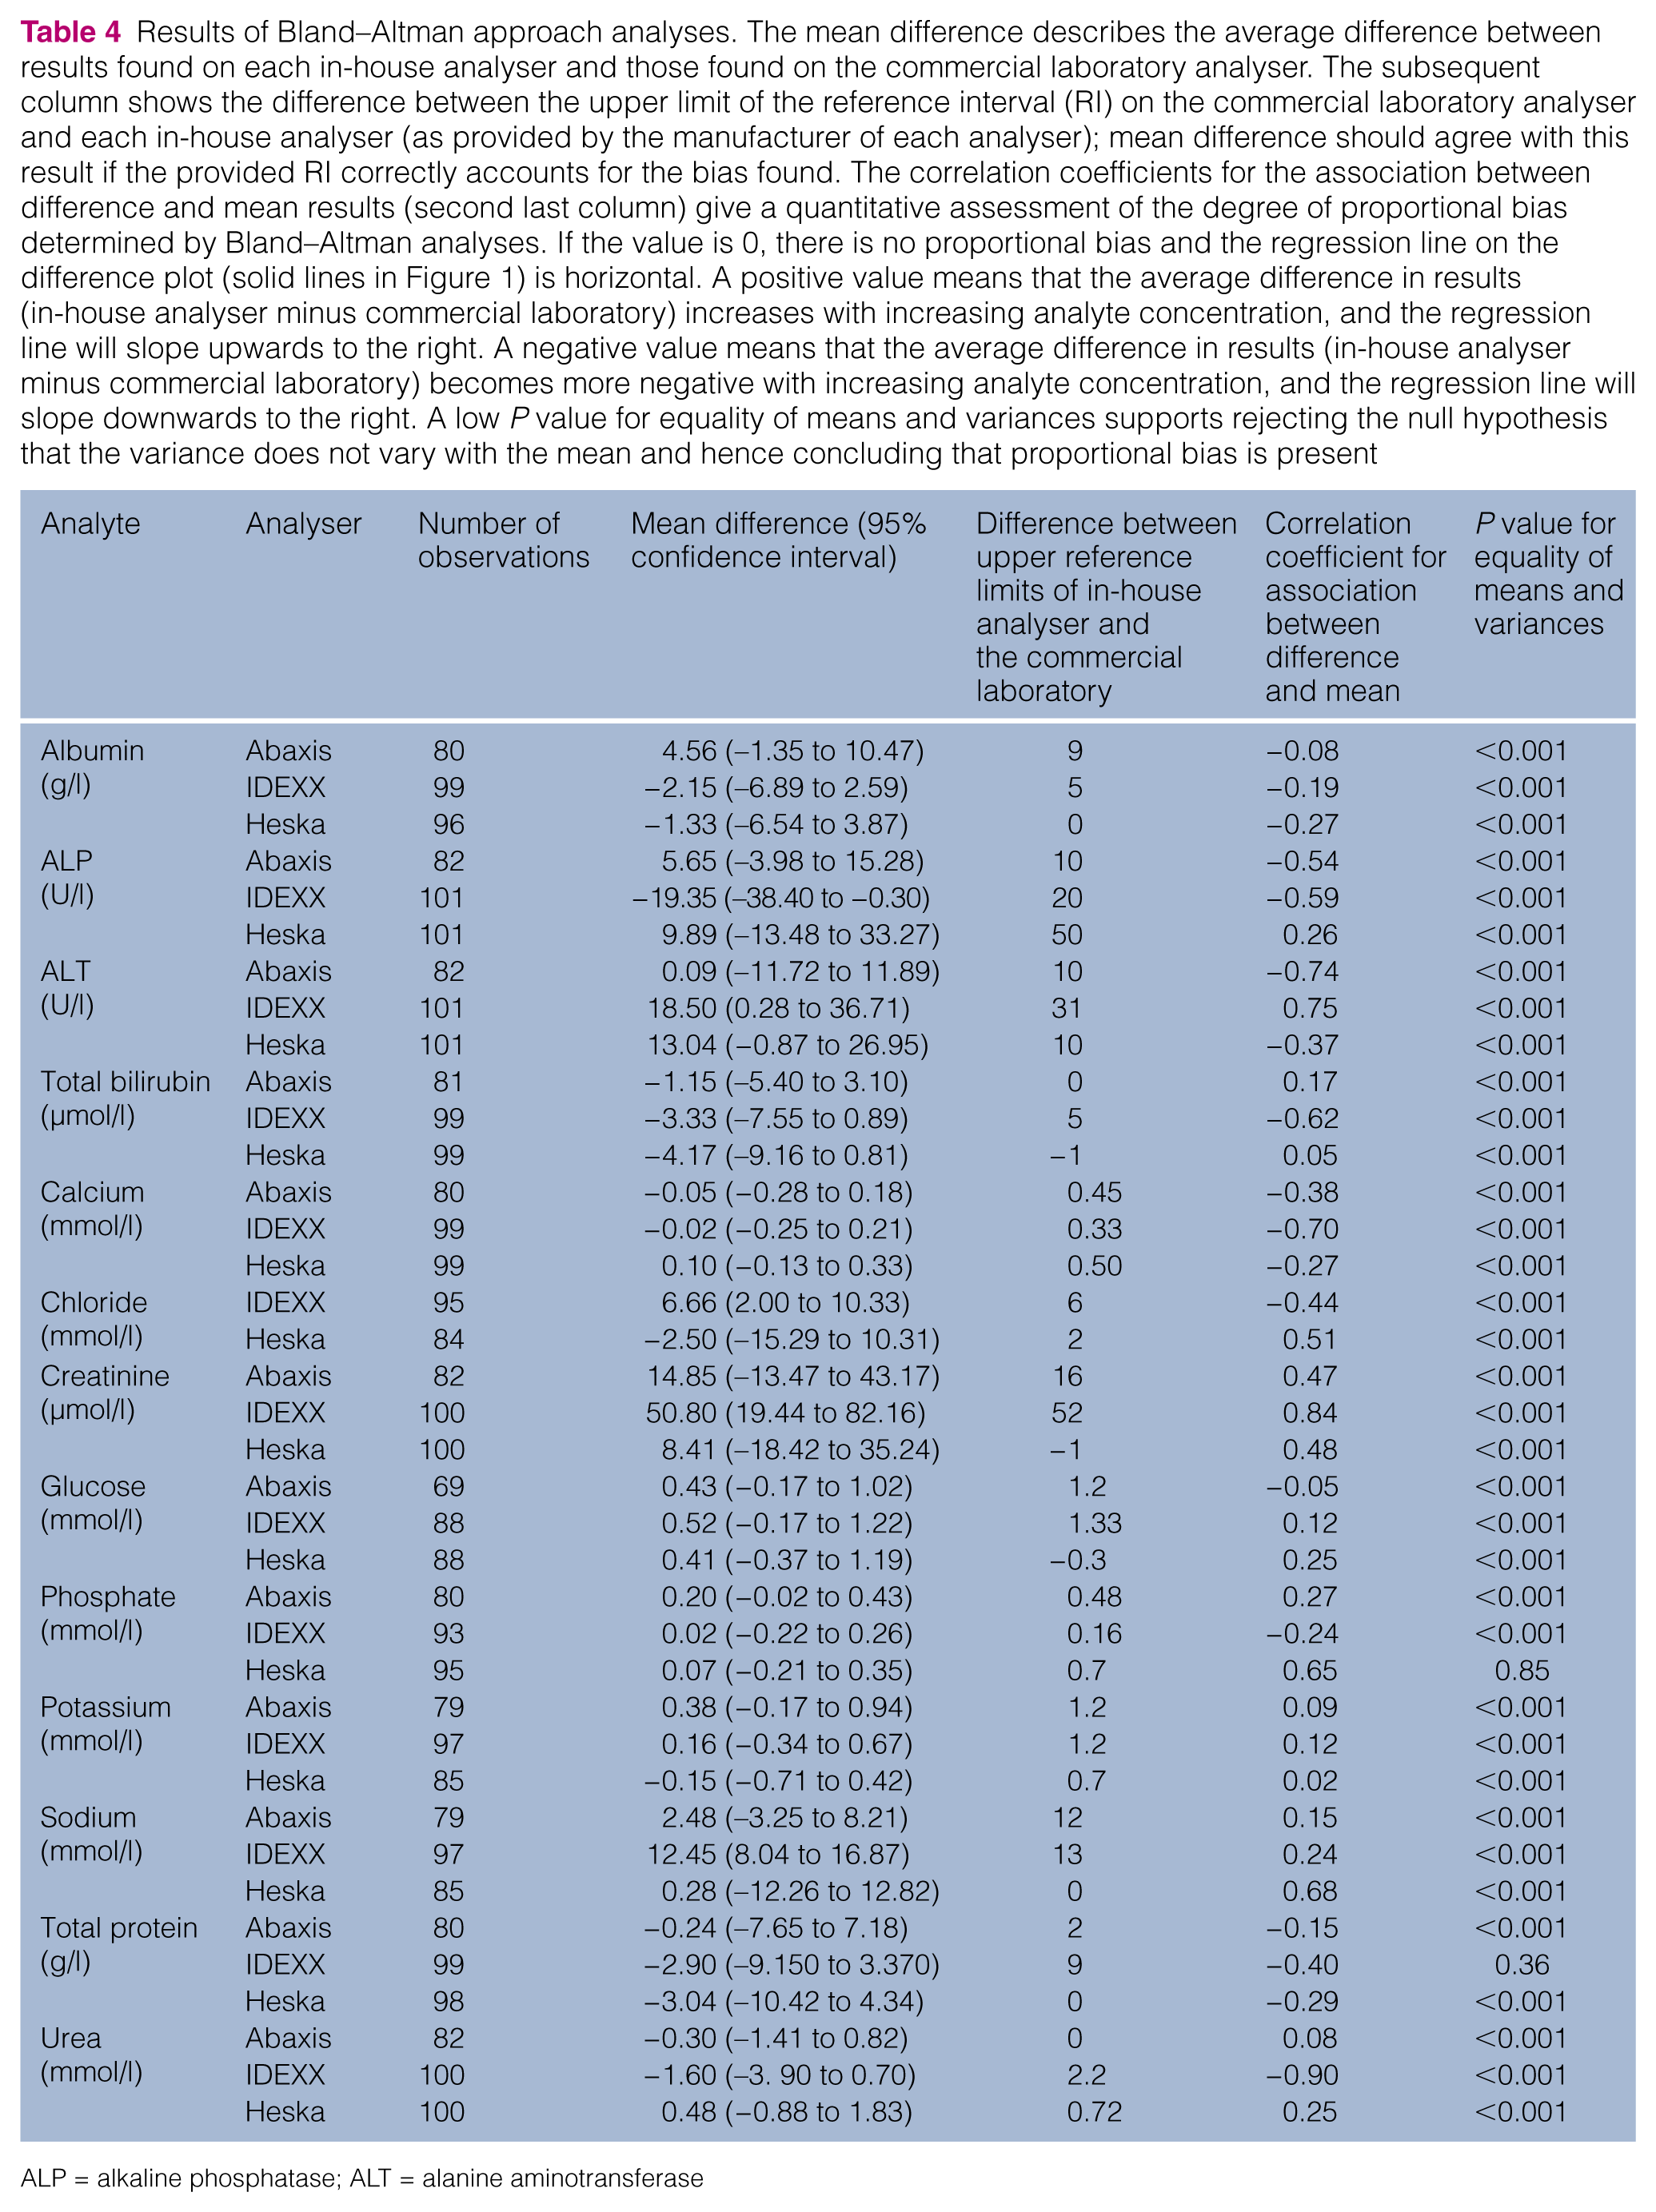
ALP = alkaline phosphatase; ALT = alanine aminotransferase
Summary of biases. Mean differences and 95% limits of agreement (LOA) are both expressed as percentages of the mean value for that analyte from that analyser so that direct comparisons between analytes can be made. LOAs that were <20% are shown in bold; for these analytes, 95% of results differed from the mean difference by <10% of the mean value found on that analyser and thus proportionality is less relevant clinically
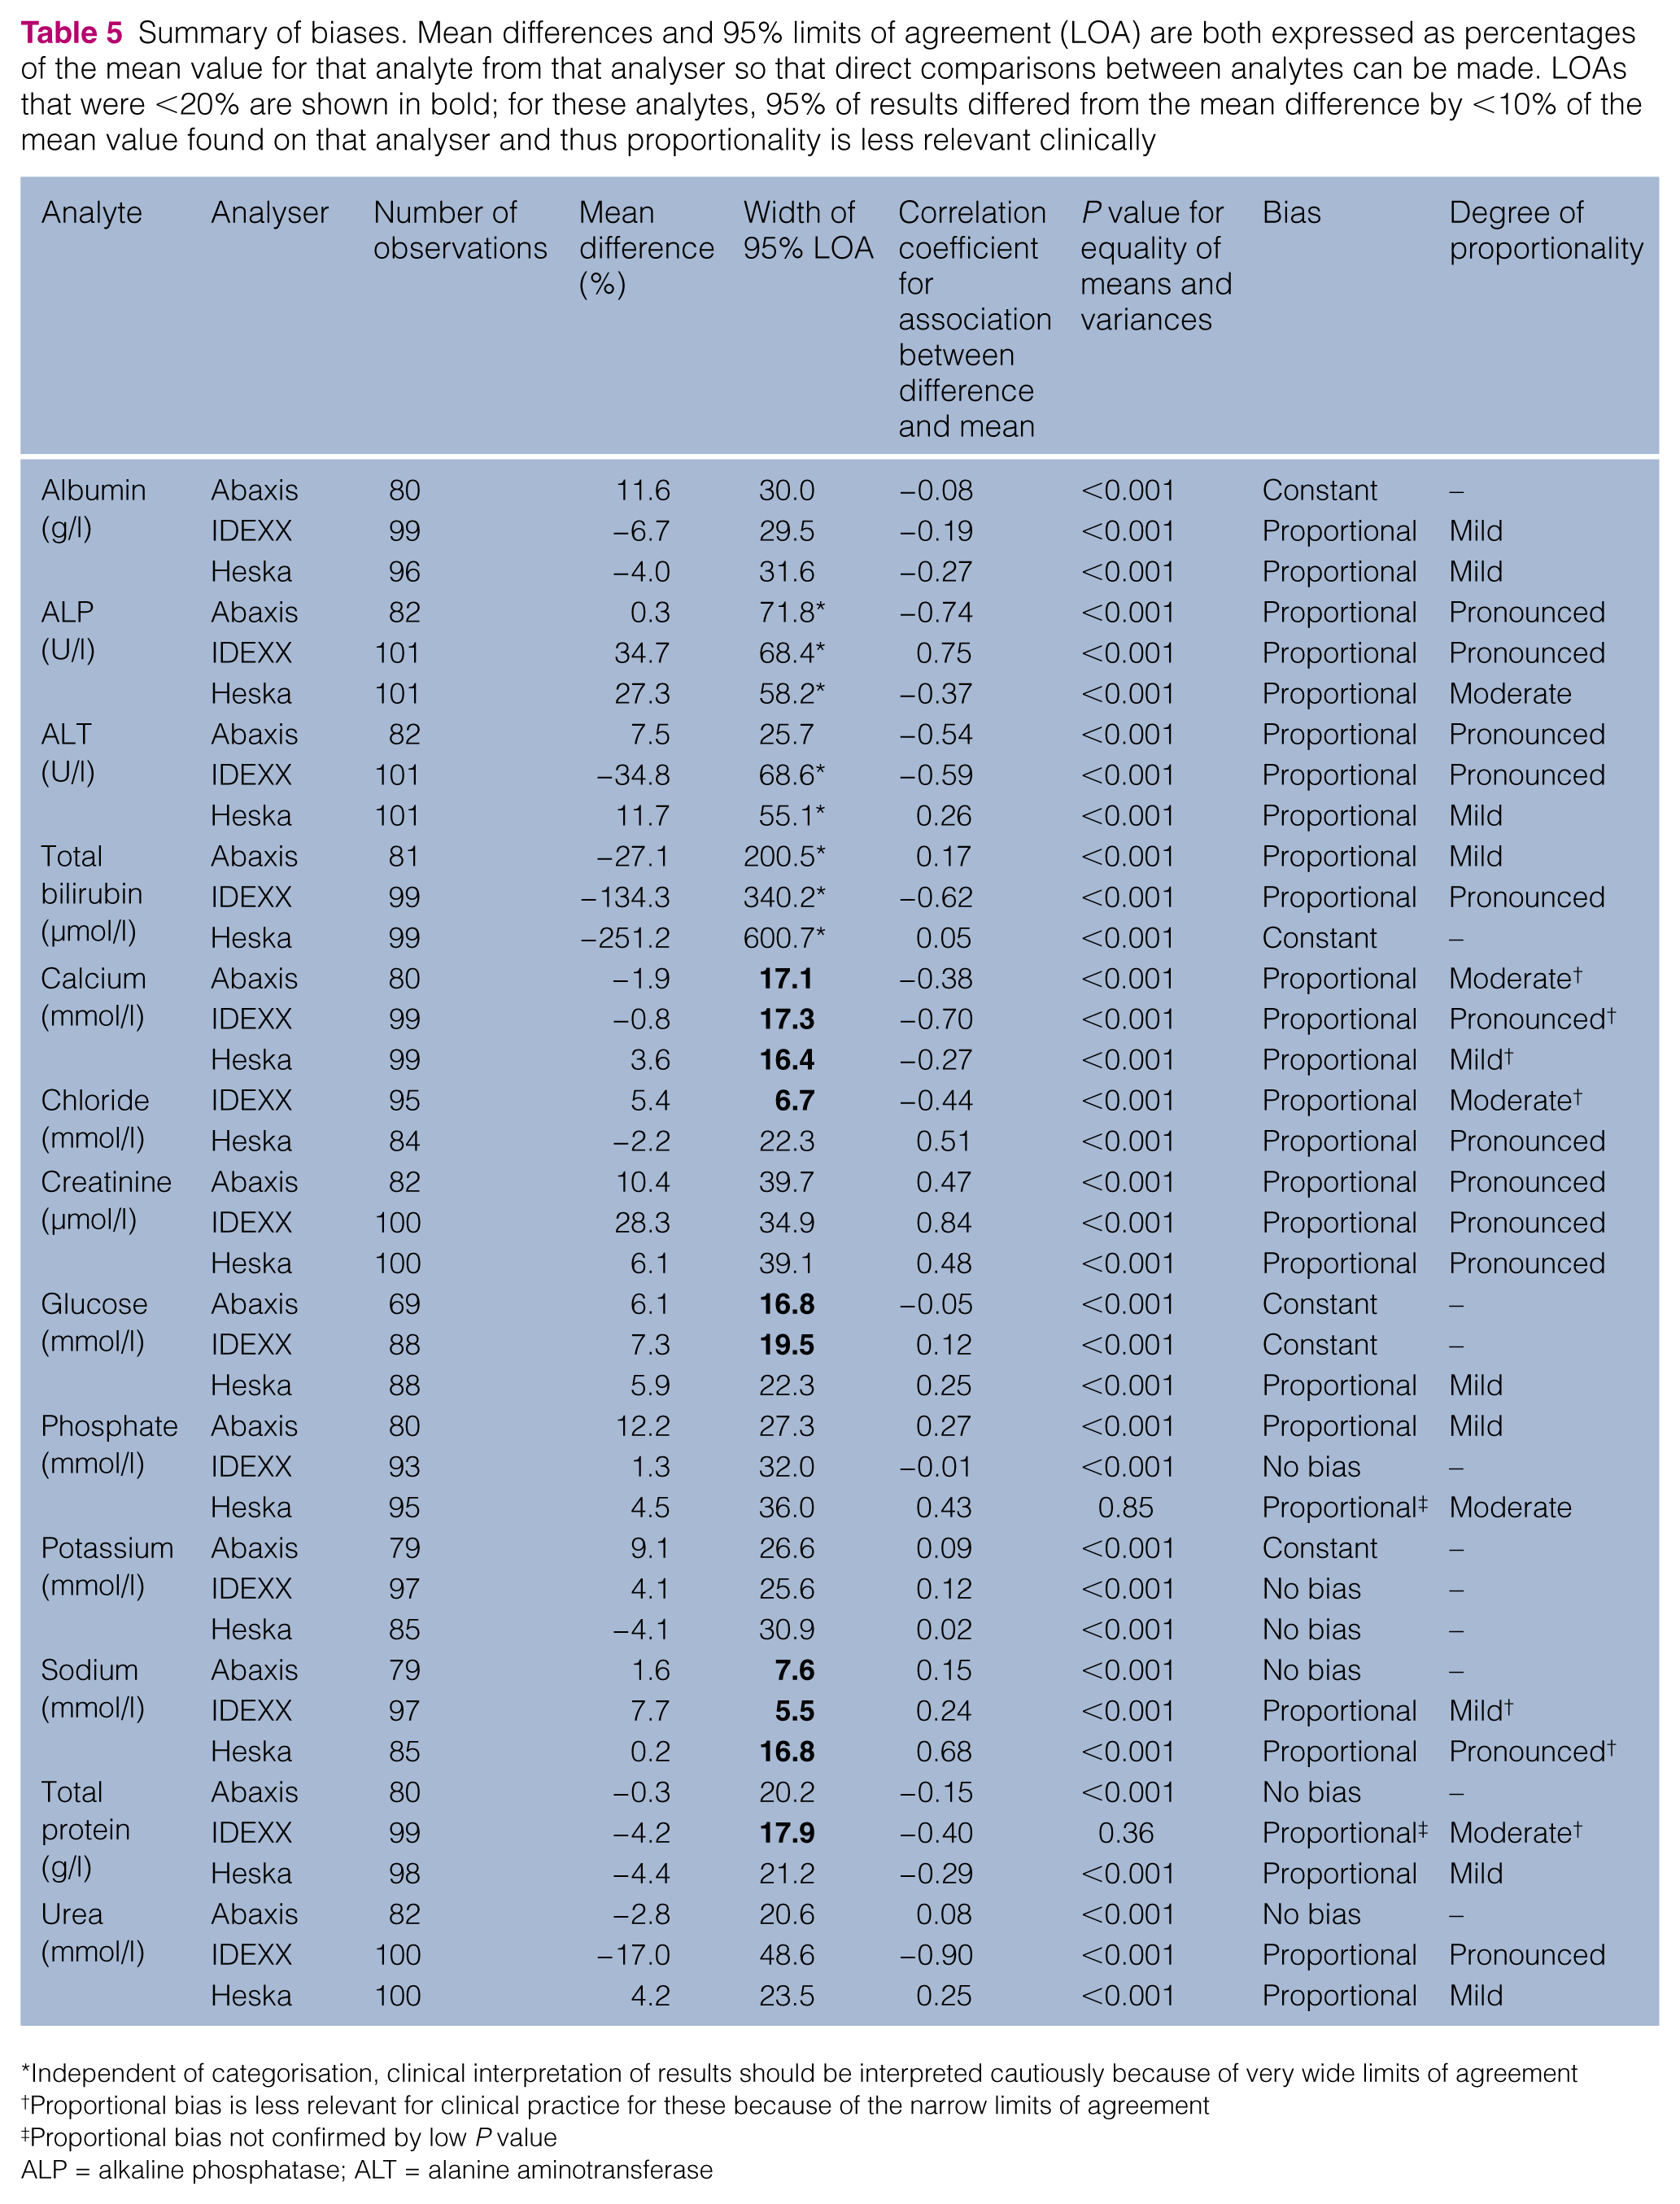
Independent of categorisation, clinical interpretation of results should be interpreted cautiously because of very wide limits of agreement
Proportional bias is less relevant for clinical practice for these because of the narrow limits of agreement
Proportional bias not confirmed by low P value
ALP = alkaline phosphatase; ALT = alanine aminotransferase
The 95% limits of agreement were determined and also expressed as percentages of the mean result for each analyte on each analyser (Table 5) to enable comparison between analytes. Only 10/38 analytes had 95% limits of agreement that were <20% of the mean (five from the IDEXX analyser, three from the Abaxis analyser and two from the Heska analyser) meaning that, for these analytes, 95% of the results were above or below the mean difference by <10% of the mean.
Correlation coefficients for the association between difference and mean can vary from zero (indicating no proportional bias) to either ± 1 (indicating substantial proportional bias). Values approaching zero are associated with a near horizontal reduced major axis regression line (solid lines in Figure 1) and were found for the Abaxis analyser for albumin (−0.08), urea (0.08), glucose (−0.12), sodium (0.15), total protein (−0.15) and urea (0.08); the Heska analyser for potassium (0.02), bilirubin (0.05) and glucose (0.10); and for the IDEXX analyser for glucose (0.12) and potassium (0.12).
In contrast, for example, a large (negative) correlation coefficient (−0.90) was observed for urea measured on the IDEXX instrument (solid line in Figure 1). Urea results on this analyser were, on average, approximately 10% of the mean from this analyser lower than those obtained from the commercial laboratory analyser at the lower end of the RI, but approximately 20% lower at three times the upper limit of normal.
Based on the categorisation system, the Abaxis analyser was determined to have no bias for three analytes (sodium, total protein and urea), constant bias for three analytes (albumin, glucose and potassium) and proportional bias for the remaining six analytes. The IDEXX analyser had no bias for potassium and phosphate, constant bias for one analyte (glucose) and proportional bias for the remaining 10 analytes. The Heska analyser had no bias for potassium only, constant bias for bilirubin only and proportional bias for the remaining 11 analytes. For two analytes, phosphate on the Heska analyser and total protein on the IDEXX analyser, proportional bias was not confirmed by a low P value for equality of means and variances; visual inspection of the difference plots appeared to support that proportional bias was present. Proportional bias varied from mild (Abaxis: 2/6; IDEXX: 2/10; Heska: 6/11) to pronounced (Abaxis: 3/6; IDEXX: 6/10; Heska: 3/11). The categorisation of each analyte from each analyser is shown in Table 5.
The width of the limits of agreement is independent of the categorisations but a wide limit of agreement band affects the clinical interpretation of results. This can mean that an individual result on one analyte that has been graded as having no bias or constant bias but has a very wide band can have individual values that differ markedly between the in-house analyser and the commercial laboratory. For example, the total bilirubin values determined on the Heska analyser had a limit of agreement that was 600% of the mean result from that analyser, indicating that 95% of results could have a true value up to three times the mean (lower or higher) than that determined.
Proportional bias is less relevant for clinical practice (even if classified as pronounced) when the limits of agreement are narrow, such as for calcium on the IDEXX analyser, as the greater slope is within a range of only 10% above or below the average result.
Percentages of results from all analysers that were below, within and above the RIs supplied by the manufacturer or laboratory are shown in Table 6. Percentages of results below and above the RI varied markedly between analysers for all analytes. Total bilirubin had the most consistency between analysers (percentages of samples within RIs varied from 96% [Heska] to 100% [IDEXX]). The IDEXX analyser also had relatively fewer values above the RI for both total protein (all values were within the RI compared with 9–16% for the other analysers) and urea (only 11% of values exceeded the RI compared with 32–34% for the other analysers) and there were no values below the RI for chloride (compared with 8–14% for the other analysers). For ALP, 4% of values from the Abaxis analyser were above the RI compared with 9–12% for the other analysers. Large percentages of values exceeded the upper limit of the RI for the commercial laboratory analyser for albumin (41%) and calcium (76%), and below the lower limit of the RI for phosphate (50%) and potassium (52%); these were markedly different from results for these analytes from the other analysers. The Heska analyser yielded approximately twice as many results above the Heska RI for glucose (31%) compared with the other analysers.
Feline reference intervals (RIs) for biochemistry analytes (provided by manufacturers of analysers and a commercial laboratory) with percentages of results that were below, within and above the RIs supplied by that manufacturer or laboratory. A lower percentage above and/or below the RI than other analysers suggests that the RI may be too wide, which would result in reduced diagnostic sensitivity for detection of abnormal cats. A larger percentage above and/or below the RI than other analysers suggests that the RI may be too narrow, which would result in reduced diagnostic specificity of the assay. The large proportion of results from the commercial laboratory that were above the commercial laboratory’s RIs for calcium and albumin, and below the RIs for phosphate and potassium (without consistent clinical signs in these cats), suggests inaccuracy of the RIs for these analytes for the commercial laboratory. Inconsistencies between analysers (ie, a higher or lower percentage than from other analysers) are shown in bold

Chloride not available for Abaxis
ALP = alkaline phosphatase; ALT = alanine aminotransferase
Discussion
The findings of this study indicate that bias is common in the in-house analysers assessed, and this is commonly proportional bias. In many cases, this bias is sufficient to invalidate comparisons of biochemical results obtained from different analysers. Further, the inconsistency between results with/above/below the provided RIs means results cannot be compared on the basis of where they lie in relation to the provided RIs. In general, it may be possible to reduce biases through improvement of the assay methods and recalibration of the analyser; however, the in-house analysers assessed cannot be calibrated by the end user and assay methods may not be able to be changed for the ‘dry slide’ (Heska and IDEXX equipment) or ‘rotor’ (Abaxis equipment) technologies utilised by these analysers. Furthermore, performance may vary between analysers of the same make (even after calibration), so, ideally, biochemical results should be interpreted using RIs determined specifically for the particular analyser being used.
At least half the analytes tested on each machine showed substantial bias (either >5% mean difference or at least moderate proportionality or both). This was not surprising as in-house biochemistry equipment cannot be calibrated by the user and each manufacturer provides a different RI for each analyte, suggesting that a constant bias from the true values may be present. However, varying RIs can only fully account for constant bias, and approximately half of all analytes tested (for each analyser) also showed proportional bias. Varying the RI does not fully address marked proportional bias when comparing results between analysers; and even more complex strategies may not be effective if the degree of difference changes in a non-linear way with increasing analyte concentration.
Difference (Bland–Altman) analysis can indicate notable proportional bias that is unimportant clinically when the calculated 95% limits of the observed average agreement are within a narrow range. Stated differently, if the values from an in-house analyser do not vary widely relative to those from the commercial laboratory analyser, the regression slope of those differences can appear to result in substantial proportional bias but this is relatively unimportant clinically because this slope is over a narrow range. An example demonstrating this is calcium as measured on the IDEXX analyser; although the correlation between difference and mean was −0.70 (poor as it is approaching an absolute value of 1.0), 95% of results were only ~0.2 mmol/l above or below the average results.
Although average differences compared with the commercial laboratory analyser differed from zero for most analytes across all in-house analysers, this could be addressed by adjustment of RIs (provided the extent of proportional bias was minor). The average difference between results from each in-house analyser compared with the commercial laboratory analyser is shown in Table 4 (and by percentage in Table 5). The adjacent column in Table 4 shows the differences between the upper limits of the manufacturer’s recommended RIs and the commercial laboratory’s recommended upper limit for each analyte on each machine, respectively. The values in these two columns would agree if bias had been corrected for by altering the RI. These values are similar in some cases (eg, chloride and sodium on the IDEXX analyser, and creatinine on the Abaxis and IDEXX analysers). In other cases, the values differ substantially: ALT on the Heska analyser was 9.9 mmol/l higher (on average) than the commercial laboratory analyser but the difference between upper limits of the two RIs was 50 mmol/l; ALT on the IDEXX instrument had an observed average difference of 19.3 mmol/l less than the commercial laboratory analyser but the difference in RI upper limits was 20 mmol/l greater; sodium on the Abaxis machine was 2.5 mmol/l higher than the commercial laboratory analyser, yet the RI difference was 12 mmol/l. Such comparisons assume the RIs for all analytes from each analyser (including the commercial laboratory analyser) have been correctly determined.
In the course of this study, for most analytes, approximately 80% of observations were within the reported normal range but some observations were challenging to interpret: for example, 78/99 (75.8%) calcium results from the commercial laboratory were above the upper limit of the RI (2.50 mmol/l) despite no clinical evidence of hypercalcaemia, suggesting this RI was incorrect; additionally, many values from the commercial laboratory analyser were above the RI for albumin (41.4%) and below the RI for phosphate (49.5%) and potassium (52.0%) without consistent clinical signs in these cats, also suggesting an inaccuracy of the RIs for these analytes. These changes are shown in Table 6, which also demonstrates a lack of consistency of percentage of results within/above/below the provided RIs. If the RIs overcame the bias of the analysers, approximately the same percentage of results would have been found in each category. Where two or three analysers were consistent (and the fourth different), it suggested that analysers with a different percentage to the others had an incorrect RI. Too few results above or below the RI suggests that the range is too broad and pathology is likely to be missed. Too many elevated or decreased results may mean patients are incorrectly diagnosed with pathology that is not present.
These inconsistencies may result in either unnecessary clinical management or missing a diagnosis. For example, if albumin alone was used as a measure of dehydration based on the commercial laboratory analyser and using the commercial laboratory upper limit of RI, approximately 40 additional cats may have received unnecessary treatment such as fluid therapy than if the IDEXX and Abaxis analysers were used. Conversely, using urea as an indicator of dehydration, approximately 20% fewer cats over the reference limit on the IDEXX analyser may mean that if this analyser alone was used, approximately 20 cats may not have received appropriate management of azotaemia. ALP is regarded as a sensitive indicator of hepatopathy in cats as it has a short half-life of approximately 6 h in this species. 16 The mean and median results for ALP are similar for the Abaxis and Cobas-Integra analysers, yet the RI is 10 U/l lower for the Abaxis analyser resulting in 5–8% fewer cats being interpreted as having an elevated level. This 5–8% of cats may not receive appropriate further diagnostics. Inaccurate diagnosis of hypercalcaemia (as appears likely for approximately 65 cats when assessed by the Gribbles RI) could lead to unnecessary investigations to determine ionised calcium and parathyroid hormone levels, as well as the potential for unnecessary treatment.
No proportional bias was recognised for any analyser for potassium (demonstrated by the straight lines showing the average in Figure 1 for this analyte) and the mean average differences were only 4% (though in opposite directions) for each of the Abaxis and IDEXX analysers. Therefore, for this analyte, RI adjustments alone should be able to provide direct comparisons between analysers, yet >50% of results from the commercial laboratory analyser and >25% of results from the Heska analyser were recognised as hypokalaemic, which may result in unnecessary supplementation of these cats.
IRIS stages chronic kidney disease based on creatinine levels; ‘stage 2’ for cats is defined as creatinine concentrations of 140–250 μmol/l. 9 The mean differences in creatinine concentrations for the in-house analysers were 8 μmol/l (Heska), 15 μmol/l (Abaxis) and 51 μmol/l (IDEXX) compared with the commercial laboratory. The result of these differences means that cats assessed by these in-house analysers (particularly IDEXX) will be staged with more advanced kidney disease than if they were assessed by the commercial laboratory analyser. This may have implications for management for anaesthesia, ongoing monitoring and long-term prognostication.
RI adjustments may not overcome substantial proportional bias but any assessment of proportional bias assumes that the commercial laboratory analyser results are correct. Commercial laboratory analyser analysis was chosen as the ‘gold standard’ for this study as this is generally considered the ‘highest standard’ routinely available to practitioners. However, commercial laboratory analyser results may not always be the most accurate. For example, the method for creatinine analysis used by the commercial laboratory in this study was the Jaffe reaction. Compared with high performance liquid chromatography (HPLC), the Jaffe reaction has a strong positive proportional bias. 17 By inference, the negative proportional bias to the commercial laboratory analyser found by the enzymatic method of creatinine assessment used by all three in-house analysers may be due to better agreement with ‘true values’ determined by HPLC.
Of the published studies assessing veterinary in-house analysers, only three have assessed the analysers assessed in this study with feline samples.3,4,8 Mischke et al assessed eight of the analytes assessed in this study, 3 with results of plasma samples from 22 cats tested using an IDEXX VetTest compared with results from a Hitachi 704 commercial laboratory analyser. Sutton et al assessed 10 of the analytes assessed in this study on an Abaxis Vetscan analyser compared with a commercial laboratory Hitachi 911 analyser with 26 feline serum samples. 4 Flatland et al assessed all 13 analytes in this study on a Heska SpotChem analyser compared with a Hitachi 911 analyser with plasma results from 53 cats. 8 Across these studies, similar results to the current study were seen for half to three-quarters of the analytes but different methodologies preclude direct comparisons. Potential reasons for differences in findings may be one or more of the following: smaller sample sizes, different ranges of analyte concentrations, assessing serum instead of plasma and different reference laboratory equipment.
Conclusions
This is the first study to assess the bias of multiple in-house veterinary biochemistry analysers. These results show that, for many analytes, results from in-house analysers are not directly comparable with those from the commercial laboratory or other in-house analysers, and universal RIs (such as those published in text books) may not be appropriate. Additionally, practitioners should not compare results from different analysers only on the basis of if results are within, above or below the provided RI. The potential effect on clinical decision-making may be overcome by the use of appropriately generated RIs, or reference change values that have recently been described as more appropriate for most feline biochemistry analytes. 18 Further, universal guidelines such as grading of renal disease or diagnosis of diabetes mellitus cannot be made on the basis of absolute values; however, guidelines could be made on the basis of percentage increases from a cat’s prior results or above the upper limit of a correctly determined RI.
Footnotes
Acknowledgements
The authors would like to thank Dr Kathleen Freeman for her expertise, guidance and support, as well as Gribbles Pathology (Heska Dri-chem and commercial laboratory), IDEXX Pathology and REM Systems (Vetscan) for providing analysers and analytes, and allowing independent scrutiny of their products.
Conflict of interest
The authors do not have any potential conflicts of interest to declare.
Funding
This research received no grant from any funding agency in the public, commercial or not-for-profit sectors.