
Abstract
For each species, the manufacturers of in-house analysers (and commercial laboratories) provide standard reference intervals (RIs) that do not account for any differences such as geographical population differences and do not overtly state the potential for variation between results obtained from serum or plasma. Additionally, biases have been demonstrated for in-house analysers which result in different RIs for each different type of analyser. The objective of this study was to calculate RIs (with 90% confidence intervals [CIs]) for 13 biochemistry analytes when tested on three commonly used in-house veterinary analysers, as well as a commercial laboratory analyser. The calculated RIs were then compared with those provided by the in-house analyser manufacturers and the commercial laboratory. Plasma samples were collected from 53 clinically normal cats. After centrifugation, plasma was divided into four aliquots; one aliquot was sent to the commercial laboratory and the remaining three were tested using the in-house biochemistry analysers. The distribution of results was used to choose the appropriate statistical technique for each analyte from each analyser to calculate RIs. Provided reference limits were deemed appropriate if they fell within the 90% CIs of the calculated reference limits. Transference validation was performed on provided and calculated RIs. Twenty-nine of a possible 102 provided reference limits (28%) were within the calculated 90% CIs. To ensure proper interpretation of laboratory results, practitioners should determine RIs for their practice populations and/or use reference change values when assessing their patients’ clinical chemistry results.
Introduction
Population-based reference intervals (RIs) for clinical pathology analytes usually describe the central 95% of normally distributed results found in healthy individuals.1–2 The difficulties in establishing such intervals are well described and relate to the definition and selection of healthy individuals, and selection of appropriate statistical techniques based on whether a normal distribution of results is found or can be established. 1-2
Several studies have indicated that in-house analysers show bias for several analytes compared with results determined by commercial laboratory analysers when analysing feline samples.3-9 Such biases influence the RI of each analyte determined by each analyser, and potentially every individual analyser of each model, let alone accounting for differences that may exist between populations of individuals between veterinary practices, cities and continents. The manufacturers of in-house analysers (and commercial laboratories) provide standard RIs for each species that, in many cases, do not account for any differences such as geographical population differences; further, the potential for variation between results obtained from serum or plasma is not readily apparent.
The objective of this study was to calculate RIs for 13 biochemistry analytes using feline plasma when tested on three commonly used in-house veterinary analysers, as well as a commercial laboratory analyser. Each RI accounted for the central 95% of a normal distribution, and each upper and lower limit was determined with 90% confidence intervals (CIs). The calculated RIs were then compared with those provided by either the in-house analyser manufacturers or the commercial laboratory.
The provided RI limits were assessed on whether they fell within 90% CIs of the calculated RIs (or not). Additionally, both the provided and calculated RIs were assessed by transference validation.2,10,11
Materials and methods
RIs were determined by:
Choosing clinically normal individuals;
Determining if the distribution of analyte values was normal and, if not, transforming the data to establish normality (where possible);
Choosing the appropriate statistical technique for each analyte from each analyser, depending on the distribution of results, to calculate RIs (with 90% CIs for upper and lower limits) based on American Society of Veterinary Clinical Pathologists (ASVCP) recommendations. 11
Subjects
Plasma samples were collected from 53 cats identified as being clinically normal in a primary accession, feline-only practice (Paddington Cat Hospital, Sydney, Australia) over a 2 month period. These comprised 28 spayed females and 25 castrated males, ranging in age from 1 to 16 years (mean 8.4 years, median 8.8 years); 26 were domestic shorthairs, 10 were Burmese, 12 breeds (Abyssinian, Bengal, British Shorthair, Cornish Rex, Devon Rex, domestic longhair, Persian, Ragdoll, Russian Shorthair, Siamese, Tonkinese, Turkish Van) were represented in the remaining 17 cats with no more than two cats of any specific breed. This is representative of the breeds of cats seen in the primary author’s (RB) practice. Only one sample was assessed from each cat.
The health status at the time of testing of cats was determined by reason for presentation; and physical examination assessing body condition score, hydration, abdominal palpation, thoracic auscultation and body temperature.
Sampling
Blood samples were collected from each cat by single jugular venepuncture into a 2 ml lithium–heparin tube (Becton Dickinson). Each tube was centrifuged at 4000 rpm (1790 × g) for 5 mins within 30 mins of collection, and the plasma was then immediately divided into four separate aliquots. One aliquot was sent by courier to the commercial laboratory and processed by a Cobas-Integra 400 biochemical analyte analyser; the remaining three were immediately tested on three in-house biochemistry analysers – an Abaxis Vetscan VS-2 Point of Care Analyser; a Heska Dri-Chem Veterinary Chemistry Analyser; and an IDEXX VetTest and Vetlyte – for the following 13 biochemistry analytes: albumin, alkaline phosphatase (ALP), alanine aminotransferase (ALT), total bilirubin, calcium, chloride (not available for Abaxis), creatinine, glucose, phosphate, potassium, sodium, total protein and urea.
Laboratory methods
The assay methods used by each instrument for each analyte are shown in Table 1.
Assay method for analyte concentrations by the Abaxis VetScan, IDEXX VetTest/VetLyte and Heska Dri-Chem analysers, and by a Cobas-Integra biochemistry analyser at a commercial laboratory
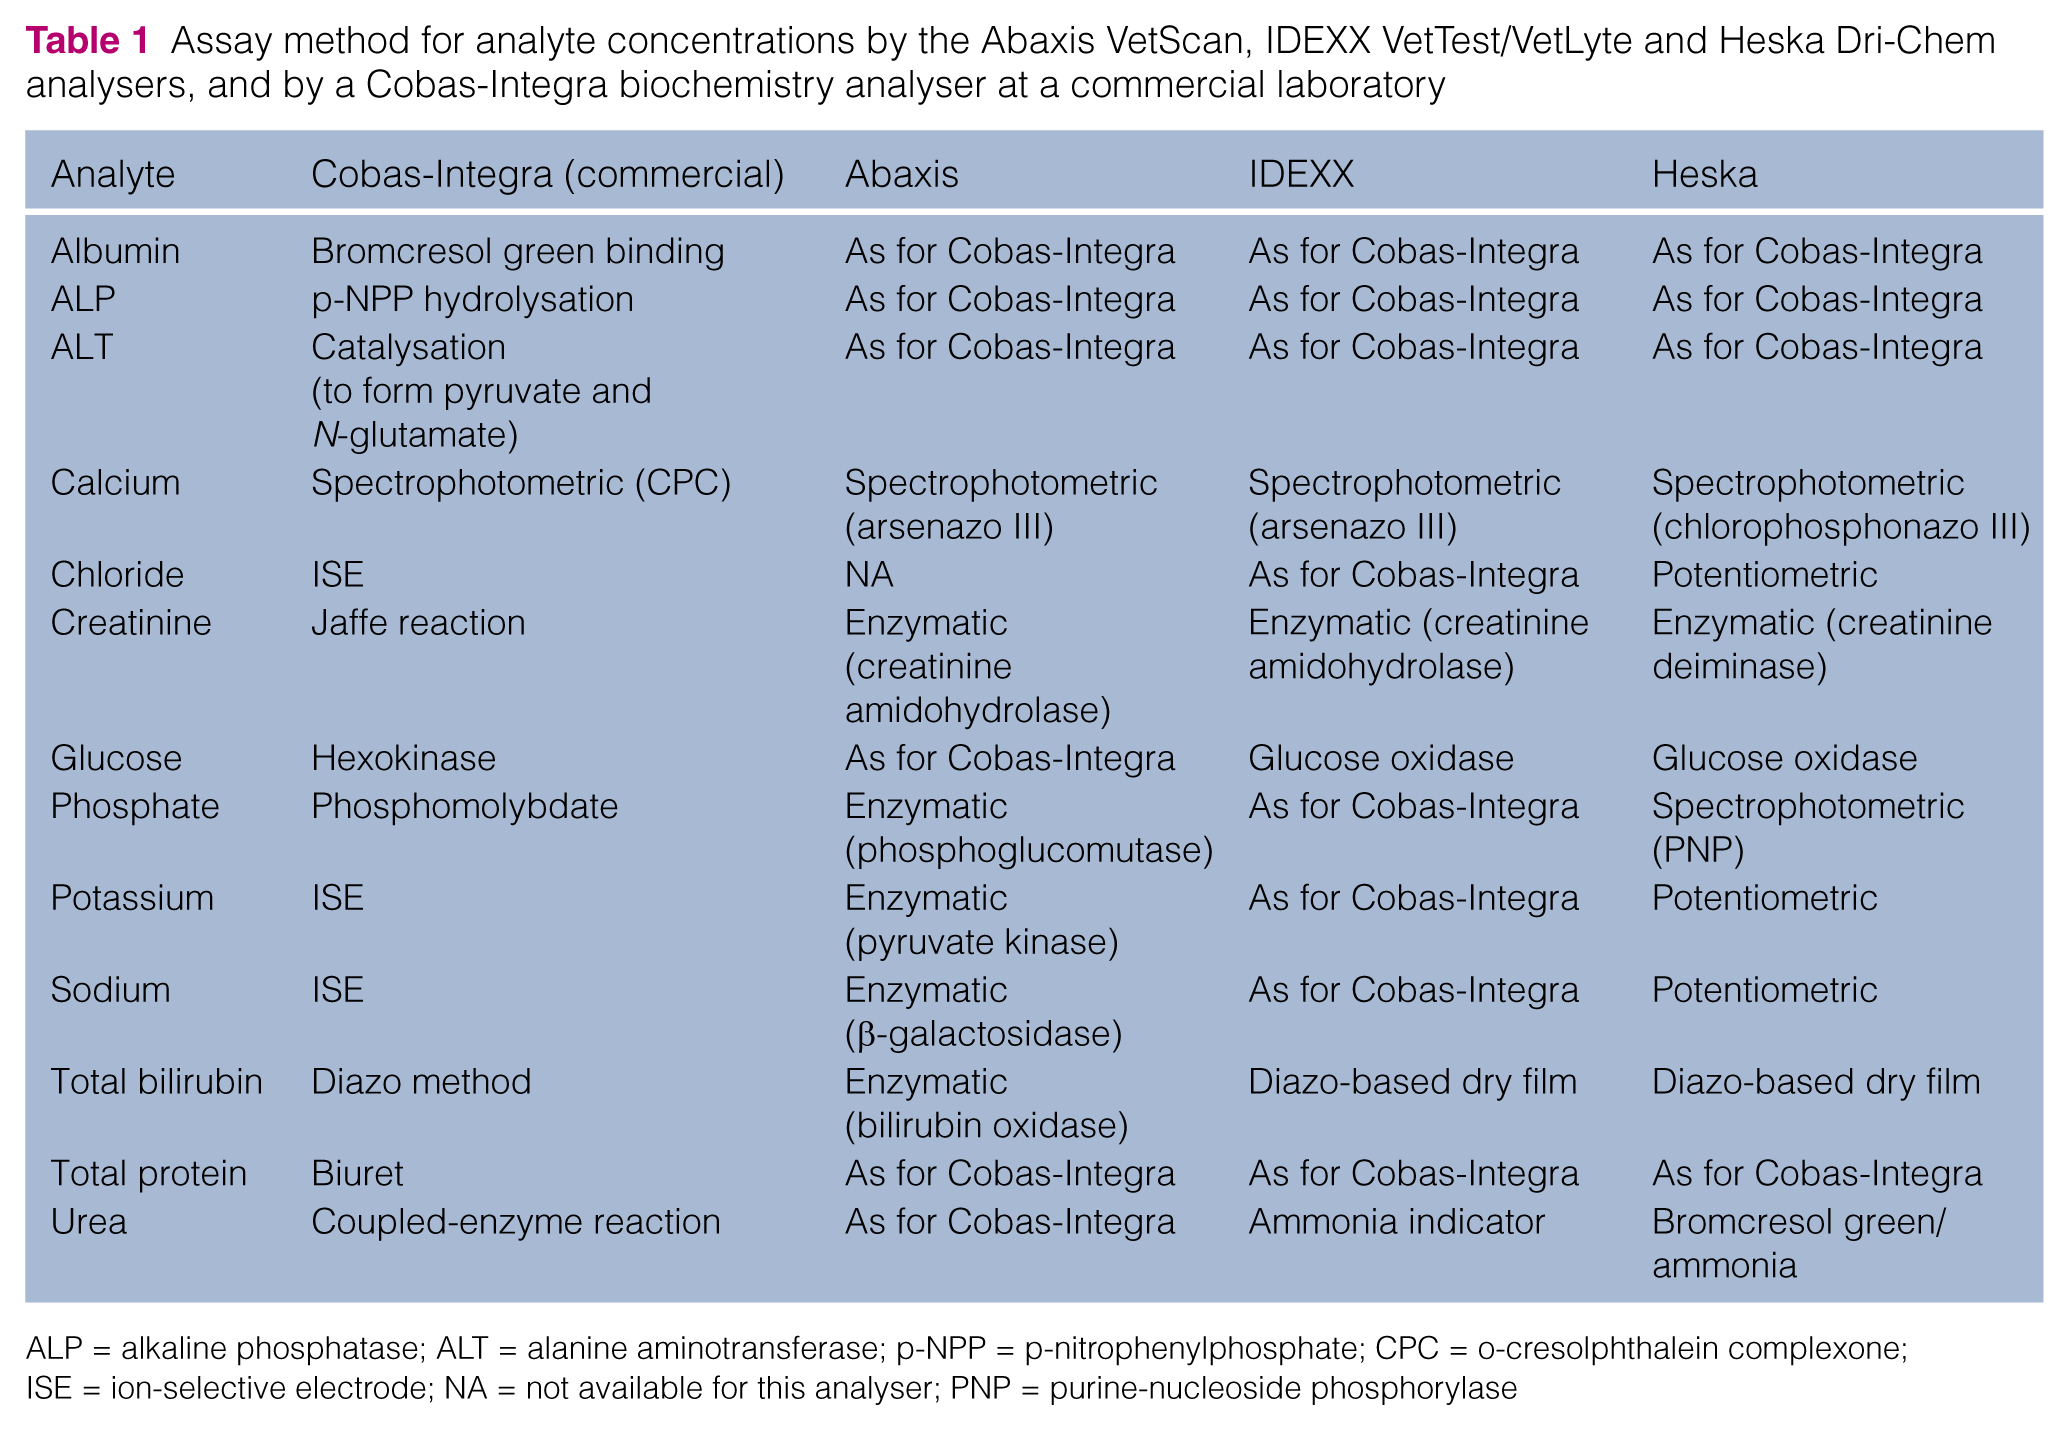
ALP = alkaline phosphatase; ALT = alanine aminotransferase; p-NPP = p-nitrophenylphosphate; CPC = o-cresolphthalein complexone; ISE = ion-selective electrode; NA = not available for this analyser; PNP = purine-nucleoside phosphorylase
The Cobas-Integra 400 analyser at a National Association of Testing Authorities-accredited commercial laboratory (Gribbles Veterinary Laboratory, Rhodes, Sydney, Australia) underwent assay calibration (with concurrent verification) weekly to monthly (depending on the individual analyte) according to the manufacturer’s recommendations. Both Heska and Abaxis analysers were <1 year old and installed to the manufacturers’ specifications by the distributing agents. Although 10 years old, the IDEXX analysers had been serviced by the manufacturer 3 months prior to the assessment period. Formal assessments commenced after training by the distributing agent and after a familiarization period of at least 10 runs on each analyser. The precision of each analyser was assessed by within-day and between-day assessments over the study period.12
Assessments and statistical analyses
Outlying values were detected by the Tukey outlier identification method, which determines outliers based on the median and interquartile range (IQR). In brief, Q1, Q2 and Q3, respectively, represent the first, second and third quartiles of the distribution, and IQ = Q3 – Q1 is the IQR. Outliers are data <Q1–3 × IQ or > Q3+3 × IQ; suspect data are contained in the interval between Q1–3 3 × IQ and Q1–1.5 × IQ or between Q3+1.5 × IQ and Q3+3 × IQ. 13
Histograms of the results were prepared for each analyte on each analyser and assessed for normal distribution. Normality was also assessed by (1) skewness, 14 (2) the kurtosis test statistic, 15 (3) the Shapiro–Wilk test 16 and (4) the Anderson–Darling test. 17
Skewness is a measure of the asymmetry of the distribution; a zero value indicates that the values are relatively evenly distributed on both sides of the mean, typically (but not necessarily) implying a symmetric distribution. A value between –0.5 and 0.5 was considered indicative of symmetry. 14
Kurtosis measures the height and sharpness of the peak of the distribution relative to the rest of the data. Higher values indicate a higher, sharper peak; lower values indicate a lower, less distinct peak. The reference standard is a normal distribution, which has a kurtosis of 3. Excess kurtosis is presented in this study, for which a normal distribution is zero. The excess kurtosis test statistic describes how many standard errors the sample excess kurtosis is from zero and was calculated by dividing the sample excess kurtosis by the standard error of kurtosis. A value between –2 and 2 was considered indicative of symmetry; that is, if the kurtosis is greater than twice its standard error (positively or negatively), then the distribution is considered significantly different from a normal distribution. 15
The Shapiro–Wilk and Anderson–Darling tests are both goodness-of-fit tests (also called omnibus tests) that assess normality of a distribution.16,17 The null hypothesis for each of these tests is that the population is normally distributed so P values <0.05 reject the null hypothesis and indicate significant departures from normality. As there is controversy in the literature as to which omnibus test is preferable, two goodness-of-fit tests were used.
A summary of the normality parameters is provided in Table 2. A normal distribution was assumed if at least three of these four parameters indicated normality (and was consistent with visual inspection of the histogram).
Summary of the normality parameters. A normal distribution was assumed if at least three of these four parameters indicated normality (and was consistent with visual inspection of the histogram)

In those cases in which fewer than three of these parameters indicated normality, Box–Cox transformations18 were performed using the Box–Cox Normality Plot – Free Statistics Software Calculator. 19 A two-parameter Box–Cox transformation was used initially, but on the occasions that this failed to result in normally distributed data, a one-parameter Box–Cox transformation was used.
Using Genstat version 14.0 (VSN International), histograms were made to assess the resultant data, which were subjected to the same four tests of normality that were applied to the raw data.14-17
Reference Value Advisor was used to calculate RIs with 90% CIs for each analyte from each analyser by parametric (standard and robust) methods for both raw and transformed data, as well as non-parametric methods. 20 Only the technique determined by the ASVCP guidelines (for each individual analyte on each analyser) is presented in this paper.
The standard method assumes that the data distribution is Gaussian and uses ± 2 SD as the limits of the RI. The robust method assumes that the data distribution is symmetric without being necessarily Gaussian. It is built using robust statistics (median and median absolute deviation) that are less sensitive to outliers. This RI is obtained by a process that iteratively gives a smaller weight to data far from the central location. For the non-parametric method, observations are ranked according to size, and the 2.5 and 97.5 percentiles are obtained as the 0.025 (n + 1) and 0.975 (n + 1) ordered observations. If the estimated rank values are not integers, then linear interpolation is carried out.21 21
CIs were calculated using a non-parametric bootstrap technique within Reference Value Advisor.
Results were compared with the reference limits provided by the manufacturer by assessing if the provided RIs fell within the calculated 90% CIs.
Transference validation assessments
Twenty values from each analyte from each analyser were randomly selected using the random number generator from column function of Excel (Microsoft) on two separate occasions resulting in two sets of 20 random values. The number of values from each set falling within the provided and calculated RIs was identified. A RI was considered valid if one or two results were outside the interval. Transference is rejected if three or more results fall outside the RI; zero values falling outside the RI suggests that the RI is too wide and that its sensitivity in detection of abnormal individuals should be reassessed.2,10,11 Therefore, transference validation results were assessed both including and excluding zero values falling inside the range.
Results
The total number of samples assessed for each analyte (across all four analysers) varied between 39 and 52 owing to logistical reasons such as insufficient supply of test ‘slides’ on individual days, insufficient sample quantity, exceeding the provided number of tests or, on one occasion, instrument failure to report a result.
Glucose concentrations determined by the commercial laboratory for the first 12 samples collected were substantially lower than those from all three in-house analysers. These results were excluded because it was suspected that red blood cells were accidentally aspirated into the plasma (which would have minimal, if any, effect on the in-house analyser results as they were tested immediately).
For the remaining analytes, between zero and two outlying values were detected by the Tukey outlier identification method13 on each analyser but none were excluded as no clinical, preanalytical or analytical factors justifying their exclusion could be identified.
Basic descriptive statistics such as minima, maxima, means, medians and SDs of results from each analyser for each analyte are shown in Table 3.
Descriptive statistics for feline reference intervals for each biochemical analyte for each analyser

ALP = alkaline phosphatase; ALT = alanine aminotransferase; NA = not available for this analyser; SD = standard deviation
Normality assessments
The results of the normality assessments are shown in Table 4. Raw data for five analytes (albumin, creatinine, potassium, total protein and urea), were normally distributed from all four analysers (based on visual inspection of histograms and three parameters suggesting normality). A normal distribution was found for sodium on the Abaxis, IDEXX and Cobas-Integra analysers but not the Heska analyser. Additionally, raw data for chloride from the IDEXX and Cobas-Integra analysers were normally distributed.
Normality assessments (bold indicates normality). Positive values for skewness indicate skewed to the left, negative to the right. Results for Box–Cox transformed data only for those analytes for which raw data did not have a normal distribution. When Box–Cox transformation was performed, reference interval (RI) technique was determined from the transformed data. The terms used are described in Table 2

ALP = alkaline phosphatase; ALT = alanine aminotransferase; B-C = Box-Cox; NA = not applicable as technique determined from transformed data; N-P = non-parametric
Two-parameter Box–Cox transformations of data resulted in normal distributions for calcium and glucose from all analysers; ALT on the Abaxis, IDEXX and Cobas-Integra analysers; ALP on the IDEXX analyser; chloride on the Heska analyser; and phosphate on the Abaxis analyser.
One-parameter Box–Cox transformations resulted in normal distributions for ALP on the Abaxis analyser and chloride on the IDEXX analyser. Histograms from raw data and Box–Cox-transformed data for ALP on the Abaxis analyser are shown in Figure 1.

(a) Histogram of raw data for alkaline phosphatase (ALP) on the Abaxis analyser. Note the left skew (calculated as 1.9, notably greater than the allowable range of –0.5 to 0.5) and the high peakedness (kurtosis); excess kurtosis is any value >0, and this was calculated as 4.9. (b) Histogram of Box–Cox transformed data for ALP on the Abaxis analyser. Note that (compared with [a]) there is no longer any appreciable skew (calculated as –0.02), and excess kurtosis is greatly reduced to 0.5. This histogram was determined to be a normal distribution by both Anderson–Dowling and Shapiro–Wilk techniques
Normal distributions could not be obtained by transforming data for the remaining analytes: ALP on the Cobas-Integra and Heska analysers, ALT on the Heska analyser, phosphate on IDEXX, Heska and Cobas-Integra analysers, sodium on the Heska analyser and bilirubin on all four analysers.
RIs
Table 5 shows the RIs (with 90% CIs) calculated for each analyte assessed on each analyser using the appropriate technique chosen from normality test results on either raw data or Box–Cox transformed data, also depending on normality test results according to the ASVCP guidelines.11 Also included are the RIs provided by each manufacturer and the commercial laboratory. A tick or cross underneath the provided RI indicates that the provided reference values were within (tick) or outside (cross) the calculated 90% CIs from the appropriate calculated reference limit.
Calculated reference intervals (RIs; with 90% confidence intervals [CIs]) for each analyte assessed on each analyser using the appropriate technique chosen from normality test results on either raw data or Box–Cox (BC)-transformed data, also depending on normality test results. Also included are the RIs provided by each manufacturer and the commercial laboratory. A tick underneath the provided RI indicates that the provided reference points are within the calculated 90% CIs from the calculated reference limit, while a cross indicates that it is not within the calculated 90% CI from the calculated reference limit

ALP = alkaline phosphatase; ALT = alanine aminotransferase
Table 5 shows that, across all four analysers, only 29 of a possible 102 provided reference limits are within the calculated 90% CIs. The Abaxis analyser had 6/24 (25%), the IDEXX and Heska analysers each had 8/26 (31%), and the Cobas-Integra commercial laboratory analyser had 7/26 (27%) reference limits within the calculated 90% CIs.
Transference validations assessments
Transference validation assessment results are shown in Table 6.
Transference results: a reference interval (RI) was considered valid (in bold) if one or two results were outside the interval. Total number (and percentage) of RIs validated for each analyser, including and excluding zero values within the interval, are shown

NA = not available for this analyser
When results from both tests of random values are included and rejecting zero values falling inside the range, 37% (38/102) of the provided RIs were validated by transference: 46% (11/24) for the Abaxis analyser, 50% (13/26) for the IDEXX analyser, 42% (11/26) for the Heska analyser and 12% (3/26) for the Cobas-Integra commercial laboratory analyser. For the IDEXX analyser, there was notable variation between each set of random samples, with 31% (4/13) RIs validated from the first random set and 69% (9/13) validated from the second random set. No RIs were validated from the first random set of results when assessed for the Cobas-Integra commercial laboratory analyser RIs, and 23% (3/13) were validated by the second random set of results. There were 25% (25/102) assessments with more than four results falling outside the RI, and the maximum was 80% (16/20) for calcium assessed on the Cobas-Integra analyser from the second random set.
For the calculated RIs, the total percentage of validated RIs by transference from both random sets (when rejecting zero values falling inside the range) was 70% (71/102); by analyser: 71% (17/24) for the Abaxis, 73% (19/26) for the IDEXX, 77% (20/26) for the Heska and 58% (15/26) for the Cobas-Integra commercial laboratory analyser. Results were similar for each random set and all but two failures of this assessment were due to zero results falling outside the RI. The other two results were associated with three results falling outside the range.
When zero values falling inside the range are accepted, 72% (73/102) of the provided RIs are inside the range: 88% (21/24) for the Abaxis analyser 92% (24/26) for the IDEXX analysers, 62% (16/26) for the Heska analyser and 46% (12/26) for the Cobas-Integra commercial laboratory analyser.
For the calculated RIs, the total percentage of validated RIs by transference from both random sets (when accepting zero values falling inside the range) was 98% (100/102): 96% (23/24) for the Abaxis analyser, 100% (26/26) for the IDEXX analyser, 100% (26/26) for the Heska analyser and 96% (25/26) for the Cobas-Integra commercial laboratory analyser.
Discussion
This study is the first to assess calculated against provided RIs for in-house and commercial laboratory veterinary analysers. The major finding was that 72% of calculated RI limits varied significantly from the provided RIs, and in only 4/51 cases were both the upper and lower provided reference limits consistent with those calculated. This means that only 8% (4/51) of the provided RIs were validated for this hospital population of cats when assessing plasma. Additionally, only between 12% and 50% of provided RIs were validated by transference when rejecting zero values falling inside the range, and between 46% and 92% when accepting zero values falling inside the range. It is important to note that only 70% of calculated RIs were validated by transference, varying between 58% and 77% depending on analyser, when rejecting zero values falling within the range. All but one of the calculated RIs rejected by transference had no values within the range (meaning that it is a measure of 100% of healthy cats not 95% of healthy cats so the range is too wide) compared with 27 of the provided RIs rejected by transference as having too many results outside the range. Too wide a RI (zero values within the range) may result in false negative results as abnormal results may be considered normal.
Transference assumes that patient populations are comparable. This means that complete demographic information on the original reference sample group should be available so that it can be assessed if it corresponds to the demographics of the new population.2,10,11 Enquiries to the manufacturers of the in-house analysers and the commercial laboratory for specific details of how the provided RIs were calculated were unrewarding. Transference validation should not be considered as a substitute for correct calculation of RIs and its use should be limited to circumstances in which the complexity, cost, effort and obtaining of sufficient number of adequate specimens precludes de novo production of RIs. 22
Poorly defined RIs can result in false positive results (if a range is too narrow) or false negative results (if a range is too wide). For example, the 30% disparity between the provided and calculated reference limit when using the commercial laboratory analyser for calcium could mean numerous cats were interpreted as hypercalcaemic, which may have meant unnecessary additional blood samples being taken to confirm hypercalcaemia, assess ionized calcium and parathyroid hormone levels to determine the cause, as well as potentially unnecessary treatment. Conversely, the 20% disparity between calculated and provided reference limits for urea on the IDEXX analyser could mean prerenal azotaemia is not recognised, and a patient may fail to receive appropriate treatment.
For all analysers, the provided upper reference for ALP was higher than those determined by this study; these differences are of a sufficient degree that cats with slight increases in ALP could be missed based on the provided RI. This is particularly important in the cat in which even small increases in ALP may be significant owing to the short half-life (6 h) of this enzyme compared with other species. 23
The calculated lower reference limits for albumin were significantly higher than the provided reference limits for all analysers. This could result in failure to identify animals with slight decreases in albumin, which may be important for diagnosis, prognosis, greater concentrations of unbound therapeutic drugs and/or need for further monitoring.
The variation between the provided and calculated reference limits did not always show the same trend for all analysers. The generated upper reference limits for ALT were higher than the provided reference limit for two analysers (Abaxis and Heska) and lower for two (IDEXX and the Cobas-Integra commercial laboratory analyser). Moderate elevations would be missed when the provided reference limit is lower and considered abnormal in those cases it is higher.
Reference Value Advisor uses the Anderson–Darling technique to test for normality. Omnibus techniques like this are used to test for normality so that both kurtosis and skewness can be assessed together. However, no omnibus test is perfect.24,25 The authors chose to additionally test with another omnibus test (Shapiro–Wilk), and if there was any disparity between the two tests (as there was for albumin on the Abaxis analyser and sodium on IDEXX analyser, the distribution of results of which were not considered normal for the Anderson–Darling test but were for the Shapiro–Wilk test), then the ‘raw’ descriptors of skewness and kurtosis both needed to indicate a normal distribution for the distribution to be considered normal. There is controversy in the literature as to which omnibus test is preferable. One study found the Anderson–Darling test to be conservative. 26 A recent study found the Shapiro–Wilk technique to be the most powerful test, followed by the Anderson–Darling technique. 22 It has been previously recommended to use omnibus tests such as Shapiro–Wilk with kurtosis and skewness, as done in this study. 25
Subject-based RIs (reference change values) have recently been advocated to assess veterinary clinical pathology results.11,27 A recent study demonstrated that reference change values are more appropriate to use than RIs for most feline biochemistry analytes. 28
Conclusions
This study demonstrates that many RIs for cats provided by in-house biochemistry analyser manufacturers or commercial pathology laboratories are not applicable to the population of cats sampled for this study and therefore not necessarily applicable to the patient population of other veterinary practices. To avoid under- or overdiagnosis of pathology, practitioners should look to determine RIs for the population of their practice and/or use reference change values when assessing their patients’ clinical chemistry results.
Footnotes
Acknowledgements
The authors would like to thank Dr Kathleen Freeman for her expertise, guidance and support, as well as Gribbles Pathology (Heska Dri-chem and commercial laboratory), IDEXX Pathology and REM Systems (Vetscan) for providing analysers and analytes, and allowing independent scrutiny of their products.
Conflict of interest
The authors do not have any potential conflicts of interest to declare.
Funding
This research received no grant from any funding agency in the public, commercial or not-for-profit sectors.