
Abstract
Standard protocol for splenic measurement is warranted to aid in interpretation when sonographically imaging the spleen of cats. The purpose of this study was to describe the appearance and size of healthy cat spleens, and to develop a standard method of evaluation. Data were obtained from 31 clinically healthy non-sedated cats with no sonographic abnormalities. The sonographic appearance of the spleen’s relative echogenicity compared to the left renal cortex and the hepatic parenchyma was recorded. Splenic height was measured at three sites. Three measurements were determined at each site, and the mean value of these three measurements was determined and used for data analysis. A significance level of P <0.05 was used for analysis, which was performed using S-PLUS software (version 8.1). The mean proximal height of the spleen was 7.1 mm. The mean body sagittal height was 9.3 mm. The mean height of the tail of the spleen was 8.7 mm (95% confidence interval). The splenic parenchymal echogenicity was less than the left renal cortex echogenicity and greater than the liver in 17/31cats; less than the left kidney cortex and equal to the liver in 5/31cats; equal to the cortex of the left kidney and greater than the liver in 5/31 cats; equal to the liver and renal cortex in 2/31 cats; and less than the liver and kidney with the renal cortex less than the liver in 2/31 cats. The protocol recommended for consistent evaluation of the spleen in the cat includes three specific measurements.
Introduction
There is one report in the literature on the sonographic appearance of the normal spleen in cats.1,2 The spleen is frequently affected by systemic and or focal disease.1–4 When the spleen is infiltrated, the size, shape or margins are often affected.1,2,5–7 Diseases affecting the spleen may exhibit changes in splenic internal architecture manifested either by a focal or diffuse distribution and internal architecture change, or only be apparent as an increase in splenic size.
Ultrasonography is a useful diagnostic modality to aid in detecting significant splenic parenchymal changes.3,4,8–11 The sonographic appearance of various abnormal spleens in the cat and dog have been reported in the literature. However, there are few reports in the literature on the sonographic appearance of the spleen in healthy cats and there has not been a defined methodology or established protocol for measuring the feline spleen.12–15 Two similar reports documented the size of the normal spleen in healthy anesthetized cats; however, a defined protocol for splenic measurement was not included.1,2,16
Owing to the relatively similar overall size of the domestic cat, this paper used the hypothesis that the normal feline spleen would have a relatively consistent size. It was proposed that the overall shape of each spleen is not uniform, but the non-uniform shape is fairly consistent among cats. A dependable location of measurement to ensure accurate, repeatable values, and a protocol including a standardized method of evaluation and a reference range of the size of the spleen would be useful in the sonographic assessment of patients. This information may then be useful in recognizing disease that has affected the size of the spleen.
The purpose of this study was to describe the appearance and size of the spleen in healthy cats, and to develop a standard method of evaluation of the spleen that would be useful as a reference when evaluating the spleen in the cat.
Materials and methods
Data obtained from 31 cats volunteered for the study by staff, students and faculty were included in the study and met Institutional Animal Care and Use Committee-approval protocols. The age and weight ranges of the cats were 3–10 years and 3–7 kg, respectively. Inclusion criteria included cats that were clinically healthy and had no identified sonographic abnormalities. No sedation was given, and aspirates of the spleen were not obtained. Complete blood count (CBC) results obtained for 15 of the 31 cats that were involved in a separate and unrelated study were normal. Each cat was placed in right lateral recumbency and underwent a focused ultrasound examination of the entire spleen and surrounding organs. The image of the spleen was optimized following ample application of alcohol and ultrasound gel to the skin. A 13.5 MHz linear transducer (Siemens Anatares) was used to image the spleen with the following parameters: tissue harmonic imaging (THI) 5 MHz, mechanical index (MI) 0.8, dB 55–60 and a depth of 2.5–4.0 cm. A single focal zone was placed at the level adjacent to the far margin of the spleen. The gain was adjusted to optimize the image. Multiple single, B-mode, images and videos of the spleen and surrounding organs were recorded. The entire spleen was scanned in both longitudinal and transverse imaging planes. The sonographic appearance of the internal splenic architecture was recorded and the relative echogenicity of the spleen was compared to the near-field image of the left renal cortex perpendicular to the incident beam and to the adjacent hepatic parenchyma. Using the split-screen function on the ultrasound machine, images comparing the different organs were recorded. A comparison of the echogenicity of the three organs from the most to least was made.
A gross spleen from a cat euthanased as a result of vehicular trauma was used to show the normal shape and appearance of the cat spleen. The shape was used in selecting the location for the reference measurements (Figures 1 and 2). The proximal third of the spleen is uniformly the same size and, owing to the stabilization provided by ligaments to the adjacent stomach and the landmarks of the left kidney and stomach in the left lateral and dorsal abdomen, this section of the spleen was easily identified.

Gross images of a feline spleen showing the variability in its shape. (a) Anti-mesenteric surface; (b) mesenteric surface, with the vessels located centrally. The proximal portion of the spleen (head) is at the upper left of the image and the wider, more variable distal section (tail) is at the bottom right of the image. The distal extremity (tail) is the widest portion of the spleen

These three sections of the spleen represent the three regions and planes the measurements were acquired from. (a) Transverse plane of the head (proximal) of the spleen; (b) transverse plane of the tail of the spleen; (c) sagittal plane of the mid-body of the spleen
Three areas of the spleen were selected to obtain measurements (Figure 3): the head (proximal extremity –proximal third), the body (mid-portion – central third) and the tail (distal extremity – distal third). The height (perpendicular measurement across the spleen from the mesenteric to anti-mesenteric surfaces) in each location was measured. For the head and tail locations, measurements of the height of the spleen were obtained from a transverse plane. In an attempt to afford a consistent measurement of the height of the spleen, the images of the transverse views of the head and tail of the spleen were made when the spleen appeared as a triangle with a splenic vein radicle clearly visible on the mesenteric surface. One measurement curser was placed along the mesenteric surface of the spleen adjacent to but not within the indentation from the splenic vein radicle and adjacent adipose tissue. The second cursor was placed directly across the spleen perpendicular to the long axis on the anti-mesenteric surface of the spleen. To avoid an oblique cross-sectional plane through the spleen, an attempt was made to have an equal distance from the medial and lateral borders of the width of the spleen to the splenic radicle. This also assumes there is splenic symmetry. This afforded a relatively triangular shape to the cross section of the spleen (Figure 4). The point of the triangle on the mesenteric surface was the location of the splenic veins coursing from the splenic parenchyma. The long axis of the triangle was the anti-mesenteric surface of the spleen. The third region of measurement was made from a longitudinal (sagittal) plane through the body of the spleen. The mid-body sagittal imaging plane was such that the splenic radicles were evident on one margin of the spleen. It was more difficult to add obliquity to this view. The measurement was similarly made from a clearly defined splenic radicle to the opposite surface perpendicular to the long axis of the spleen. Three measurements were determined at each of the three sites, and the mean value of these three measurements was determined and used for data analysis. Measurements were made at the time of acquiring the images and were obtained using the imaging measurement function within the machine. Furthermore, three separate images were acquired in each location and measurements were made from each of these sites. Data were analyzed using descriptive and inferential methods of analysis. For descriptive purposes, data were summarized as the mean and SD of the measurements for a given site, along with the maximum and minimum value. Data were also plotted for descriptive purposes. For inferential analysis, paired Student t-tests were used to compare the differences in heights between each of the sites evaluated. A significance level of P <0.05 was used for analysis, which was performed using S-PLUS software (version 8.1; TIBCO).
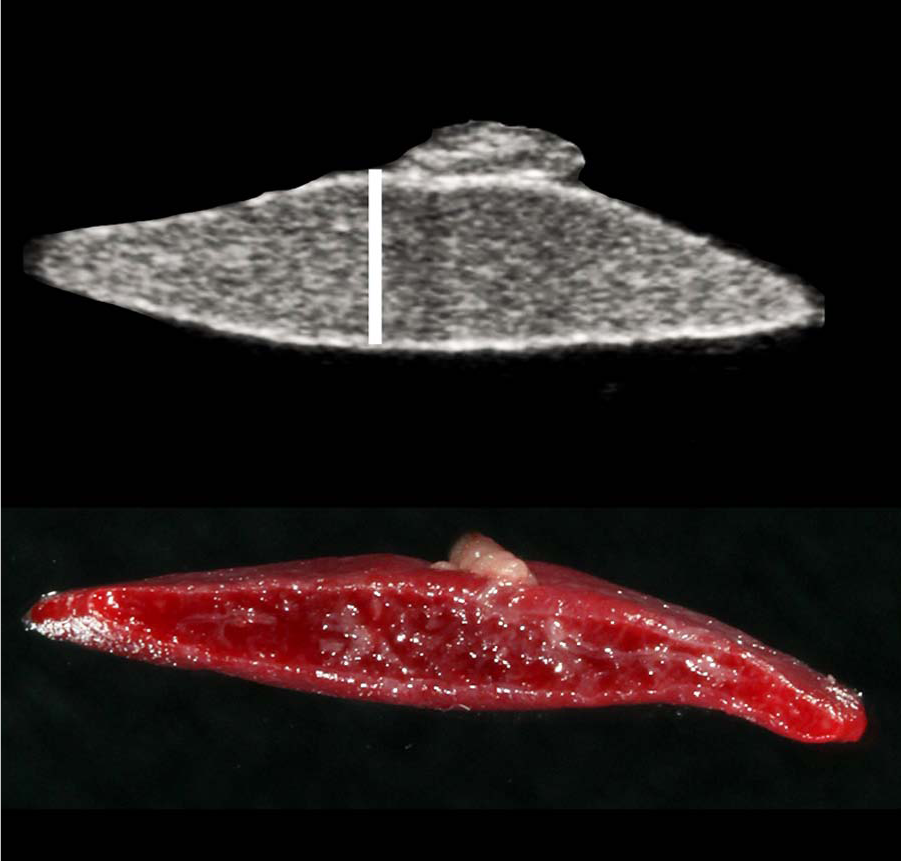
Transverse view of the gross section of the spleen compared to the corresponding transverse sonographic image. The white bar in the ultrasound image adjacent to the location of the splenic vein exiting the mesenteric surface of the spleen depicts the desired location for the measurement of the height of the spleen. Identifying the vessel on the mesenteric surface and using the vessels as a landmark aids in consistent measurement of the height of the organ

Nine sections were made through the spleen following ultrasonographic examination. The gross sections correspond to a similar location on the ultrasound image. The mesenteric margin of the spleen is on the top surface of each image. There is a progression of the sections from the proximal extent (head) to the distal extremity (tail) of the spleen. Number 1 corresponds to the proximal (head) and number 9 corresponds to the distal extent of the spleen (tail). Note the variability in the shape and size of the spleen. The most consistent region to obtain a height measurement was the proximal extent of the spleen (head); sections 1 and 2
Results
The mean (SD) of the height of the head (proximal) of the spleen was 7.1 mm (± 1.19 mm; range, 5.1–9.1 mm). The mean (SD) of the sagittal height of the body of the spleen was 9.3 mm (± 1.51 mm; range, 6.0–12.8 mm). The mean (SD) of the height of the tail (distal) of the spleen was 8.7 mm (± 1.51 mm; range, 6.3–12.4 mm).
The measurements of the head (proximal) and transverse image of the spleen were significantly (P <0.0001) less than those of the body sagittal portion. Values for the head (proximal) portion had a smaller range (4.1 mm, from 5.1 to 9.1 mm) than the sagittal body region (6.8 mm, from 6.0 to 12.8 mm) and a smaller SD (1.19 mm vs 1.51 mm); the head (proximal) measurement was smaller than the sagittal measurement in all 31 cats.
The measurements of the transverse image of the head (proximal) of the spleen were significantly (P <0.0001) less than those of the transverse image of the tail (distal) of the spleen. Values for the head (proximal) had a smaller range (4.1 mm, from 5.1 to 9.1 mm) than the tail (distal) (6.1 mm, from 6.3 to 12.4 mm) and a smaller SD (1.19 mm vs 1.51 mm); the head (proximal) measurement was smaller than the tail (distal) measurement in all 31 cats.
The sagittal height measurements of the body of the spleen were significantly (P = 0.0450) greater than those of the transverse images of the tail (distal) of the spleen; however, for more than 25% of cats, the difference between the mid-body and tail was negative [ie the tail (distal) measurement was greater than the body of the spleen]. The difference in measurements between these two sites was relatively small (<0.5 mm) (Figure 5).

Box plots of spleen heights at three locations in 31 cats: the left panel displays the proximal (head) transverse heights, the center panel displays the mid-body sagittal heights and the right panel displays the distal extremity (tail) heights. The red boxes extend from the 25th percentile (bottom of the box) to the 75th percentile (top of the box), thereby encompassing the central 50% of the data. The white line in the middle of each box is the median. The dotted lines extend to a value of 1.5 times the interquartile range. The uppermost thin horizontal line in the center panel represents a value outside the 97.5th percentile. It can be noted that the mid-body sagittal and distal extremity (tail) transverse heights tend to be larger values and have a greater range (dispersion) than the proximal (head) transverse heights
The splenic parenchymal echogenicity was less than the left renal cortex echogenicity and greater than the liver in 17/31cats (S<K>L); less than the left kidney cortex and equal to the liver in 5/31cats (S<K=L); equal to the cortex of the left kidney and greater than the liver in 5/31 cats (S=K>L); equal to the liver and renal cortex in 2/31cats (S=K=L); and less than the liver and kidney, with the renal cortex less than the liver, in 2/31 cats (K<L>S).
Discussion
The spleen is a very dynamic organ that performs both filter and storage functions.2,3 The spleen originates in the left cranial abdomen.7–9 The head of the spleen is anchored to the stomach via the gastrosplenic ligament and lies adjacent to the gastric fundus, the cranial pole of the left kidney and the left body wall.7–9 The body and tail are freely movable, but less so in the cat when compared with the dog. 7 The spleen has a ‘tongue-like’ shape, with the tail wider than the head or body. In cross - section, the spleen has a triangular appearance. The vessels enter and exit the spleen on the mid-portion of the mesenteric surface, close to the midline in the head and neck with more variability positioned in the tail.
The feline splenic contour and overall size may be interrogated via radiographs. The feline spleen is best visualized on the ventrodorsal view in the left cranial abdomen. In comparison with the dog, the feline spleen is smaller. The head and body are in close apposition to the caudolateral margin of the greater curvature of the stomach. The tail of the spleen may extend a relatively small distance along the left lateral body wall or rightward.
The sonographic appearance of the normal spleen has been described as having a thin, smooth, hyperechoic, capsular surface with sharp and well-defined margins. The mesenteric surface is often more irregular in contour with indentations at the points of egress of splenic vein radicles. In cross-section the spleen is triangular in shape with the intra-parenchymal splenic veins coursing longitudinally through the parenchyma with the exiting radicles positioned on the central midline on the mesenteric surface of the spleen. The multiple smaller splenic arteries entering the mesenteric surface of the spleen are not easily identified on the B-mode images, but are identified with color Doppler imaging. The spleen has a dense, homogeneous, fine granular texture.8,9 The parenchyma has been reported to be more echogenic than the liver and kidney.7,9,10 Other reports have indicated that the renal cortex is often more echogenic than the splenic parenchyma owing to normal accumulation of lipid in the tubules of the cortex of the feline kidney.16,17 Vacuolar change in the liver due to fat deposition may change the relative echogenicity of the liver compared, with the spleen increasing the echogenicity of the liver. 18 Hyperechoic, focal and nodular areas located around or adjacent to splenic vessels along the margin of the mesenteric surface of the spleen are sometimes present within the parenchyma and are consistent with fat accumulation, reported as lipomatosis or myelolipomatosis.13,15,17,19,20
The function of the spleen is to filter out damaged and aged red blood cells. Compared with dogs, cats have very little peri-arterial lymphatic tissue, with the lymphatic tissue being confined to the nodules of the white pulp. 19 The splenic arteriolar capillaries in the cat uniquely empty directly into the reticular meshwork of the splenic red pulp, thus classifying the feline spleen as non-sinusoidal. This non-sinusoidal feature makes the feline spleen less capable of storing large volumes of blood. The dog’s sinusoidal spleen allows for greater capacity to store blood and thus a potential larger variation in splenic size. 10 This anatomical difference suggests that splenomegaly is less likely to be a physiological response in the cat than in the dog.1,5 Thus, an enlarged spleen in the cat may be more clinically relevant. Various diseases can cause diffuse splenic enlargement in cats: extramedullary hematopoiesis; nodular hyperplasia; infection, such as mycobacterial; fungal disease, such as histoplasmosis; neoplastic infiltrates, such as mast cell tumor, plasma cell tumor or lymphosarcoma; acromegaly; and vascular compromise can all cause splenomegaly. 7 Anemia or passive venous congestion secondary to liver disease has been reported to cause an enlarged spleen. Palpable splenomegaly is often easily appreciated in cats, but is a non-specific finding that warrants further investigation via ultrasongraphy. 5
Ultrasonographic assessment of the feline spleen can be objective because the spleen’s shape and size is relatively constant in the domestic feline population. Consistent organ views play an important role in obtaining images useful in diagnosis. The spleen, located superficially along the left body wall, is easily accessed and imaged with high-resolution transducers. If the spleen’s echo texture and overall echogenicity is compared with the adjacent renal cortical and hepatic parenchyma, the spleen has a finer echo texture than that of the liver. 5 The relative echogenicity of the spleen should be compared to the mid-portion of the adjacent left renal cortex, perpendicular to the incident beam and not from the poles of the kidney to avoid artifactual echogenic dropout. The focal zone is placed at the area of comparison and care should be taken to apply minimal pressure on the transducer. In the present study, the spleen was inconsistent in relative echogenic appearances when compared with the reference organs, but was more frequently hyperechoic to the liver parenchyma and hypoechoic to the renal cortex.
The decision to biopsy or perform a fine-needle aspiration of the spleen can be based on the findings of splenomegaly in the cat. 5 As the data in this paper demonstrated that the measurements of the spleen can vary based on the area interrogated, accurate assessment of the size of the spleen relies on where feline splenic measurements are obtained. Measurements that are performed using the same method and at the same location each time are more likely to obtain accurate, reliable and comparable results. The tail of the spleen had the most variability in size. If a transverse view through the tail of the spleen is measured, the variable and increased size may not be as specific in detecting true splenomegaly. Measurement of the splenic height from the sagittal plane also gives more variable results. These areas of measurement may erroneously suggest disease in a healthy cat. The transverse view of the tail or sagittal plane of the body of the spleen may be used to judge echogenicity, but measurements in those areas should be avoided unless comparing directly as a follow-up examination. A recent study evaluating the size and appearance of the normal feline spleen measured the height of the spleen from a transverse plane of the body of the spleen. 1 The measurements from that study were 8.2 ± 1.4 mm, with a range of 5.3–11.1 mm. There was an increased range and the mean height was increased when compared with results of the measurements of the head of the spleen in this study. The results were similar to the tail or the sagittal images of the body of the spleen on the current exam [the mean proximal height of the head of the spleen was 7.1 mm (± 1.19 mm; range, 5.1–9.1 mm); the mean sagittal height of the body was 9.3 mm (± 1.51 mm; range, 6.0–12.8 mm); the mean height of the tail of the spleen was 8.7 mm (± 1.51 mm; range, 6.3–12.4 mm)]. The increased size and range differences may be attributed to the larger number of cats in the previous study study (60 cats vs 31 in the current study). It is speculated that the increased range and slightly increased median size may have been due to the measurements being taken in the body of the spleen (central third) instead of the proximal extremity (proximal third). Each study lacks histopathology to confirm that the spleens were not reactive or without pathology. The 60 cats were used as blood donors, and the chronic blood loss may have contributed to an increase in size of the spleen. A limitation of the present study population was that only half the subjects had CBCs performed owing to financial constraints.
The appearance of the echogenicity of the spleen relative to the kidneys in this study was similar to an original study performed by Reese et al. 1 In that latter study the spleen was reported as either isoechoic (77%) in castrated male cats or hyperechoic (80% of spayed female cats). In the present study, the spleen was less echogenic than the left kidney cortex in 22/31 cats, greater than the kidney in five and less than the kidney in only three cats. This finding is consistent with the hyperechoic appearance from lipid accumulation in the cortex of the feline kidney. Unlike liver and kidney disease, in which laboratory work may be a helpful indication of pathology despite a normal sonographic appearance, the spleen offers minimal specific hematologic abnormalities to confirm splenic disease and or pathology.2,4–6
Distinguishing between normal, benign and neoplastic disease via ultrasonography based on the sonographic appearance can be a challenge. A normal-appearing spleen may still be cytologically abnormal. However, a spleen that is enlarged or sonographically abnormal in appearance is more likely to be clinically significant. Aspirates of the spleen are often elected to be conducted based on the abnormal appearance of the organ. Definitive diagnosis of splenic disease may require a cytological and or histological evaluation.2,5 Fine-needle aspirations have been shown to have a low incidence of complications, such as hemorrhage or needle cellular seeding in humans. 9 In one study of 101 cats with splenic disease, a fine-needle biopsy of fine-needle aspirate yielded diagnostic samples in 81/91 cats. 3
An enlarged or abnormal architecture observed in the spleen via ultrasonography in feline patients warrants further investigation. By accurately measuring the feline spleen in a precise location, and consistently in the same fashion, the information can provide the clinician with valuable discerning information. If identified, subtle splenomegaly can indicate the presence of a potential disease process that may be diagnosed via fine-needle aspiration. With this information, a diagnosis can be obtained and response to therapy followed. Limitations of this study were the relatively small sample size and no cytological confirmations of normality obtained from the normal spleen. All cats were evaluated and presumed to be normal. The results are a range. If the measurement is outside this range or greater than the 95% confidence interval it is more likely to be abnormal, and if it is within this normal range it is more likely to be normal. These numbers are an aid and need to be considered with a full evaluation of the patient.
Conclusions
The protocol recommended for consistent evaluation of the spleen in the cat includes measuring the height of the proximal third of the spleen in a transverse plane when a splenic vein radicle is apparent on the mesenteric surface. The normal splenic mean height in cats is 7.1 mm, with values ranging from 5.1 to 9.1 mm. This may suggest a spleen larger than 9.1 mm would indicate splenomegaly and would, in combination with other sonographic findings and evaluation of the entire patient, warrant further evaluation and consideration of a splenic aspirate to determine the cause. The relative echogenicity of the spleen is variable, but frequently less than the kidney and greater than the liver. The protocol recommended for consistent evaluation of the spleen in the cat includes three specific measurements. This provided the most consistent and least varied results.
Footnotes
Acknowledgements
I graciously thank Dr. Noah Cohen for his time and expertise on the statistical portion of this article.
Funding
This research received no specific grant from any funding agency in the public, commercial, or not-for-profit sectors.
Conflict of interest
The author does not have any potential conflicts of interest to declare.
This paper was presented as an abstract at the American College of Veterinary Radiology’s 2013 Annual Scientific Meeting, Savannah, GA, USA