
Abstract
This is the first report concerning biological variation and reference change values of feline plasma biochemistry components in the peer-reviewed literature. Biological variation refers to inherent physiological variation of analytes. The ratio of individual biological variation to group biological variation is referred to as an analyte’s index of individuality. This index determines the suitability of an analyte to be assessed in relation to population- or subject-based reference intervals. A subject-based reference interval is referred to as a reference change value or critical difference, and is calculated from individual biological variation. Fourteen cats were sampled for plasma biochemistry analysis once weekly for 6 weeks. Samples were stored and then tested at the same time. Results were assessed in duplicate and coefficients of variation for each analyte were isolated to distinguish variation within each subject, between all subjects and by the analyser. From these results, an index of individuality and reference change values were determined for each analyte. Five plasma biochemistry analytes (alkaline phosphatase, alanine aminotransferase, cholesterol, creatinine and globulin) had high individuality and, therefore, subject-based reference intervals are more appropriate; only one analyte (sodium) had low individuality, indicating that population-based reference intervals are appropriate. Most analytes had intermediate individuality so population-based reference intervals should be assessed in relation to subject-based reference intervals. The results of this study demonstrate high individuality for most analytes and, therefore, that population-based reference intervals are of limited utility for most biochemical analytes in cats.
Introduction
Currently, veterinary clinical pathology results are assessed in relation to population-based reference intervals. 1 However, it is considered more appropriate to use ‘subject-based’ reference values to assess analytes that have a high degree of inter-individual variation because many unhealthy individuals may have values that significantly differ from their regular analyte determination, but fall within population-based reference intervals.2–4
Determination of ‘subject-based’ reference values requires knowledge of inherent physiological variation of analytes which is referred to as biological variation. 5
Suitability of an analyte to be assessed in relation to population- or subject-based reference intervals is determined by that analyte’s index of individuality, a ratio of individual biological variation to group biological variation. A subject-based reference interval is referred to as a reference change value (RCV) or critical difference, and is calculated from individual biological variation.5,6
Biological variation data are also vital to objectively assess imprecision,7,8 accuracy and total error 9 of laboratory equipment 10 as it is not possible to recognise the acceptable degree of variation occurring within equipment without knowing how much normal variation occurs within an individual for that analyte.
Although biological variation data have been generated for several blood components in dogs,11–13 cows 14 and budgerigars, 15 there are no biological variation data for any feline blood component published in the peer-reviewed literature.
The objectives of this study were to determine biological variation data of feline plasma biochemistry analytes and calculate indices of individuality and RCVs, as well as demonstrate the relevance of RCVs to feline medicine.
Materials and methods
Subjects
This prospective study was performed on client-owned cats maintained in their normal environment and being fed their regular diets. All cats were determined to be clinically healthy on the basis on physical examination and their owners’ weekly reports. Physical examination included determination of body weight, hydration status, heart rate and nature, and abdominal palpation. The study was approved by The University of Sydney Animal Ethics Committee.
Sampling
Blood was collected from 14 cats weekly for 6 weeks. Sampling occurred after an overnight fast of at least 10 h, and all samples were collected between 8:30 and 10:30 am, with cats sampled in a consistent order so that sampling occurred at approximately the same time of day for each cat.
Samples were collected by a single operator (RMB) from each cat by jugular venepuncture. Samples were collected using 23 G needles and 3 ml syringes, and immediately transferred to lithium heparin plasma collection tubes (BD Vacutainer; Becton Dickinson). Each tube was centrifuged at 4000 rpm (1790 × g) for 5 mins within 10 mins of collection before immediately decanting the plasma into plain (no additive) collection tubes (BD Microtainer; Becton Dickinson). Plasma samples were stored at −20°C for up to 6 weeks before thawing and analysis at a commercial veterinary laboratory (Gribbles, Bella Vista, NSW, Australia).
Laboratory methods
The following 20 biochemistry analytes were analysed in duplicate: albumin, alkaline phosphatase (ALP), alanine aminotransferase (ALT), aspartate transaminase (AST), bicarbonate, calcium, chloride, cholesterol, creatinine, creatinine kinase, gamma-glutamyl transferase (GGT), globulin, glucose, magnesium, phosphorus, potassium, sodium, total bilirubin, total protein and urea. All analytes were assessed using an Advia 1800 Clinical Chemistry System (Siemens Healthcare) on a single day by a single operator using single lots of reagents and calibrators for each analyte. The chemistry methods used by the Advia 1800 analyser for these analytes are provided in Table 1.
Chemistry methods used by the Advia 1800 analyser for biochemical analytes

IFCC = International Federation of Clinical Chemistry and Laboratory Medicine reference method; P5P = pyridoxal-5’-phosphate; ISE = ion-selective electrode; NAC = N-acetyl cystine; UV = ultraviolet; GLDH = glutamate dehydrogenase
Assessments and statistical analyses
Outliers were assessed for each analyte using Tukey’s outlier identification method using Reference Value Advisor (Ecole Nationale Vétérinaire, Toulouse, France). 16 Outliers were assessed for each analyte on three levels: across the entire group of subjects, for each subject individually and for individual subjects with outlying variability compared with the other subjects in the group.
Most outliers detected appeared to result from analytical or pre-analytical variation as these samples demonstrated considerable variation between duplicate samples from the same patient from the same day. In these cases, both duplicates were excluded. Any outliers that had a similar result for both duplicates from that subject for that day were retained, as the variation was assumed to be normal physiological variation as all cats maintained good health through the study duration.
Restricted maximum likelihood (REML) was used to estimate variance components by specifying analytes as outcome variables, subject identification and day (nested within subject identification) as random effects using Genstat version 14 (VSN International). Inter-individual or group variation (CVG), intra-individual variation (CVI) and the variation occurring between duplicates, or analytical variation (CVA) were then calculated from the variance components. Assumption of normality of residuals for REML was evaluated by visual inspection of histograms and normal plots of residuals.
For variables where the assumption of normality was valid, indices of individuality were calculated from CVs by the ‘reciprocal formula’ with CVG as the numerator (inverse index of individuality), ie, CVG /√( CVA 2+ CVI2 ), which results in higher values for increased intra-individual variation.5,6,13 With the traditional use of CVG as the denominator, indices of individuality ≤0.6 indicate that subject-based reference values are more appropriate (and population-based reference intervals are of limited utility) and indices ≥1.4 indicate population-based reference intervals are more appropriate. With the more intuitive inverse formula (CVG as the numerator) indices of individuality ≥1.67 indicate that subject-based reference values are more appropriate and indices ≤0.7 indicate population-based reference intervals are more appropriate.
RCVs were calculated for 95% confidence intervals in percentage terms according to RCV = Z. √2 . √( CVA 2+ CVI2 ). One- (Z = 1.65) or two-sided (Z = 1.96) results were calculated depending on whether the analyte is likely to require interpretation when concentrations are either high or low (one-sided) or for both high or low concentrations (two-sided).
For those analytes where results were not normally distributed, data were log-transformed (to base e) and then assessed in the same way as for the raw data, using residual diagnostics. CVs were then back transformed by CV = √(exp σ2 –1), as previously described.17,18 The RCV was calculated using the lognormal approach described by Fokkema et al. 17 Briefly, the ‘lognormal’ standard deviation was calculated from the untransformed CV such that σ = √log (CV2 + 1) for each of CVI and CVA; then, RCV was calculated as exp(+Z. √ [2. (σI2 + σA2)] for increasing values and as exp(–Z. √ [2. (σI2 + σA2)] for decreasing values, where Z = 1.65 when one-sided analysis is appropriate (interpretation of results only concerned with increased or decreased results) and Z = 1.96 for two-sided analysis (both increased and decreased results of significance), and, accordingly, these RCVs are not symmetrical.
The number of results with CVA < ½ CVI was assessed as an indicator of adequate precision. 19 The number of results with CVA < ½. √( CVI 2+ CVG2 ) was assessed as an indicator of whether analytical variation was sufficient to affect judgement of biological variation, individuality and therefore RCVs.19,20
Results
Cats were aged 5–17 years (median: 10 years; mean: 10 years 5 months); three were neutered males and 11 were neutered females. All cats were domestic shorthairs.
Of the 84 sets of duplicate results, the following analytes had exclusions owing to outliers: potassium (one exclusion), urea (one exclusion), creatinine (two exclusions), albumin (three exclusions), globulin (three exclusions), total protein (three exclusions), phosphorus (seven exclusions), calcium (nine exclusions), chloride (nine exclusions) and sodium (nine exclusions). Three cats had exclusions from 1 week’s testing, one cat had exclusions on 2 week’s testing, and one cat had exclusions on 3 week’s testing. Exclusions were from weeks two (affecting three cats), three and four (affecting two cats on each of these weeks) and weeks one and five (affecting one cat). A further 35 sets of results across 10 analytes were determined to be outliers (across all three levels assessed), but as the duplicate results were similar, these results were considered to be physiological variation and maintained.
Values for CVG, CVI and CVA were determined for all analytes; from these, indices of individuality were calculated (Table 2). All results for GGT (from all cats, all weeks and both replicates) were reported as <1 U/l and were tabulated as 0 U/l, meaning that the index of individuality could not be calculated.
Biological variation for each analyte expressed as coefficients of variation (CV) for between cats, or group variation (CVG) and within cats, or individual variation (CVI), within run variation of the duplicate samples or analytical variation (CVA), as well as the index of individuality (calculated as the more intuitive ‘reciprocal formula’). Bolded analytes and indices of individuality indicate high individuality so subject-based reference intervals are more appropriate
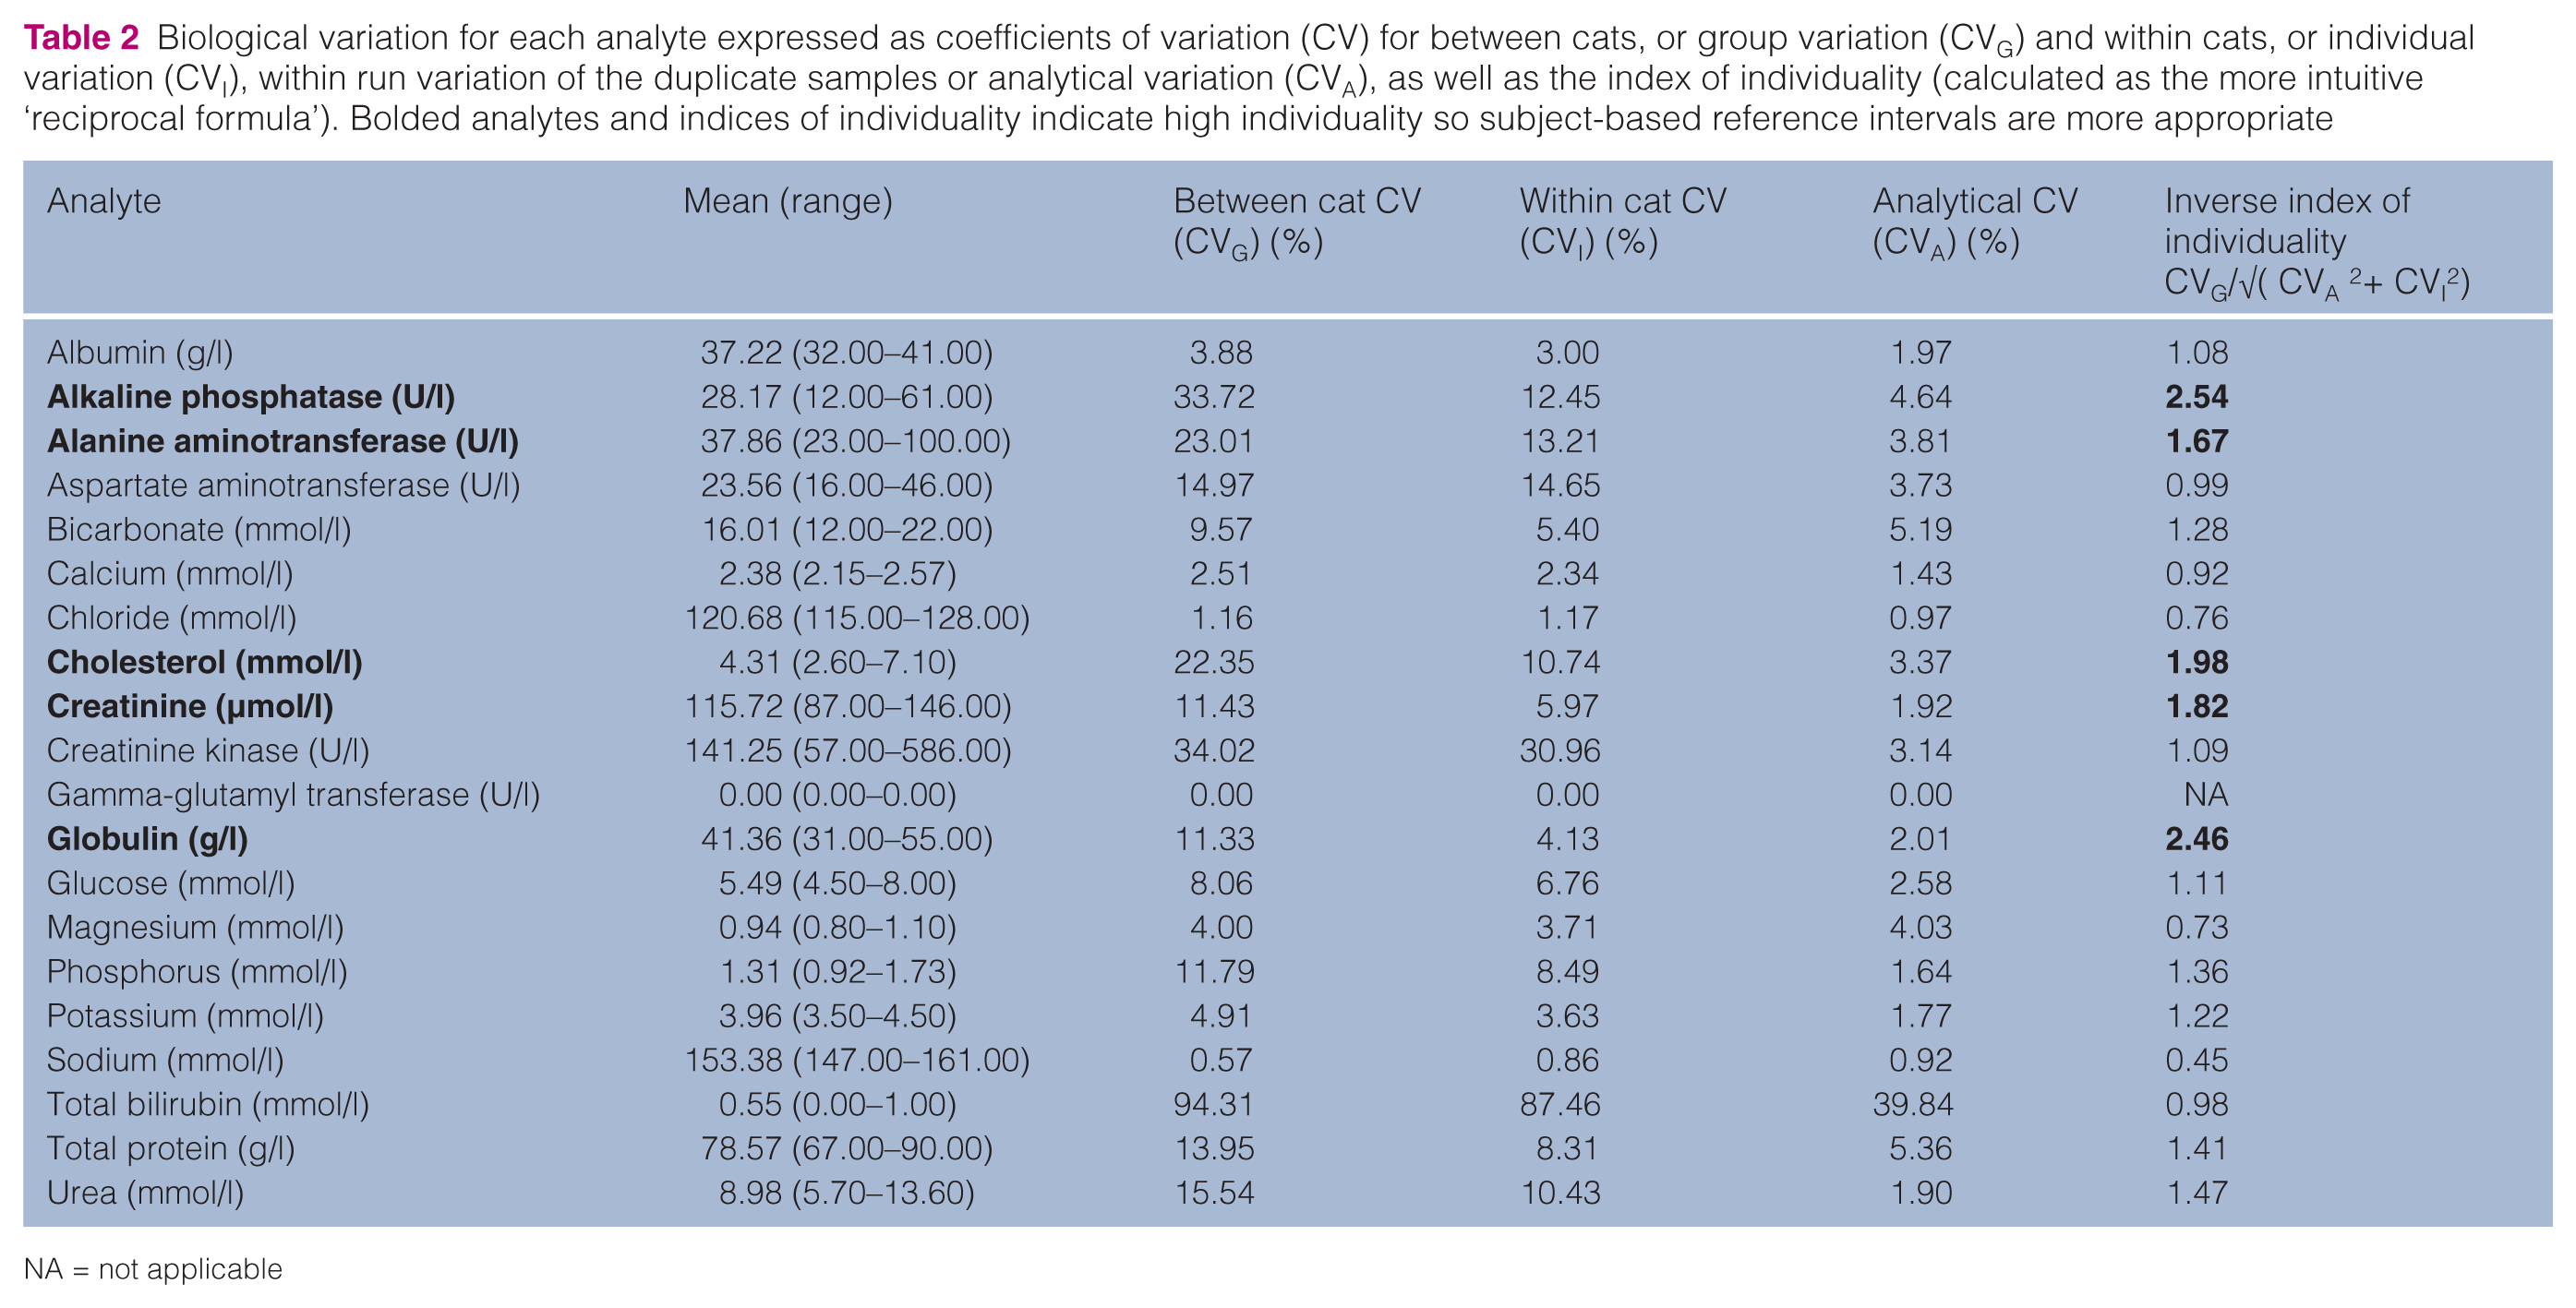
NA = not applicable
Analytical variation was less than half individual variation (CVA < ½ CVI) for 12 analytes (ALP, ALT, AST, cholesterol, creatinine, creatinine kinase, globulin, glucose, phosphorus, potassium, total bilirubin and urea), indicating adequate precision for these analytes. Analytical variation (CVA) was <½√( CVI 2 + CVG2 ) for all analytes except chloride, magnesium and sodium. For these three analytes, analytical variation may have been great enough to affect judgement of biological variation, individuality and therefore RCV. For GGT, all variation, including analytical variation, was zero.
Using the inverse index of individuality formula the highest individuality was recognised for ALP (2.54) and the lowest for sodium (0.45). Five analytes (ALP, ALT, cholesterol, creatinine and globulin) had an index of individuality ≥1.67, indicating that use of subject-based RCV is appropriate, and only sodium had an index of individuality ≤0.7, indicating that the use of population-based reference intervals is appropriate.
Normal distributions of residuals were found for 15/19 analytes (GGT not applicable); the exceptions were ALT, creatinine kinase, glucose and total bilirubin. Three of these had normal distributions from log-transformed values; the exception was total bilirubin. For total bilirubin, all raw results were either 0 or 1 U/l. In order to enable log-transformation, 0.1 U/l was added to all total bilirubin results and the distribution of the log-transformed results approached normality, but showed excess kurtosis (see Figure 1). For all of these analytes, CVs were back-transformed from the log-transformed values and RCV calculated by the lognormal approach, and therefore had differing values for increasing or decreasing values. 17

Residual plot for log-transformed results (to base e) for total bilirubin. The y-axis represents the percentage of results; the x-axis represents the standardised residuals of the log-transformed results. The normal trace represents the standard normal distribution curve for comparisons. The kernel trace represents a smoothed plot that approximates the probability density of the residuals. Although the curve appears to be normally bell-shaped, note that >60% of results are at the mean, which creates central peakedness (kurtosis) of the bell curve, indicating that this set of results approaches normality, but is not entirely normal
RCVs for all analytes are presented in Table 3. RCVs varied from 0% (ie, any change is significant) for GGT, to >360% for increases of creatinine kinase and total bilirubin (ie, serial samples must show a 3.6-fold increase to be significant). Important RCVs relevant for feline medicine include ALP with 31%, creatinine with 14.6% and potassium with 11.2%.
Reference change values for feline biochemistry analytes
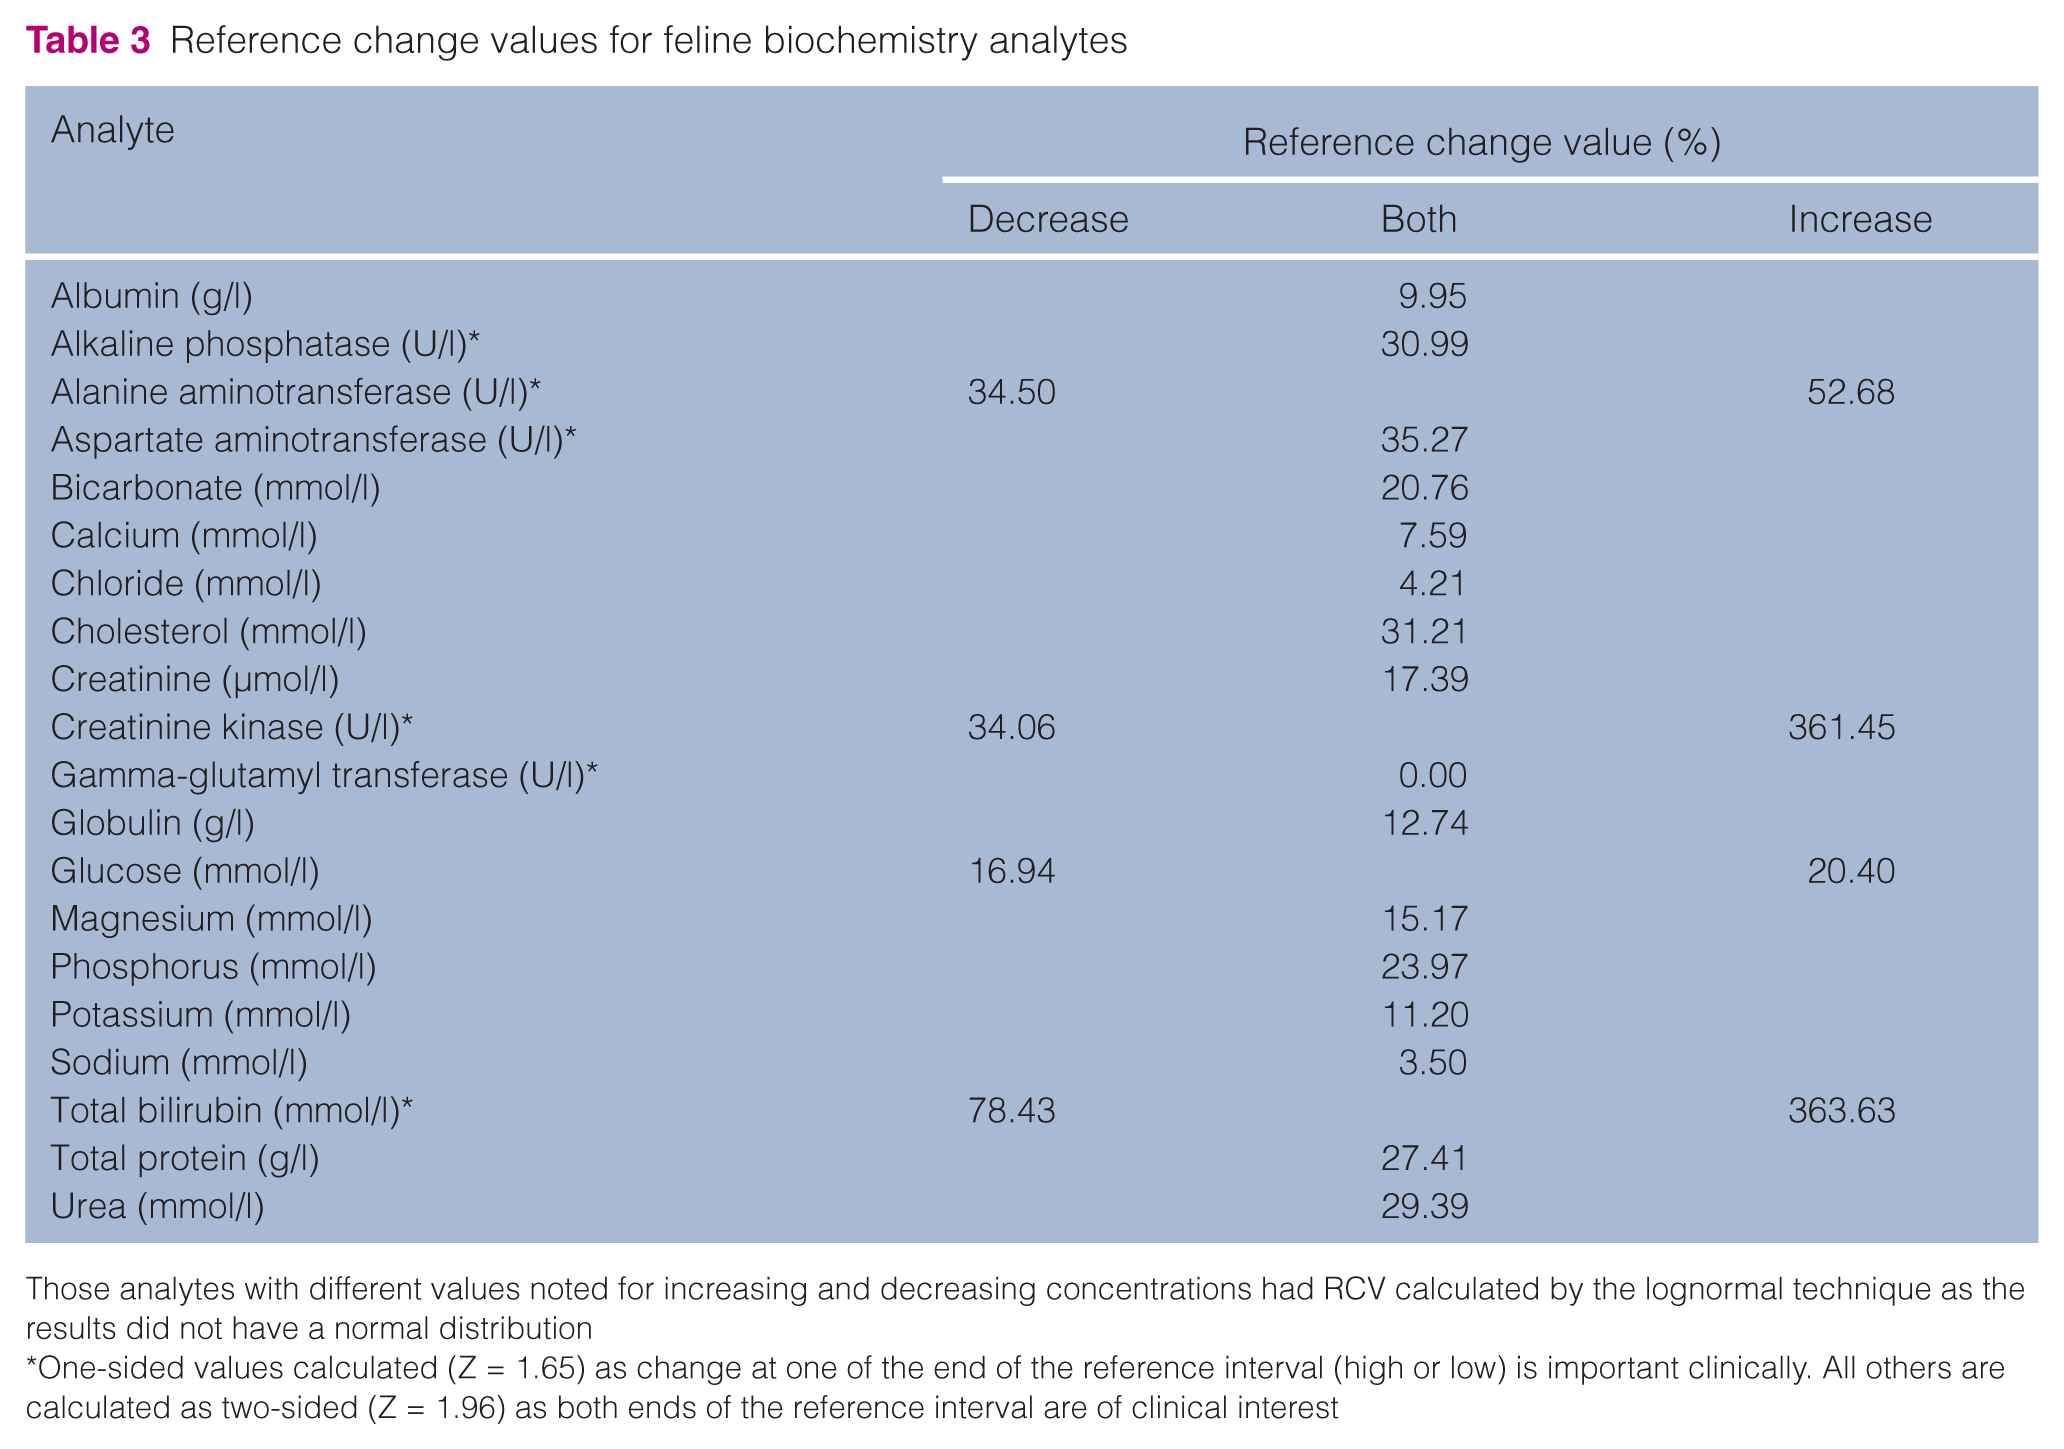
Those analytes with different values noted for increasing and decreasing concentrations had RCV calculated by the lognormal technique as the results did not have a normal distribution
One-sided values calculated (Z = 1.65) as change at one of the end of the reference interval (high or low) is important clinically. All others are calculated as two-sided (Z = 1.96) as both ends of the reference interval are of clinical interest
Discussion
This is the first report concerning biological variation of feline plasma biochemistry analytes in the peer-reviewed literature. The results demonstrate high individuality for most analytes and therefore that population-based reference intervals are of limited utility for these analytes.
Using the criteria described by Fraser and Harris, 6 and recently reviewed in the veterinary literature, 5 an index of individuality ≤0.6 indicates that subject-based reference values are more appropriate to use; when the index of individuality ≥1.4, population-based reference intervals are more appropriate, and when between 0.6 and 1.4, population-based ranges should be used with caution. The semantic difficulty that low values indicate high analyte individuality can be overcome by using the inverse formula such that an inverse index of individuality ≥1.67 indicates that subject-based reference values are more appropriate to use; when the inverse index of individuality ≤0.7, population-based reference intervals are more appropriate, and when between 0.7 and 1.67, population-based ranges should be used with caution.6,13
This study found five analytes with inverse indexes of individuality ≥1.67 (ALP, ALT, cholesterol, creatinine and globulin); one analyte with an inverse index of individuality ≤0.7 (sodium); and 13 analytes with inverse indexes of individuality between 0.7 and 1.67. Both the indices of individuality for GGT could not be calculated as the CVs were zero (as all results were the same) (see Table 2). This means that population-based reference intervals alone are only appropriate to use for sodium.
Interpreting clinical biochemistry results with RCVs requires a comparison to prior clinical biochemistry results from the same subject. For example, a cat may have previously had a creatinine concentration of a 120 µmol/l; an increase to 145 µmol/l (an increase of 21%) in a subsequent sample represents an increase greater than the reference change value of 17.4% (Table 3) and thus is an indicator of azotaemia, even if 145 µmol/l is within a correctly determined population-based reference interval of 70–160 µmol/l.
For those analytes with intermediate indices of individuality between 0.7 and 1.67, interpretations are made similarly, but with reference to the population-based reference interval as well. For example, a cat may have a urea concentration of 11.3 mmol/l, which is higher than the reference interval of 5.5–10.5 mmol/l. If prior testing had noted a concentration of 9.4 mmol/l, then 11.3 mmol/l is only an increase of approximately 20%, within the reference change value of 29.4% and so may not indicate azotaemia (although it would be prudent to monitor further to see if the increase is part of a upward trend).
Previous biological variation studies have used analysis of variance (ANOVA) techniques,11–14,21–23 whereas REML was used to estimate variance components in this study. REML takes a similar approach as ANOVA, but yields variance components directly, whereas they have to be calculated from the output in ANOVA. The estimated variance components are identical for simple models with balanced designs, but REML can also be used for non-balanced designs. 24 REML has become the standard method for estimating variance components. 25
Biological variation data, including CVs and RCVs, as described by Cotlove et al 19 and Fraser and Harris, 6 depend on normal, parametrically distributed data and equality of variance as normal distributions provide predictability of percentage of results above and below set points. When a dataset is not normally distributed, routine calculations result in significant errors, such as implausible decreases of 100% or more (which can occur when standard calculations are applied when CVI exceeds 33.3%). 26 Owing to non-normally distributed data for ALT, creatinine kinase, glucose and total bilirubin, lognormal approaches were used for these analytes in this study.17,18,27 Reasons for results not being normally distributed can vary, but box and whiskers plots of the results for ALT from all cats (Figure 2) illustrate that cat 10 had results notably different from the other 13 cats, which resulted in the data not being normally distributed. Although this cat had ALT concentrations above the reference interval limits on two consecutive occasions, on neither occasion was the concentration greater than the reference change value of 52.68% (or 43.00% when calculated with this cat omitted), thus demonstrating that this increase above the reference interval likely did not indicate pathology.

Box and whiskers plots of alanine aminotransferase (ALT) concentrations (U/l) from all cats. The box is made by the first quartile (Q1), the median and the third quartile (Q3). The whiskers go up to the smallest and the largest observations within 1.5 × interquartile range below and above the Q1 and Q3, respectively. Any observation outside these limits is displayed as an outlier. The + symbol indicates mean. Note that cat 10 has results notably higher than the other 13 cats. This resulted in a deviation from normality when assessing results of all the cats. On two consecutive occasions this cat’s ALT concentrations were above the laboratory reference interval of <80 U/l, but were less than the RCV of 52.68%, demonstrating the importance of subject-based reference intervals for analytes with an appropriate index of individuality
The log-transformed dataset for total bilirubin was not entirely normal, displaying excess kurtosis or central peakedness (Figure 1). This means that CVs and RCVs for this analyte must be assessed with caution; however, the results in Table 3 make intuitive clinical sense in that increases must be large (in the order of fourfold) to be clinically relevant. Future work will be required to refine these values. Along similar lines, conclusions can be made about GGT, even though calculations for index of individuality could not be performed as all results were the same. As no variation from 0 U/l (reported as <1 U/l) was found across 14 cats, tested weekly on six occasions and tested in duplicate (resulting in 168 analyses), any increase can be considered significant.
As first described by Cotlove et al 19 for humans, the largest biological variability, both intra- (9–12%) and inter-individual (15–25%), were associated for serum constituents that are end-products of catabolism, such as urea (CVI = 10.43% and CVG = 15.54% in this study), or are released from tissues such as the liver enzymes (CVI = 12–15% and CVG = 15–34% in this study). Physiological reasons may also explain the large variation for creatine kinase (CVI = 30.96% and CVG = 34.02%) as a cat may have sustained some tissue damage from minor trauma that resulted in no outward clinical signs. Outliers were recognised for creatine kinase (on two of the three levels assessed), but included in analyses, as both duplicates were the similar in each case.
Cotlove et al 19 also reported that the lowest variation occurred for analytes with strict homeostatic regulation of the stability of the composition, and volume of extracellular and intravascular fluids, as well as total calcium, which has complex regulatory mechanisms. Accordingly, these analytes had the smallest CVIs — sodium (0.86%), chloride (1.17%), calcium (2.34%) and albumin (3.00%) — and had little difference between CVI and CVG (see Table 2).
Analytes with low variation are faced with the problem that the ‘noise’ of analytical deviation may often mask their true biological variability, both within and among individuals,19,20 as when CVA approaches CVI, there is no certainty whether any variation is intra-subject or due to the limitations of the analytical equipment.
Cotlove et al 19 defined tolerable imprecision as CVA ≤0.5. CVI, 19 and this standard was not achieved for seven analytes in the current study (albumin, bicarbonate, calcium, chloride, magnesium, sodium and total protein). It is recognised that desirable performance standards are not attainable for all analytes with current technologies and methodologies, and, in these circumstances, minimum quality imprecision is assessed as CVA ≤0.75. CVI .20,28 Albumin, calcium and total protein reached this minimum standard, but the tightly-controlled electrolytes (bicarbonate, chloride, magnesium and sodium) did not. Artifactual increases of biological variation (CVI) due to analytic variation are minimal when CVA <½. √( CVI 2 + CVG2 ), 19 and this standard was achieved for all analytes except chloride, magnesium and sodium. A further difficulty in assessing true CVA is made by the reporting of results as whole integers. For example, duplicate results for chloride reported as 115 mmol/l and 116 mmol/l represent analytical variation of 0.87%, whereas if the true concentrations were 115.4 mmol/l and 115.6 mmol/l, the analytical variation would be 0.17%.
Fraser and Harris
6
noted that:
A single extraordinary observation, resulting from an analytical blunder in the assay, or a misidentification of the specimen, can exert a profound effect on summary statistics, especially variances. A distinction should be made between an aberrant observation, due to a mistake or accident in the analytical procedure, and an outlier. In some cases, the outlier is known to be aberrant, but more often no explanation can be found for an unusual value.
The decision to exclude outliers from the final statistical analyses was not taken lightly, and exclusions were made when recognised outliers were from duplicate samples (both results were excluded). For example, a duplicate for sodium with results of 145 mmol/l and 170 mmol/l was excluded. No reason was found for such dramatic variations that occurred in multiple cats, across multiple weeks. Possibilities such as inadequate centrifugation, aspiration of red blood cells when decanting plasma, effect of freezing and thawing samples, or imprecision of the analyser all seem unlikely because the varied results were across multiple cats and multiple weeks, and no other indicators of possible operating error, such as low glucose concentrations if red blood cells were aspirated, were detected.
Ideally, RCV should be calculated using the CVA for the instrument upon which the specimens are analysed. CVA may differ among individual instruments of the same or different manufacturers and ages. 29 However, the calculations provided in the ‘Materials and methods’ are easily applied and could be instituted for any analyser, either at a commercial laboratory or in-house, using the information regarding biological variation from this study and the imprecision of the analyser (CVA) used for specimen analyses.
Conclusions
This study represents the first assessment of biological variation for feline blood components within the peer-reviewed literature. The results of this study should be interpreted cautiously for analytes with low CVI and CVG (particularly chloride, magnesium and sodium), as CVA provides analytical ‘noise’ to the clinical ‘signal’.19,20 The high individuality of most analytes indicates that subject-based reference values should be used to assess feline plasma biochemistry samples. Biological variation studies such as this one and another recently published for dogs 13 provide strong evidence for serial sampling and reporting of RCV values in small animal practice.
Footnotes
Acknowledgements
We thank Sarah Horrill for restraint of the cats while sampling, and her help in centrifuging and decanting plasma from samples.
Funding
The authors are appreciative of the support of an Australian Companion Animals Health Foundation (ACAHF) grant.
Conflict of interest
The authors do not have any potential conflicts of interest to declare.