
Abstract
With the use of perfusion tracers, in vivo examination of the regional cerebral blood flow in cats can be performed with single photon emission computed tomography (SPECT). Reliable perfusion data of normal, healthy cats are necessary for future clinical studies or other research use. Therefore, this dataset of the regional perfusion pattern of the normal feline brain was created. Twelve cats were used in this study. Technetium-99m-ethyl cysteinate dimer (99mTc-ECD) was injected intravenously and the acquisition, using a triple head gamma camera equipped with three multi-pinhole collimators (pinhole SPECT), was started 40 mins after tracer administration under general anaesthesia. Nineteen regions of interest were defined using 7T magnetic resonance images of the feline brain and a topographical atlas. Regional counts were normalised to the counts of two reference regions: the total brain and the cerebellum. The highest tracer uptake was noticed in the subcortical structures, and the lowest in the frontal cortex and the cerebellum. Also left–right asymmetry in the temporal cortex and a rostrocaudal gradient of 5% were observed.
Introduction
Single photon emission computed tomography (SPECT) of the brain provides three-dimensional information on the perfusion and metabolic status of brain tissue. Information obtained using SPECT is often complementary to the anatomic detail provided by structural neuroimaging techniques, such as computed tomography (CT) and magnetic resonance imaging (MRI).
In human nuclear medicine brain perfusion SPECT has a role in the diagnosis, therapeutic management and follow-up of patients. In addition, by providing non-invasive in vivo assessment of brain function and being widely available, SPECT is also a useful tool for research. 1
Currently, technetium compounds are used predominantly for brain perfusion SPECT examinations. In particular, technetium-99m-ethyl cysteinate dimer (99mTc-ECD), is widely used owing to its availability and in vitro stability. 2 The lipophilic 99mTc-ECD crosses the blood–brain barrier and is trapped intracellularly, proportionally to the cerebral blood flow, within 2 mins after intravenous (IV) injection, probably by de-esterification to polar complexes.3–5 This results in a fixed distribution of the tracer, representing the regional cerebral blood flow (rCBF) at the time of tracer injection.
Semi-quantification or normalisation of tracer uptake in the different brain regions to the uptake in a reference region is the preferred method of quantification for 99mTc-ECD SPECT. 1 This procedure results in perfusion indices for the different brain regions. Recognition of rCBF patterns unique to ECD, as well as ECD patterns reflecting the normal variation in rCBF, is important for the interpretation of clinical ECD SPECT studies or for research purposes. This requires a normal dataset of healthy subjects. 6
The most important advantage in veterinary medicine is the visualisation of the rCBF in the awake animal, as anaesthetics needed during the acquisition do not influence the distribution pattern — as long as they are administered after the tracer.
The (mostly experimental) use of brain SPECT in rats, monkeys and dogs has been described by several authors.7–9 More recently, brain perfusion studies with 99mTc-ECD SPECT in dogs have been applied in clinical situations, such as in anxiety and impulse control disorders, and the influence of different anaesthetic protocols on the regional distribution pattern has been investigated.10–12 Also, in cats, brain SPECT with 99mTc-ECD has already been used to assess the influence of medetomidine and ketamine on the rCBF. 13 The purpose of the present study was to define the regional distribution of 99mTc-ECD in the normal cat. This information can be used as a reference in future rCBF studies in cats.
Materials and methods
The experimental protocol was approved by the local ethical committee (EC 2011/066).
Twelve adult (aged between 18 and 96 months), purpose-bred domestic shorthair cats (seven female neutered and five male neutered), showing no abnormalities on physical examination, were used for this study. The cats had no history of neurological disorders or behavioural abnormalities, and were used being handled. All cats also underwent a 0,2T MRI examination to exclude any structural pathology. The procedures were performed according to good animal practice and did not result in excitation or aggression. Between 22 G catheter placement in the cephalic vein and tracer injection, the cats were allowed to relax in a quiet cage to prevent sensorial and cognitive stimuli from activating certain brain regions resulting in changes in the regional blood flow pattern. For the same reason, IV tracer injection was performed without stressing the animals. The study design is illustrated in Table 1.
Study design showing times of drug administration and acquisition for 99mTc-ECD SPECT in cats
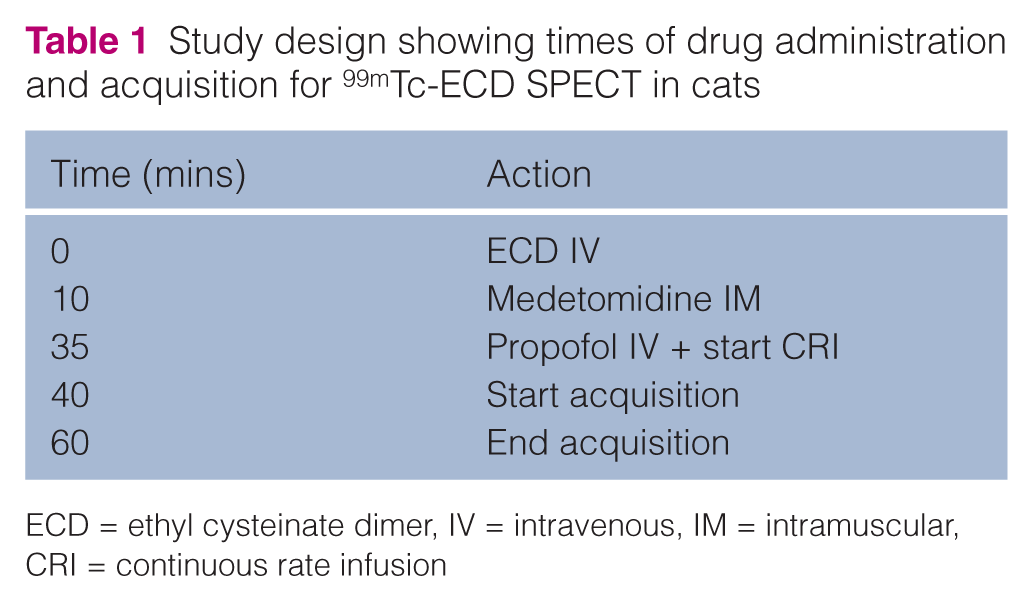
ECD = ethyl cysteinate dimer, IV = intravenous, IM = intramuscular, CRI = continuous rate infusion
SPECT scanning was performed with the lipophilic 99mTc-labelled tracer N,N’’-1,2-ethylene-diylbis-L-cysteine diethyl ester dihydrochloride (ECD: Neurolite; BMS). The IV injected activity was 380 MBq.
Ten minutes after tracer injection the cats were sedated using intramuscular (IM) medetomdine (Domitor; Pfizer) 0.1 mg/kg. Anaesthesia was induced 25 mins later with IV propofol (Propovet; Abbott Laboratories) to effect (1–2 mg/kg). Cats were intubated using a cuffed (3.5 mm internal diameter) endotracheal tube after spraying the larynx with lidocaine (Xylocaine 2%; Astra Zeneca) and 100% oxygen was administered using a paediatric rebreathing system. Intermittent positive pressure ventilation was employed using a volume-limited ventilator. Respiratory frequency was adjusted between 7 and 10 breaths per minute, and tidal volumes between 20 and 40 ml in order to keep end tidal carbon dioxide concentration (ETCO2) around 40 mmHg. Maintenance of anaesthesia was achieved using a continuous rate infusion (CRI) of propofol (0.05 mg/kg/min) administered via a syringe driver. The cats also received an infusion of 0.9% NaCl at a rate of 10 ml/kg/h.
Monitoring included multi-gas analysis (Capnomac Ultima; Datex), which was able to determine inspiratory oxygen fraction (FiO2), ETCO2 concentration and respiratory rate (RR). Pulse rate (PR) and peripheral haemoglobin saturation (SpO2%) were monitored with a pulse oximeter (N-20PA Portable Pulse Oximeter; Nellcor Puritan Bennett).
After induction of anaesthesia, the cats were positioned in ventral recumbence. The heads of the cats were fixed to the table with a bandage in order to minimise the intra-individual positioning variability.
MicroSPECT (µSPECT) or multi-pinhole SPECT (PH SPECT) was performed using a conventional triple head gamma camera (Triad; Trionix) equipped with three multi-pinhole collimators (six multi-focused holes, 3 mm∅) (HiSPECT; Bioscan). The radius of rotation (ROR) was set at 22 cm. The resolution of the system was 2.5 mm. 14 Data were acquired in step-and-shoot mode (10 steps, 36° angular step, 120 s/step), resulting in an acquisition time of 20 mins. Images were reconstructed using a dedicated ordered subset-expectation maximisation (OSEM) algorithm (nine iterations, five subsets) (Scivis). Data obtained from the HiSPECT were fitted to a volume of interest (VOI) map with the help of fusion software (Multimodality; Hermes, Nuclear Diagnostics) as described previously. 13
The regional distribution of activity was quantified based on this VOI map, defined on the SPECT images fused with 7T MRI data, consisting of 19 regions of interest (ROIs) placed over the left and right frontal, temporal, parietal and occipital cortical regions, as well as over the cerebellum, the gyrus cinguli, the bulbus olfactorius, and the left and right thalamus, amygdala, basal ganglia and hippocampus. This VOI map was subsequently fused with SPECT data using dedicated BRASS software from Hermes (Brain Registration and Automated SPECT Semi-quantification, NUD). This template-based automated registration method provides a mean to compensate for size and shape differences between the different cats. This same, routinely-used brain-dedicated software [Brain Registration Analysis Software Suit (BRASS); Hermes, Nuclear Diagnostics] was employed to calculate perfusion indices (PIs) for the different brain regions. PIs are generated by normalising the regional counts/pixel per ROI to the total counts/pixel of all ROIs (total brain) resulting in the PIT of the different ROIs or to the counts/pixel of the cerebellum resulting in the PIC of the respective ROIs. A rostrocaudal gradient was also calculated as (R–C/R+C)*100, with R being the bilateral frontal PIT and C the bilateral occipital PIT.
Statistical analysis
The mean and standard deviations of the perfusion indices (PIT and PIC) were calculated. Left–right differences were analysed with paired samples and gender differences with independent samples Student’s t-tests. The significance of the rostrocaudal gradient was analysed using a one-sample t-test. Significance was defined as P <0.05. The Statistical Package for Social Sciences (SPSS v.17; SPSS) was used to perform the analyses.
Results
The characteristic brain perfusion pattern of the feline brain is shown in Table 2 (normalisation to the total brain and to the cerebellum) and an example of a 99mTc-SPECT image is also shown (Figure 1). The highest perfusion indices were found in the subcortical structures and in the gyrus cinguli, whereas the lowest tracer uptake was noticed in the frontocerebral cortex and in the cerebellum. When the cerebellum was used as reference region slightly increased standard deviations were noticed. Comparison of the regional tracer uptake at the left- versus the right-side revealed a significantly higher tracer uptake in the right temporal cortex. Significant gender differences were not observed.
Regional perfusion indices (mean ± SD) in the feline brain: regional counts are normalised to the total brain counts (PIT) and to the cerebellum (PIC)

LT = left temporal cortex, RT = right temporal cortex, CE = cerebellum, GC = gyrus cinguli, BO = bulbus olfactorius, LF = left frontal cortex, RF = right frontal cortex, LO = left occipital cortex, RO = right occipital cortex, LP = left parietal cortex, RP = right parietal cortex, LTh = left thalamus, RTh = right thalamus, LAm = left amygdala, RAm = right amygdala, LBG = left basal ganglia, RBG = right basal ganglia, LHi = left hippocampus, RHi = right hippocampus

Transversal 99mTc-ECD SPECT image of the feline brain. The image was obtained with a triple head gamma camera equipped with three multi-pinhole collimators (micro- or HiSPECT)
When calculating the rostrocaudal gradient for the 12 cats, a higher tracer uptake in the occipital region compared with the frontal cortex was present in all but one cat. Because of the important difference between this subject and the other cats, only 11 animals were used to calculate the mean rostrocaudal gradient. A significant (P = 0.006) rostrocaudal gradient of 5% was present in this study.
Discussion
This study reports the normal 99mTc-ECD distribution pattern in cats. Similar to dogs and humans, the uptake of 99mTc-ECD also varies significantly between brain regions in the feline brain.5,6,15 The highest uptake occurs in the subcortical structures like the amygdala, hippocampus, basal ganglia and thalamus, and in the cingulate gyrus (Table 2), which reflects the relative dominance of these structures in feline behaviour.
ECD is a 99mTc-labelled lipophilic tracer used for SPECT imaging of rCBF. 16 Together with 99mTc-hexamethyl propylene amine oxime (HMPAO), 99mTc-ECD is the most widely used radiopharmaceutical for rCBF SPECT. 17 In humans, the overall grey to white matter image contrast reduces significantly from 120 mins post-tracer injection onward; therefore, it is advised to start the acquisition between 30 and 120 mins post-injection. 3 In cats, however, starting the acquisition between 40 and 60 mins after tracer injection is advisable owing to a shorter biological half-life and regional differences in the clearance of the tracer occurring much faster in this species (Waelbers et al, personal communication).
99mTc-ECD SPECT does not provide absolute quantitative flow values, but rather estimates of relative regional flow differences based on the comparison of count density ratios between various regions — like the ratio between a specific region in relation to a reference region. 17 However, a linear relationship was observed in the regional distribution of ECD count density and 133Xe rCBF ratio data. Using the absolute measure of global CBF (gCBF) (measured with 133Xe SPECT), calibration of global ECD count density in units of ml/min/100 g was possible. In this way a reasonable and practical approximation was created for obtaining absolute flow values for ECD in humans. 18 However, measuring absolute flows using SPECT has not been fully implemented and the ROI analysis of rCBF, also referred to as semi-quantification and resulting in an estimation of the relative rCBF distribution within the brain, has become the preferred method of quantification. Two components are essential when performing semi-quantification: ROIs have to be drawn and a reference region has to be chosen. Although every brain region can be used, the whole brain and the cerebellum are the most common reference regions. 1 In this study both methods were used and the tracer uptake in the different ROIs was normalised to the uptake in the whole brain, as well as in the cerebellum (Table 2). Regions with a high perfusion can be detected independent of the reference region used; however, this study revealed that the variance is increased when the cerebellum is used as reference region instead of the whole brain, probably reflecting inter-individual variations in cerebellar activity.
An important concern when investigating small objects, such as the feline brain, with SPECT is the low spatial resolution. This resolution can be improved by using PH SPECT (Figure 2). 19 It was shown that for a thyroid of a mouse, an image resolution of 0.2 mm could be obtained using this pinhole technique.20,21 With the PH SPECT, the highest resolution can be obtained by placing the object as close as possible to the pinhole collimator.22,23 The resolution of this system has already been proven to be sufficient for visualising anatomical predilection sites in canine elbow pathology as well. 24 The use of PH SPECT enabled us to differentiate between the subcortical structures in this study, whereas this was not possible in a comparable SPECT study in dogs without the use of PH collimators. 5 Even with pinhole collimators, limited anatomical information is obtained with the 99mTc-ECD-SPECT images. Therefore, the regions of interest have to be identified on images obtained with structural neuroimaging techniques, such as MRI. These techniques allow the creation of a VOI map, which can be fitted to the perfusion images with brain dedicated software (BRASS). In this study a template was used, based on 7T MRI images. The different brain regions were drawn manually on the different slices with the help of an anatomical atlas of the feline brain. 25

Image of a cat under general anaesthesia during the acquisition. A conventional triple head gamma camera (Triad; Trionix), equipped with three multi-pinhole collimators (six multi-focused holes, 3 mm ∅) (HiSPECT; Bioscan), was used to obtain the perfusion images
In dogs, 99mTc-ECD rCBF datasets of healthy adults have already been created.5,11 This created the possibility of comparing the rCBF of dogs suffering from pathological anxiety, impulsive aggression or epilepsy with the perfusion pattern of healthy subjects.10,11,26 Also, in humans, the importance of such a rCBF dataset of healthy volunteers has already been emphasised. 15 To our knowledge, this study reports, for the first time, the use of 99mTc-ECD-SPECT for studying the rCBF in the feline brain and creates the future possibility of comparing the rCBF of cats suspected of having regional brain perfusion abnormalities with this dataset of healthy cats.
As in dogs, this study revealed the highest perfusion indices in subcortical brain regions and the lowest in the frontocerebral cortex. Also, a rostrocaudal gradient was seen in both species, although this gradient was more pronounced in dogs (12% compared to 5% in cats). 5 Another difference between dogs and cats seems to occur in the cerebellum. In the feline brain the cerebellum is the region with the lowest perfusion index, whereas, in dogs, the cerebellar tracer uptake is higher than in the cortical regions, but lower than in the subcortical region. 5
An age-related decrease in the ECD perfusion pattern and an increased left–right asymmetry was observed in several brain regions in humans.6,15 Also, in dogs, a decreased perfusion in the frontotemporal cortex and in the subcortical region, together with a significant left–right difference in the parietal cortex, was reported in a group of ‘aged’ dogs (older than 96 months) when compared with a reference group (aged between 12 and 84 months). 27 Despite the use of young-to-middle-aged subjects, asymmetry, occurring as a hyperperfusion of the right temporal cortex was also observed in this study. On one hand, the small sample size in this study precludes further division into age groups and therefore makes it impossible to draw conclusions regarding the effect of ageing on the rCBF in the feline brain. On the other hand, this dataset may serve as ‘reference group’ in future brain perfusion studies in ‘aged’ cats. Also, gender differences in the rCBF have been reported in humans, but not in dogs.5,15 In this study no gender differences were observed; whether this is due to the neutering, the small sample size or species differences cannot be concluded. Adding more subjects to this dataset could improve its precision even more, and may lead to corrections for age and gender.
The obligatory use of anaesthesia in cats is a possible confounder which may influence regional brain perfusion. In dogs and cats increased total counts in the brain were measured and regional perfusion index alterations were observed when 99mTc-ECD was injected after sedation with medetomidine compared to tracer injection prior to sedation.12,13 In humans, it has been demonstrated that the administration of acetazolamide, causing an increased CBF through vasodilation, did increase the total tracer uptake when administered before the tracer. However, when administered after the tracer, the increased CBF did not change the total counts, confirming that the obtained image represents the CBF at the moment of the tracer injection regardless of blood flow changes occurring after tracer administration.28–30 It can, therefore, be assumed that possible anaesthesia-induced blood flow changes did not cause changes in the distribution of the tracer in this study as all anaesthetics were administered after the tracer injection. Another important consequence of this fixed image is the fact that the use of another anaesthetic protocol does not influence the results of the study. Therefore, although maybe not advisable, results of perfusion studies performed with another anaesthetic protocol can still be compared with our results as long as the tracer is injected before the anaesthetics.
Conclusions
This study shows that 99mTc-ECD SPECT with the use of multi-pinhole collimators is a useful tool for studying the rCBF in the feline brain. This study also provides a dataset of the rCBF in the adult, healthy cat, which can be used as a reference for future rCBF studies of the feline brain. Adding more subjects to this dataset will be one of the future goals as well, especially when studying the effects of age and gender on the rCBF.
Footnotes
Funding
This research received no grant from any funding agency in the public, commercial or not-for-profit sectors.
Conflict of interest
The authors do not have any potential conflicts of interest to declare.