
Abstract
The protests following the killing of George Floyd in the summer of 2020 led to contentious discussions and debates in many cities about policing, with some calling to “defund the police.” However, this debate has generally proceeded without adequate research about either the scale or nature of issues that the police handle and the potential consequences of the proposed reform efforts. To respond to this research gap, we analyze millions of 911 calls for service across nine U.S. agencies. We report on the types of calls for service that the police handle, including how frequently different calls arise, how much time agencies spend on different categories of calls, and the outcomes of those calls. We find that the amount and types of incidents for which people call the police are voluminous, with the vast majority not obviously transferable to other organizations or government sectors without significant resource expenditures or adjustments. However, if the police retain these responsibilities, they also need to reconsider how they can more effectively address community concerns.
The killing of George Floyd by a Minneapolis Police Department officer on May 25, 2020, led to a historic protest and reform movement across the United States that has continued into 2021. Not since the civil rights movement of the 1960s has America seen such a magnitude of people calling for both the recognition of institutionalized racism and radical policing reforms. During this time, we saw the rise in power and legitimation of the Black Lives Matter 1 movement, which garnered widespread support even from the most unlikely sources (the National Football League being one, as well as some police leaders and agencies). What makes this time in our history even more remarkable is that a great diversity of people have come out to protest en masse even in the face of the coronavirus pandemic (COVID-19), a deadly and highly contagious disease that has killed more than 607,000 people at the time of writing in the United States alone.
The protest movement has led to contentious discussions and debates in many cities about policing, with one provocative call for reform to “defund the police.” Calls for defunding have generally focused on shifting resources away from law enforcement to other public services that may improve the quality of life within marginalized communities (Andrew, 2020; McDowell & Fernandez, 2018; Muhammad, 2020). The argument supporting defunding is that the police handle public challenges that they are not well equipped to handle, or should not handle, on principle (MPD150, 2020; Vitale, 2017). One commonly-raised example is reducing police-led responses to 911 calls related to mental health crises and transferring these calls (and associated resources) to mental health providers. Those calling for defunding have also argued for reducing police response to calls for service for other minor crimes and community concerns such as physical or social disorders, traffic problems, or juvenile delinquency within schools. Scholars and groups interested in police reform have argued that police response to 911 calls, especially for minor offenses, disorders, and non-crime related matters, can start negative processes and cycles of arrest, use of force, systemic disparity, and criminal justice involvement (Geller et al., 2014; Meares, 2015; Neusteter, Subramanian, et al., 2019). A broader theme bridging these ideas is the hope that by reducing police response to, and involvement in, various problems within the community, police use of force and discriminatory behaviors might also be reduced—in essence, to reduce the footprint of the criminal justice system (Lum, Koper, Stoltz et al., 2020) .
Calls for defunding have been met by resistance, not just from law enforcement constituency groups and police chiefs, but also by communities with high rates of crime and poverty. Lum (2021) has argued that the diversity of opinions about defunding amongst Blacks living in high crime neighborhoods may not be fully reflected in these debates. A 2020 poll by Gallup’s Center on Black Voices found that 61% of Black respondents wanted police presence to remain at least the same in their neighborhoods, while an additional 20% wanted more police presence (as reported for Gallup by Saad, 2020). The rise in violence in the U.S., particularly shootings in some cities, has further complicated this debate (see Andrew, 2020; Rosenfeld, 2020; Southall & MacFarquhar, 2020; Wernau & Barrett, 2020). In Seattle, Washington, former police chief Carmen Best resigned amidst calls for defunding, arguing that the city was putting her “in a position destined to fail” by reducing funding to an already resource-stretched police department. 2 The Seattle city council ultimately voted for a 20% budget cut, although some of this cut may have been due to the financial crises brought on by the broader economic impact of COVID-19 (Kroman, 2020). After the death of George Floyd, the Minneapolis city council experienced periods of support for and against defunding, finally settling on a 4.5% reduction in the police budget at the end of 2020 to reallocate police responses to people in mental health crises to non-police entities (Gross & Eligon, 2020).
As scientists, we do not advocate for or against defunding the police. Instead, we point out that this debate has proceeded without adequate research about either the scale or nature of issues that the police handle or the potential consequences of the proposed reform efforts. While there is a general understanding that police respond to some non-emergencies that they should not, the empirical realities behind what motivates people to call the police and the amount of resources spent responding to these calls for service have not been carefully examined across multiple police agencies. Understanding these realities provides an essential context to debates about resource reallication and is a starting point for evaluating the impact and consequences of these dabates as they pertain to 911 calls.
To address this research gap and inform the defunding debate, we present findings from a large project focused on analyzing 911 calls for service across multiple agencies. We obtained, standardized, cleaned, categorized, and analyzed millions of computer-aided dispatch (CAD) records across nine agencies from diverse regions of the U.S. We report on the calls for service that these police agencies handle, including how frequently different calls arise, how much time agencies spend on them, and the outcomes of those calls. Such an undertaking across multiple agencies has not occurred since the early days of the establishment of the 911 system. Our findings indicate that the amount and types of incidents for which people call the police are voluminous. Many seem to fall in categories not obviously transferable to other organizations or government sectors without significant resource expenditures, adjustments, and commitments by other entities. If such responsibilities were transferred, those calling for defunding need to consider possible costs to safety, community satisfaction, and the potential for disparity that might arise. However, if the police retain these responsibilities, they will also need to reconsider how to more effectively address many concerns for which people call the police. From an evidence-based policing perspective (Lum & Koper, 2017), the question is not simply whether police should (or should not) handle certain types of calls, but whether they can more effectively handle calls when they do respond, and perhaps more importantly, how calls could be prevented in the first place.
What Do People Call the Police for (and Therefore, What Do the Police Handle)?
At the heart of defunding discussions is the public’s safety needs and who should be responsible for them. The only system in the U.S. that regularly collects information on these requests are public safety communications operations, colloquially known as 911 call centers. People frequently call the police for all sorts of help using these systems, which often combine emergency and non-emergency calls for service. In the U.S., the creation of a national 9-1-1 system at the prompting of President Lyndon Johnson’s Crime Commission on Law Enforcement and Administration of Justice (1967) led to a significant increase in the types of everyday problems for which people call the police, and which has arguably expanded the footprint of the police across many aspects of everyday life (Lum, Koper, Stoltz et al., 2020). Depending on the size of their populations, jurisdictions can receive millions of these calls annually. To put this into perspective, research studies reviewed by Neusteter, Mapoliski, et al. (2019) indicate that public safety communications agencies often receive 1-2 calls for service per person per year in any given jurisdiction. The most recent pre-COVID National 911 Program (2019) report confirms those findings.
Despite what is portrayed in movies and on television, these 911 calls are rarely for serious violent crimes in progress (Ratcliffe, 2016, 2021). 3 For calls that are serious, many are for crimes that have already occurred and in which the perpetrator is gone (Spelman & Brown, 1981). Much more often than not, people call the police for far less urgent crimes and non-criminal matters, including minor thefts that may have occurred hours or days ago, damage to property, complaints of noisy neighbors or kids, loose animals, and traffic problems.
Most of our knowledge about what people call the police for comes from studies now decades old, completed when 911 systems were first adopted. The first major study in this area was undertaken by Antunes and Scott (1981; see also Ostrom et al., 1978; Percy & Scott, 1985; Scott, 1981; Whitaker et al., 1982). Analyzing thousands of calls for service from computer-aided dispatch (CAD) data from three metropolitan areas, they found that most calls were for non-emergencies, including information requests (21%), non-violent crimes (17%), requests for assistance (12%), public nuisances (11%), and traffic problems (9%). Police also receive a wide array of other types of calls that could be best described as requests for information, requests for reassurance, and expressions of suspicions and fears for things that have yet materialized. Since this study, there has not been a systematic analysis of CAD data across multiple jurisdictions, except to count the total amount of calls received, as documented by the National 911 Program. 4 Yet, the most recent National 911 Program report (National 911 Program, 2019) seems to indicate that the volume of these calls has been increasing and that even more avenues exist by which 911 calls can be made (i.e., internet, email, cellphone text, and video applications).
What happens to these requests by the public? Many of these calls are handled by a public safety communications calltaker and are never dispatched to a uniformed patrol officer. In a recent systematic observation of 911 calltakers, Lum, Koper, Stoltz et al. (2020) discovered that about half of all calls that come into public safety communications centers are resolved by calltakers without any further criminal justice agency involvement. Many of these calls do not involve crimes in progress and are events such as false alarms, traffic accidents, or people seeking information. Despite the number of calls handled by 911 calltakers, a large share and volume of calls (including minor and non-crime-related calls) still get through and are dispatched to uniformed law enforcement officers. Because of this, Lum, Koper, Stoltz et al. (2020) referred to calltakers as “constrained gatekeepers,” suggesting that while they may be able to triage and resolve some calls, they also have to let other calls through, no matter how minor or unrelated to public safety, for reasons related to organizational constraints, concerns about liability, and citizen expectations and demands. The volume of these calls still amounts to a sizable portion of dispatched calls.
Those arguing for defunding have suggested that some of these calls for service do not need to be handled by the police. By not involving the police, for example, the risk of disparity, use of force, or other negative consequences could be lessened. It is important to note these assertions are speculative, as no current evaluation work confirms these hypotheses. Nonetheless, these suggestions raise important empirical questions: What are the calls to which the police are dispatched, and how much time (and therefore, resources) do they spend on handling these calls? When examining these calls, are there specific call categories that do not require a police response or that could be handled by others (including citizens themselves)? For example, some agencies have developed policies to reduce police response to alarm notifications, as they are often false (Sampson, 2007; Schaenman et al., 2012). Other agencies do not respond in person to events such as minor traffic accidents, civil complaints, or even petty thefts that have taken place in the past (see discussion by Blackstone et al., 2007). Some agencies have also developed non-emergency numbers, such as “311,” to divert certain calls away from emergency (911) lines (see an evaluation of the efficacy of these systems by Mazerolle et al., 2002).
A contemporary and often-cited example by those arguing for defunding is that police shouldn’t be responding to calls for people in mental distress, and that mental health specialists can more effectively or safely provide those services. Police leaders themselves seem to believe that there has been a dramatic rise in 911 calls related to people experiencing mental distress and that these calls seem to require a much more time-consuming and specialized response (International Association of Chiefs of Police, 2016). Recognizing that the police may initially be needed on scene to address public safety concerns, co-responder mental health models represent one approach that has been put forth to relieve officers of time spent on the call once safety has been assured (see Morabito et al., 2018; White & Weisburd, 2018; Yang et al., 2018).
The challenge with all of these arguments is that they are often “best guesses” about what the police are responding to, how much resources are expended on such calls, and who could more effectively, fairly, or efficiently handle these requests. To provide some empirical context to these assertions and questions, we obtained computer-aided dispatch (CAD) data from nine agencies across the U.S. to get a better sense of what the police are actually being called to do and how much time they are spending on specific types of calls for service.
A Multi-Agency Analysis of CAD Data
This analysis includes the study of a full year of computer-aided dispatch (CAD) data from nine U.S. law enforcement agencies. 5 The agencies are anonymized as A1-A9 in Table 1, which provides a descriptive snapshot of these agencies, in ascending order of their volume of calls for service. For this analysis, we chose to maintain the participating agencies’ anonymity and thus provide only general descriptions of the agency and jurisdiction characteristics. 6
Descriptive Information for the Nine Agencies Included in This Study.
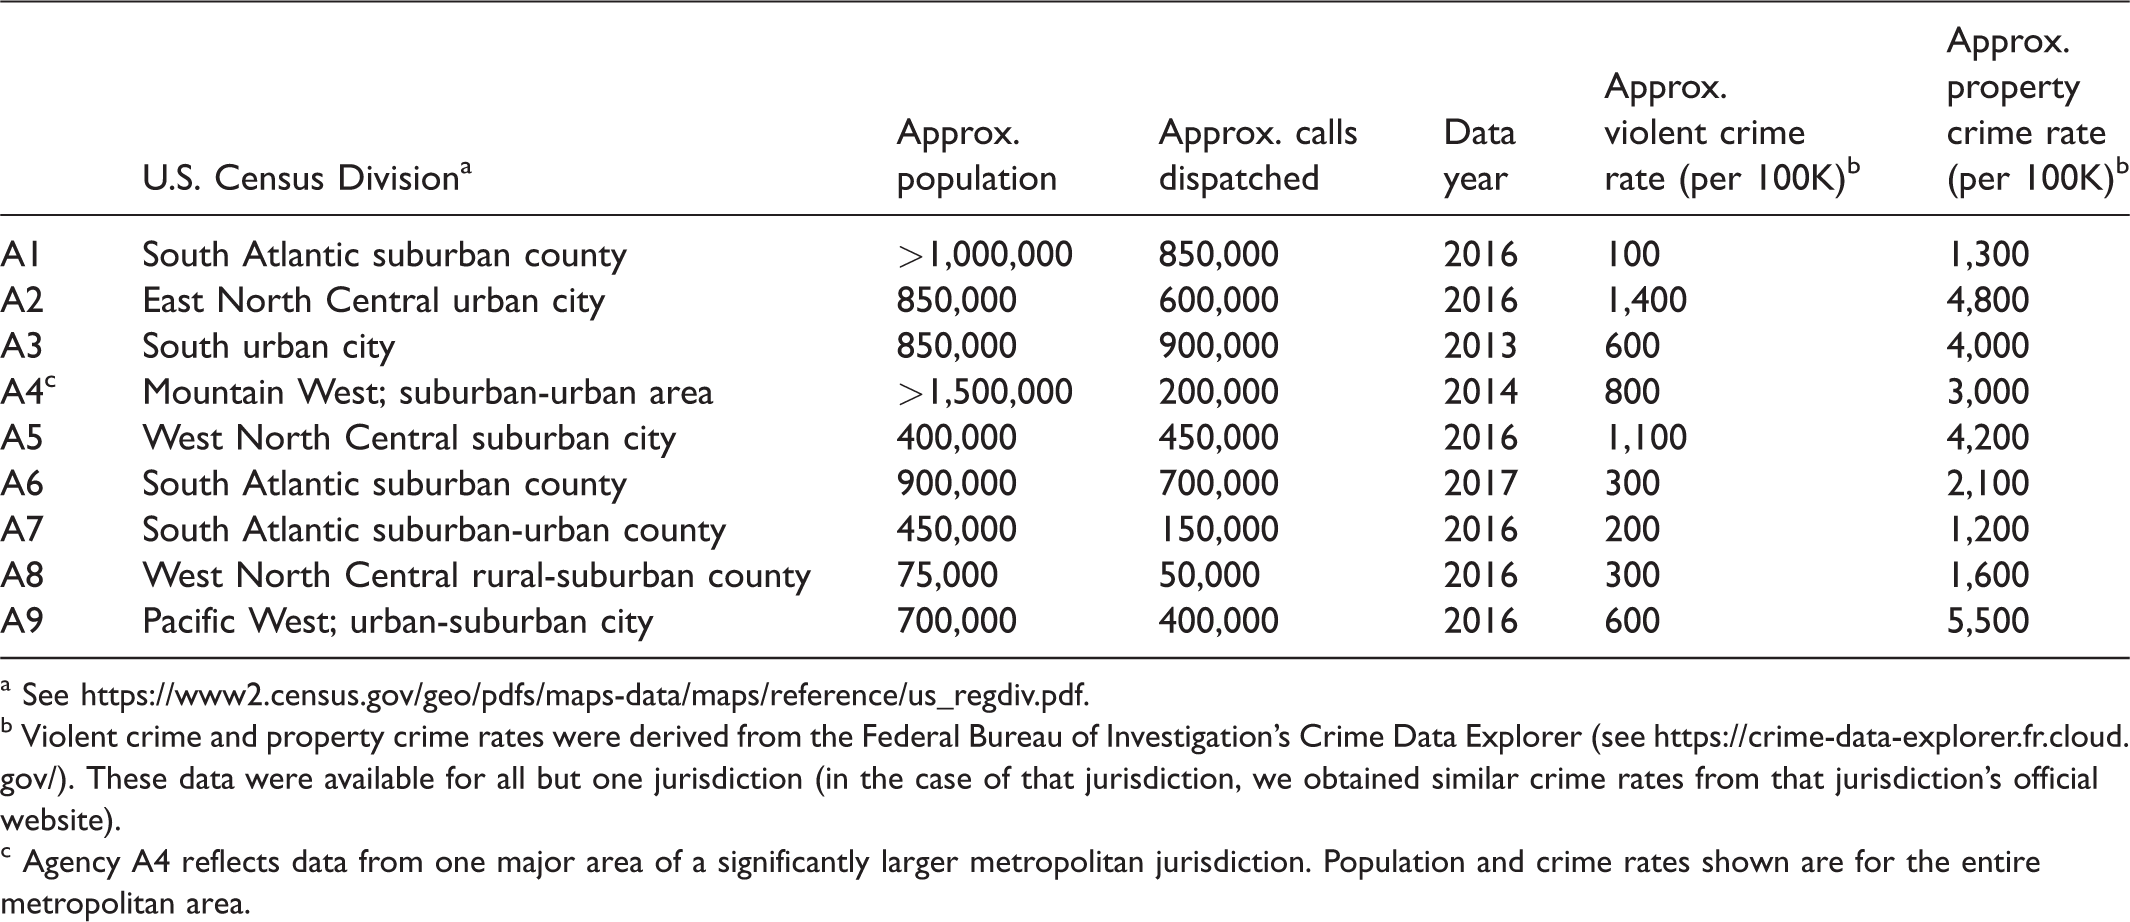
b Violent crime and property crime rates were derived from the Federal Bureau of Investigation’s Crime Data Explorer (see https://crime-data-explorer.fr.cloud.gov/). These data were available for all but one jurisdiction (in the case of that jurisdiction, we obtained similar crime rates from that jurisdiction’s official website).
c Agency A4 reflects data from one major area of a significantly larger metropolitan jurisdiction. Population and crime rates shown are for the entire metropolitan area.
All of the agencies in Table 1 except for A8 are large jurisdictions with populations of 400,000 or more located in various regions of the U.S. While some are large cities, other jurisdictions are mixed-land-use counties and include suburban and rural areas. The total calls for service volume and crime rates of these locations vary greatly by population. However, all have call volume rates that fall within the range of 1-2 calls per person in their population per year, reflecting average rates discussed above.
CAD data are the most comprehensive data record of requests made by citizens for police service. The phone number and use of 911 is ubiquitous in the United States. Thus, although not with limitations, CAD data provide the only available comprehensive metric of community members’ expectations of public safety services. CAD data capture many of the daily, minute-to-minute activities of police officers, even when no official report is taken or no arrest is made. CAD data also record when an officer or dispatcher proactively “self-assigns” or “self-generates” an event (for example, when an officer proactively stops a vehicle or needs to carry out an administrative duty). For this analysis, as we are interested in what citizens are calling the police for, we only examine those calls for service that are “citizen-initiated” 7 and exclude all police-self-initiated calls for service that were generated by officers. 8 For each agency, we analyzed one full year of CAD data. For most agencies, we used data from 2016 or 2017, the most recent full calendar years available at the project's outset. 9 All CAD data collected for this study were from periods before the COVID-19 pandemic and protest events of 2020. These data, therefore, well-represent the landscape of 911 calls that these and other agencies are likely to receive.
Information collected about each call across the nine agencies included the CAD incident number uniquely assigned to the call; the source of the call (citizen, officer, administrative); date and time markers of when the call was received, assigned, responded to, and completed by officers; locational data for the call; the type of event; and the disposition or result of the call, if available. We did not collect any personally identifiable information about suspects, victims or witnesses per our human subject agreements. Unfortunately, there is no standardized coding or collection of CAD data across law enforcement agencies in the United States as there is for offense and arrest types reported in the Federal Bureau of Investigation’s Uniform Crime Reports or National Incident-Based Reporting System (NIBRS). Thus, local recording conventions, systems, and practices often dictate how CAD data from any given agency is generated, complicating cross-agency comparisons. For example, one agency might label a robbery with a gun with the shorthand “robgu,” another may label it “322” (connecting it with a key), and yet another might use the phrase, “robbery with a firearm” and have no key available. The level of specificity in the description can also vary. A barking dog complaint may be coded in the CAD data as “animal,” “nuisance,” “suspicious behavior,” “disorderly conduct,” “noise complaint,” or “barking dog complaint.” Agencies also may re-classify a call as something else once an officer arrives and determines the nature of the situation (see extensive discussion by Ratcliffe, 2021). Both public safety call centers and their associated agencies also have varying cultures that influence how they describe community problems, which creates unique call-coding habits and protocols. Spelling errors and colloquial uses of shorthand are also prevalent. Each of the nine agencies provided us with unique CAD data containing these many unique features.
To standardize CAD data across the nine agencies, we used an iterative process. Based on a preliminary assessment of call type descriptions and codes across all agencies, we developed a set of general categories (e.g., violent crime, property crime, traffic-related) that capture the breadth of events commonly called in by people and dispatched to officers. We then classified each agency’s specific CAD codes into one of these general categories. We also expanded or added new general call categories as needed to capture CAD codes that did not readily fit into our original groupings. When needed, we consulted with members of the agency, dispatchers, and policing experts to clarify particular CAD codes and decide on classifications. All of the authors reviewed and discussed the codes to reach an agreement on these categorizations. In summary, fourteen categories (listed alphabetically below) emerged from this process: Administrative, organization-related, and non-crime events: These calls included various events such as officers being off duty, taking breaks, engaging in special details, taking their patrol vehicles in for maintenance, assisting other officers on their calls for service, providing vehicle escorts, conducting warrant services, writing reports, and other miscellaneous but vague or unknown activities. Some of calls may be officer-initiated. B, because they were categorized as dispatcher or citizen-initiated, we did not selectively remove them, but clearly distinguish them in our analysis. However, we caution readers that some of these events are likely not citizen requests for service. Alarms: These were calls related to alarms of any kind (business or residential). Calls for service about alarms are often false alarms or possible tests (see Schaenman et al., 2012). However, it is common that officers still have to respond to these locations, as noted by Lum, Koper, Stoltz et al. (2020) systematic observations of dispatchers, if only to clear the call or to confirm the absence of a burglary. Vice: This category captures events indicating that drugs, prostitution, or gambling were involved. Disorder: The term “disorder” refers to social or environmental events (some are crimes; some are not) that “disturb the peace.” Here, we include calls for events such as noise violations, animal disturbances, civil disputes, disorderly conduct, trespassing, abandoned vehicles, graffiti or vandalism, people who were drunk in public, loitering, fireworks, illegal dumping or burning, disturbing the peace, public urination, vagrancy, and the like.
10
Domestic-related: This category includes any form of domestic dispute, child abuse or neglect, and other family-related disturbances and issues. Determining whether a call for service from CAD data was domestic-related was challenging. Sometimes calls were specifically labeled as “domestic,” “family,” or “child-related.” Some CAD data also captures a separate data element where officers or dispatchers can flag the call as domestic-related. These were used to create this category. However, sometimes these events were categorized as violence (including physical and sexual child abuse), as discussed below. Domestic-related events may also be categorized as disorder, as described above. This particular category reflects the many challenges with unstandardized CAD data. Follow-ups and service requests: This category includes any calls for service requesting follow-ups from previous public safety services or other service calls, such as being locked out or in need of some assistance, that were not themselves crime-related (although they may be related to a previous crime-related call). Mental: This category includes officer dispatches for events involving someone in mental distress. Examples include calls for emotionally disturbed individuals, including suicide threats or attempts. Medical: This category includes officer dispatches for events involving someone in medical distress. Examples include calls for medical rescues or for individuals who were found injured or deceased. In some cases, paramedics may have also been dispatched, but all calls categorized in this analysis involved a police officer being dispatched as a first responder. Missing persons: This category includes any calls for missing persons or runaways. Violence: These calls include all types of violence, including homicide, rape, sex crimes, robbery, assaults (including both felonious/serious “aggravated” assaults and misdemeanor or “simple” assaults), and other weapon-related offenses. This category can include domestic violence, although calls only indicating domestic arguments in which agencies also have domestic violence categorizations are categorized as “domestic” above. Child sexual and physical assault crimes are also included as violence, although child “related” (a more ambiguous call type) or “child neglect” were categorized as “domestic” above. Again, we note that there may be errors in how agencies or we classify calls, given the limited information in the CAD data. Interpersonal-other: These calls include other interpersonal calls that are not classified as “violence” above, but were interpersonal in nature. These include, for example, telephone harassment and phone threats, indecent exposures, and stalking. Some agencies may classify indecent exposure as a sex crime (and therefore, those crimes may fall under “violence” above). Property: This category includes all property crimes (i.e., thefts, larcenies, fraud, burglary, forgery, etc.) and property destruction. Suspicions: This category includes any call which was labeled “suspicious” (including events, persons, vehicles, or noises) as well as prowlers, peepers, and suspicious persons stopped. Traffic-related: This category includes all traffic-related issues such as accidents, parking violations, disabled vehicles, hit and runs, traffic-related injuries, and roadway hazards.
We recognize the many problems and challenges with grouping different call types in the ways shown above, but felt that these categorizations were common and relatable to most agencies. We recognize that some calls that are classified as one category could have also been classified as another. This problem cannot be overcome in this study as it is based on the peculiarities that characterize the way any given jurisdiction’s dispatchers, citizens, or officers might interpret events. Some have also argued that calls related to people in serious mental distress may not appear as mental health calls (although Lum, Koper, Stoltz et al. (2020) systematic observations seem to suggest this misclassification is not as large as believed). This may also be the case with “medical” calls (see discussion by Ratcliffe, 2021). However, when possible, we used either the primary or final call classification for each call if multiple classifications appeared in any given call record to reduce this type of error. We note that each call for service analyzed for this study is categorized into only one of the categories below that fits best given the data and information we could gather about each call. 11
After standardizing each call description to these fourteen categories, we then examined and compared the volume and distribution of call types across agencies, calculated the average time (in minutes) that various calls required once an officer arrived, and the overall amount of time spent by agencies on the different types of calls for service. Finally, we examined the outcomes or dispositions of calls, which were provided by five of the nine agencies, to get a better sense of what official action (if any) was taken for each call for service.
Results
Frequency by Call Type
Table 2 shows the percentage of citizen calls accounted for by each of the fourteen event categories by agency. A large proportion of calls that police agencies are receiving from citizens do not seem to be for serious crimes or obvious emergencies. Rather, the most common types of calls to which officers were dispatched, on average, were traffic-related events (averaging 16.8% of all calls across the nine agencies), disorders (averaging 16.2%), suspicions (averaging 12.8%),
12
follow-ups and service requests (averaging 11.2%), and property crimes (averaging 10.2%). Table 2 also shows each agency’s top three call types in
Percentage of Total Calls by Call Types Responded to By Officers for Each Agency.
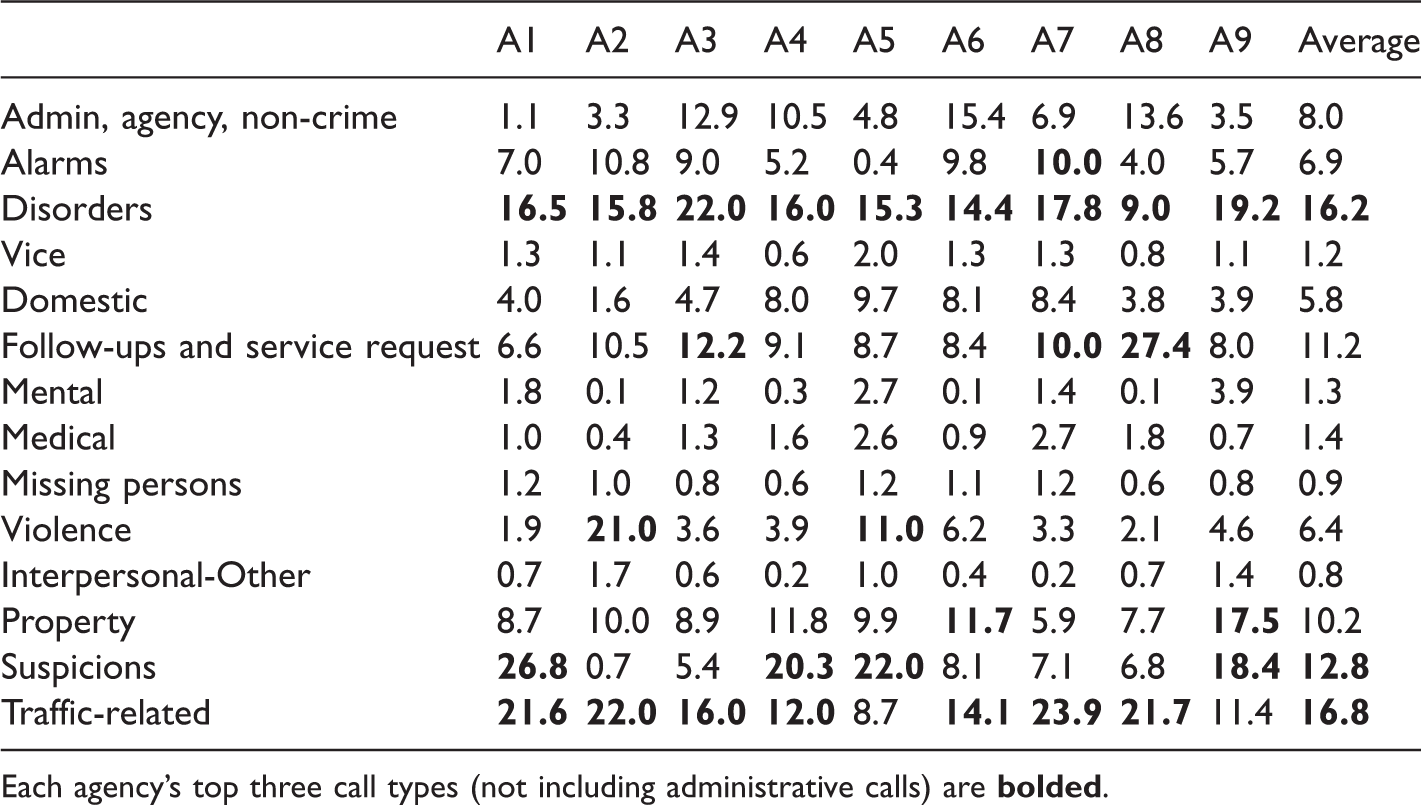
Each agency’s top three call types (not including administrative calls) are
We draw the reader’s attention to a provocative finding from Table 2: Calls related to mental health concerns were only a very small proportion of calls dispatched to the police in each of these nine agencies (approximately 1.3% of calls on average across these nine agencies, and no more than 4% for any specific agency). This does not support the common view that police agencies are handling large amounts of calls for people in mental distress, and therefore provides the first indication that significant defunding of the police would likely not be achieved even if another agency handled these calls.
Time Spent on Different Call Types
While Table 2 shows the proportion of various event types handled by each agency, such proportions do not give us a sense of how much time, on average, officers spent on these types of calls. For example, although mental distress calls only consist of a small percentage of calls, they may take up more time (and therefore, resources) than suggested by Table 2. Understanding the amount of time spent on certain categories of events may better inform our thinking about which events police should better manage, prevent, or divert.
Table 3 shows the average time spent (in minutes) by officers per type of call for each agency. These times are calculated from the first officer’s arrival at the scene until the precise time reported that the call was completed. Note that the close-out of any call could be made by a different officer than the initial officer on-scene, and that there may be multiple officers who respond to any given call for service. Back-up resources are not calculated into these averages due to many complications related to that calculation that may inflate the amount of resources actually spent or needed on any given call for service. 13 We also do not include response times in these calculations, as they would unnecessarily inflate actual time spent on calls. Response times vary dramatically across different call types and are actually much longer than laypersons believe because officers do not immediately respond to many calls, given their low priority. 14 Instead, this is just the total amount of time, from start to finish, during which one or more officers were on the scene.
Average Amount of Time (in Minutes) Spent on Call Types for Each Agency.
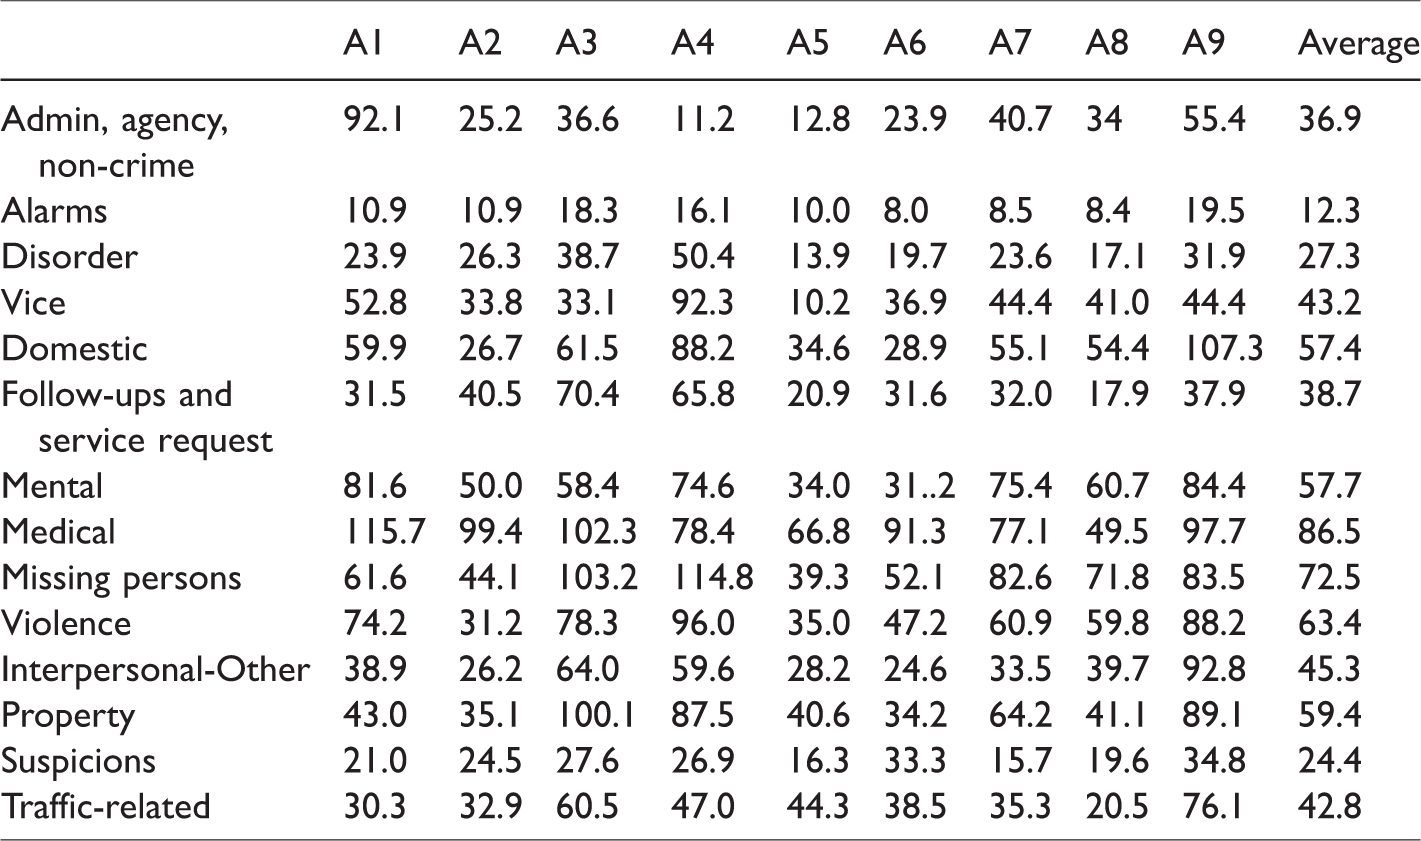
As Table 3 shows, the average time elapsed per call type varied from a low of 12 minutes (for alarms) to a high of 87 minutes (for medical calls). However, most call types averaged somewhere between 20 to 60 minutes. Here, the types of calls that appear to take longer to resolve on average are calls related to people in mental or medical distress, missing persons, and violence. These findings were expected; all three types of calls likely require the response of specialized units (including medical responses), written reports, specific procedural or investigative requirements, the transport of individuals, and perhaps even arrests. Similarly, domestic-related and property crimes also take up more time because of these factors.
Certain categories of calls, notably domestic-related and mental/medical calls, have more substantial between-agency variation in the average time used. This may be due to variations in how each agency codes domestic calls or fundamental policy differences in how different agencies respond to domestic calls. For example, some agencies may require officers to take pictures, conduct risk assessments, and carry out other procedural requirements in domestic violence situations, whereas other agencies may not. We advise caution, therefore, in reading too much into between-agency differences in these times. The more critical question for law enforcement agencies about time spent on calls comes from an evidence-based perspective: whether more time spent on certain calls leads to specific outcomes sought. For example, if more time is spent collecting evidence or conducting risk assessments in domestic violence cases, does that increase the probability of successful prosecution of offenders or a domestic violence victim’s life chances or empowerment? Or, if time spent on mental health calls primarily involves an officer transporting and then waiting with an individual for mental health assessment, is that the best use of an officer’s time?
Table 3 does not tell us the total amount of time an agency spends on these call types relative to the time it spends on other calls. For example, while serious violent crimes or cases of individuals in mental distress take individually longer to resolve, Table 2 shows that they are relatively rare and therefore may take up only a small proportion of an agency’s overall time spent responding to calls. To show this relative use of patrol time, Table 4 displays the percentage of total response time that officers spend on each type of call. These statistics incorporate the volume of different call types (from Table 2) and the average time spent on these calls per event (from Table 3). To calculate these percentages, the total time officers spent handling each type of citizen call (based on the frequency and average time per call) was divided by the total time officers spent on the universe of citizen calls. In Agency A1, for example, 14.5% of the time officers spend on citizen-initiated calls was spent on disorder-related calls; for Agency A8, the corresponding figure was 6.2%.
Percentage of Total Call Time Spent on Specific Call Categories.
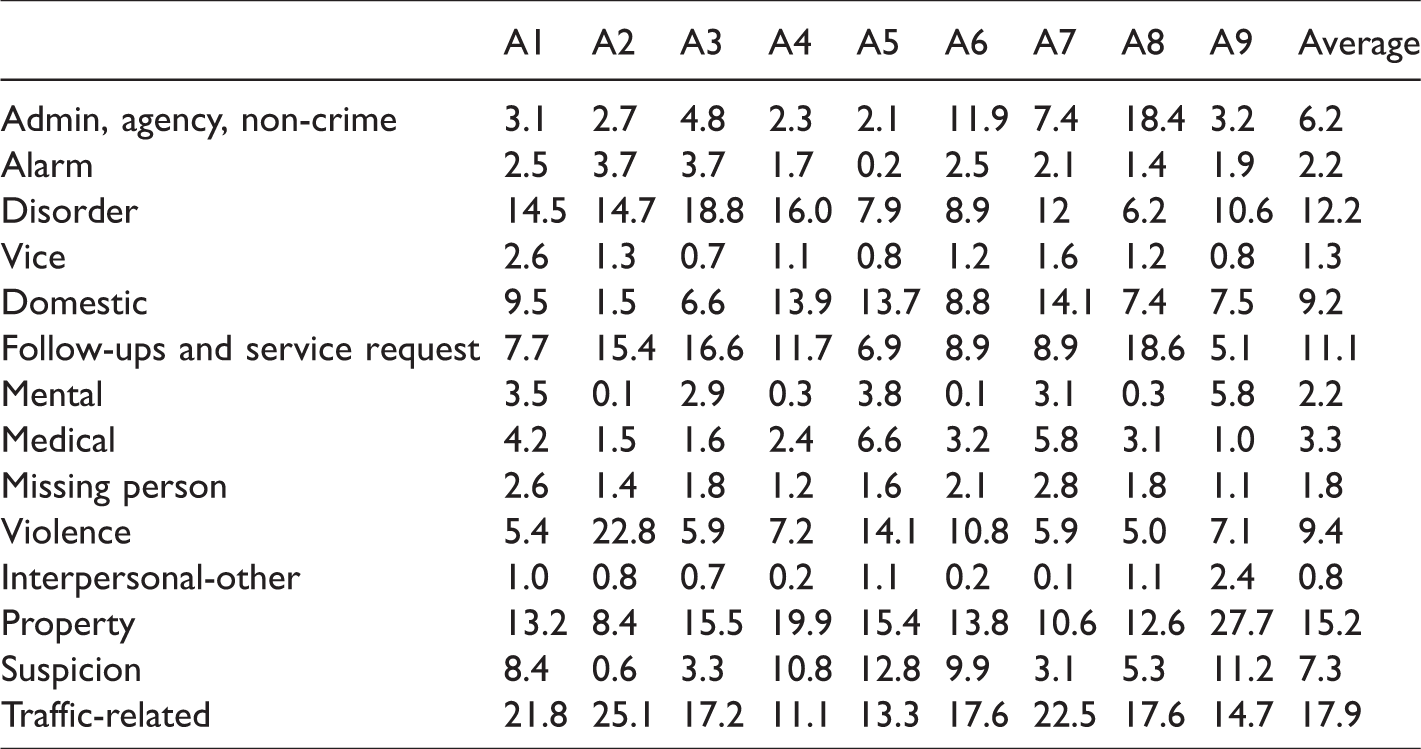
Table 4 shows that even though some calls take up a large amount of time individually, the calls that take up the largest proportion of officer time overall are traffic-related matters, property crimes and damages, disorders, follow-ups, and other service requests. Each of these categories takes on average between 11% and 18% of the total time that officers spend responding to calls. Combined, they account for 56.4% of the total time that police spend answering citizen calls. If we remove the administrative, agency and other non-crime category, this proportion is even greater. Traffic-related calls for service remain not only the largest proportion of calls for service received, but on average, take up the largest proportion of time spent by agencies on calls for service. Suspicion calls, while making up a large proportion of calls, take up much less total time compared to, for example, property-related calls. Calls that account for the smallest shares of officer response time (less than 5% each) include missing persons, medical and mental health matters, vice problems, alarms, and other miscellaneous interpersonal matters.
Call Dispositions
Lastly, we examined the disposition, or final result, of every call for service for five of the nine agencies from which we could access that information. We note that sometimes the final outcome of a call for service may not happen for days (for example, an arrest related to a homicide). Here, we only provide the final disposition of a patrol officer’s response to a call for service. So, if a homicide occurred and no arrest was made by the responding officer, the final disposition of that call would likely be that a report was written. For this analysis, dispositions were standardized into three categories: when officers only assisted or advised but did not take additional official action (i.e., write a report or make an arrest) beyond responding to the call for service; when a report was written (but no arrest was made); or when an arrest or citation was issued. Dispositions provide an important context as to whether diverting some calls for service might be able to “reduce the footprint” of the criminal justice system, given that arrest (and citations) are often the official entry point of an individual into the criminal justice system.
Table 5 shows the percentage of calls by call type by our general disposition categories. For a large majority of calls for service on average and across particular event types, officers rarely made an arrest and infrequently wrote an official report. Most of the time (between 62% and 83% of calls received) they are likely providing either assistance, advice, or peacekeeping functions, and took no further official action (at least from what can be discerned from the CAD data) beyond responding to the call. Reports were written less frequently (between 16% and 34% of calls across agencies). Finally, arrests and citations constituted only a small fraction of the outcomes of calls for service (averaging between 2% and 9% of calls across agencies). Citations for traffic infractions primarily drove these proportions. In addition to being the most frequent type of call across the agencies, traffic calls were also among the most likely to result in a citation or arrest in multiple agencies. Overall, however, there was no consistent tendency for any particular type of call to result in a citation or arrest. We discuss this more below, but this may indicate that reducing the types of calls that police handle may not dramatically reduce arrest rates.
Percentage of Calls by Type and Disposition.

aWhen an officer only assisted or advised but did not take further action beyond this response (such as write a report or make an arrest).
bWhen a report was written, but no arrest or citation was given.
Defund the Police? The Question (and Answer) May Not Be That Simple
People are upset about the long-standing disparities and injustices of our criminal justice system, and rightly so. High-profiled deaths of unarmed individuals—many of them Black Americans—at the hands of the police have generated a sense of urgency that something must be done. However, it is unclear whether shifting resources away from the police can achieve these broader goals. Our descriptive analysis of calls for service in nine agencies across the U.S. provides a provocative context for this debate. We suspect such analyses in other agencies would likely yield similar findings. People call the police for a wide variety of concerns and do so frequently. Traffic-related problems, everyday disputes, worries of suspicious behaviors, disorders, disturbances, and general requests for help and assurance appear to make up the bulk of events to which police officers are dispatched. These findings reveal not only people’s expectations of what they think the police should handle, but also the absence of other public or private agencies that people can call for these daily concerns. These expectations may be even more salient in poorer communities that may already lack high-quality social services or may not be able to provide for them privately. If such calls for services are diverted away from the police, it is very likely that substantial investments in other social service agencies or the creation of entirely new entities would be needed to handle the volume of these calls.
Two other notable patterns emerge from our findings. First, contrary to popular perceptions, mental distress events accounted for only a small fraction of calls to the police and time that agencies spend responding to those calls. This was also found by Lum, Koper, Stoltz et al. (2020) in their systematic observations of calls coming into 911 call centers. However, we do not mean to minimize this issue by making this point. Serious events that may happen infrequently are still a high priority to both police and communities. Research has also found that calls related to people in mental health distress can result in an increased risk of officers using force or getting injured themselves (Morabito & Socia, 2015; Reuland, 2010; Rossler & Terrill, 2017; Teplin, 2000). Enhancing mental health services, providing training in critical incident response or de-escalation, and adopting co-responder models for mental health calls may not only help people in need but also reduce law enforcement risks of negative consequences (Morabito et al., 2018; White & Weisburd, 2018; Yang et al., 2018). All of these activities require resources that are justified in their own right. Shifting the small amount of resources currently spent on these calls by the police will likely not be enough to support an effective response to mental health crises.
Second, across most agencies and call types, only a small share of calls for service result in citations or arrests. Thus, diverting various types of minor and otherwise non-criminal problems from the police may not reduce arrests (or disparities within arrests) to the degree expected or hoped for by some reformers. Again, diversion of these incidents (or the police simply not handling such calls for service) may be justified by other reasons, such as keeping kids out of the justice system to tangible results in prevention or reduction of recidivism. If society goes this route, the challenge will become how to adjust community members’ expectations about what police services they can demand. On the other hand, many scholars of community policing, as well as police leaders and community members, have repeatedly emphasized that the often minor problems for which people regularly call the police are those they are most concerned about (see Mazerolle et al., 2002; Skogan, 1990; Sousa & Kelling, 2006; Thacher, 2004). These calls are also spatially concentrated in places that lack access to other resources to resolve these problems (Braga & Bond, 2008). Although not responding to these minor calls may indeed “reduce the footprint” of the criminal justice system, removing police response to these issues may also reduce law enforcement's community policing and crime prevention capabilities and functions or erode police legitimacy in these places (Mazerolle et al., 2002). Along similar lines, some of these minor repetitive issues, either individually or in the aggregate, may signal bigger problems that do need attention. For example, domestic violence may have previously manifested as frequent calls for service for non-violent disputes or arguments. Addressing problems and concerns before they turn into crime forms the theoretical basis of Goldstein’s (1990) problem-oriented policing approach, which has been shown to be an effective way to both prevent crime and strengthen police-community relations (see Hinkle et al., 2020; National Academies of Sciences, 2018). All of these suggestions require much more research into the call-for-service behavior of the public, including what prompts their calls, whether they know of (or have access to alternatives), and whether they can make adjustments to their expectations of the police without reducing the legitimacy they afford to the police, which as aforementioned, may rely on these service responses.
Discussions about defunding also assume that better service could be provided by someone else. This assumption will have to be tested if responsibilities carried out by the police are transferred to others. However, at the time of this writing, there does not appear to be any alternative social service that could readily take over the response to many of these calls or meet the around-the-clock expectations that community members currently have when they call 911. It is also unclear whether alternative social services—if they did exist—would provide better, fairer, and legitimate service, as poor-quality, disparate, and bad service occurs across many government, social services, and public health sectors (see, e.g., Maura & Weisman de Mamani, 2017; Putnam-Hornstein et al., 2013; Schmidt et al., 2006; Thornicroft, 2011; Van Ryn, 2002). It is even more uncertain whether community members can band together to assist each other. In many communities, collective efficacy and the capacity for collective action may not be sufficient to handle these responsibilities through community-based approaches. Within the context of our current divisive political environment and within a society where the gap between the haves and have-nots continues to expand, such community-based approaches may lead to even more disparities in the delivery of public safety services.
If calls were to be diverted or managed by other agencies or citizens themselves, several considerations would need to be addressed, likely netting greater investment in social services and public safety, not less. Emergency call centers’ policies, practices, training, and technologies would have to transformed and expanded to be able to divert calls elsewhere or be trained to resolve more calls. This would also require either new entities to handle these concerns, or stronger collaborations between agencies (whether or not police-related) to respond to a multitude of situations (as examples, see Gill & Gross Shader, 2020; Spoth & Greenberg, 2011; see also Weisburd et al., 2020). Moreover, even if more resources for mental health could be garnered, people would then need to be convinced to agree to using these resources. As Yang et al. (2018) note, a sizeable portion of individuals calling the police for mental-distress related issues later refuse the help offered by mental-health providers.
A related consideration is whether these matters can be handled safely by other providers. By virtue of their authority to make arrests and use force, the police—at least in theory—may be more effective in diffusing situations, deterring escalation, and gaining compliance compared to other social service providers or community actors. Alternative responders might also desire police accompaniment in situations that have any potential for danger or other liabilities (as when police respond with mental health providers, probation officers, or other social service workers to situations with any potential for violence). If police are still needed to co-respond to these problems, it will limit the degree to which their agencies can be defunded. Future research might thus inform this discussion by probing more deeply into the nature and consequences of the many minor and non-criminal matters handled by police, particularly calls about disputes, disorder, traffic accidents, and suspicious circumstances, to assess the potential for other providers to handle them effectively and safely.
If defunding does not occur, this also does not let the police off the hook for their accountability to their responsibilities. Even if a jurisdiction does not shift resources away from the police, we are still left to determine the quality of police response to calls for service. Poor quality policing has fueled citizen anger toward the police. How officers speak to people, the empathy and emotional intelligence that they convey, the procedural justice that they display, the distributive fairness in their decisions, and ultimately, their actions and the effectiveness of their actions are at the heart of defunding discussions. Accountability to higher quality service when police do respond will continue to be a concern if defunding does not occur.
Additionally, perhaps just as important as how police or others respond to calls for service is whether they can prevent calls from happening in the first place. This discussion is often missing from defunding arguments but has a substantial research evidence-base. We now have a great deal of research, supported by two National Academy of Sciences policing committees (see National Academy of Sciences, 2018; National Research Council, 2004), which find that the police can act proactively to reduce calls for service and improve police-community relations. Research on deterrence more generally indicates that police can be much more effective in deterring crime through preventative, not apprehension activities (Nagin, 2013). Much of this preventative activity occurs during police non-committed time (when they are not responding to calls for service). Research continues to find that a fairly large proportion of officers’ patrol time is uncommitted to any activity – including responding to citizen calls for service – and that time can be used for proactive and preventative patrol and problem-solving (Famega, 2005; Famega et al., 2005; Frank et al., 1997; Koper et al., 2020; Lum, Koper, Wu et al., 2020; Weisburd et al., 2016; Whitaker et al., 1982). Accordingly, the findings of this study suggest that police should direct more preventative and problem-solving efforts to reduce traffic problems, disorder, and other issues that generate a substantial share of citizen calls. Defunding the police would likely reduce their capacity to act in this manner, raising the question of whether other entities (e.g., a civilian traffic corps or code enforcement agencies) could fill these roles effectively.
At the same time, those calling for reducing the criminal justice system's footprint by diverting police from responding to “minor” calls or even reducing their proactive activities make important counterpoints. The story of the increased use of certain types of proactive approaches (i.e., misdemeanor arrests and zero-tolerance approaches for minor disorders), and their negative consequences in increasing incarceration and criminal justice system disparity, has been well documented. Police response to disorders, suspicions, traffic-related problems, and other vague events have also led to complaints of over-policing in minority communities, including the charge that police and others are harassing people of color for doing everyday things (e.g., “[swimming/sleeping/other everyday activities] while Black”). In cases of people in mental distress, perhaps police do not have the professional tools to respond, and their response only increases the likelihood of an individual being arrested or harmed when they might need other types of help. Similarly, Lowder et al. (2020) argue this can occur when giving officers naloxone to respond to opioid overdoses (as oppose to letting medical responders handle overdoses).
Research in policing has highlighted the complexity and interconnectedness of police reform and social justice in communities. Shifting resources from the police to another governmental (or non-governmental) agency is still an unproven suggestion, and given the empirical data presented above, may be unrealistic. At the same time, if the police do retain their resources (and associated responsibilities), then they must be held accountable for the outcomes that the public seeks. From a research perspective, if a defunding approach is taken, municipalities and governments will need to evaluate whether these reforms effectively deliver broader outcomes (such as crime control and community safety). If the police are not defunded, more accountability will need to be implemented to ensure that agencies are providing for crime control and legitimacy outcomes that research shows they can provide.
Footnotes
Declaration of Conflicting Interests
The authors declared no potential conflicts of interest with respect to the research, authorship, and/or publication of this article.
Funding
The authors disclosed receipt of the following financial support for the research, authorship, and/or publication of this article: This project was funded by Arnold Ventures.