
Abstract
The 2017 National Academies of Sciences (NAS) Committee and Report on Proactive Policing highlighted what we know about the effects of proactive policing practices on crime prevention and police–community relations. However, the evaluation evidence reviewed by the NAS, which largely comes from case studies of carefully managed proactive initiatives, does not provide a basis for estimating how extensively these practices are used or whether they are used in the most effective ways. Accordingly, it is unclear whether police proactivity as practiced on an everyday basis reflects optimal strategies and implementation methods as recommended by the NAS. This study addresses this knowledge gap by analyzing almost 2 million computer-aided dispatch records from four agencies and systematically observing 84 officers for more than 180 hours to better understand the empirical realities of police proactivity. The findings indicate a major difference between the types of proactive interventions supported by research and the practice of everyday police proactivity. Specifically, proactive policing practices are limited in scope and are often implemented in less than optimal ways. A large proportion of proactive activities are also not recorded, rewarded, or supervised, indicating that patrol commanders may have little control over, or awareness of, proactive deployment. From an evidence-based policing perspective, much more effort is needed to record and track proactivity to measure its impacts (both positive and negative) and align it with what we now know about effective proactive activity from research.
Introduction
One of the most significant reforms in modern policing has been the push for police to be more proactive and preventative. The recent National Academies of Sciences (NAS, 2018) Committee on Proactive Policing formally defined proactivity as:
strategies that have as one of their goals the prevention or reduction of crime and disorder and that are not reactive in terms of focusing primarily on uncovering ongoing crime or on investigating or responding to crimes once they have occurred. (pp. 1, 30)
Thus, in its simplist form, proactive policing includes law enforcement officers’ actions to reduce crime and disorder or improve police–citizen relationships outside of their responses to 911 calls or dispatcher requests for backup or administrative duties. Proactivity might include, for example, conducting traffic stops in a high-accident location to reduce speeding and prevent future crashes, approaching a suspicious or high-risk individual for questioning or supervision, providing visible presence in a high crime area to deter would-be offenders, problem-solving with residents to prevent future problems from occuring, or working with children to teach them how not to be victims of crime. Proactive policing need not be particularly innovative. However, well-known policing innovations in the last four decades are indicative of this approach and have included community-oriented policing, problem-oriented policing, intelligence-led policing, place-based or “hot spots” approaches, focused deterrence initiatives (i.e., “ceasefire” or “pulling levers” approaches), the so-called broken windows approach (sometimes referred to as zero-tolerance policing or disorder policing), policing with procedural justice, and traffic initiatives intended to prevent accidents, drunk driving, or even crime (i.e., the “DDACTS” program 1 ).
After reviewing the research on these programs, the NAS committee 2 concluded that these types of proactive activities—with important caveats and exceptions—can be important to law enforcement’s ability to prevent and reduce crime and improve community satisfaction. The committee’s conclusion was primarily based on a large body of existing evaluation research that has examined the programmatic interventions aforementioned. Despite these findings, the everyday reality of police proactivity is actually not well understood and may differ from the proactivity examined by the NAS. Many of the proactive interventions that the NAS committee reviewed were developed primarily as special initiatives and for the purposes of research and evaluation. However, we do not know whether those interventions are practiced regularly by law enforcement agencies or what other types of proactivity might be deployed on a day-to-day basis. The committee also considered the possibility of negative consequences of certain types of proactive activities. But without knowing to what extent and how those activities are practiced, the nature of those consequences remain elusive.
In this study, we examine the nature of proactivity as practiced, inquiring whether that practice is aligned with how researchers and their practitioner partners have envisioned and studied police proactivity. To answer this question, this study uses a combination of systematic observations, interviews, and data analysis to examine the types, frequencies, and dosages of proactive policing activities in daily patrol work. The results are provocative; the realities of proactive policing are starkly different and much more limited compared to the proactivity that is studied in the evaluation research. Specifically, police primarily operationalize proactivity through traffic stops and generalized preventative patrol, rather than the variety of proactive interventions presented by the NAS. Officers also do not record their proactive activities with the same consistency and detail as their reactive activities, leaving both researchers and practitioners at a disadvantage in terms of tracking, measuring, and adjusting proactive deployment. Given the NAS’s recommendations, reconciling these disconnects between research knowledge and how proactivity is practiced will be an essential translational step in improving the fair and effective implementation of evidence-based, proactive innovations.
Everyday Proactivity—A Knowledge and Measurement Gap
One needs only to attend an International Association of Chiefs of Police annual conference, read The Police Chief Magazine, or sit in on a “Compstat” or community meeting to see that police leaders want their officers to be more proactive and prevention-oriented. Police chiefs will often remark that making arrests and reacting to calls for service are no longer enough to address the myriad concerns that law enforcement agencies face. This push for more police proactivity has not only been fostered by police leaders but has also been supported by a large body of research (see reviews by Lum & Koper, 2017; National Research Council, 2004; NAS, 2018; Sherman & Eck, 2002; Weisburd & Eck, 2004). Overall, this body of research has found that tailored and focused strategies that target specific high-risk places or people using proactive and problem-solving approaches can be effective in reducing crime and disorder, at least in the short run. In addition, other proactive tactics that are more community-centric may not necessarily lead to immediate crime reductions but can be essential to improving police legitimacy, community satisfaction with police activities, and procedural justice (see Gill, Weisburd, Telep, Vitter, & Bennett, 2014).
The generally positive evaluation research about the effectiveness of proactive interventions comes with important caveats. The NAS Committee on Proactive Policing warned that some types of proactive policing could have unintended effects. These effects can include prompting negative reactions from communities; failing to impact crime, disorder, and fear; increasing the risk of harm to citizens and officers; creating unwanted disparities; or even violating constitutional rights (NAS, 2018). For example, misdemeanor broken-windows arrest strategies or pre-textual traffic stops 3 can be overused in aggressive ways which could result in racial and ethnic disparities in both criminal and social justice outcomes. Some community policing strategies once thought to prevent crime may have little effect on crime and disorder and may cost taxpayers large sums of money (a well-known example being drug abuse resistance education programs or “DARE”). Other proactive approaches, such as pedestrian stops, could be used in targeted and limited ways for crime control gains, but, at the same time, may reduce the legitimacy of the police, especially among communities of color.
The research knowledge reviewed by the NAS about police proactivity primarily comes from evaluations of ad hoc and often short-lived interventions, programs, strategies, or tactics, many of which were developed for research and evaluation or were special law enforcement initiatives evaluated after the fact. This research is important, as it provides agencies with ideas to shape their proactive work in ways that are both legitimate and effective. What might inhibit such efforts, however, is that we know very little about the extent and types of proactive policing approaches that are actually being implemented daily and with what effects. For example, although we know that problem-oriented approaches in crime hot spots can be an effective option to reduce crime and increase community engagement or satisfaction (Braga, Papachristos, & Hureau, 2014; Weisburd, Telep, Hinkle, & Eck, 2010), it is unclear to what extent, how frequently, and in what ways patrol officers (or specialized units) engage in problem-solving activities. While almost all agencies who respond to the U.S. Department of Justice Bureau of Justice Statistics’ Law Enforcement Management and Administrative Statistics survey report that they engage in community policing or problem-solving, these statistics do not tell us the substance or level of this engagement on a day-to-day basis. While we know that many agencies use crime analysis to create crime maps for hot spots policing (Weisburd & Lum, 2005), it is unclear how these maps drive directed patrol in specific agencies or to what extent “hot spots” patrol is part of the everyday patrol activities of uniformed officers. Once officers get to crime hot spots, it is also uncertain what actions they are taking at those hot spots or the frequency, duration, or dosages of those activities.
There are many reasons why both researchers and police organizations do not have a firm grasp on the daily practices of proactivity. Most significantly, proactivity is not well recorded or documented in police accountability systems as are other types of police activities (i.e., responding to 911 calls, reporting and investigating crime or traffic accidents). Take, for example, computer-aided dispatch (CAD) or “911” systems which are widely used data collection technologies that document the daily activities of individual police officers. CAD systems were specifically designed to record reactive, administrative, and investigative activities as well as to facilitate officer safety. For example, CAD not only records the actual calls for police, fire, and emergency services from people, but it also subsequently records the dispatch and response to those calls for service and each stage of those responses. CAD also captures officer administrative duties (e.g., when an officer calls out of service to write a report, takes a bathroom break, puts gas in a vehicle, etc.), allowing officers to alert dispatchers when they might not be available to answer a call for service.
Thus, CAD was not intentionally built to record proactive activities because its foundation comes from a need to capture citizen reporting. For example, when a patrol officer responds to a 911 call of a theft from a vehicle, the 911 system records the officer’s activity as it happens and a records management system will also capture the report of this crime if a report is written. However, when that same patrol officer carries out targeted directed patrol or knock-and-talks in a residential neighborhood to try and prevent vehicle burglaries, that officer may not alert the dispatcher or record the activity in a mobile computer terminal (both which would generate an event record in CAD). Police officers may feel that they do not need to record information unless they have a legal or administrative reason or justification for doing so. Further, some proactive interventions, like community engagement or problem solving, may not be easily reduced to a simple and commonly used CAD event description. 4
This lack of recording proactivity is both the consequence and subsequently the cause of a more institutionalized and substantive challenge to police proactivity: the dominance of reactive policing in U.S. law enforcement (Lum & Koper, 2017). This is not to say that officers only engage in reactive policing; indeed, they do much more than respond to 911 calls or make arrests (Frank, Brandl, & Watkins, 1997; Kelling, Pate, Dieckman, & Brown, 1974; Mastrofski & Parks, n.d.). But police organizational infrastructures and systems continue to be strongly influenced by the reaction to emergency and nonemergency calls for police service, resulting in relatively weaker documentation infrastructure and accountability systems that support proactive policing. CAD systems are only one example of this situation. These systems often have hundreds of specific codes to record and document reported crimes, reactive activities, and administrative duties. However, these systems have many fewer codes to describe proactive activities. Often, reactive codes are used as a matter of convenience to vaguely describe proactive activities.
This emphasis on reactivity also has ripple effects on the performance metrics used by the agency, which then reinforces (and rewards) a reactive approach. The dominance of reactive patrol and investigative work (and the reactive supervision of this work) also means that the majority of an agency’s human and technical resources become focused on reaction, not proactivity, especially in the domains of training, technology use, supervision, management, and standard operational procedures development (see descriptions by Bayley, 1994; Lum & Koper, 2017; Ratcliffe, 2008). Most training hours are spent on learning how to respond to calls for service, writing required reports, understanding criminal procedures and due process, and operating response technologies. Potentially proactive technologies—such as crime analysis—become more tactical than strategic and are used mostly to aid the investigation of already-occurred crimes rather than the prevention of future ones (Lum, Koper, & Willis, 2017; O’Shea & Nicholls, 2003; Santos & Taylor, 2014). This state of affairs leaves policies, guidelines, and operating procedures for proactivity underdeveloped, pushing proactivity into the realm of officer discretion, which is often highly protected by officers and less regulated. Because of this organizational state of affairs, proactive activities are in turn much less likely to be recorded, measured, analyzed, or supervised by law enforcement organizations and officers, even when they do occur (Lum & Koper, 2017).
Despite the underdeveloped infrastructure for police proactivity, the potential for proactive activity by officers could be very high (Cordner, 1979; Kelling et al., 1974; Reiss, 1971). Not only do we have a rich body of research that supports the effectiveness of proactive policing in a variety of outcomes, but research also indicates that police have the time to be proactive. Empirical estimates of “uncommitted” time (the time not spent responding to 911 calls or conducting required administrative duties) have ranged from 25% to 80% (Famega, 2005; Famega, Frank, & Mazerolle, 2005; Frank et al., 1997; Weisburd, Wooditch, Weisburd, & Yang, 2016; Whitaker, Mastrofski, Ostrom, Parks, & Percy, 1982).
A few studies have documented what officers might be doing during this uncommitted time, presumably some activities of which are proactive (Frank et al., 1997; Kelling et al., 1974; Mastrofski et al., 1998). In particular, Frank et al. (1997) used systematic observations to document a wide variety of activities officers engaged in during their shifts (and the time spent on those activities). However, in their analysis, it was not always clear which activities were proactive, and only two activities were labeled as being conducted during uncommitted time—vehicle and foot patrol (but not what was happening during those patrols). 5 There have also been descriptive analyses and evaluations that have used officer-initiated activities as recorded by CAD data as outcome measures (see, e.g., Headley, Guerette, & Shariati, 2017; Wallace, White, Gaub, & Todak, 2018; Wu & Lum, 2017). These studies suggest CAD-recorded proactive activities as practiced often include traffic and pedestrian stops, business checks, community engagement activities, service and follow-up activities, or proactive investigations. However, none have used systematic observations to validate this information or document the nature and dosages of specific types of proactive activities.
In summary, the knowledge about proactive policing comes primarily from evaluations of ad hoc, predesigned, and programmatic interventions and less from studies of the daily practices of proactivity. This situation is exacerbated by a lack of recording and tracking of proactive activities in police accountability systems. The resulting gap between research and practice may reflect research getting “lost in translation.” In other words, the research reviewed in the NAS advocates for proactivity, but given the lack of infrastructure to support the types of proactivity described in the NAS report, the police are left to their discretion as to how to interpret and implement proactive ideals (see extensive discussions of this issue in Lum & Koper, 2017). The entire situation reflects an overarching dilemma; if police chiefs want their officers to be proactive and evidence-based, and if researchers are building evidence about the types of proactive activities that could be useful to police and citizen goals, then understanding whether daily practices of proactivity align with evaluative ideals would be an important step in translating that research into practice. Further, if some proactive activities lead to negative consequences as the NAS warns, then another important step in addressing this concern is determining to what extent those activities are practiced for any given agency. Recently, scholars have also hypothesized that police may reduce their proactivity due to intense public scrutiny and the videotaping of officers, which in turn could increase crime (see discussions by Pyrooz, Decker, Wolfe, & Shjarback, 2016; Rosenfeld, 2015; Shjarback, Pyrooz, Wolfe, & Decker, 2017; Wallace et al., 2018; Wolfe & Nix, 2016). Measuring the nature and consequences of such a “Ferguson Effect” (if any) would be essential operational knowledge for patrol commanders attempting to implement proactive policing to deter crime, disorder, or accidents. Of course, all of these questions and concerns are contingent on whether and how agencies record, track, and analyze their proactive activities in the first place (Sherman, 2013).
The Current Study
Given these knowledge gaps, much more empirical information is needed as to how patrol officers are practicing proactive policing in their daily work. Toward this goal, we partnered with four agencies to examine their proactivity in practice. In all four agencies, we first analyzed their calls for service data to compare how each record their officers’ proactive activities as well as the types, frequencies, and dosages of those recorded activities. We then carried out systematic observations of patrol officers in two of the four agencies to determine more precisely what types of proactivity they engage in, for how long they engage in these activities (dosage), the motivations behind their activities, and whether these observations were aligned with officially recorded proactivity in their CAD systems.
The four agencies used for this study are anonymized as Agencies A, B, C, and D. Agency A is a county agency of more than 600 sworn officers located in the Mid-Atlantic portion of the United States. Agency A serves a diverse suburban population (40% racial and ethnic minorities) of between 300,000 to 500,000 inhabitants. Its rates of violent and property crimes are slightly lower than the national average rates of comparable populations. 6 The agency is considered progressive, having regular interactions with researchers, a well-developed research and planning unit, and leadership that generally advocates for proactive and community-oriented policing. At the time of our data collection, Agency A did not have any specific proactive patrol initiatives in the district in which observations were collected but generally espoused proactive policing as an overall approach of the agency.
Agency B is a much smaller county agency of about 100 sworn officers located in the Midwest. Agency B serves a fairly homogenous suburban and rural population (less than 15% of its population are racial or ethnic minorities) in the range of 60,000 to 80,000 people. The rates of violent and property crime in Agency B are somewhat higher than average rates for nonmetropolitan counties with similar populations. During the time of data collection, Agency B was actively engaged in a targeted, place-based, and proactive crime prevention initiative and had developed a way for officers to record their proactivity for this initiative in their CAD system.
Agency C is a law enforcement agency with between 1,500 to 2,000 officers, located in the southern part of the United States, serving a diverse urban population (more than 40% of the population are racial and ethnic minorities) of between 500,000 and 1 million residents. The jurisdiction has high rates of violent and property crime. This agency has historically had an advanced crime analytic capability that is integrated throughout the department. It has also been involved in sustained and documented proactive initiatives by specialized units over long periods.
Finally, Agency D is a county law enforcement agency with between 1,000 and 1,500 sworn officers and is located in the Mid-Atlantic. This agency serves a diverse suburban/urban population (approximately 40% racial and ethnic minorities) of more than 1 million. The rates of violent and property crime in this jurisdiction are lower than average for similar jurisdictions. At the time of data collection, this agency did not have a systematic approach to proactivity at the individual officer level, although it did have general initiatives to target high crime places and to improve police–community relationships.
We selected these four agencies because we wanted to explore what everyday proactivity might look like in large and smaller agencies as well as in urban, suburban, and rural contexts. Each of these agencies also had varying styles and initiatives that might shed light on variations in our findings. At the same time, given the extensive cooperation that would be needed to obtain and analyze detailed CAD data as well as conduct systematic observations of officers, we also selected agencies from convenience that were willing to cooperate, a limitation of this study that we acknowledge. Given the exploratory nature of our study and our small sample of agencies, we did not have any a priori beliefs about the nature of proactivity in large, small, urban, suburban, or rural jurisdictions. Given the scarcity of the existing literature, there were also few clues. For example, analysis by Wu and Lum (2017) indicates that at least within jurisdictions, higher crime locations may have less time for proactivity since officers are more engaged in responding to crime. At the same time, places with larger amounts of crime may also be more population dense, resulting in officers spending much less time traveling between locations (and thereby having more time for proactivity). In their study of Baltimore City, for example, Famega (2005) and Famega et al. (2005) found that officers had large amounts of time that was uncommitted to dealing with calls for service or administrative activities, despite that city’s well-known high violent crime rates. At the same time, rural or suburban areas might not only be seen as having more time to devote to proactive initiatives but may also have reduced opportunities to be proactive if travel time between destinations or other public safety tasks take up a large portion of uncommitted time. Further, officers may be more likely to be prompted to be proactive when crime occurs, which suggests that low-crime suburban or rural areas may have officers who are much less proactive. Because so little information about the daily practice of proactivity is available, our research goal was to gain greater understanding of, and also compare, proactive practices in these varied agencies .
Toward these goals, we conducted two sets of analyses. First, we analyzed CAD data across the four agencies to show how the frequencies and dosages of proactivity in patrol is differentially recorded and measured. However, given our hypothesis that not all police proactivity is captured in the CAD system, we follow this analysis by describing the results of our systematic observations of proactivity in everyday patrol.
Detecting and Measuring Proactivity Using CAD Data
As already discussed, the most common mechanism that agencies record officer daily activities is through the CAD system, making it a rich source of information about how patrol officers spend their time in the field. Some CAD systems have specific codes that have been developed to record an officer’s proactive activity. However, proactive activities are often assigned reactive or vague codes for convenience. In addition, CAD systems can also flag whether an event is “citizen” (or 911 caller) initiated versus “officer” initiated. Officer-initiated events in the CAD, however, may not perfectly align with the NAS definition of proactivity. For example, some officer-initiated activity could occur as part of an officer’s reaction to a citizen’s on-the street-request for help or may be the result of a follow-up to an investigation of a crime already occurred. But generally, the officer-initiated flag is one reasonable way to distinguish proactive from reactive events (we note that we carry out systematic observations of officer proactivity precisely because we recognize this limitation in the CAD data). With these imperfections in mind, we obtained 2016 CAD data from agencies A, B, and D, and 2013 data from Agency C to estimate proactive policing in each of these agencies.
Proportion of Officer-Initiated, Proactive Activities
Table 1 summarizes the proportion of unique CAD events that were reactive (911 or citizen-initiated records), proactive (officer-initiated records), or administrative for each of the four agencies. In these agencies, proactive activities (as recorded in the CAD system) appear to take up approximately 35% to 42% of unique CAD events. We note that Table 1 does not suggest that officers spend 35% to 42% of their time on proactive activities, nor are these percentages indicative of the amount of noncommitted time within these agencies. The high proportion of administrative activities for Agency D likely indicates that Agency D has a culture of recording many administrative activities that Agency A, B, and C also conduct but do not record. However, the similarity in these ratios across these very different jurisdictions is notable in that at least in terms of recorded activities, officers carry out a substantial amount of actions that are not 911-initiated.
The Proportion of CAD Events That Are Proactive or Reactive Across Four Agencies.
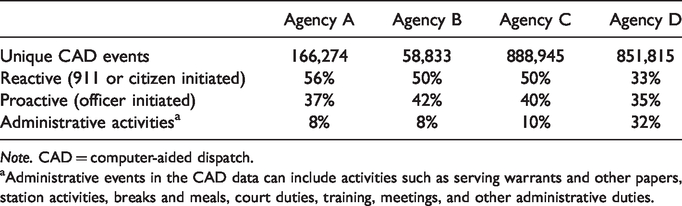
Note. CAD = computer-aided dispatch.
Administrative events in the CAD data can include activities such as serving warrants and other papers, station activities, breaks and meals, court duties, training, meetings, and other administrative duties.
Types of Officer-Initiated, Proactive Activities Recorded in CAD
To get a better sense of the types of activities recorded as officer-initiated, Table 2 shows the distribution of officer-initiated events in Agency A’s CAD data (we will not replicate these data for the other three agencies due to space constraints but summarize across the four agencies in Table 3). As an example, in Agency A, the CAD code of “Vehicle Stop” appears to be the most frequent type of recorded police proactivity, constituting about 61% of all officer-initiated actions. These likely include traffic enforcement stops conducted by officers of drivers who may be speeding or not adhering to signage. However, these can also include proactive traffic stops of a pretextual nature for purposes of crime prevention or investigation. Other CAD codes that also implicate some form of traffic- or vehicle-related concern include “suspicious vehicle,” “motorist assist,” “motor vehicle crash,” “parking violation,” “vehicle,” “traffic obstruction,” “radar checkpoint,” “driving under the influence,” and “traffic control.” In combination, these vehicle- and traffic-related proactive activities amount to almost 80% of all recorded, officer-initiated, nonadministrative calls in the CAD system. Based on the CAD data, it appears that traffic- and vehicle-related activities are the main types of officer-initiated activities that are recorded by officers in Agency A. This finding alone is significant; everyday traffic enforcement is not specifically covered or emphasized in the NAS assessment of proactivity, and there are very few rigorous evaluations of traffic enforcement strategies that test their impacts on either crime or police legitimacy (Wu & Lum, 2017). Yet, they are likely the most common type of proactivity deployed in policing.
Proactive (Officer-Initiated) CAD Records From Agency A.
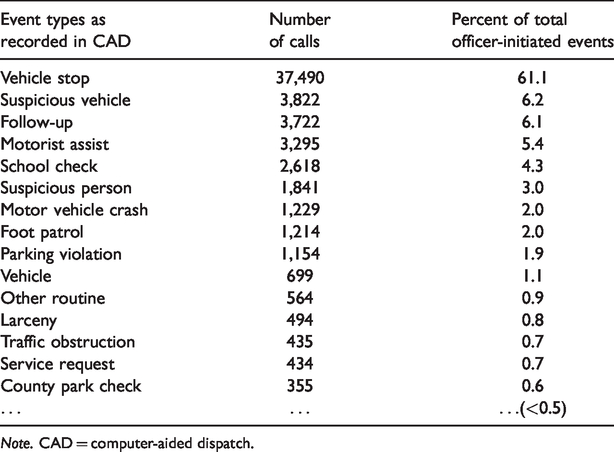
Note. CAD = computer-aided dispatch.
Types of Proactive Activities (as % of Total Proactive Events) Across Four Agencies.
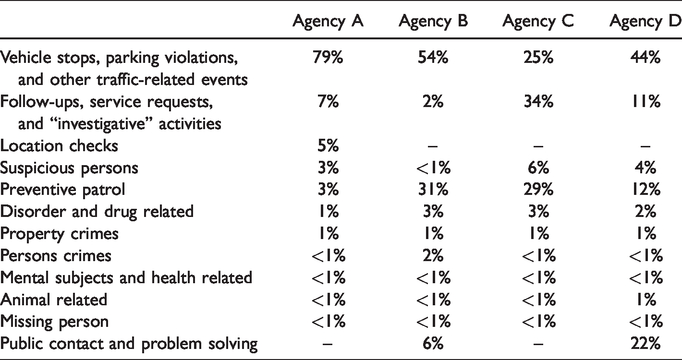
Table 2 also illustrates how the recording (and implementation) of police proactivity is not well aligned with—or perhaps not similarly recorded as—the evaluation research reviewed by the NAS. Some events, such as “motor vehicle crash” may not be proactive at all; officers may have just happened upon a crash and called into dispatch the event, thus generating an officer-initiated record for what would have been a citizen-initiated call. Some categories are also very vague, such as “follow-up,” “other routine,” “service request,” or “vehicle.” Noticeably absent NAS-mentioned categories in this list include “problem-oriented policing,” “focused deterrence,” or “hot spots patrol” (although perhaps “foot patrol” might be an indication of community policing or hot spots patrol).
In Table 3, we summarize officer-initiated CAD data for all four agencies, with proactive call events grouped into general categories for ease of display and comparison. As a caveat to these comparisons, we note that agencies have different dispatcher and officer recording habits and cultures, with different uses of codes, shorthand, and interpretations of those codes. For example, many officers likely do checks of specific locations across these four agencies. This activity has a specific code in Agency A’s data (“Location Checks”) but does not in the other agencies, where these checks may be labeled as “follow-ups” or “investigative activities.” Another difference might be in the recording of “public contact” or “problem-solving” activities. These are specifically recorded as such in Agency B. However, in Agency D, this category includes calls for service codes such as “miscellaneous complaints,” “school resource officers,” “school crossing,” and “community meeting.” This does not mean that officers in Agency A and C are not making public contacts or conducting problem-solving. Instead, these agencies likely record these events as “investigations” or “follow-ups” (e.g., in the case of Agency C), or do not record them at all in the CAD system. We also again point out that it is difficult to say with great certainty whether some “follow-ups” and “investigative” activities by patrol officers as recorded in CAD are actually reactive activities (as defined by the NAS).
Table 3 indicates that traffic stops, traffic-related issues, and suspicious vehicles are the most commonly reported categories of officer-initiated proactive activities in the CAD data, except in Agency C, whose activities seem more spread out across other categories. Agency A has a high number of traffic-related proactive activities likely because of the high volume of traffic that characterizes this busy region. However, it is notable that traffic stops constitute a substantially smaller (albeit leading) share of proactive work in Agency D, which operates in a very similar traffic-active environment as Agency A. In two agencies (Agency B and C), preventive patrol is a common type of proactive activity that officers record in the CAD. Both agencies during the data collection period had place-based initiatives to increase proactive patrol at crime hot spots, and leadership had directed their officers to record that activity accordingly. Agency B had even created a specific CAD code for officers to record their proactive place-based patrols. Finally, Agency C officers devoted notably more effort to follow-ups, service requests, and investigative activities, perhaps because of the jurisdiction’s comparably high rate of crime. In sum, the comparisons in Table 3 hint at the possibility of substantive similarities and differences in both the recording and practice of proactivity across agencies that are not always linked straightforwardly to jurisdictional differences such as population size, number of officers, or crime rates.
Time Spent (“Dosage”) on Officer-Initiated, Proactive Activities as Recorded in CAD
We also examined the time spent on proactivity as recorded in the CAD, commonly referred to as “dosage.” Dosage is important in discerning both the allocation of resources to proactivity (so to more carefully calibrate resources to optimize impacts) as well as the relative impact of proactivity on outcomes. For example, Koper (1995) found that officers who spent 10 to 15 minutes at crime hot spots are more effective in creating residual deterrence than officers who provide very little dosage (i.e., drive through) in crime hot spots. Some proactive activities also take longer, such as problem-solving, CPTED (crime prevention through environmental design) assessments, or traffic stops.
Table 4 compares the average time spent on each proactive category in minutes across the four agencies using the more general categories from Table 3. 7 Depending on the data available, most of these calculations focus on the time “dispatched” (which for officer-initiated calls is usually the same time as the arrival time) and the time the event was completed. 8 Here, we separate vehicle stops and parking violations from “other traffic-related” self-initiated activities, as these other activities tend to be qualitatively different than traffic stops and ticket-related activities.
Average Time Spent (in Minutes) on Proactive Activities Across Four Agencies.
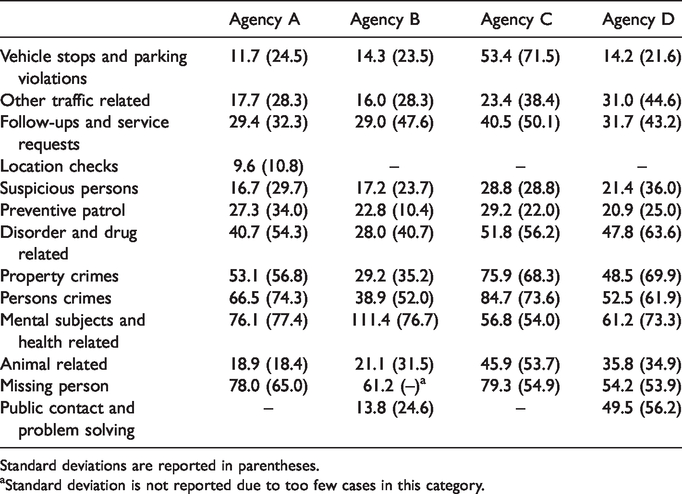
Standard deviations are reported in parentheses.
Standard deviation is not reported due to too few cases in this category.
In general, proactive traffic activities as measured in the CAD systems of these agencies seem to involve substantial dosage times sufficient to generate residual deterrent effects in the locations where they occur. On average, agencies tend to spend around 12 to 14 minutes on traffic stops and slightly longer on “other traffic-related activities.” (The longer amount of time spent by Agency C on traffic-related self-initiated activities is because Agency C includes investigation of drunk drivers in this category.) The high frequency with which police officers across these agencies conduct traffic-associated proactive activities may also be related to the relatively shorter amount of time required for these activities .
On the other hand, disorder and drug-related proactive activities appear to take longer but are much less frequently reported. Again, this is interesting, given that compared with traffic enforcement, drug and disorder proactive activities have been much more researched (see Braga, Welsh, & Schnell, 2015). Person and property crimes as well as medical and mental distress situations that officers may address proactively tend to take longer, likely because these events require reports to be written (or an arrest to be made). Some of these events may also not be proactive (i.e., an officer trying to prevent a property crime) but rather are a response to crimes that have already occurred.
In sum, the CAD data show similarities and differences in how officers record the proactivity and the types of activities that they engage in. At the same time, the data are vague, making it difficult to precisely confirm exactly what officers are engaged in when they are not responding to 911 calls for service. At the same time, CAD data may likely be the best source of police administrative data to capture officer proactive activities. All of these challenges make the case for why we carried out systematic observations of officer proactivity in addition to this CAD analysis to better understand the empirical reality of police proactivity.
Detecting and Measuring Proactivity Using Systematic Observations
The CAD analysis provides an understanding of police proactivity as recorded in agencies. We hypothesize, however, that many proactive activities by officers go unrecorded because of the lack of infrastructure for police proactivity in law enforcement. Thus, to provide an additional measurement of proactivity in practice, we conducted systematic observations of police patrol in Agencies A and B. These observations were carried out shortly after the 2016 data were collected—between March and August 2017—and during 2-hour ride-alongs with 84 officers, resulting in 184 hours 9 of observations across Agencies A and B. We also interviewed officers about proactivity while observing them. For each agency, three researchers carried out the observations roughly in equal proportions.
We note at the outset that there were some limitations to our observations. For one, we did not choose to observe specialized units or detectives because we were focused on the everyday practice of police proactivity in patrol. We also limited our data collection to the hours of 10:00 a.m. to 10:00 p.m. in Agency A and 7:30 a.m. to 10:00 p.m. in Agency B due to both researcher and police agency availability for this study at those times. Given the size of Agency A, we initially focused our observations on officers in one of the agency’s four districts, which had approximately 60 sworn patrol officers on active duty. However, during the data collection, commanding officers requested that we ride with officers from an adjacent district as well, which, at the time, was being reorganized into a new district with officers from the initial study district. In total, we interviewed 57 sworn patrol personnel across these two districts in Agency A and rode with 55 of those officers for a total of 121 hours of data collection. In Agency B, because of its smaller size, we attempted to observe as many patrol officers as possible during the time in which we were permitted to ride with officers. In total, the research team was able to interview 32 of the 45 officers assigned to patrol and rode with 29 of them for a total of approximately 63 hours.
In addition, because of the availability of both the research team and the officers, we could not randomly select the hours or officers for observations, nor did we observe officers in the very late night or early morning hours. Hence, the patterns reported here may not apply to all officers and shifts; for example, proactivity may be much lower during the very early morning hours of 3 a.m. to 6 a.m. While we tried to evenly space out the number of observations that occurred during the observation hours, we succeeded doing this in Agency B, but less so in Agency A. In Agency A, given the nature of scheduling challenges on the agency’s side, about three quarters of the ride-alongs began after 2 p.m. Also, there may be officers who we did not observe who may be more or less proactive than the officers we did observe. Of course, officers may have also acted differently with an observer in their vehicle. Notwithstanding these caveats, the findings provide insights that are likely applicable to most officers and their typical daily operations.
Researchers were trained to keep a structured log during each 2-hour ride-along observation to record all proactive activities by officers. We used the NAS definition of proactivity for guidance in terms of what constituted proactivity: any activity the officers carried out that was not prompted by a 911 call for service, a response to an existing and reported crime, a request to provide back-up to other officers, or in response to other administrative duties. For every proactive act observed within each ride-along, researchers noted the exact time the activity began and ended, the location of the activity if known, the type of location of the activity (i.e., alley, street, building, store, etc.), a description of the activity the officer engaged in, what seemed to prompt the proactive activity (i.e., officer self-initiated, saw something, said it was a regular hot spot, used crime analysis, etc.), and whether the activity was recorded in the CAD system (the researchers would ask the officer this question if it was unclear). During the ride-alongs, members of the research team also asked officers questions about how they defined proactivity, whether they were expected to be proactive, and how they were rewarded for being proactive.
In total, 164 proactive events were observed and recorded for Agency A and 68 events for Agency B. In Agency A, half of proactive activities in that agency were observed before 6 p.m., while the other half was observed after 6 p.m. Only a quarter of all proactive events were observed before 2 p.m. This distribution was expected given that unevenness of observations across the day in Agency A (observers were given more access later in the day). However, in Agency B where observer assignments were more evenly distributed across the day, 80% of proactive activities took place before 6 p.m., with the majority of events taking place before 2 p.m. More proactive events observed before the evening hours could be the result of more calls for service and crime after 6 p.m. in Agency B, thus leading to less time for proactive activities.
Types of Officer-Initiated, Proactive Activities
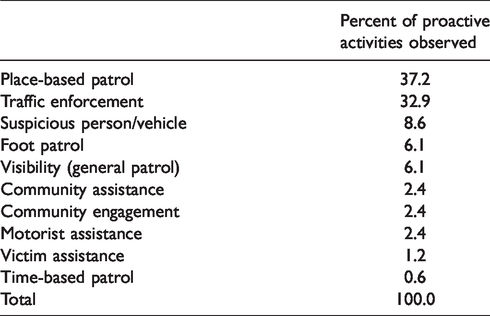
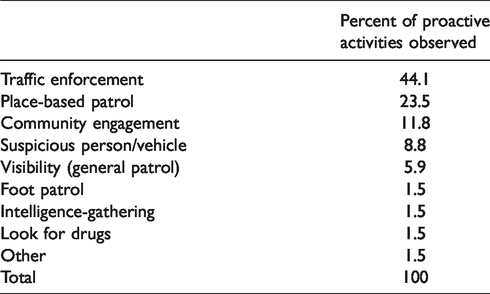
The first finding from these observations is particularly thought-provoking. In our interviews with officers, they mentioned a wide variety of activities that they considered to be “proactive,” including hot spots patrol, traffic enforcement, looking for suspicious activity, community engagement, and business and property checks. In practice, however, officers tended to concentrate their efforts on two types of proactive activities: traffic enforcement and generalized place-based patrol (driving to perceived high-crime locations and providing presence). In Agency A (Table 5), more than 70% of all proactive events observed by the research team fell into these two types of activities, followed much less frequently by proactive activity investigating suspicious persons or vehicles (8.6%). This finding was similar in Agency B (Table 6), where 44.1% of observed proactive activities were traffic enforcement, and 23.5% were place-based patrols. However, unlike Agency A, Agency B was more likely to conduct community engagement activities (11.8% for Agency B compared to 2.4% for Agency A), although Agency B’s proactivity was still dominated by generalized place-based patrol and traffic enforcement.
Types of Proactive Activities Observed in Agency A (n = 164).
Types of Proactive Activities Observed in Agency B (n = 68).
There was a notable difference between the how officers in each agency selected locations for their proactive activities. Agency A typically selected locations for place-based patrol informally, based on their personal judgment of problem places (also discovered by Ratcliffe & McCullagh, 2001). Officers in Agency B, however, were more likely to focus their place-based patrol efforts on formally defined hot spots as designated by the agency based on crime analysis knowledge provided to them. This was due to the fact Agency B had formalized a hot spots patrol strategy that included a specific CAD designation to signal the activity.
These initial findings shed light on everyday proactivity not seen in the CAD data or the NAS (2018) report. Our field observations suggest that many of the proactive approaches that have been evaluated by researchers and found to be effective for reducing crime or improving police–community relations (e.g., problem-solving, community contacts, and attention to known offenders) are not regularly used by officers. The findings also highlight discrepancies between the recording of proactivity in CAD and the practice of proactive policing. Recall that in Agency A (see Table 3), the CAD data suggested that almost 80% of recorded proactivity was traffic-related. From the observations, however, traffic enforcement might not dominate police proactivity in Agency A as much as CAD records seem to indicate. This discrepancy between our observations and CAD data also stems from the additional provocative finding: More than 60% of officers’ proactive activities in Agency A were not reported or recorded in any data system. More specifically, 90% of observed proactive place-based patrols went unrecorded by officers in Agency A. In contrast, only 28% of the officers’ traffic enforcement activities were not reported or recorded in the CAD. 10
Our observations of officers in Agency B revealed that approximately 44% of their proactive activities were traffic enforcement. This finding is more aligned (compared to Agency A) with what is recorded in their CAD data (54% of which was traffic-related). Similarly, the systematic observations also indicated that almost a quarter of Agency B’s proactive activities were place-oriented patrols, while the CAD data for Agency B indicated that 31% of proactive activities were preventive patrol. As mentioned, Agency B has an active initiative to record proactive activities by officers and has created CAD codes to facilitate this goal. This developed infrastructure is likely the reason why Agency B’s CAD data are more aligned with the systematic observations we collected. This not only supports our belief that a lack of proactive infrastructure can lead to greater misalignment between recorded and actual activities but also suggests that agencies with stronger proactivity infrastructures are also places in which researchers can have more confidence in officially recorded data. However, we also note that despite this infrastructure, 51.5% of proactive activities that the research team observed in Agency B were still not recorded in any data system. More specifically, almost all of the community engagement activities and about half of traffic enforcement activities observed by the research team were never recorded in the CAD or any other records management system.
The lack of recording of proactive activities in Agencies A and B can be further contextualized by officers’ answers to our interview questions. In Agency A, 48% of officers felt their supervisors expected them to be proactive, while in Agency B, 91% of officers said their supervisors expected it of them. Despite these expectations, between 28% (Agency B) and 36% (Agency A) of officers said that these expectations varied by shift and supervisor. In both agencies, a large proportion of officers also remarked that rewards for being proactive were informal or intrinsic (59% in Agency A and 66% in Agency B). Only about a quarter of officers in each agency said that assessment of their proactivity was a part of their performance reviews. These interview findings highlight the lack of infrastructure and motivation for formally reporting, recording, and rewarding police proactivity, which likely contributes to a large amount of proactivity that goes unrecorded.
Time Spent (“Dosage”) on Officer-Initiated, Proactive Activities
As with our CAD analysis, we also recorded the amount of time officers spent on the proactive events we observed by recording for every proactive observation the start and end time of the proactivity. Of the 121 hours observed in Agency A, officers spent 1,334 minutes on proactive activities (18% of the total time observed). Of the 63 hours observed in Agency B, 916 minutes (24% of the total time) was spent on proactive activities. We note that this time spent is dependent on the actual amount of uncommitted time that officers have in each agency, the amount of calls for service each agency deals with, the types of proactivity officers engaged in (which can impact the level of calls for service and thus uncommitted time), and the expectations of officers in terms of how they are spending this time.
Table 7 shows that more than half (56%) of all proactive activities observed in Agency A were completed within 1 to 5 minutes, and another 22% took between 6 and 10 minutes. Agency B officers, however, tended to spend more time, on average, carrying out proactive activities, than officers from Agency A. This is likely due to mandates by patrol commanders that specific proactive activities, notably visits to hot spots, must be carried out for longer periods of time based on their practice of what some call “Koper Patrols” (referring to Koper’s 1995 findings previously mentioned).
Time Spent on Proactive Activities.
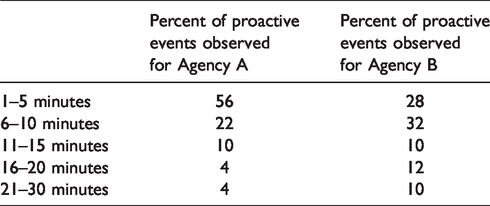
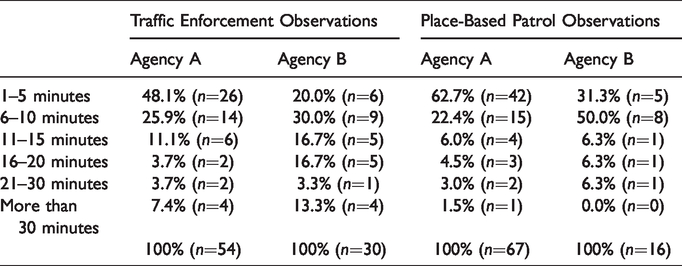
Table 8 shows more closely how much time officers spent on the two most common types of proactivity activities, on average. Agencies, on average, spend less time doing place-based patrols and more time on traffic enforcement (although Agency B spends more time, on average, on place-based patrols than Agency A). The findings from Tables 7 and 8 are also notable because the CAD data for these agencies indicated that dosages appeared longer for police proactivity. Greater time dosages in the CAD may reflect a reporting habit—that is, officers may call back into duty or close out their proactive activity sometime after they complete that activity (whereas during the observations, the precise end to the proactivity was noted by the observer).
Time Spent on Traffic Enforcement and Place-Based Patrol More Specifically.
Implications for Law Enforcement Practice and Research
These empirical realities of police proactivity have significant implications for the recommendations of the NAS report. Recall, the NAS report on proactive policing highlights what we know about research on police proactivity. It is based on studies and evaluations of ad hoc proactive interventions, often conducted as special initiatives or for evaluation and research. However, if proactivity is an important and needed innovation in American policing, if research seems to indicate that certain types of proactive interventions can effectively reduce crime and improve citizen satisfaction, and if other types of proactivity may not be effective or even be harmful, then knowing how police are actually practicing proactive policing, and whether those practices are aligned with the evidence, is key knowledge for translating the NAS recommendations to practice. Furthermore, examining proactive policing in practice may reveal how research ideals are being translated. For example, Kelling (2015) has argued that police agencies (and researchers) misinterpreted Wilson and his (Wilson & Kelling, 1982) famous “broken windows theory,” turning it into “zero tolerance policing.” The reason for this translation of broken windows theory, however, may have been due to strong and existing infrastructures in policing that support arrest-based interventions (Lum & Nagin, 2017; Lum & Vovak, 2018). The same may be true with other forms of proactive policing. Police are encouraged to be proactive and pay attention to the research, but the tools that they know best are traffic and pedestrian stops, preventative patrol, and location checks. Thus, their proactive strategies, if not trained, guided, supervised, and tracked, are likely to fall back to the tactics they feel most comfortable using. In other words, evidence-based policing requires much more than the generation and dissemination of the evidence; it requires building infrastructure, institutionalizing practices, and changing organizational frames to ensure research is translated in optimal ways (see extensive discussions in Hirschkorn & Geelan, 2008; Lum & Koper, 2017; Nutley, Walter, & Davies, 2007).
Our empirical study of proactivity has shown that proactivity as practiced may differ substantially from what we know about proactivity from the evaluation research. At least in these four agencies, the proactive toolkit used by officers appears limited to mostly two tactics—traffic stops and generalized place-based patrol. Further, the reliance on traffic enforcement and place-based patrols as major forms of police proactivity may not be well aligned with what we know about the impacts and consequences of these interventions. For example, in Agency A, the generalized place-based patrol we observed does not seem to be the “hot spots” or “directed” patrol advocated in the evaluation research. The patrols were often conducted in larger and amorphous geographic areas and were not guided by crime analysis or intelligence, and locations were often chosen at the discretion of officers. While we know that officers should probably linger at least 10 to 15 minutes when doing hot spots patrol to create a residual deterrence effect (see Koper, 1995), in reality, officers are conducting place-based patrols for less than 5 minutes, and often only for a minute or two. In addition, while carrying out these place-based patrol activities, officers rarely conduct problem-solving activities that address specific issues at places, which has been found to be an effective form of proactivity from the evaluation research (e.g., as shown in Braga et al., 2015; Weisburd et al., 2010).
Agencies should also consider optimizing patrol time at crime hot spots based on analyses of immediate and residual deterrent effects and better target those spots using a combination of crime analysis, intelligence, and community input to sharpen and sustain the impacts of those efforts. To optimize their effect from an evidence-based perspective, officers would need training, coaching, and guidance in expanding their proactive toolkit, including how to conduct basic crime assessments of their area, engage in problem-solving, and implement a wider array of effective tactics during their uncommitted time. They would also need to better understand the link between crime during committed time and their activities during their uncommitted time to develop stronger motivations for optimizing their uncommitted time activities.
The heavy reliance on traffic (and sometimes pedestrian) stops as the primary mode of proactivity also means that the cautions of the NAS report should be carefully heeded if police continue to practice proactivity in these ways. Pedestrian and traffic stops can be risky, not only for officer safety but also for generating disparities and negative interactions with citizens. It is unclear if the benefits of traffic enforcement as practiced outweigh these consequences. If high levels of traffic proactivity continue, then agencies need to measure both the positive and negative consequences of traffic and pedestrian stops and improve their targeting of those stops to specific traffic or crime concerns. If agencies insist on continuing to practice proactivity in these ways, greater efforts will also be needed to ensure that officers act in respectful and just ways and to understand the potential consequences of their discretion for system-wide disparities. In addition, there may be efforts within those approaches that can sharpen the impact of these activities and lessen negative consequences. For example, crime analysis, problem-solving, and community engagement might all be sharpening tactics that could guide place-based or traffic patrols.
Our finding that officers do not record a substantial amount of proactivity—50% to 60% in the two agencies we observed—is also provocative. This implies that even when using CAD data to estimate proactivity, we are still missing a large amount of proactive work that officers are carrying out. This inability to measure proactivity due to a lack of reporting is a major operational and performance measurement challenge for deployment supervisors and commanders as well as a problem for researchers studying proactivity. The inability for deployment commanders to know the extent to which proactivity is practiced would seem to inhibit their ability to manipulate that deployment to the advantage of crime prevention or improved community satisfaction. It also stifles their ability to reward proactivity, correct problematic behaviors, or determine the impact of the use of patrol resources.
Likely connected to this lack of recording is the wide variation in beliefs and expectations among officers about the impacts, rewards, and consequences of their proactive activities. This variation makes sense given that the accountability infrastructure to encourage and facilitate proactive policing is fairly informal or non-existent. We must be cautious, of course, in generalizing from the small number of agencies examined in this study, although these agencies are fairly diverse with respect to size, jurisdiction type, and geography, and they seem reasonably typical of at least American police agencies with 100 or more officers. A next step in research in this area will be to better understand the causes of officer-level variations in these beliefs and expectations.
All of these findings point to an overall observation: Agencies seeking to use proactive policing to optimize both crime prevention and community satisfaction will need to strategize about how to institutionalize a program of proactivity and simultaneously strengthen the infrastructure to encourage and facilitate it. For example, agencies may consider establishing more formal tracking of certain types of proactivity, particularly place-based patrol and community engagement activities (see extensive discussions in Lum & Koper, 2017; Lum & Nagin, 2017; Sherman, 2013), which often seem to go unrecorded. Agencies might have officers get into the regular practice of initiating a CAD record when they are carrying out proactivity (which would also require CAD systems to have options for officers and dispatchers to appropriately describe proactive activities). This would also help researchers decipher more fully how officers are using their noncommitted time, without carrying out time-consuming systematic observations or having officers fill out time-use surveys. For larger and more involved interventions that involve in-depth problem-solving or community engagement activities, officers might consider documenting their efforts in similar ways that investigators document their cases (see, e.g., the “Case of Place” idea developed by Lum & Koper, 2017).
In turn, recording and tracking are essential foundations for strengthening performance management systems to facilitate officer accountability to proactivity (Sherman, 2013). But performance management systems are only as good as the training, coaching, mentoring, supervision, and rewards and incentives that underpin those systems, which would also have to be strengthened for proactive policing to be more aligned with the ideals discussed in the NAS report. In addition, crime analysts play a key role in strengthening the proactive portfolio of officers, units, and agencies. Analysts are in the best position to be able to detect and measure proactivity as practiced and to evaluate the impact that proactivity has on crime prevention and community trust and confidence. Of course, much of this will rely on strengthening the recording and reporting of proactive activities. However, incorporating crime analysts into the strategic planning of proactive deployment can ensure that actions to record and report proactivity can also be measured through existing (or developed) data systems. Furthermore, many proactive activities require specialized problem-solving or place-based skills that analysts may have; including them when developing proactive activities could improve the evidence and analytic base of those strategies. The potential to improve the management and practice of proactive policing through these organizational adjustments can be seen to some degree in the findings from Agencies B and C. These agencies placed greater emphases on crime analysis, hot spots policing, and structured, recorded proactivity. As a result, their officers engage in a wider variety of proactive activities, deliver longer dosages of those activities, and were more likely to record their proactive work.
The movement towards police proactivity is, in our view, a generally good one, and the NAS report shows how much research–practitioner partnerships have contributed to our knowledge about proactive policing. The challenge in realizing the NAS’s recommendations, however, relies on how innovative ideas and research findings are translated, institutionalized, and systematized into everyday police practice. Imposing ideas about proactive policing onto law enforcement agencies without careful strategizing and infrastructure-building can lead to muted impacts and unintended consequences.
Footnotes
Declaration of Conflicting Interests
The authors declared no potential conflicts of interest with respect to the research, authorship, and/or publication of this article.
Funding
The authors disclosed receipt of the following financial support for the research, authorship, and/or publication of this article: This report is made possible by generous funding from the Laura and John Arnold Foundation (now Arnold Ventures). The views expressed in this report are those of the authors and do not necessarily reflect the views of the funder.