
Abstract
Dietary modifications are recommended for individuals with hypercholesterolemia to reduce cardiovascular disease (CVD) risk. While almonds have been shown to improve certain CVD risk factors, the effects of almonds on high-density lipoprotein cholesterol (HDL-C) are less clear. This study aimed to determine the quantity of almonds that would provide optimal increases in HDL-C in a population with hypercholesterolemia. Participants were randomized (n = 25/group) to low-dose almond (LDA; 1.5 oz/day), high-dose almond (HDA; 2.5 oz/day), or nut-open-access diet (NFD; cookies isocaloric to LDA) for 16 weeks. Change in HDL-C (primary outcome), Framingham Risk Score (FRS), blood pressure (BP), apolipoproteins, anthropometrics, and serum α-tocopherol were assessed at baseline and weeks 4, 8, 12, and 16. There were no significant differences in HDL-C between groups; however, there were reductions in FRS of 1.4% and 0.6% from baseline at week 16 in the HDA and LDA groups (P ≤ .05), respectively, while the NFD group had a 1.0% decrease (P = .14). There were decreases of 4.7 mmHg, 4.1 mmHg, 5.1 mmHg, and 3.8 mmHg in systolic BP for the HDA group after 4, 8, 12, and 16 weeks, respectively (P ≤ .06), which was significantly lower than the NFD group from baseline at week 8. The NFD group had increases in sagittal abdominal diameter of 4.0% and 2.7% after 4 and 8 weeks (P ≤ .05), respectively, whereas the almond groups did not. Findings suggest almond consumption may support dietary strategies for improving CVD risk factors in adults with hypercholesterolemia.
INTRODUCTION
Elevated lipids are a major modifiable risk factor for cardiovascular disease (CVD), a leading cause of death worldwide. 1 Diet and lifestyle approaches are recommended before medication, as they are more cost-effective and lower risk of side effects.2,3 A leading dietary risk factor for CVD is low nut and seed consumption, 4 and almonds specifically have been shown to improve CVD risk factors,5–8 including atherogenic lipids.6,9–16 However, the effects of almond consumption on high-density lipoprotein cholesterol (HDL-C) levels are unclear.
Studies suggest almond consumption improves HDL-C in healthy individuals 8 and individuals with hyperlipidemia7,17 with higher almond intake potentially eliciting greater improvements in a dose–response manner. 17 However, a meta-analysis reported a significant decrease in HDL-C after almond intervention compared with controls. 9 Conflicting results may be due to differences in almond portions and duration. Despite the benefits of almonds for cardiometabolic health, 18 studies investigating optimal almond intake for improving HDL-C in a population at increased CVD risk are needed. This study aimed to determine the quantity of almonds for optimal increases in HDL-C in adults with hypercholesterolemia. A clinically relevant increase in HDL-C was defined as an increase of at least 1 mg/dL (0.026 mmol/L).
METHODS
Study design, ethics approval, and trial registration
This randomized, comparator-controlled, parallel study was conducted at KGK Science Inc. (London, Ontario, Canada) from January 2022 to November 2023 (NCT05174663). Ethics approval was granted on November 5, 2021, by Institutional Review Board Services (Advarra, Aurora, Ontario, Canada; Pro00058866). This study followed the Consolidated Standards of Reporting Trials reporting guidelines (Supplementary Table S1), and participants provided written informed consent prior to initiating study procedures.
Study population
Participants were 30- to 65-year-old males and nonpregnant females with a body mass index (BMI) between 25.0 and 34.9 kg/m2 and hypercholesterolemia (National Cholesterol Education Program: low-density lipoprotein cholesterol [LDL-C] >4.1 mmol/L [>160 mg/dL]). 2 Participants reported stable body weight for the past 3 months, agreed to comply with dietary guidelines, maintain current lifestyle habits, and were healthy as assessed by the medical director (MD).
Individuals were excluded if they had any allergy, sensitivity, or intolerance to study products, consumed nuts more than twice per week (unless willing to wash out), used medications/supplements known to affect blood lipids, had significant gastrointestinal diseases, or any other condition or lifestyle factor that the MD deemed necessary for exclusion (e.g., safety).
Investigational products and comparator
The LDA and HDA groups consumed 1.5 and 2.5 oz, respectively, of whole, raw almonds (Almond Board of California, Modesto, CA, USA), and the NFD group consumed chocolate chip (Leclerc, Quebec, Canada) or Oreo cookies (Mondelez, Chicago, IL, USA) isocaloric to 1.5 oz of almonds as the comparator daily for 16 weeks. The chocolate chip cookies contained enriched wheat flour, milk chocolate (sugar, cocoa butter, chocolate liquor, milk ingredients, soya lecithin, salt, vanilla extract), sugar, butter, sodium bicarbonate, salt, soya lecithin, and artificial flavor. The Oreo cookies contained sugar, unbleached enriched flour (wheat flour, niacin, reduced iron, thiamine mononitrate [vitamin B1], riboflavin [vitamin B2], folic acid), palm and/or canola oil, cocoa, high-fructose corn syrup, leavening (baking soda and/or calcium phosphate), salt, soya lecithin, chocolate, and artificial flavor. The macronutrient composition for LDA, HDA, and comparator products can be found in Table 1.
Macronutrient Composition of Study Products
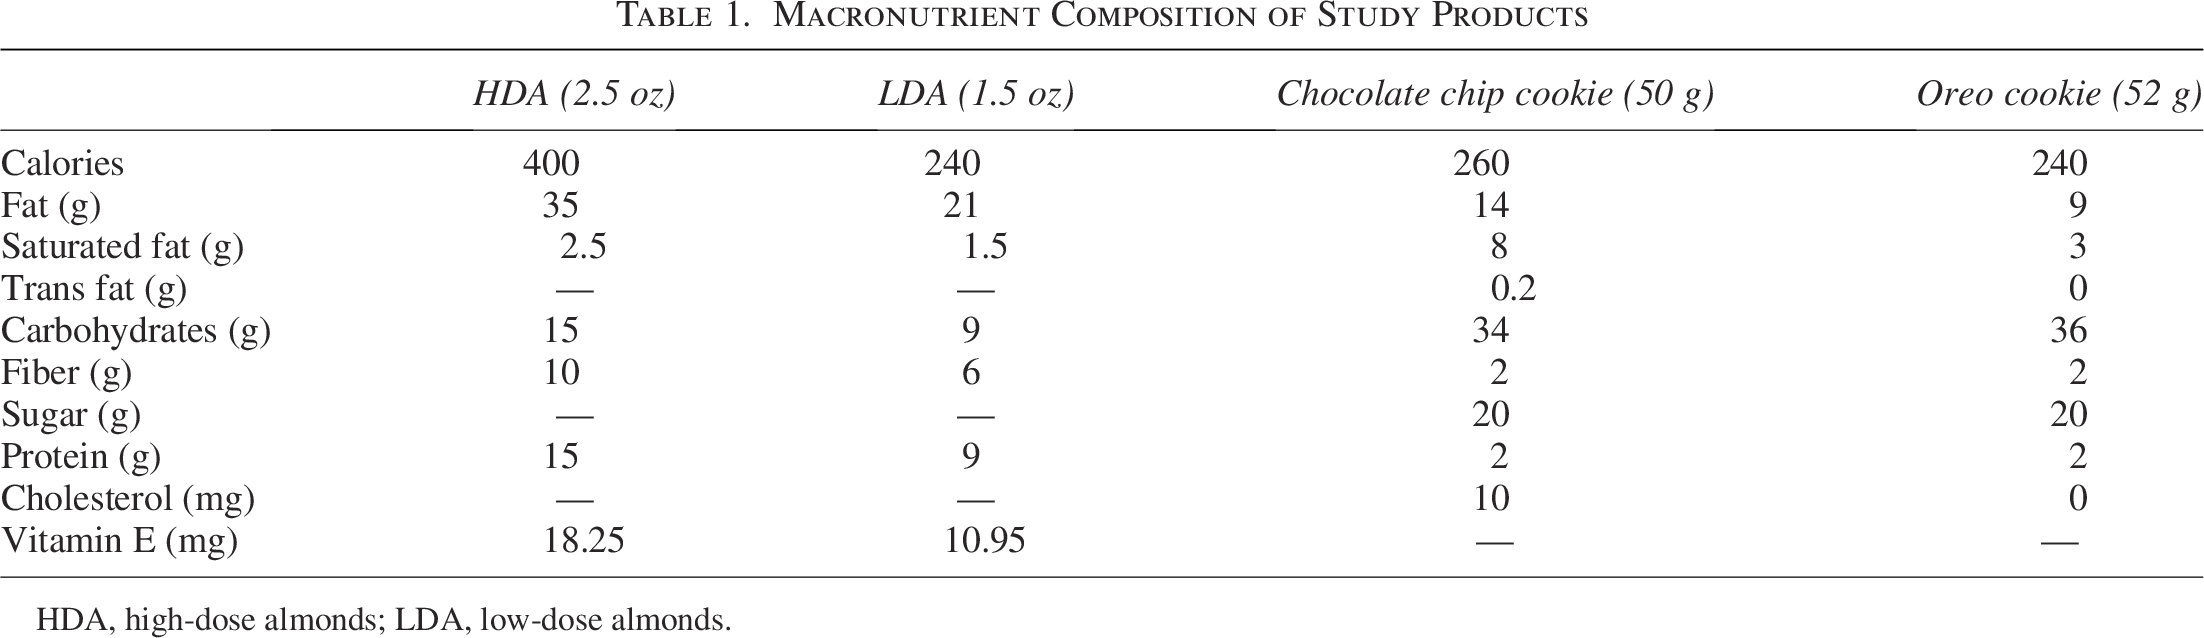
HDA, high-dose almonds; LDA, low-dose almonds.
Randomization
Participants were assigned a randomization code (www.sealedenvelope.com) at baseline. Block randomization was used to reduce bias and achieve balance in the participant allocation to study arms, such that no one sex exceeded 60%. Allocation proceeded by randomly selecting one ordering and assigning the next block of participants to a group based on a specified sequence. The block size was divisible by the number of groups. 19
Study outcomes
The primary outcome was the change in HDL-C from baseline at week 16 between the LDA, HDA, and NFD groups.
Secondary outcomes included the change between groups in HDL-C from baseline at weeks 4, 8, and 12; CVD risk score and ApoB48 and ApoB100 concentrations from baseline at 8 and 16 weeks; and blood pressure (BP), anthropometrics, and serum α-tocopherol from baseline at weeks 4, 8, 12, and 16.
Safety assessments included adverse events (AEs) and clinically relevant changes in clinical chemistry [aspartate aminotransferase (AST), alanine transaminase (ALT), alkaline phosphatase (ALP), total bilirubin, creatinine, electrolytes (Na, K, Cl), estimated glomerular filtration rate, and glucose] and hematology [white blood cell count with differential (neutrophils, lymphocytes, monocytes, eosinophils, basophils), red blood cell (RBC) count, hemoglobin, hematocrit, platelet count, immature granulocytes, nucleated RBC, RBC indices (mean corpuscular volume, mean corpuscular hemoglobin, mean corpuscular hemoglobin concentration, red cell distribution width)].
Study assessments
Blood markers
Fasted blood was collected at screening, baseline, and weeks 4, 8, 12, and 16 in serum separator tubes for analysis of total cholesterol (TC) and HDL-C by LifeLabs (London, Ontario). Tubes were inverted five times, centrifuged for 10 min at 1600 g at 25°C, and stored at 4°C for approximately 48 h until analysis. TC and HDL-C were measured using an enzymatic colorimetric test and homogeneous enzymatic colorimetric test, respectively. The lower limit of detection was 0.10 mmol/L for both TC and HDL-C.
Blood was collected at baseline and weeks 8 and 16 in purple top EDTA tubes for analysis of ApoB48 and ApoB100 by CannaLabs Science Inc. (London, Ontario). Tubes were inverted 8–10 times, centrifuged immediately for 10 min at 3000 rpm at 4°C, and four 1 mL aliquots of plasma were created and stored at −80°C until analysis. ApoB48 and ApoB100 were analyzed using a sandwich enzyme-linked immunosorbent assay (ELISA; Biomatick, Cat No. EKU02506) and a solid-phase sandwich ELISA (IBL America, Cat No. 27181), respectively. The lower limits of detection were 2.4 ng/mL for ApoB48 and 0.13 µg/mL for ApoB100.
Blood was collected at baseline and weeks 4, 8, 12, and 16 in light-protected plain non-barrier tubes for analysis of α-tocopherol by LifeLabs. Tubes were inverted five times, centrifuged for 10 min at 1600 g at 25°C, and serum aliquots were stored at −80°C until analysis. Serum α-tocopherol was analyzed using liquid chromatography mass spectrometry, and the lower limit of detection was 0.6 µmol/L.
Framingham Risk Score
Estimation of 10-year risk of developing CVD was determined at baseline and weeks 8 and 16 using the 2018 Framingham Heart Study 10-year risk calculator provided by the American Heart Association, the American College of Cardiology, and the Framingham Heart Study.20,21 The Framingham Risk Score (FRS) considers age, sex, TC, HDL-C, systolic blood pressure (SBP), BP lowering medication use, diabetes status, and smoking status. 20
Blood pressure
BP was measured at screening, baseline, and weeks 4, 8, 12, and 16. At screening, seated BP was checked in both arms after the participant rested comfortably for at least five minutes. The arm with the higher reading was used at subsequent visits. If there was a questionable discrepancy after two readings, a third was taken.
Anthropometrics
Weight, BMI, waist circumference, sagittal abdominal diameter (SAD), and waist:hip circumference ratio were measured at baseline and weeks 4, 8, 12, and 16, and height was measured at screening. At least two separate measurements were taken of each measure at each visit, with a third measurement taken if there was a questionable discrepancy. The two closest values were averaged.
Dietary assessment
Participants were instructed to record all foods and beverages for three days (two weekdays and one weekend day) in the week prior to baseline and weeks 4, 8, 12, and 16 using Libro, an online application developed by Nutritics. At each timepoint, the participant’s average daily calories, macronutrients, and micronutrients were calculated. All self-reported records were reviewed by trained staff at the clinic visits, and participants were counseled with dietary suggestions as required.
Safety
Participants recorded AEs in their study diary, which were classified per the description, duration, intensity, frequency, and outcome. The MD determined the causal relationship of the investigational product (IP) to the AE.
Laboratory safety markers included hematology and clinical chemistry parameters (see NCT05174663 for details), and the MD determined clinical significance. All laboratory safety parameters were analyzed by LifeLabs using standardized procedures.
Study product compliance
Participant compliance was assessed by counting the study product at each visit to compare the number of dosages taken to the number expected to have been taken. Compliance was also monitored using three-day food records and serum α-tocopherol concentrations.14,22
Statistical analyses
A sample size of 25 participants per group was calculated to provide 80% power to detect differences in HDL-C levels between the LDA, HDA, and NFD groups at week 16, using one-way analysis of variance (ANOVA) with a significance level of 0.05 and an effect size of Cohen’s f = 0.366. The variance estimate for HDL-C was derived from previously published data. 10 Between-group differences were assessed using one-way ANOVA followed by Tukey’s post hoc test for pairwise comparisons when significant between-group differences were found. Within-group differences for continuous study outcomes were assessed using a paired t-test. Means and standard deviations are reported. P-values <.05 were considered statistically significant. All analyses were performed using Statistical Analysis System (SAS) software version 9.4 (SAS Institute Inc., Cary, NC, USA) and R software version 4.3.2.
Results are reported for the per-protocol (PP) population, consisting of all participants who consumed ≥80% of the study products, did not have protocol deviations that affected the primary outcome, and completed all study procedures connected with the primary variable.
RESULTS
Study population
A total of 450 volunteers were screened, with 75 eligible participants randomized (Fig. 1). Participants were excluded from the PP population for early termination (n = 7), IP compliance <80% (n = 1), and out-of-window study visits (n = 2). There were no significant differences in demographics or baseline cardiometabolic characteristics between groups (Table 2). Study product compliance was >92% for all groups.
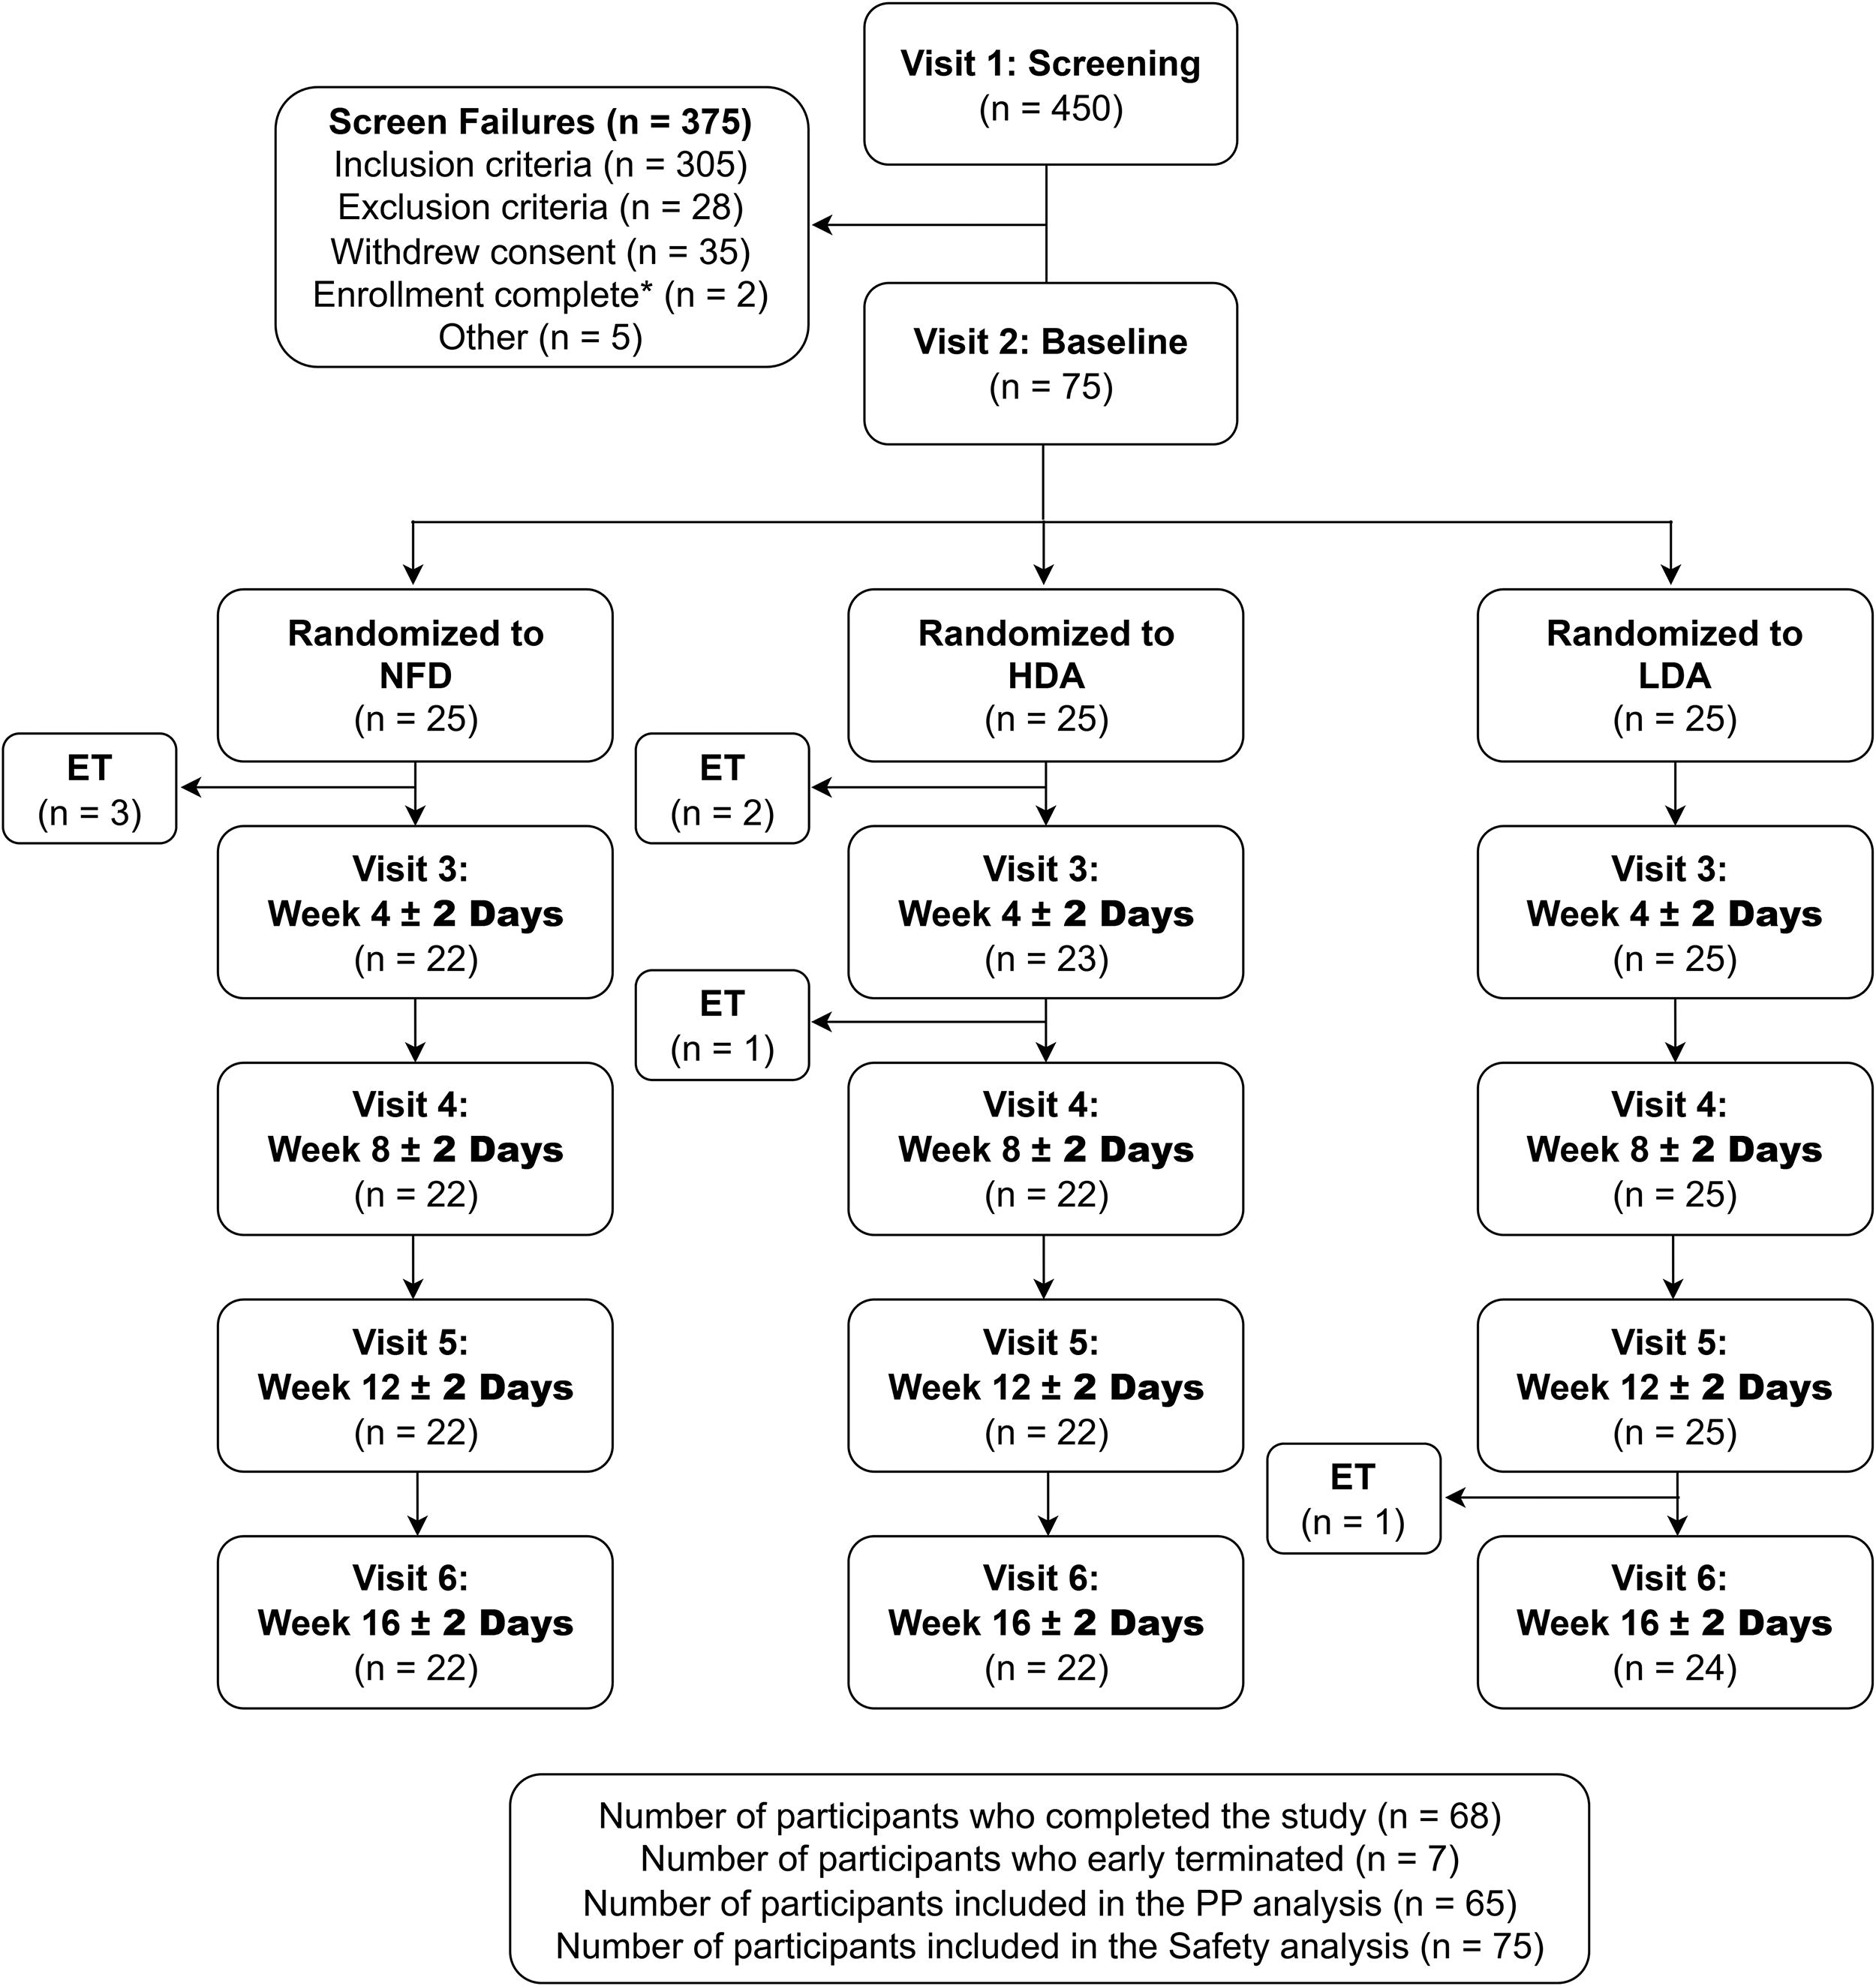
Participant disposition. HDA, high-dose almonds; LDA, low-dose almonds; NFD, nut-open-access diet; PP, per-protocol. *n = 2 screen-failed as enrollment of 75 participants was completed prior to their randomization.
Demographics and Baseline Cardiometabolic Characteristics (n = 65)
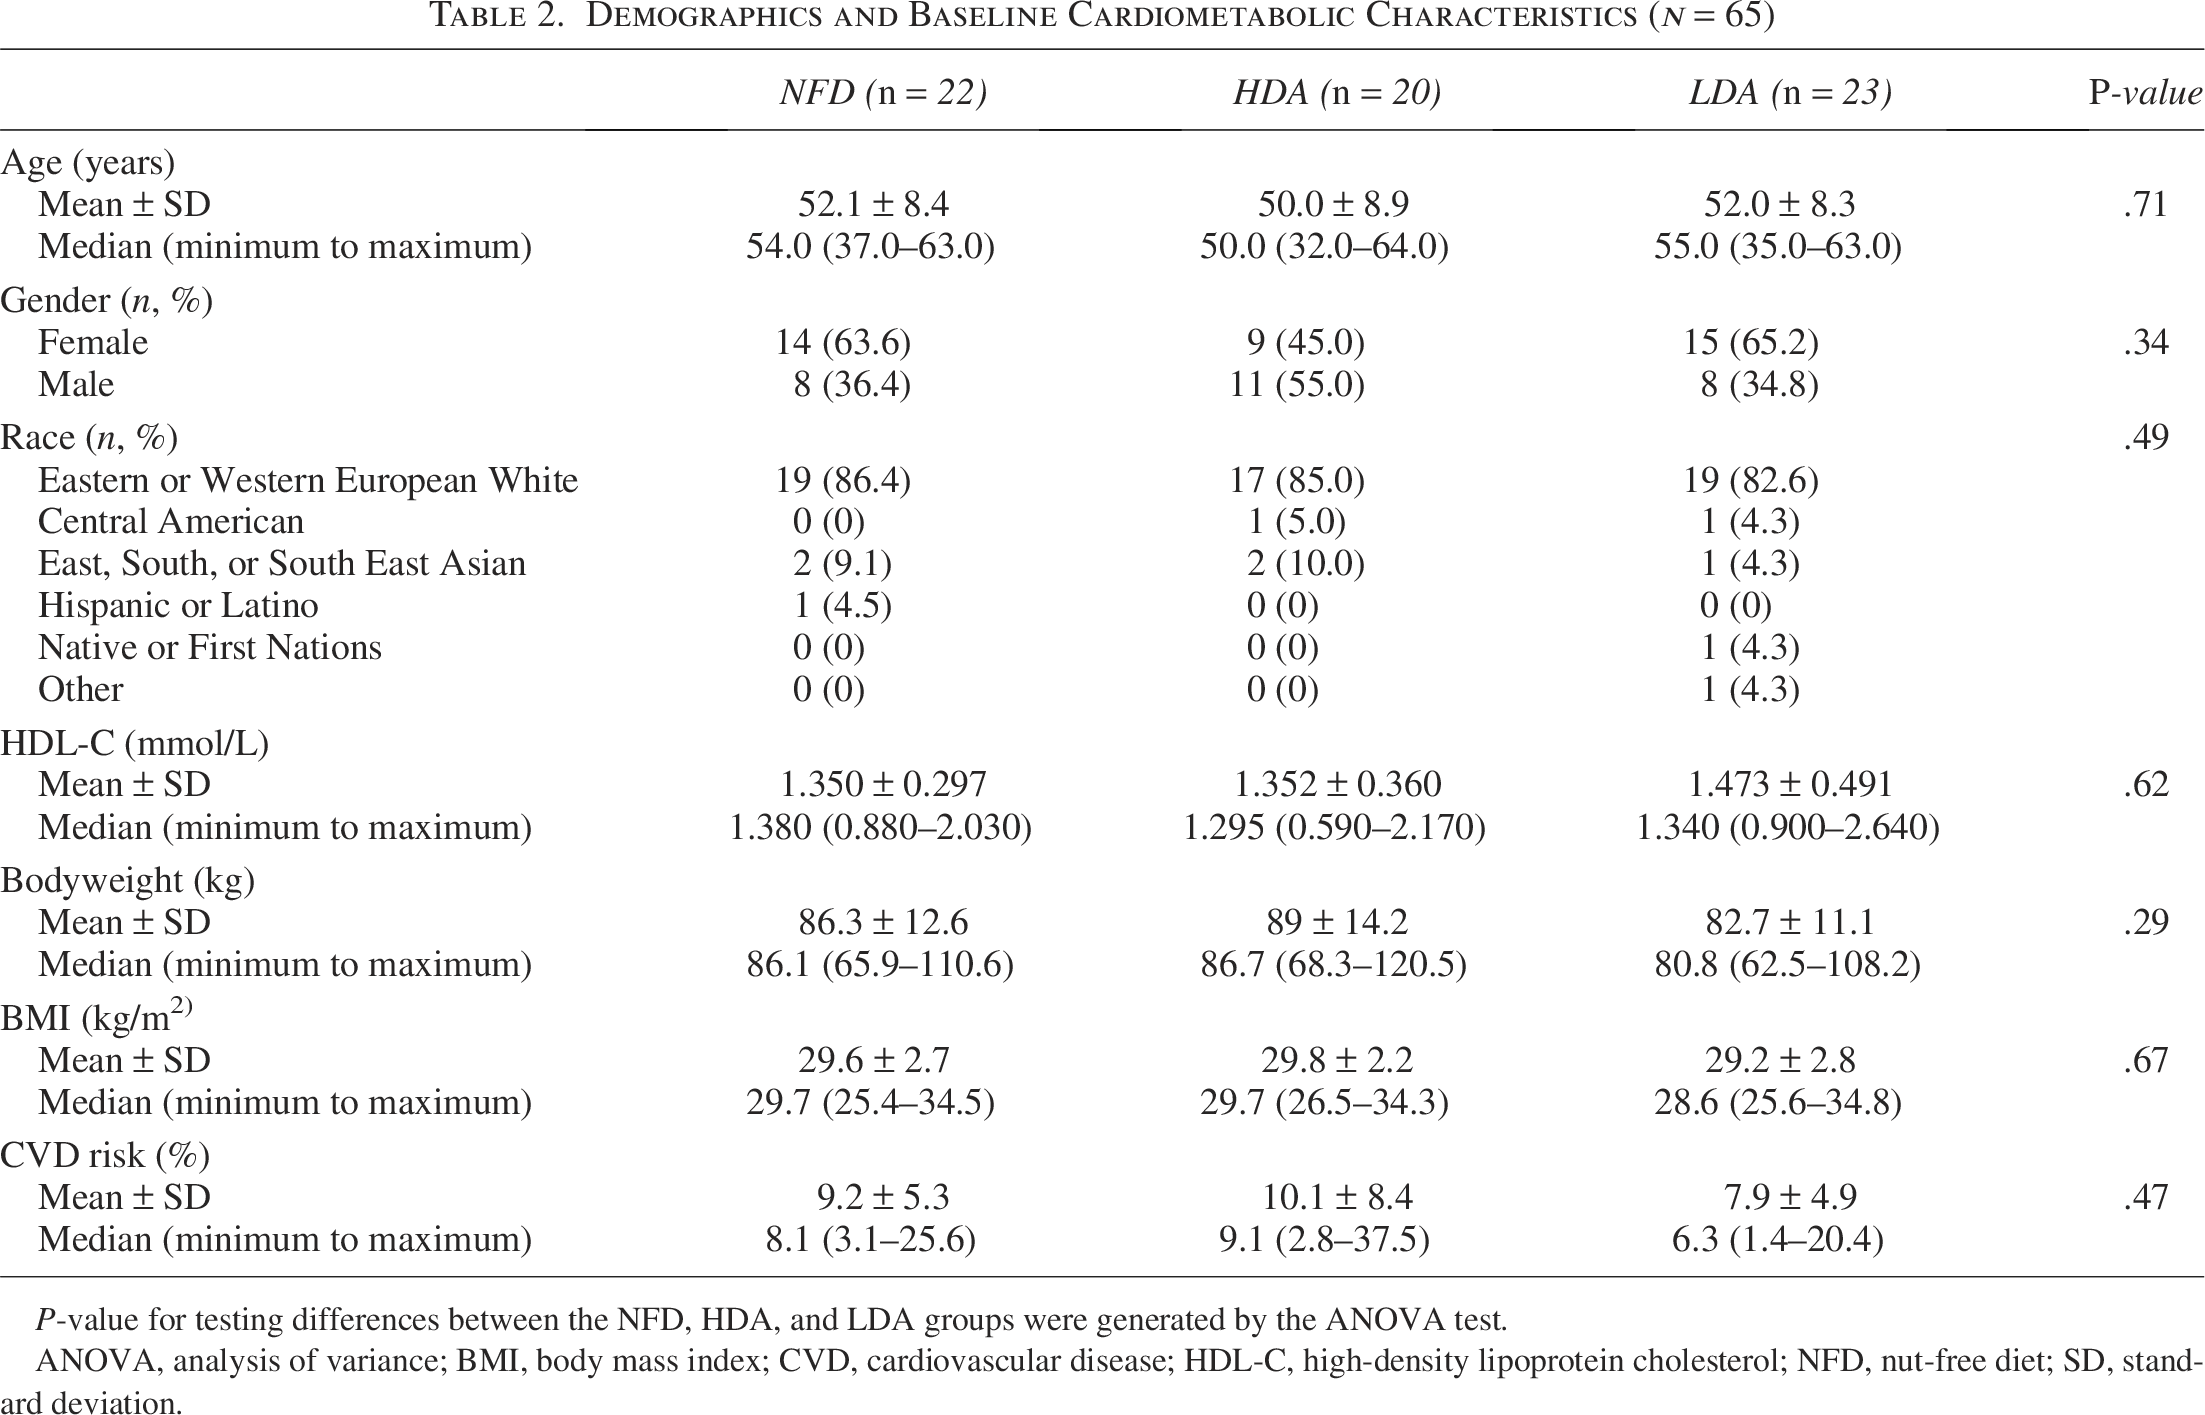
P-value for testing differences between the NFD, HDA, and LDA groups were generated by the ANOVA test.
ANOVA, analysis of variance; BMI, body mass index; CVD, cardiovascular disease; HDL-C, high-density lipoprotein cholesterol; NFD, nut-open-access diet; SD, standard deviation.
High-density lipoprotein cholesterol
There were no significant between- or within-group differences in HDL-C. Participants in the HDA and LDA groups had respective increases of 0.7% (P = .47) and 1.1% (P = .99) in HDL-C after 16 weeks of almond consumption, whereas the NFD group had a decrease of 0.07% (P = .80; Table 3).
Change in High-Density Lipoprotein Cholesterol Levels Over the 16-Week Study Period (n = 65)
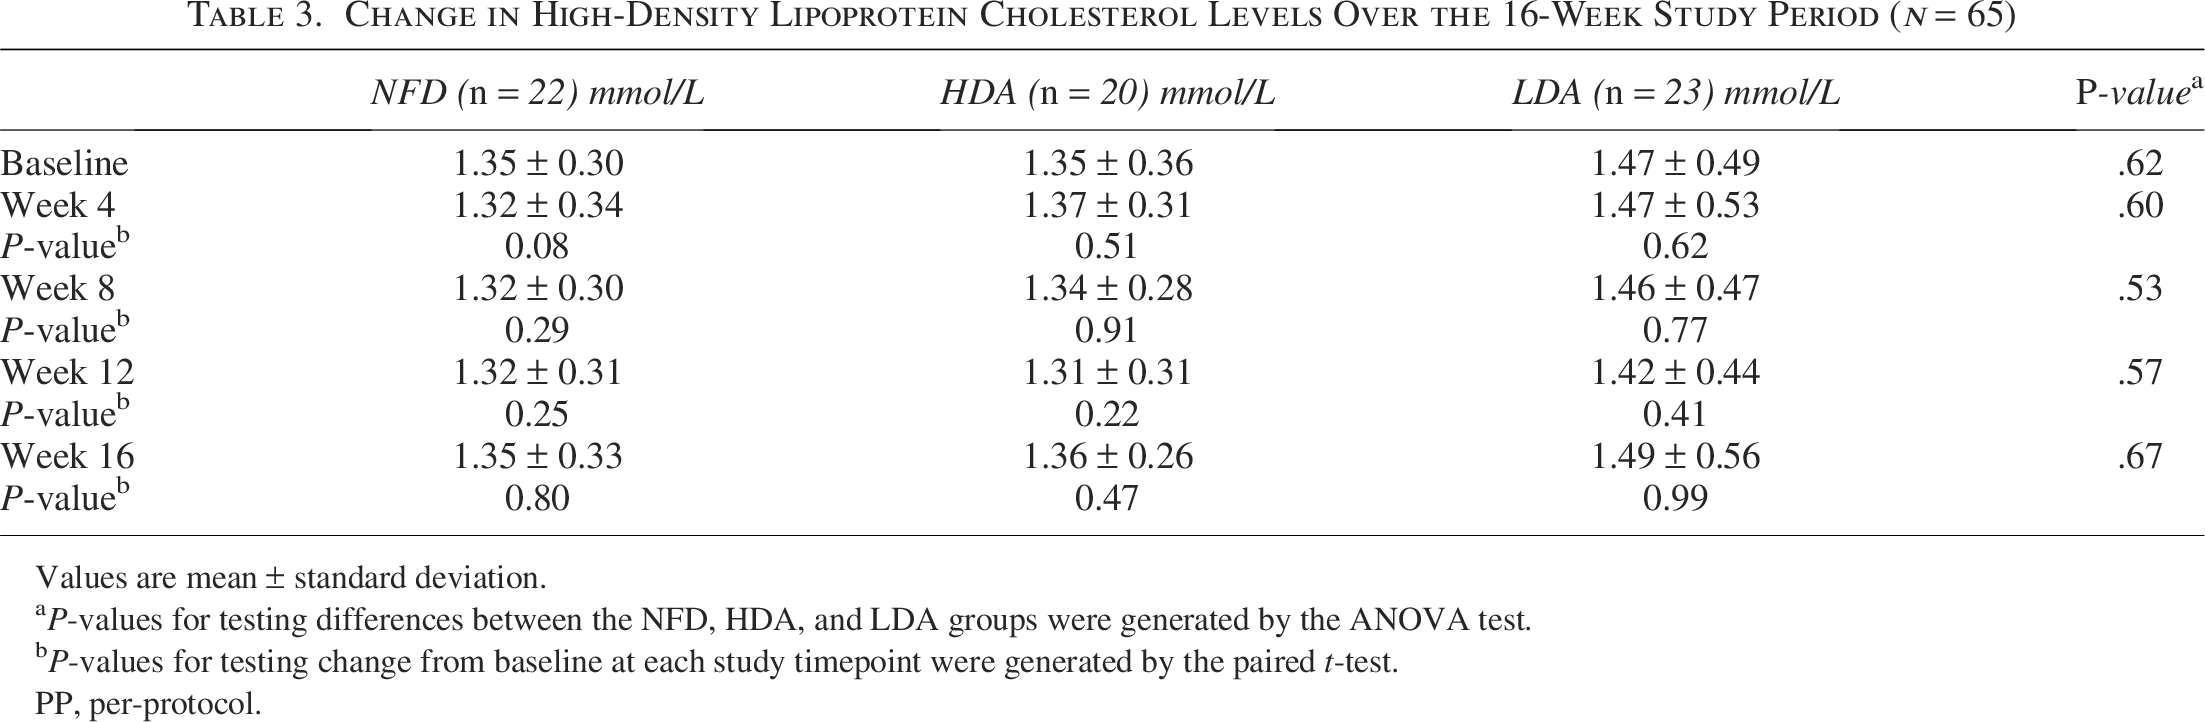
Values are mean ± standard deviation.
P-values for testing differences between the NFD, HDA, and LDA groups were generated by the ANOVA test.
P-values for testing change from baseline at each study timepoint were generated by the paired t-test.
PP, per-protocol.
Framingham Risk Score
Participants consuming HDA (P = .05) and LDA (P = .03) had decreases in FRS at the end of study compared with baseline (Fig. 2). The HDA group had a significant decrease in FRS from baseline at week 8 (P = .02). There were no significant differences from baseline for those consuming NFD nor were there significant differences between groups.
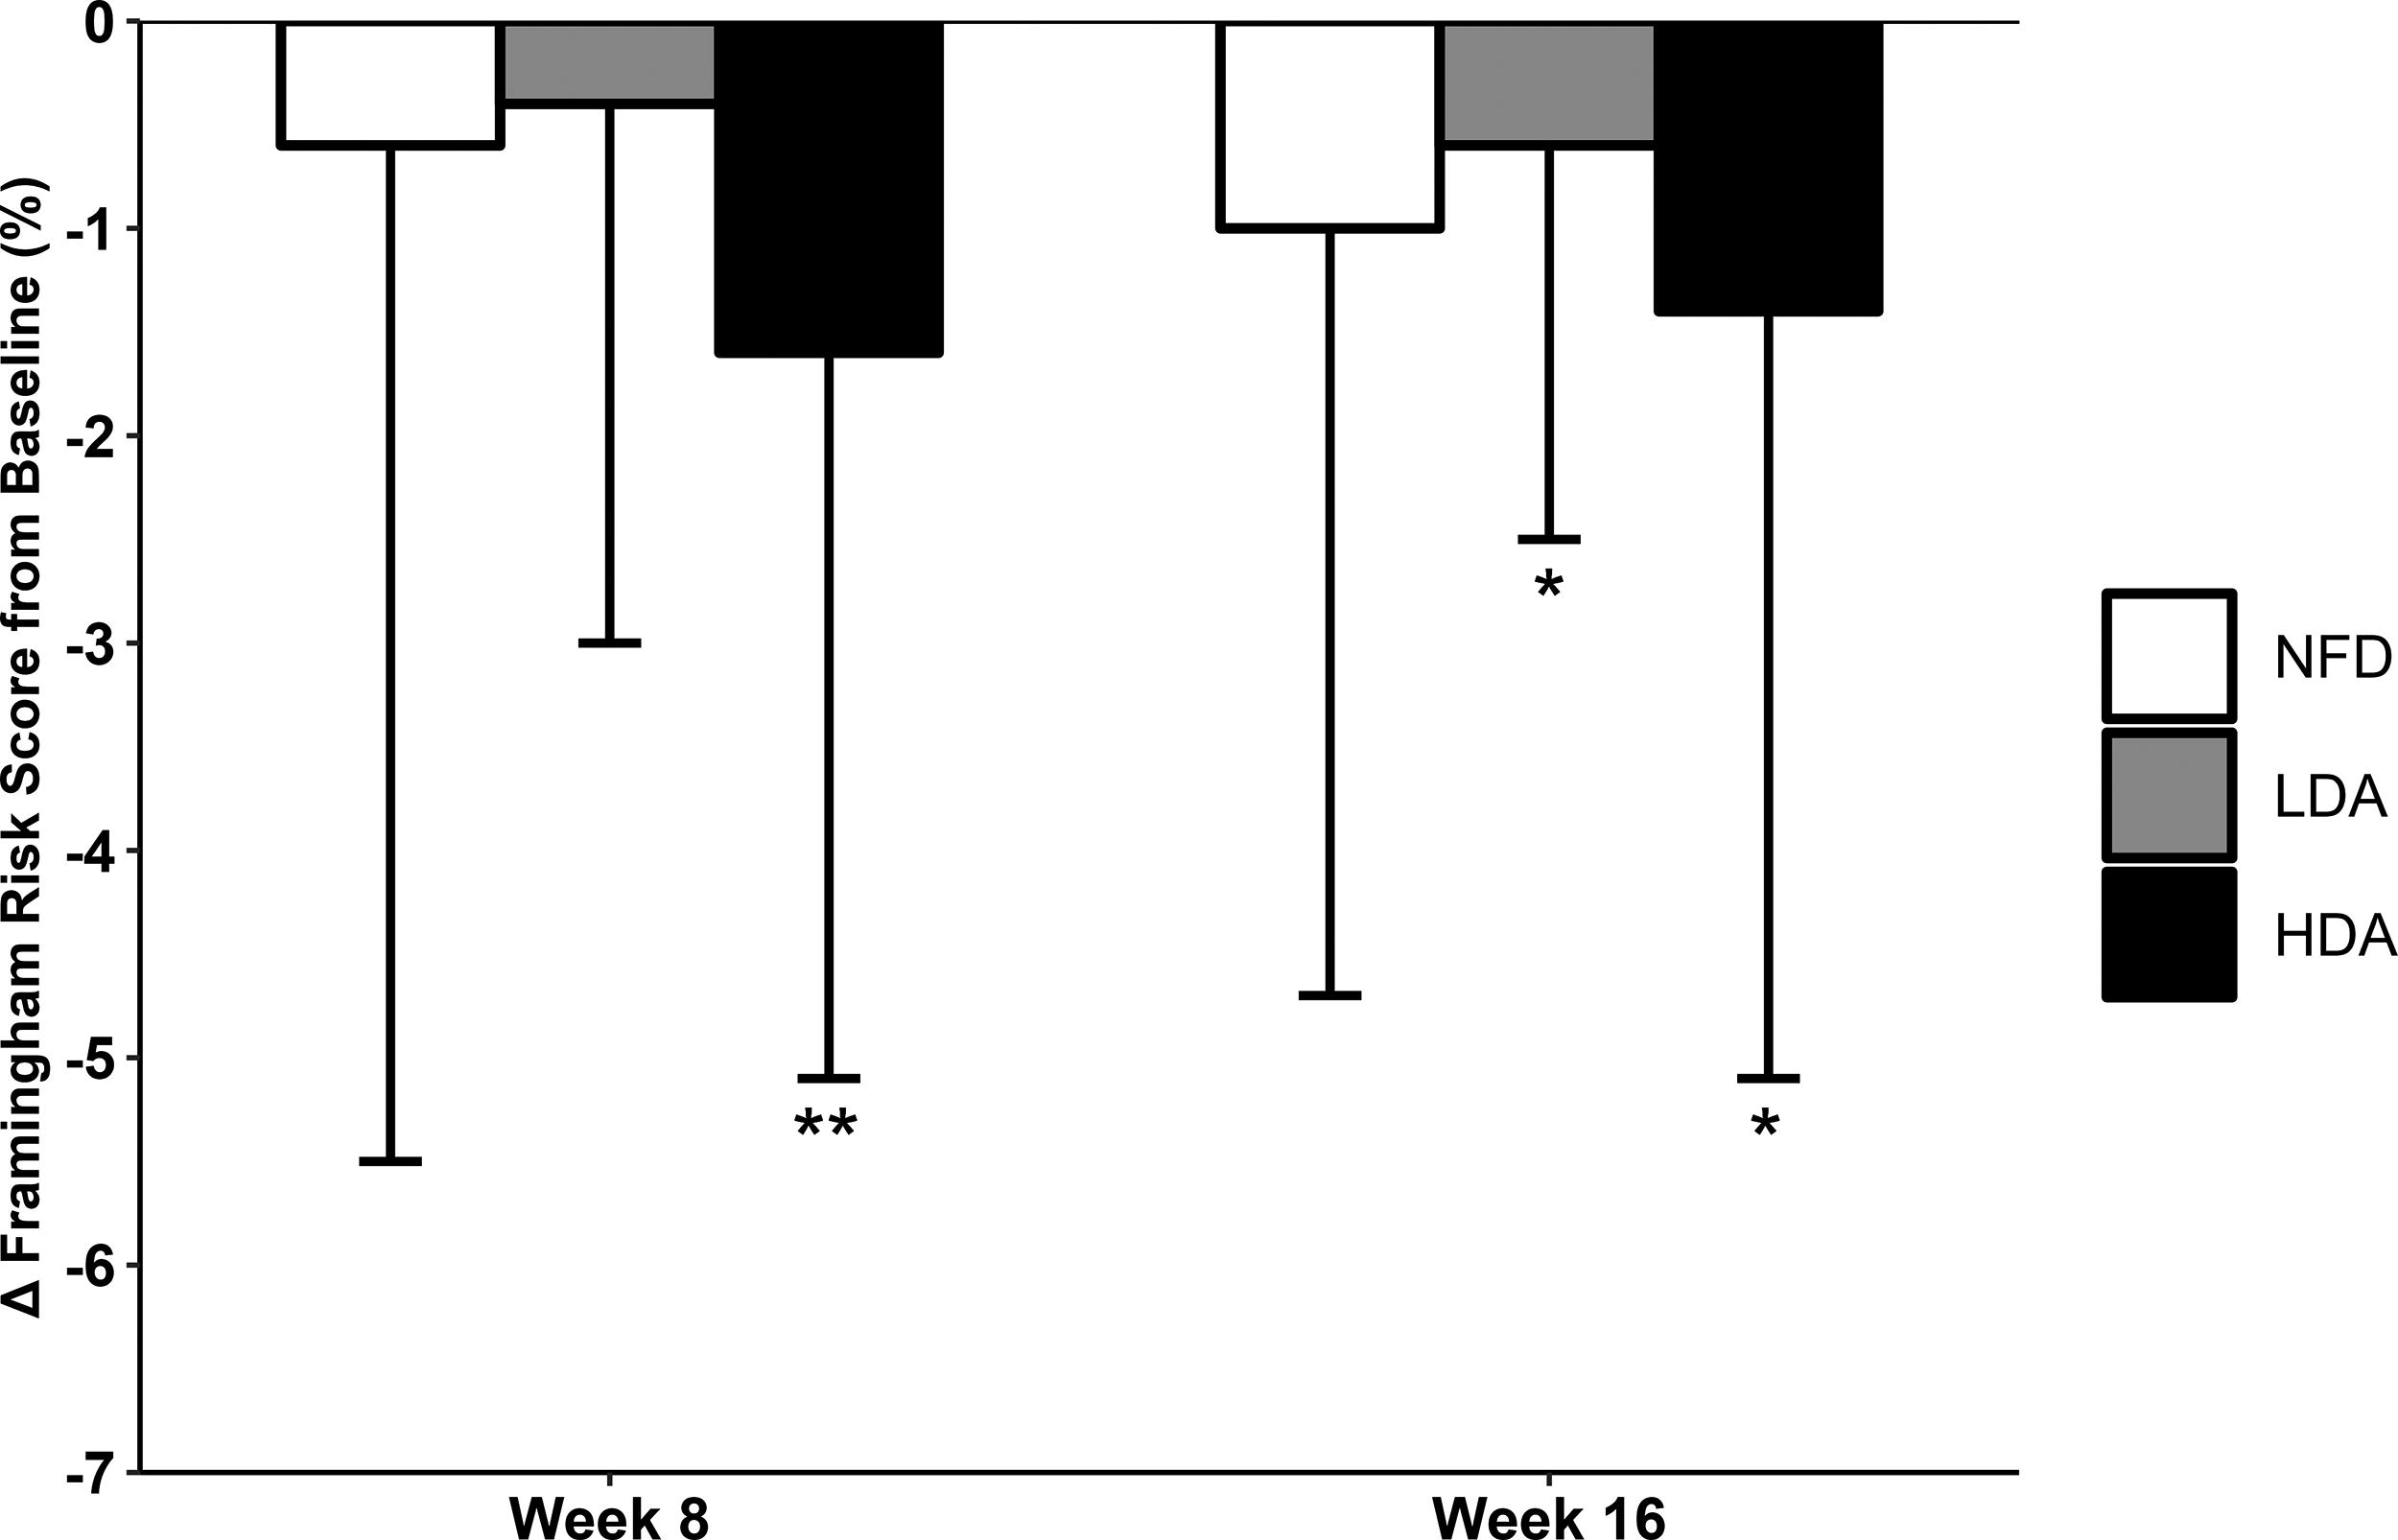
Change in Framingham Risk Score (%) from baseline at weeks 8 and 16 for the NFD (n = 22), LDA (n = 23), and HDA (n = 20) groups. Values are means ± standard deviation. *P < .05 compared with baseline; **P-value for change from baseline for the HDA group.
Blood pressure
Participants in the HDA group had decreases in SBP from baseline at week 8 (P = .01) and week 12 (P = .02), with a trending decrease at week 16 (P = .06), and was significantly lower compared with the NFD group after 8 weeks (P = .01; Fig. 3A). Participants consuming LDA had a significant increase in DBP from baseline at week 4 (P = .03; Fig. 3B).
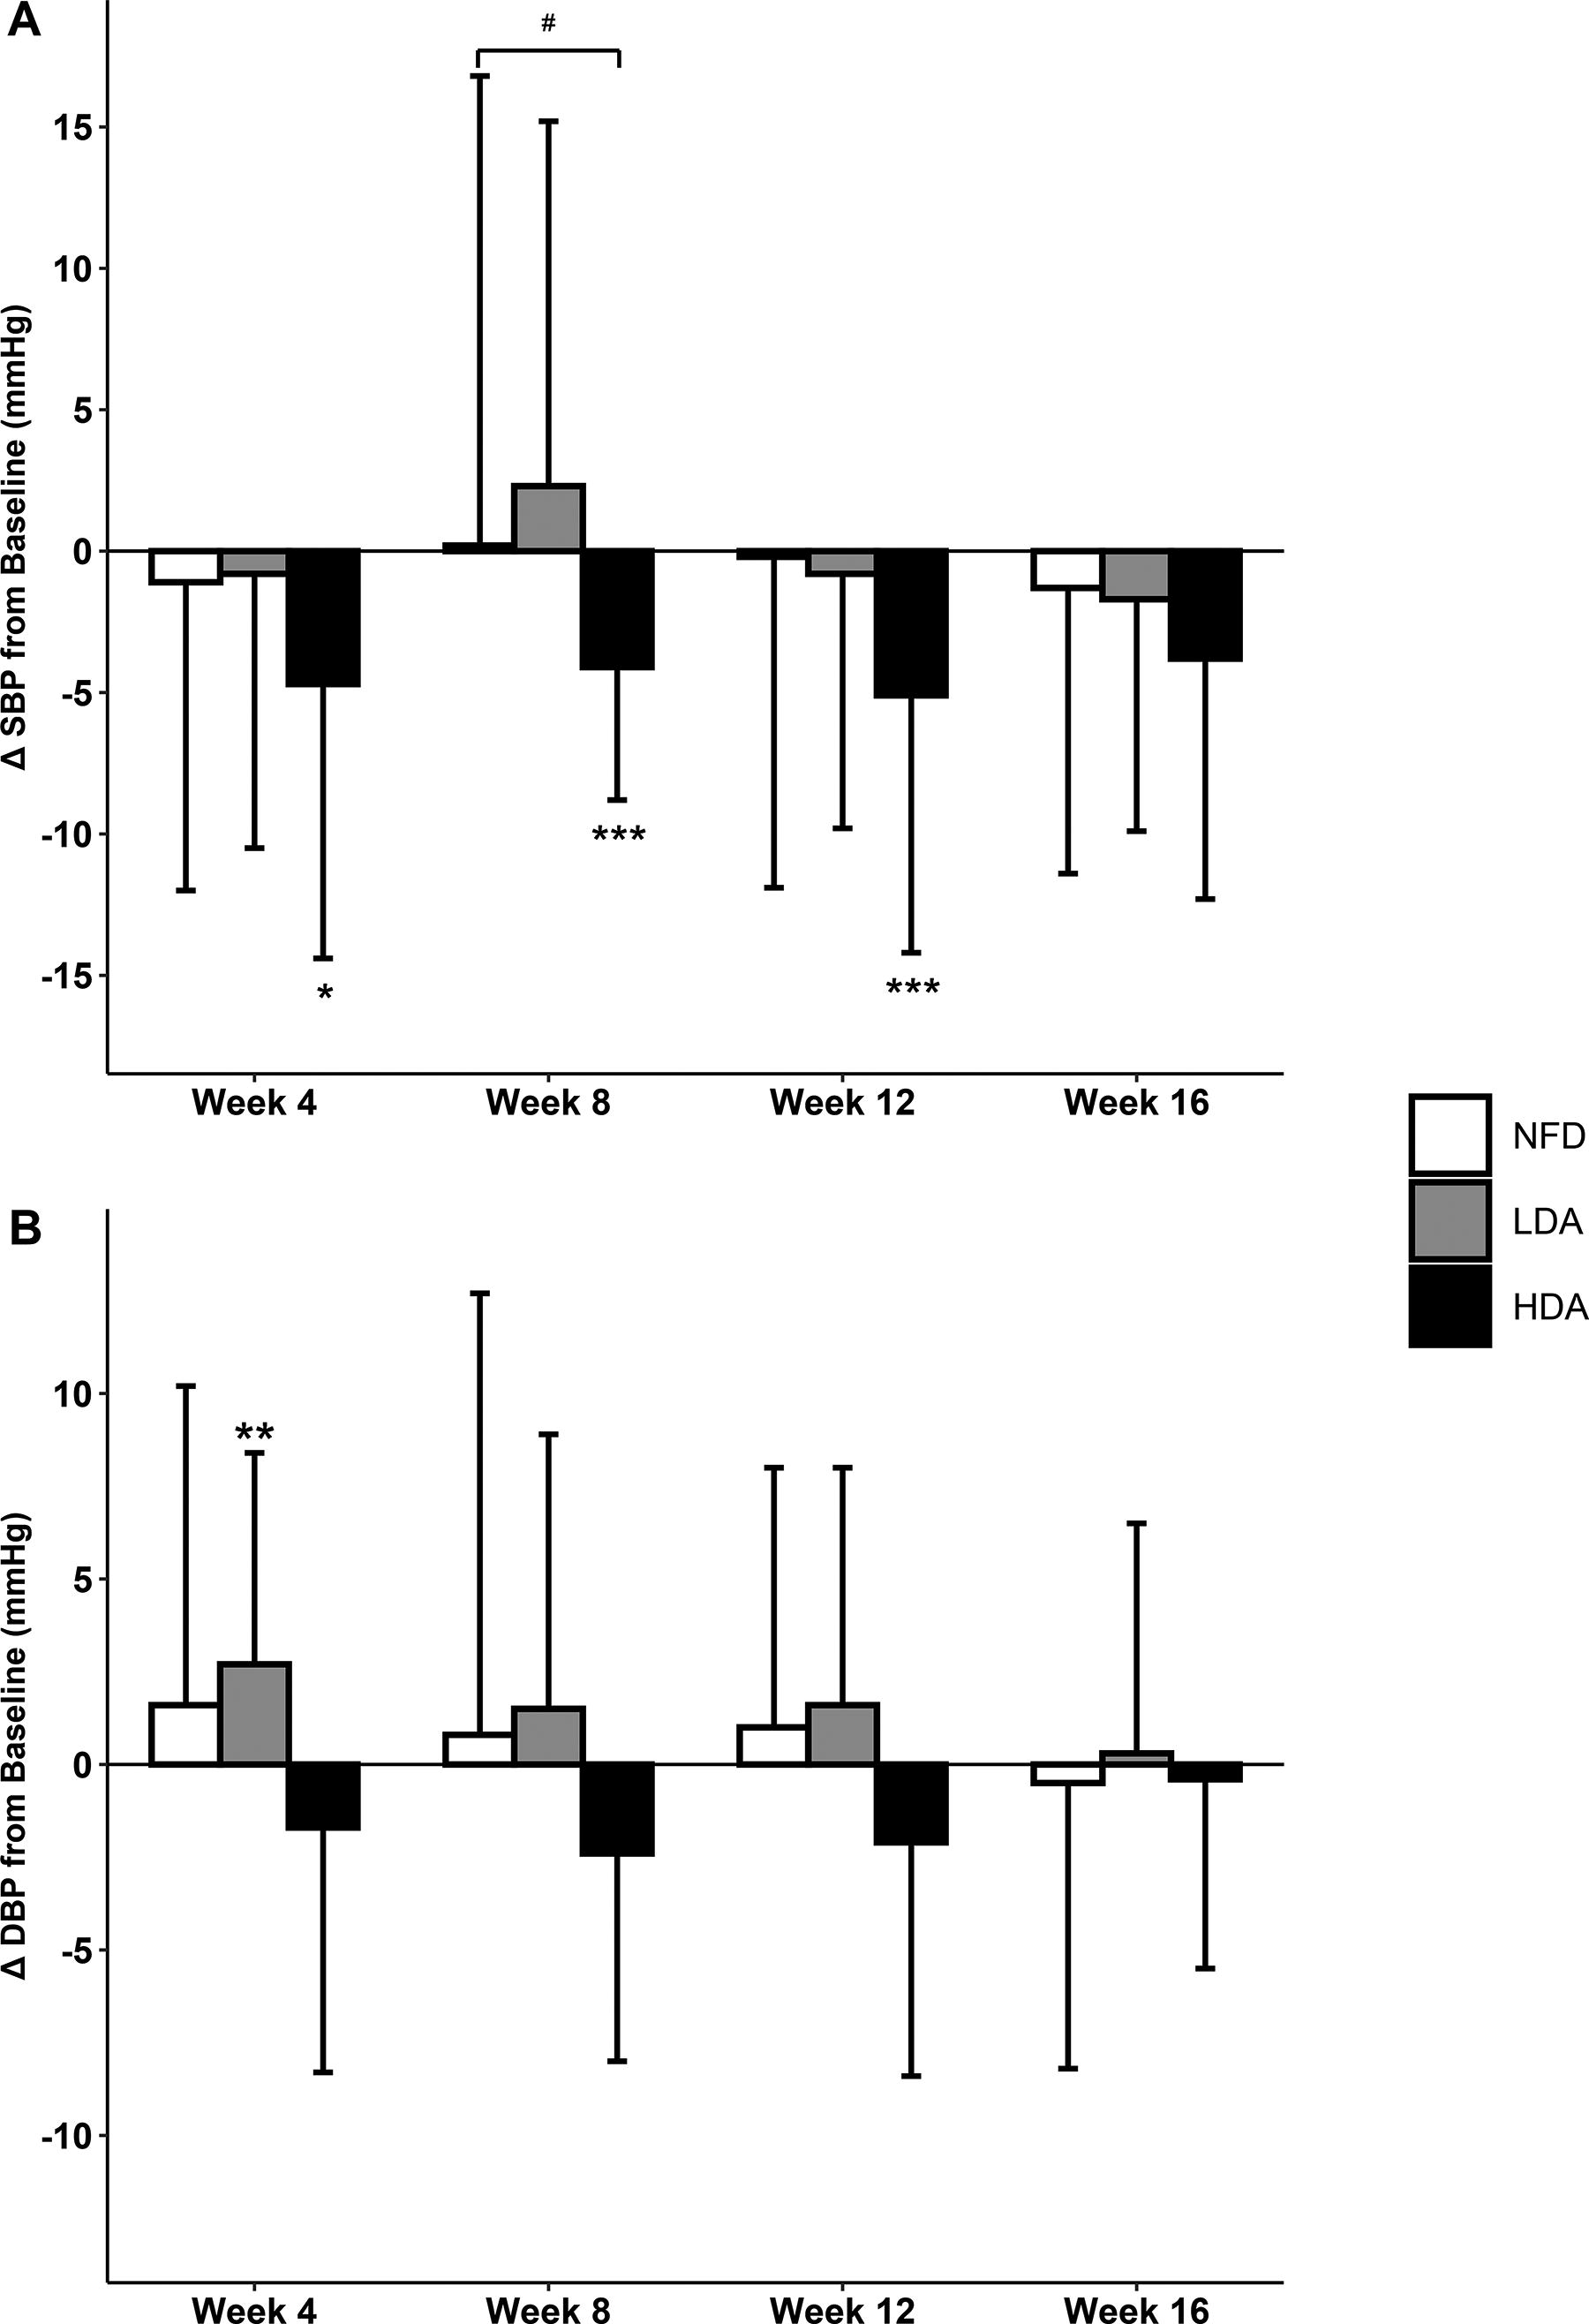
Systolic blood pressure (mmHg;
Apolipoprotein B48 and B100
There were significant decreases in ApoB100 and ApoB48 from baseline at weeks 8 and 16 for participants consuming HDA (P < .05; Fig. 4). Participants consuming LDA had significant decreases in ApoB48 after 8 (P < .001) and 16 weeks (P = .021) with no significant differences in ApoB100 (Fig. 4). Those on the NFD had significant decreases in ApoB48 from baseline at weeks 8 (P < .001) and 16 (P = .035) and in ApoB100 after 16 weeks (P = .037; Fig. 4).
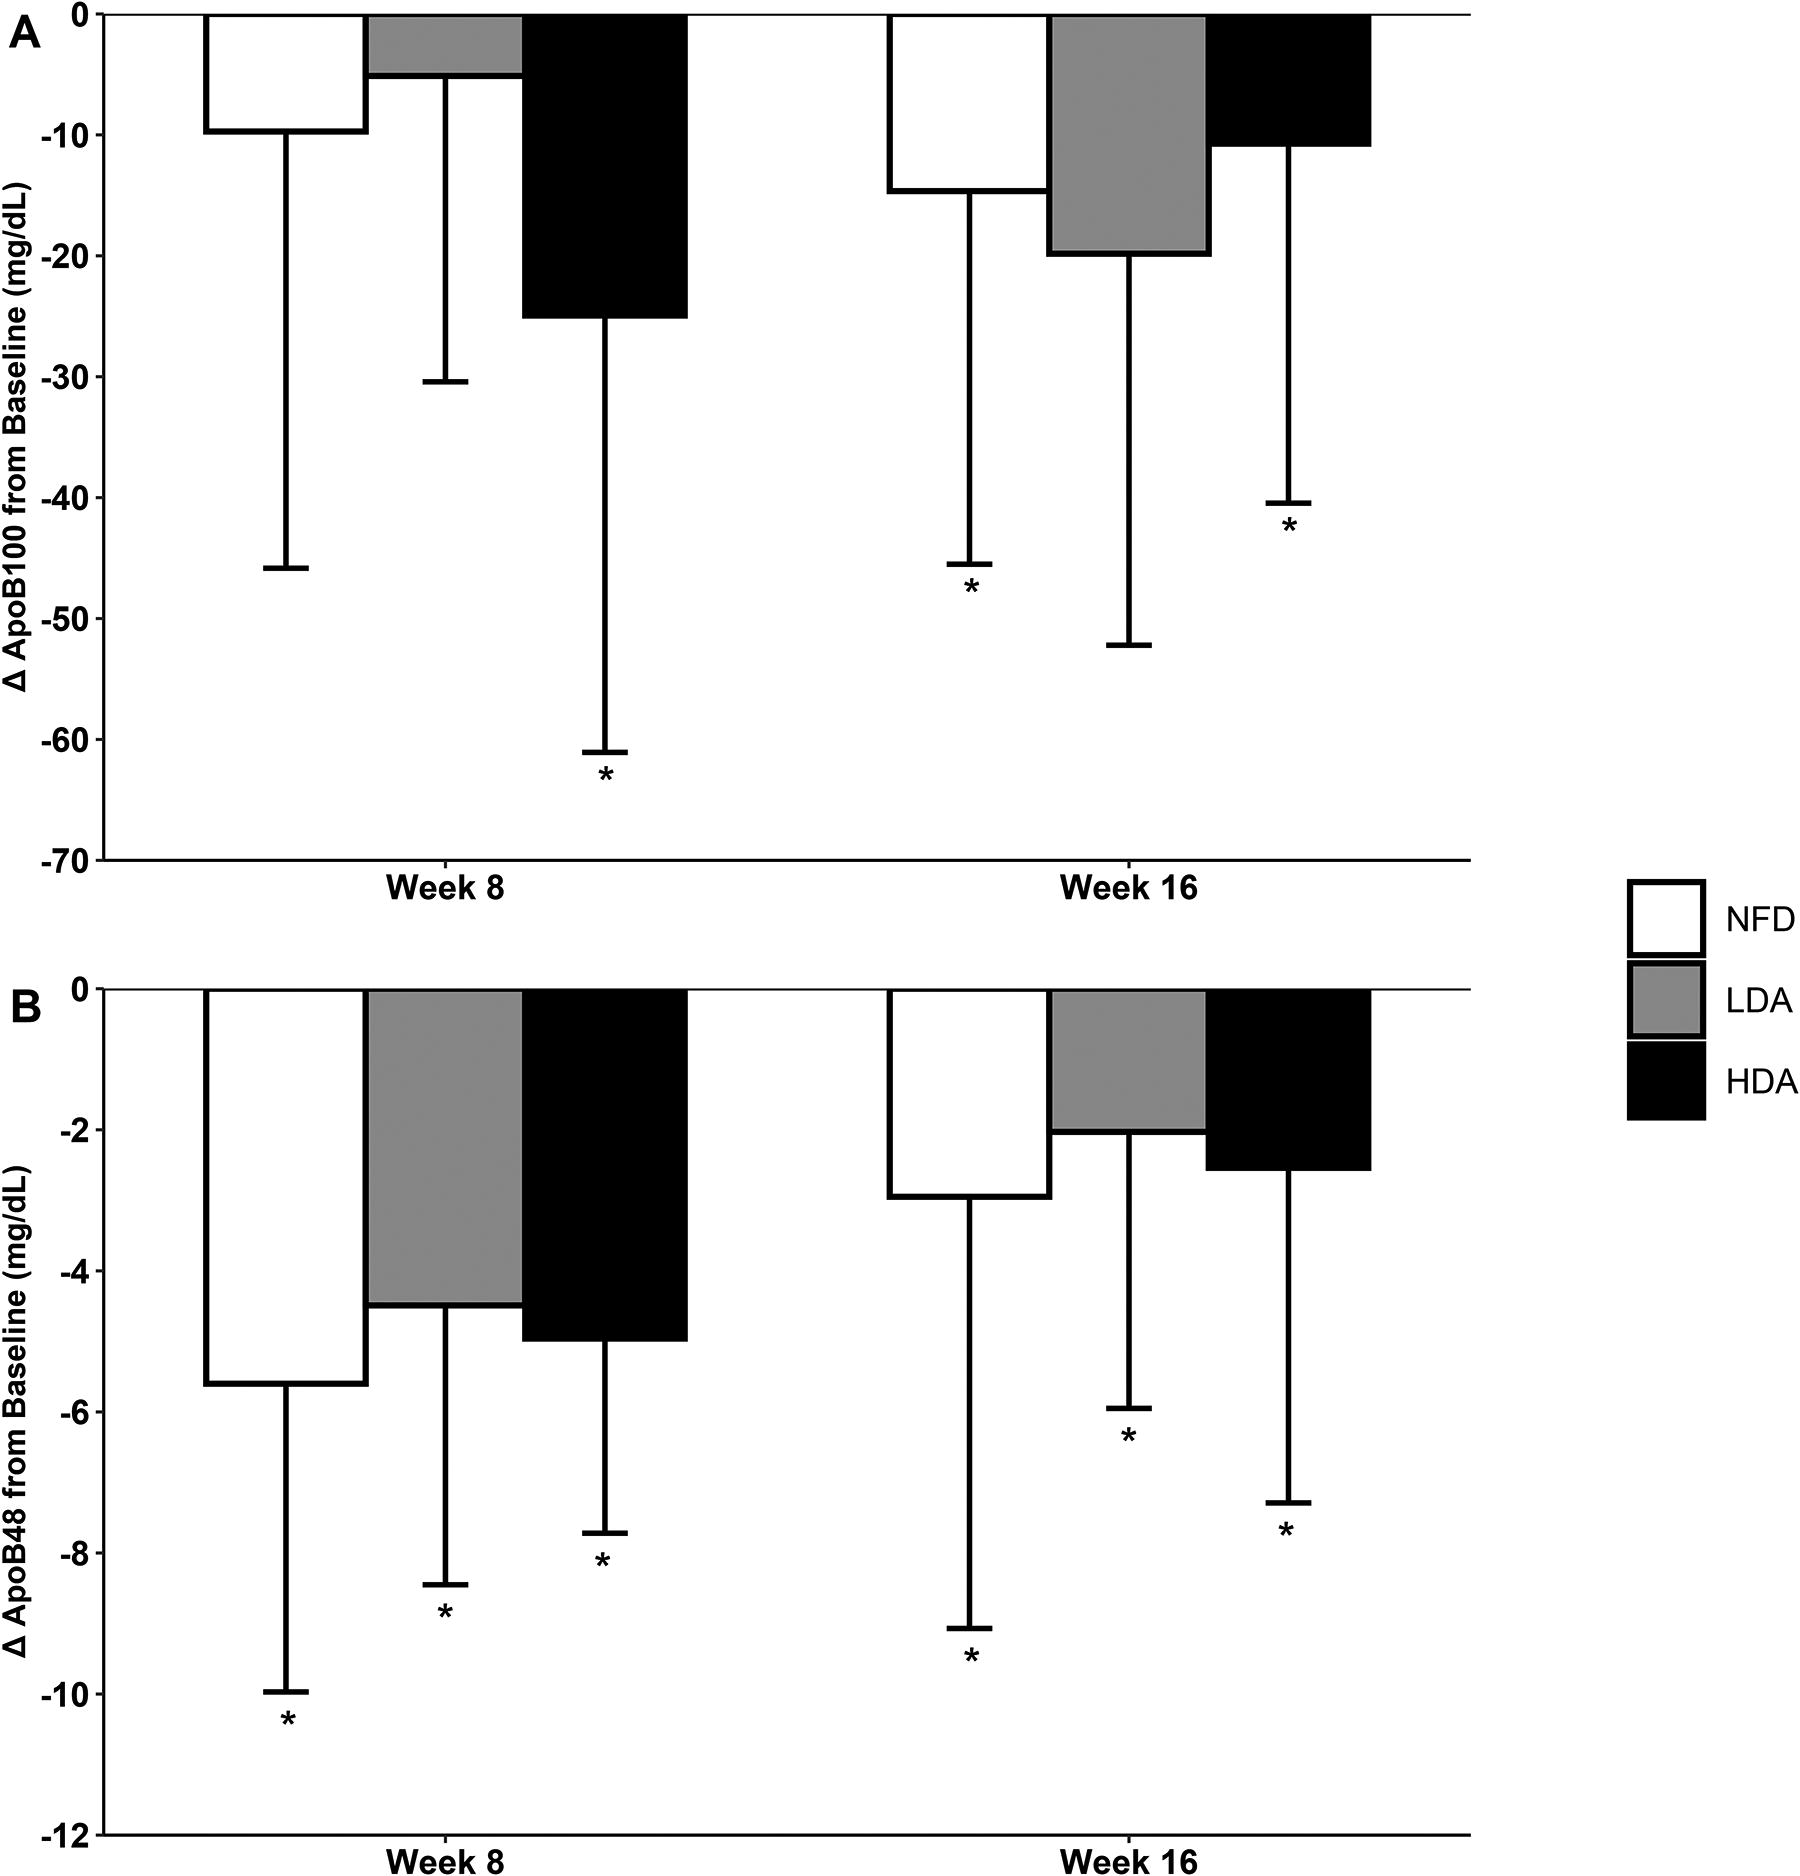
Change in ApoB100 (mg/dL;
Anthropometrics
Participants consuming the NFD had 4.0% (P < .01) and 2.7% (P = .05) increases in SAD from baseline at weeks 4 and 8, respectively, whereas those following the almond-rich diets had no significant changes. Participants in the HDA group had a significantly greater decrease in weight (−0.4 ± 1.5 kg vs. 0.7 ± 1.3 kg; P = .03), BMI (−0.1 ± 0.5 kg/m2 vs. 0.2 ± 0.5 kg/m2; P = .04), and waist circumference (−1.0 ± 2.8 cm vs. 0.5 ± 3.1 cm; P = .04) from baseline at week 4 compared with those in the LDA group. No differences were reported between the almond groups and the NFD group (P > .05). The HDA group had a significant decrease in waist:hip ratio of 0.03 ± 0.04 from baseline at week 4 (P = .02), whereas the NFD group had a significant increase of 0.03 ± 0.06 (P = .02). There were no other significant differences in anthropometrics between groups.
Serum α-tocopherol
Participants in the HDA group tended to have an increase in α-tocopherol of 3.0 ± 6.9 µmol/L from baseline at week 16 (P = .07), while those in the LDA and NFD groups had respective decreases of 0.9 ± 7.9 µmol/L (P = .57) and 1.9 ± 8.5 (P = .32). However, these changes in serum α-tocopherol were not statistically significant. α-Tocopherol significantly decreased in the NFD group from baseline at week 12 by 5.5 ± 10.4 µmol/L (P = .02).
Food records
At baseline, there were no significant between-group differences in the consumption of total daily calories and macro- and micronutrients, inclusive of carbohydrates, proteins, total fats, saturated fat, monounsaturated fat, polyunsaturated fat, cholesterol, fiber, and vitamin E. Compared with the NFD group, participants in the HDA group reported greater total fat (P ≤ .021), monounsaturated fat (P < .001), fiber (P ≤ .010), and vitamin E (P < .001) at all study points, as well as greater polyunsaturated fat at weeks 8 (P = .010), 12 (P = .003), and 16 (P < .001). Similarly, monounsaturated fat (P ≤ .025; week 16, P = .058) and vitamin E (P < .002) intakes were higher in the LDA group compared with the NFD group. At week 8, carbohydrate (P = .044) and protein intake (P = .008) were lower in the LDA group compared with the NFD group.
Differences in energy and nutrient intake were also observed between HDA and LDA groups. The LDA group had lower energy intake compared with the HDA group, which was particularly significant at week 12 (P = .026) and week 16 (P = .004). Furthermore, the LDA group reported significantly lower total fat (weeks 4, 12, and 16, P ≤ .038), monounsaturated fat (weeks 12 and 16, P ≤ .004), polyunsaturated fat (weeks 12 and 16, P ≤ .026), protein (weeks 4, 8, 12, and 16, P ≤ .008), and fiber (weeks 4, 8, 12, and 16, P ≤ .011) at various study timepoints compared with the HDA group. There were no other significant differences reported in food record data.
Safety
Fifty-seven post-emergent AEs were reported by 33 participants. Fourteen AEs reported by four participants were deemed “possibly” related to the study products, including 13 mild AEs reported in the HDA group and 1 moderate AE reported in the NFD group. The “possibly” related AEs reported in the HDA group included diarrhea (n = 6), loose stools (n = 6), and stomach ache (n = 1), of which 11 instances of diarrhea and loose stools ranging from 1 to 6 days were reported by one participant who completed the study. The “possibly” related AE reported in the NFD group was elevated fasting blood glucose (FBG), for which blood work was repeated, and levels were no longer clinically relevant. All AEs were resolved by the end of the study period or upon follow-up deemed necessary by the MD.
All out-of-range safety laboratory values were deemed not clinically relevant by the MD, except for one instance of elevated FBG in each of the NFD, as mentioned above, and LDA groups, and one instance of elevated liver markers in each of the NFD and HDA groups. Upon follow-up, all clinically relevant changes in laboratory values were resolved except for one participant in the HDA group who had elevated ALT, ALP, and AST at the end of the study. This participant was advised to follow up with their family physician, after which they did not respond to multiple follow-up attempts for repeat blood work.
DISCUSSION
This clinical trial demonstrated that daily almond consumption significantly decreased CVD risk in an adult population with hypercholesterolemia. Due to an increasingly older adult population and age-associated increased CVD risk, simple, cost-effective strategies are warranted to prevent further worsening of a public health concern that remains the leading cause of death worldwide.20,23,24 These findings align with the inclusion of nuts, including almonds, in global dietary and cardiovascular clinical practice guidelines.25–28 While there are non-modifiable factors considered in the FRS, age and sex,20,21 lipid levels, BP, medication use, diabetes status, and smoking status offer targets for improvement. Results from the current study showed that consuming 2.5 oz of almonds daily decreased SBP by up to 5.1 mmHg. This represents a clinically meaningful reduction (5 mmHg) associated with a ∼10% decreased risk of major CVD events 29 and likely contributed to reductions in CVD risk score. Moreover, increases in HDL-C, although not statistically significant, likely further contributed to these improvements.
HDL-C aids in the removal of cholesterol from the blood, with HDL-C inversely associated with CVD risk. 30 While it has been established that almond consumption improves atherogenic lipid particles, 9 results are inconsistent for HDL-C. Almond consumption has been shown to significantly increase HDL-C, 17 while other studies showed no significant differences8,12,31 or a significant decrease. 6 A recent systematic review and meta-analysis reported a significant decrease in HDL-C after almond intervention compared with control. 9 The current study supports almond consumption for the maintenance of HDL-C, as almond-enriched diets increased HDL-C after 16 weeks (not statistically significant), while the NFD resulted in a decrease. The lack of statistically significant differences in HDL-C may be due to participants’ mean baseline levels of HDL-C being close to the optimal range of 1.6 mmol/L or greater, 30 thus having less room or need for improvement. Moreover, variability in human responses to dietary interventions is common and challenging to control,32,33 consistent with the large interindividual variability in changes in HDL-C and other study outcomes. While the study duration is among the longest conducted in this research area, 9 an even longer study duration may be required to achieve significant increases in HDL-C with almond consumption. 34 Future larger studies with longer durations or those enrolling individuals with less optimal HDL-C levels may be considered to further understand the cardioprotective potential of almonds.
Apolipoprotein B particles examined in this study are also associated with CVD risk, which showed early and sustained decreases following an almond-enriched diet. 35 Apolipoproteins are the primary carrier of LDL-C and other atherogenic particles and are found in circulation in different forms, including ApoB100 and ApoB48. 36 Interestingly, there was also a significant decrease in ApoB100 in the NFD group after 16 weeks. The findings related to ApoB100 and ApoB48 need to be considered in the context of high interindividual variability observed in each group. It is possible that the overall composition of participant diets may have contributed to the lack of significant differences between groups,37,38 considering the complexity of nutritional interventions in clinical outcomes as mentioned above. Future studies investigating the effects of daily almond consumption as a snack consumed as part of a Western-style dietary pattern are warranted to further elucidate their potential beneficial health effects.
Another risk factor for CVD is SAD, an assessment of abdominal obesity, 39 which may be an equal or better predictor of CVD risk than waist circumference.40,41 Abdominal obesity is characterized by visceral fat within the abdominal region and plays a role in CVD development 39 through inflammation and insulin resistance. 42 The current study showed participants consuming the NFD had a significant increase in SAD despite its isocaloric composition to the LDA group, for which no significant differences in SAD were observed. These results suggest the nutritional composition of the cookie comparator snack may have played a role in these findings. The cookies used in the current study were chocolate chip or Oreo cookies, as they are commonly consumed snacks in the Western diet, which are high in saturated fat and refined carbohydrates, whereas almonds contain polyunsaturated fats, protein, dietary fiber, micronutrients, and phytochemicals, 43 contributing to their beneficial health effects. The self-reported food records of the current study confirmed that the almonds provided a source of these nutrients. Despite the higher caloric intake observed in the HFD group, there was a significantly greater reduction in weight. The additional nutrients provided by a greater quantity of almonds may have resulted in a more favorable diet quality and contributed to weight loss and reduction in BMI through improved metabolic health and displacement of other snacks or foods. 44 Broadly, the results from the current study highlight the importance of selecting healthier snack options for individuals at greater risk of CVD.
Interestingly, serum α-tocopherol,14,22 a measure of compliance, did not significantly increase with almond consumption despite the high self-reported compliance and increased vitamin E intakes reported in the food records. Similar findings have been reported previously, 45 for which the lack of association between almond intake and α-tocopherol levels may have been due to high baseline levels, and could also explain these findings. Although 13 AEs were deemed “possibly” related to the study product in the HDA group, 11 of these were reported by one participant, were short-lived, and the participant completed the study.
Limitations
Findings from the current study need to be considered in the context of study limitations. The study population was 30–65 years old and primarily “European White,” which may limit the generalizability of study findings to populations of different race or ethnicity due to differences in lipid profiles. 46 Future studies aimed at recruiting a more diverse population are encouraged.
CONCLUSIONS
Findings from the current study suggest that daily almond consumption may improve CVD risk in the studied population. Reductions in CVD risk were supported by the maintenance of HDL-C over the study period and clinically relevant improvements in SBP. Differences in the nutritional profile of almonds and the cookie comparator likely contributed to this study’s findings. This study adds to the literature with its examination of differing portions of almonds on HDL-C and other CVD risk factors.
AUTHORS’ CONTRIBUTIONS
K.M.D.: Formal analysis, writing—original draft preparation, writing—review and editing, and visualization. M.M.: Formal analysis and writing—review and editing. D.C.C.: Methodology, investigation, data curation, and supervision. N.G.: Conceptualization, supervision, and funding acquisition. E.D.L.: Conceptualization, methodology, formal analysis, writing—original draft preparation, writing—review and editing, visualization, and supervision. All authors read and approved the final article.
Footnotes
ACKNOWLEDGMENTS
The authors would like to thank the participants for their study conduct.
AUTHOR DISCLOSURE STATEMENT
K.M.D., M.M., D.C.C., N.G., and E.D.L. are employees of KGK Science Inc.
FUNDING INFORMATION
Funding provided by the Almond Board of California. The funders had no role in study design, data collection and analysis, decision to publish, or preparation of the article.
DATA AVAILABILITY
Data are available from the corresponding author upon reasonable request.
Supplemental Material
References
Supplementary Material
Please find the following supplemental material available below.
For Open Access articles published under a Creative Commons License, all supplemental material carries the same license as the article it is associated with.
For non-Open Access articles published, all supplemental material carries a non-exclusive license, and permission requests for re-use of supplemental material or any part of supplemental material shall be sent directly to the copyright owner as specified in the copyright notice associated with the article.