This is the 12th in a series of salary surveys conducted at approximately 3-year intervals for toxicologists that began in 1988. Previous salary surveys were conducted in 1988,1 1991,2 1995,3 1998,4 2001,5 2004,6 2007 (which was posted electronically, but not published), 2012,7 2016,8 2020,9 and 2022.10 In addition to presenting the 2024 results, herein we are providing additional data and an analysis of the trends for employment and pay in toxicology over the last 37 years.
The 12th Triennial Toxicology Salary Survey was conducted as a joint project by the American College of Toxicology (ACT) and the Society of Toxicology (SOT).1–10 In addition to the two parent organizations, eight others (the Society for Birth Defects Research, the Society of Toxicologic Pathology, the Safety Pharmacology Society, the American Board of Toxicology (ABT), the Academy of Toxicological Sciences, the Roundtable of Toxicology Consultants, the Society of Environmental Toxicology and Chemistry (SETAC), and the Environmental Mutagenesis and Genomics Society) supported the effort by distributing the Survey Monkey-based instrument to their memberships.
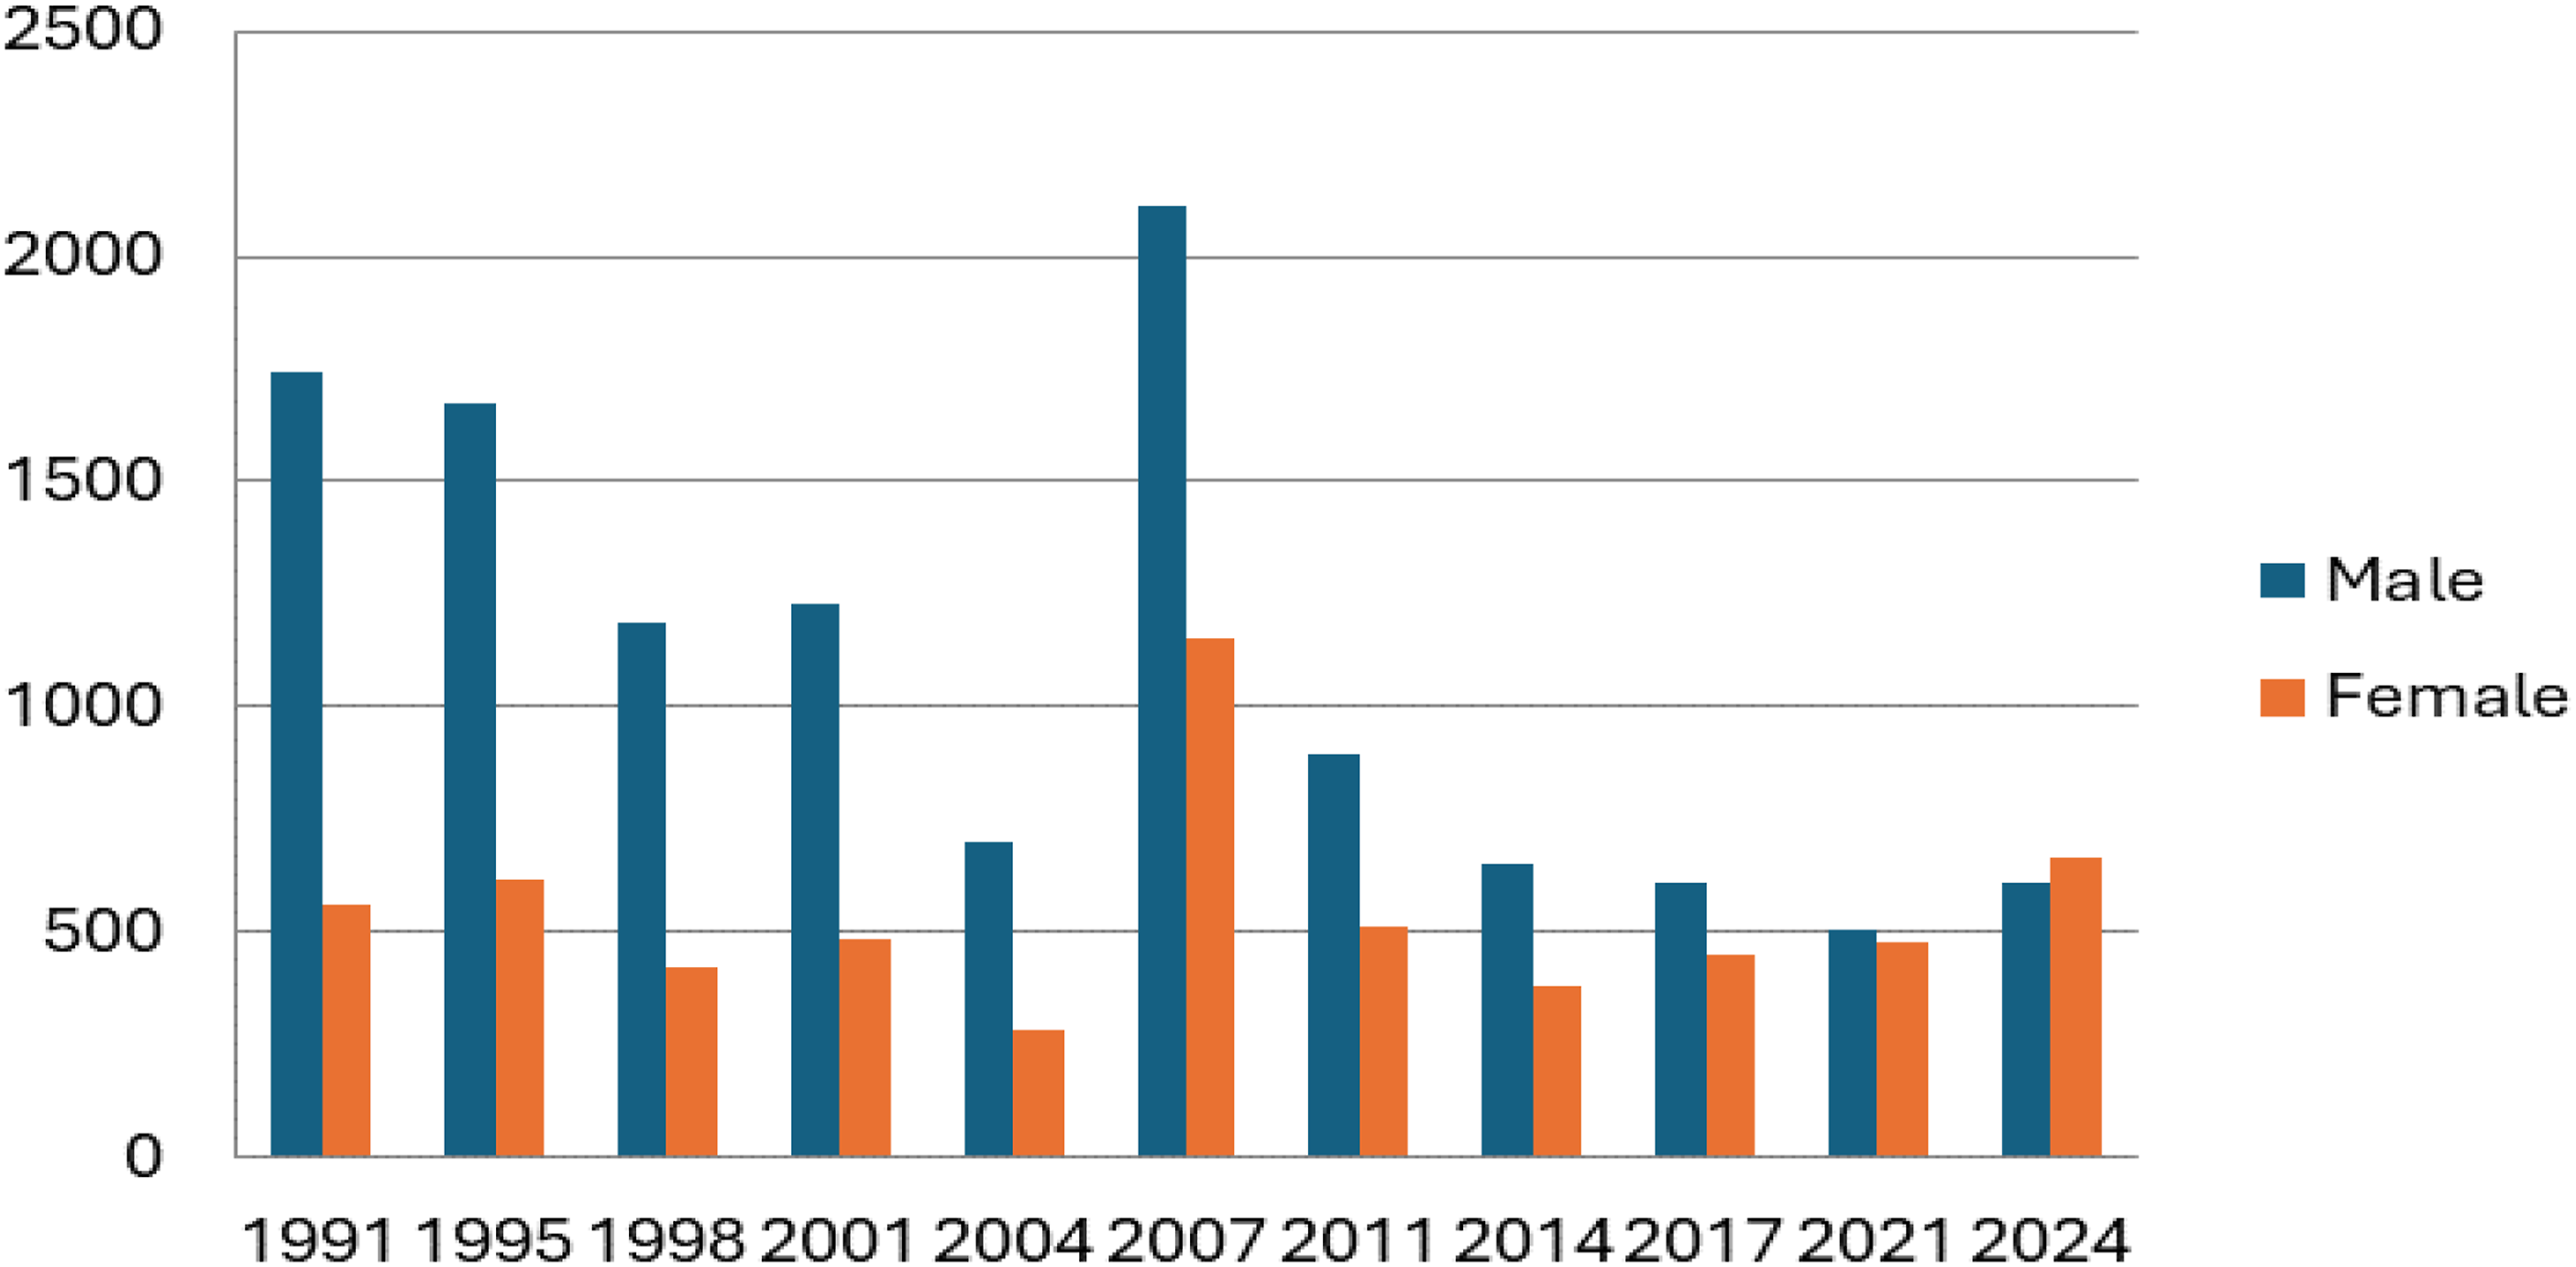
Survey instruments were distributed electronically, in January 2024, with responses going to Survey Monkey, which eliminated duplicate responses. The survey instrument was similar to the form of the 2022 survey, developed in conjunction with the SOT Education and Career Development Committee (ECDC), which included questions evaluating periods of unemployment as well as employer-provided benefits. The survey methodology employed conformed to standard procedures.11 Though the response rate for this survey remains high for such endeavors, it is lower than almost all preceding years. The exception is that there was a modest increase over the immediately preceding (2022) survey. A total of 1313 responses were received, up from the 1087 responses received for the previous survey.10Figure 1 graphically presents the number of doctoral level respondents over the last 24 years (this year, 1106).
Number of doctoral-level respondents across surveys.
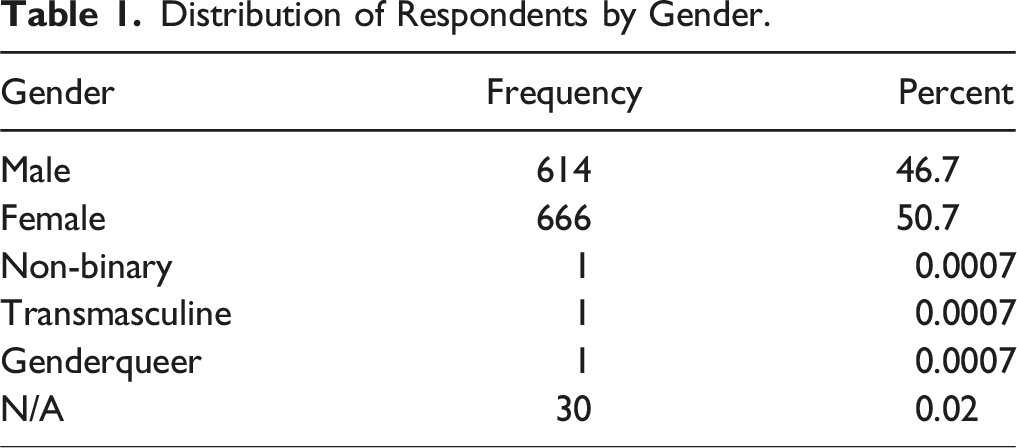
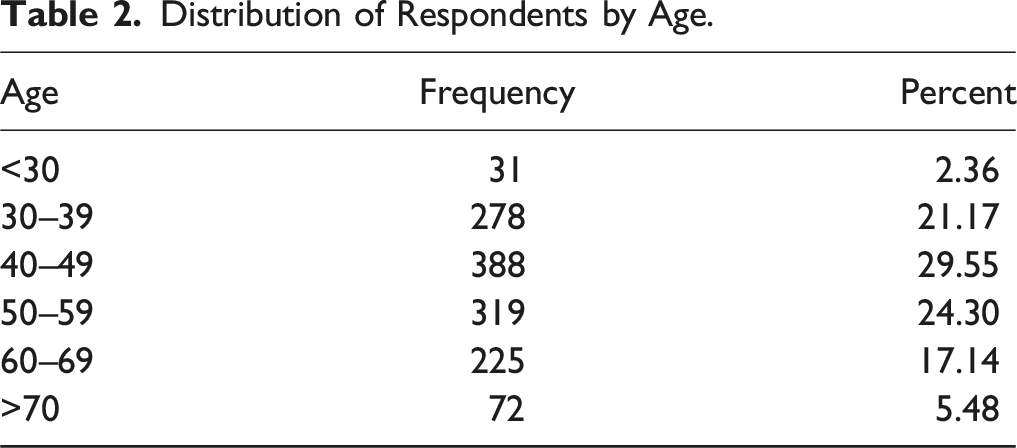
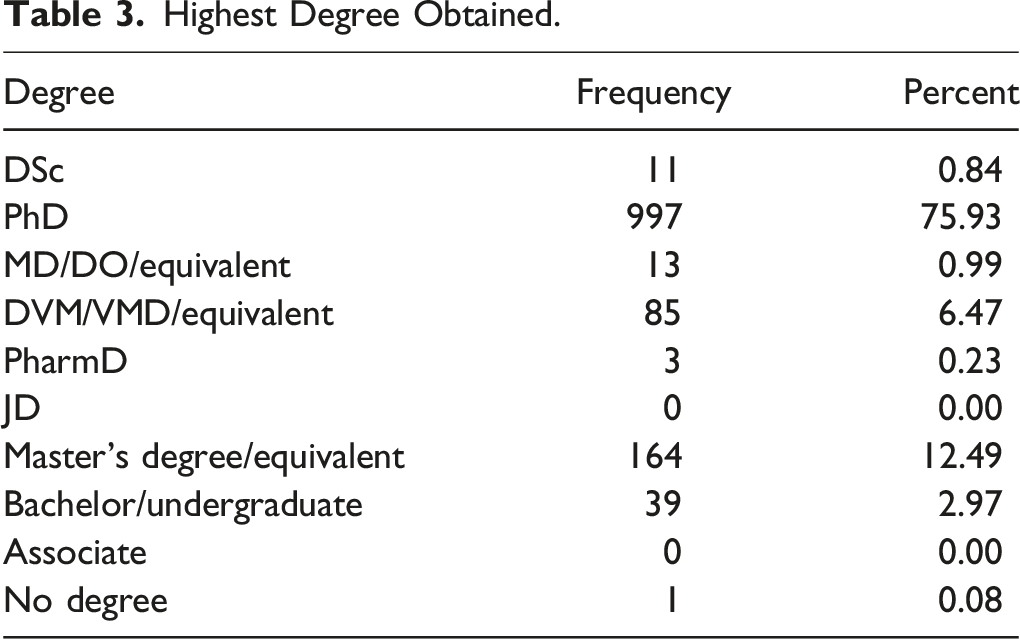
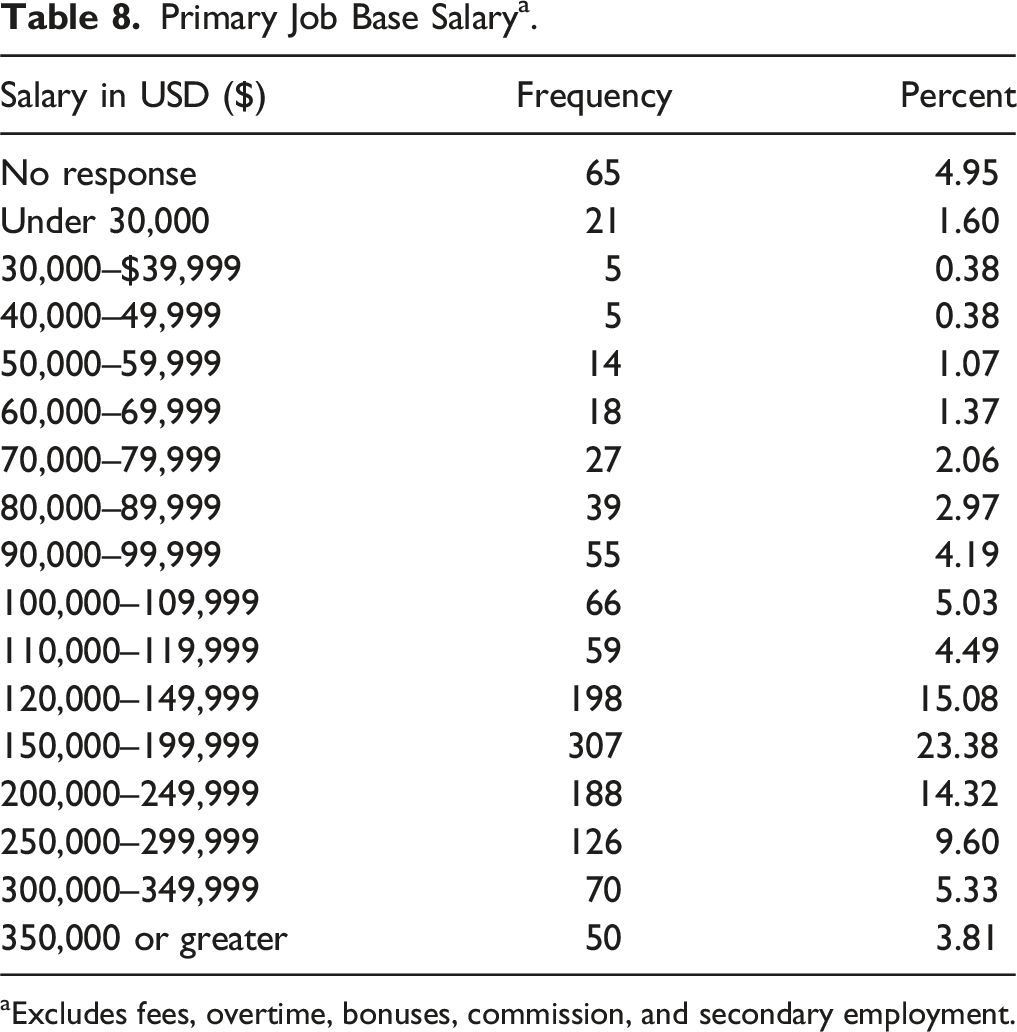
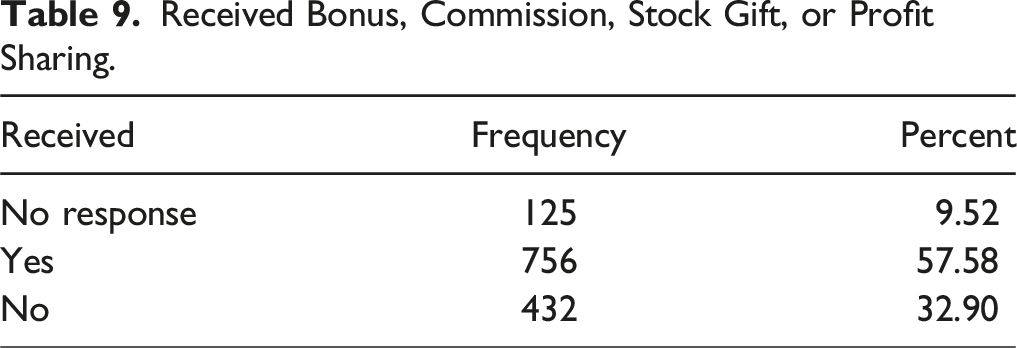
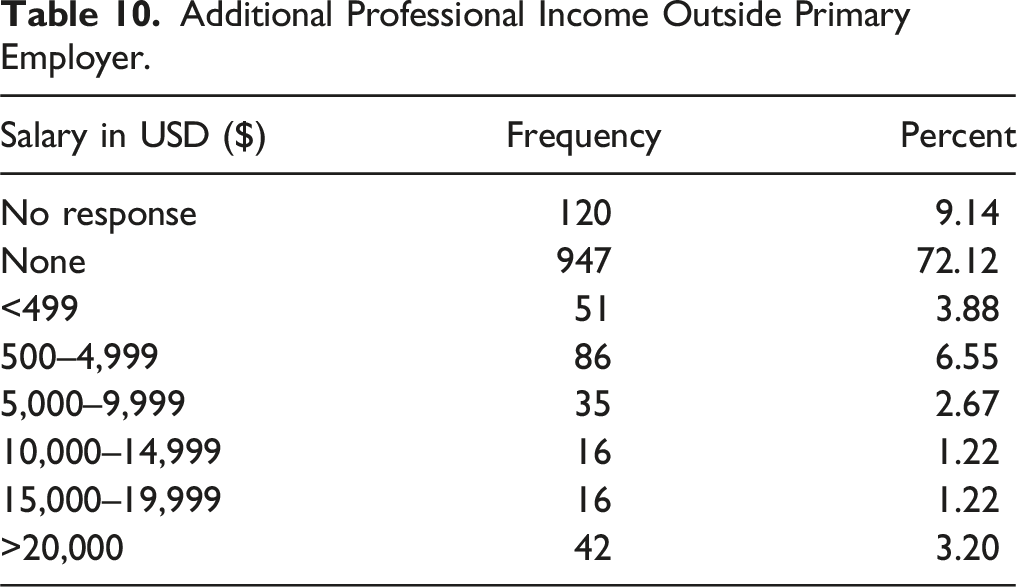
The demographics of responses are summarized in Tables 1 through 7 and include respondents’ gender, age, degree, years of experience, certifications held, and areas of specialization. It should be noted that there continues to be a significant increase in the number of individuals reporting six-figure incomes and in those receiving significant sums as bonuses, as is reflected particularly in Tables 8 and 9. In addition, about 19% of respondents received additional professional income outside their primary employer, as shown in Table 10.
Distribution of Respondents by Gender.
Gender
Frequency
Percent
Male
614
46.7
Female
666
50.7
Non-binary
1
0.0007
Transmasculine
1
0.0007
Genderqueer
1
0.0007
N/A
30
0.02
Distribution of Respondents by Age.
Age
Frequency
Percent
<30
31
2.36
30–39
278
21.17
40–49
388
29.55
50–59
319
24.30
60–69
225
17.14
>70
72
5.48
Highest Degree Obtained.
Degree
Frequency
Percent
DSc
11
0.84
PhD
997
75.93
MD/DO/equivalent
13
0.99
DVM/VMD/equivalent
85
6.47
PharmD
3
0.23
JD
0
0.00
Master’s degree/equivalent
164
12.49
Bachelor/undergraduate
39
2.97
Associate
0
0.00
No degree
1
0.08
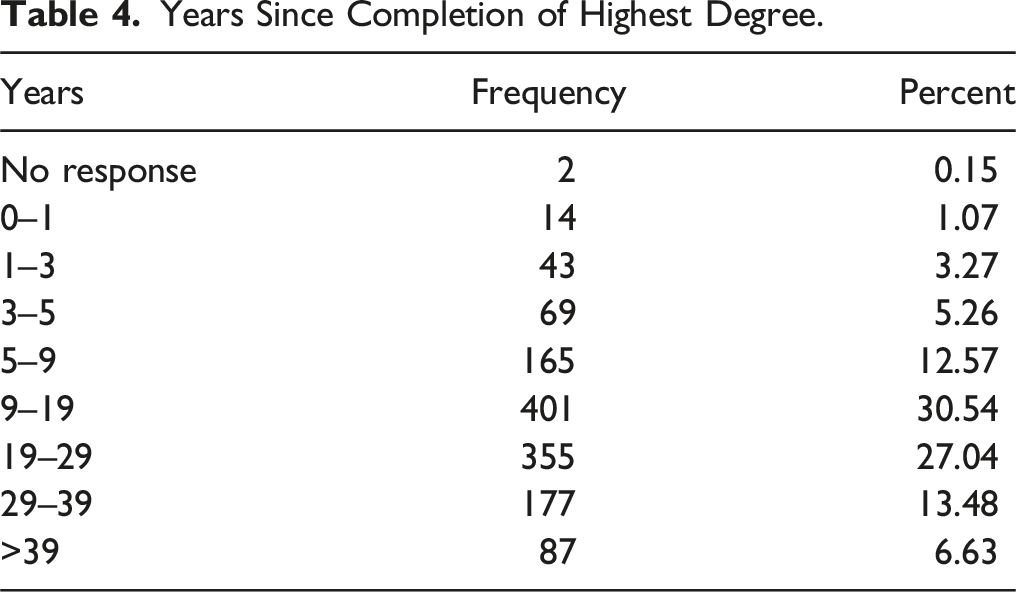
Years Since Completion of Highest Degree.
Years
Frequency
Percent
No response
2
0.15
0–1
14
1.07
1–3
43
3.27
3–5
69
5.26
5–9
165
12.57
9–19
401
30.54
19–29
355
27.04
29–39
177
13.48
>39
87
6.63
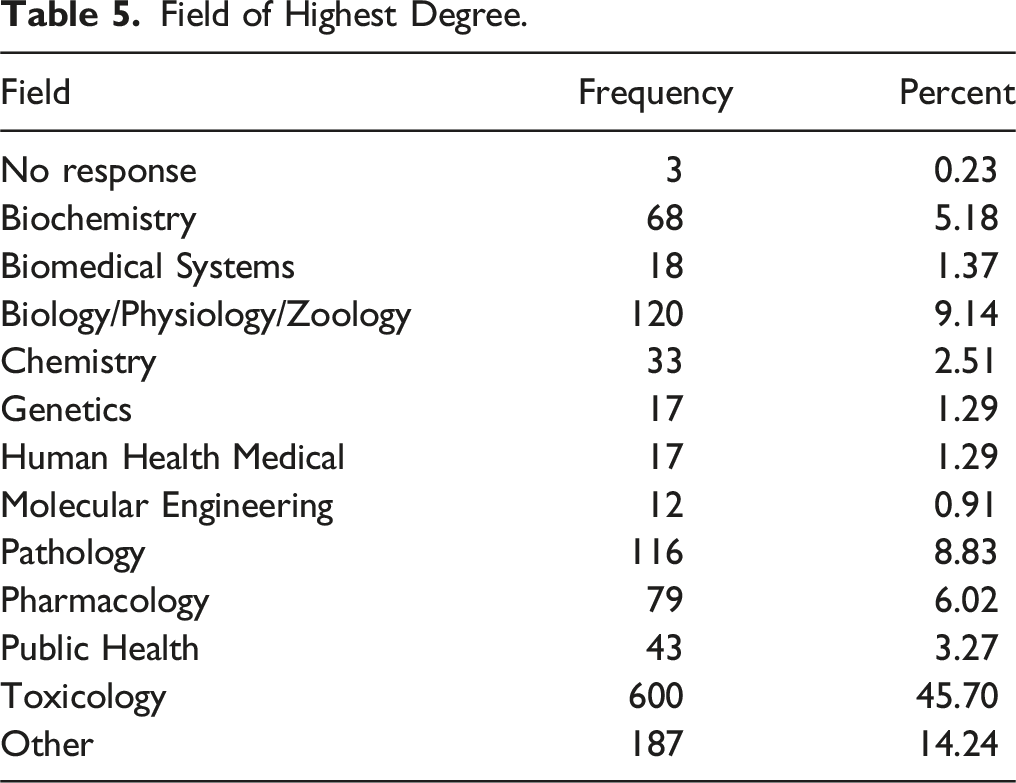
Field of Highest Degree.
Field
Frequency
Percent
No response
3
0.23
Biochemistry
68
5.18
Biomedical Systems
18
1.37
Biology/Physiology/Zoology
120
9.14
Chemistry
33
2.51
Genetics
17
1.29
Human Health Medical
17
1.29
Molecular Engineering
12
0.91
Pathology
116
8.83
Pharmacology
79
6.02
Public Health
43
3.27
Toxicology
600
45.70
Other
187
14.24
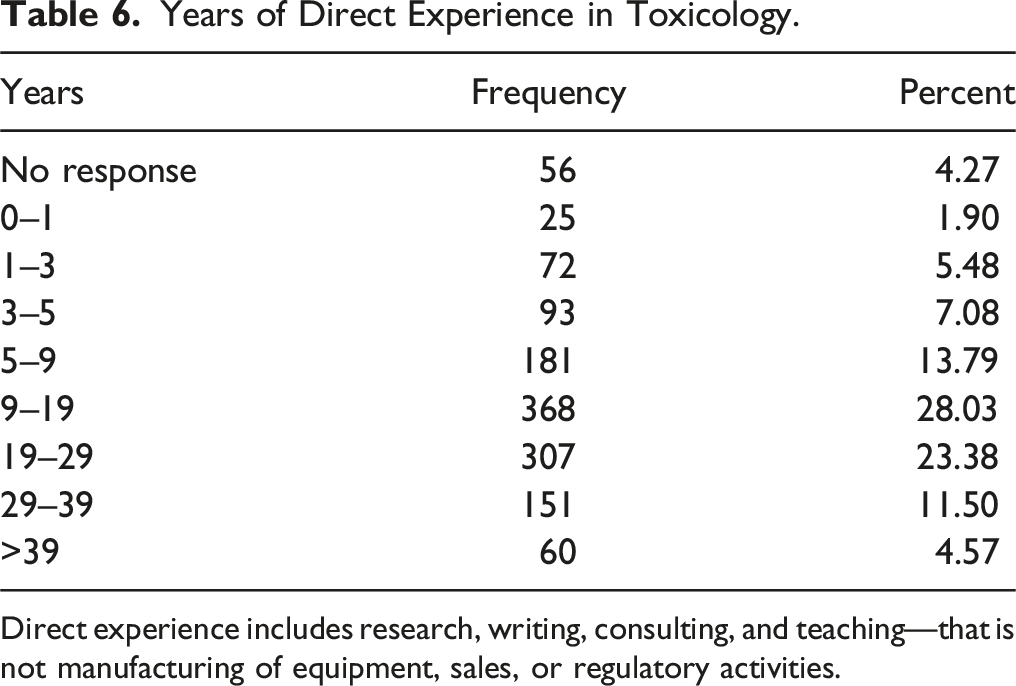
Years of Direct Experience in Toxicology.
Years
Frequency
Percent
No response
56
4.27
0–1
25
1.90
1–3
72
5.48
3–5
93
7.08
5–9
181
13.79
9–19
368
28.03
19–29
307
23.38
29–39
151
11.50
>39
60
4.57
Direct experience includes research, writing, consulting, and teaching—that is not manufacturing of equipment, sales, or regulatory activities.
aExcludes fees, overtime, bonuses, commission, and secondary employment.
Received Bonus, Commission, Stock Gift, or Profit Sharing.
Received
Frequency
Percent
No response
125
9.52
Yes
756
57.58
No
432
32.90
Additional Professional Income Outside Primary Employer.
Salary in USD ($)
Frequency
Percent
No response
120
9.14
None
947
72.12
<499
51
3.88
500–4,999
86
6.55
5,000–9,999
35
2.67
10,000–14,999
16
1.22
15,000–19,999
16
1.22
>20,000
42
3.20
Information not presented in the tables are that over half (51.46%) of doctoral respondents have held a formal mentored post-doctoral research position, with most respondents having served 2–3 years as a post-doctoral scholar. Furthermore, the vast majority (96.75%) of respondents held 1–2 post-doctoral fellowships. Worth noting is that the majority of respondents (75.51%) did not participate in a toxicology-related internship. Most respondents who did held a toxicology-related internship during graduate training (14.49%).
Salary estimates for purposes of calculation were taken to be the midpoint of the range by each cohort, for example, for the salary range of $90,000–$99,999, a mean value of $95,000 was used in all calculations. In addition, there were a significant number of incomplete responses that required further estimation by statistical methods. The incomplete responses and the methods used to handle them were
• Fourteen (14) respondents did not indicate a gender. These results were not included in the gender-based breakdowns.
• Twelve (12) respondents indicated a salary >$350,000 without including the actual amount in the area provided. The salary used for calculation using these was $350,000. This probably led to a bias toward lower average values.
• One hundred eighty-six (186) respondents indicated they received bonuses, commission, stock options, or profit sharing without indicating the amount. These were excluded from consideration for this endpoint.
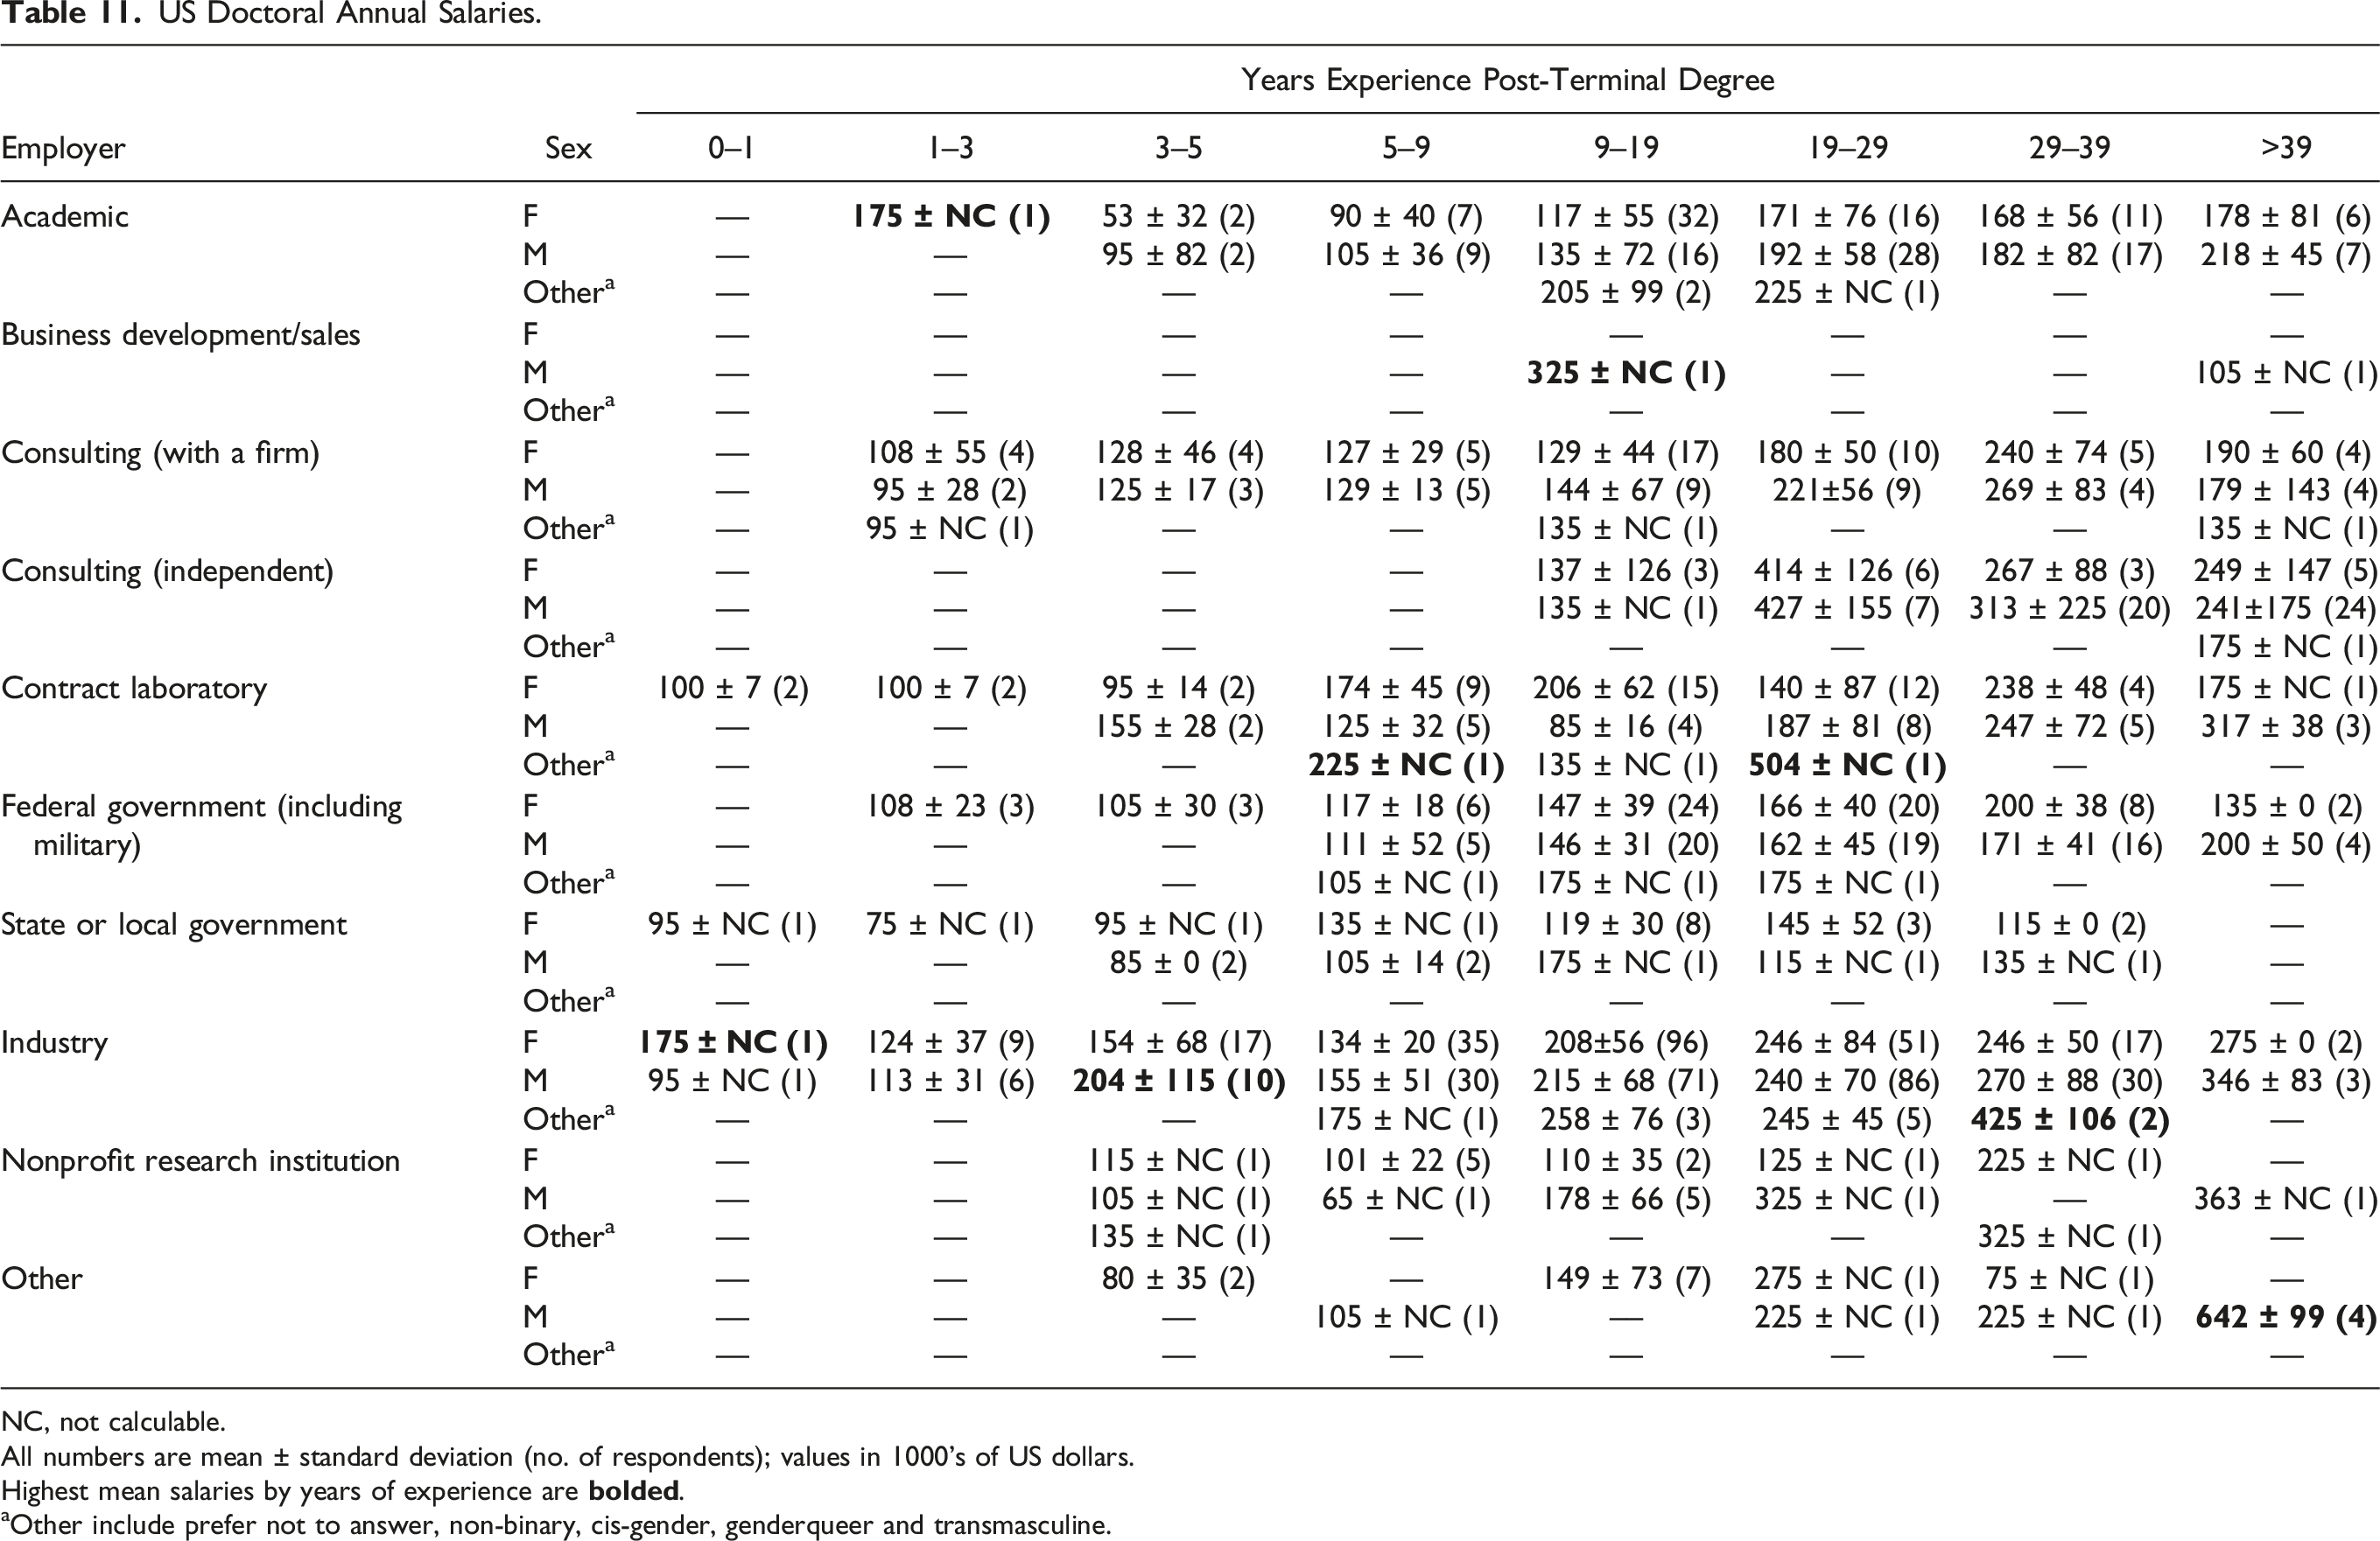
A total of 1066 of the respondents (471 men, 569 women, and 26 non-designated gender) were full-time employed holders of doctoral degrees in the United States. Table 11 presents the mean salaries (± one standard deviation) for these individuals, sorted by years of experience after receipt of their degrees, gender, and field of employment. Salaries are in thousands of U.S. dollars per year, with necessary conversions having been made for other currencies.
All numbers are mean ± standard deviation (no. of respondents); values in 1000’s of US dollars.
Highest mean salaries by years of experience are bolded.
aOther include prefer not to answer, non-binary, cis-gender, genderqueer and transmasculine.
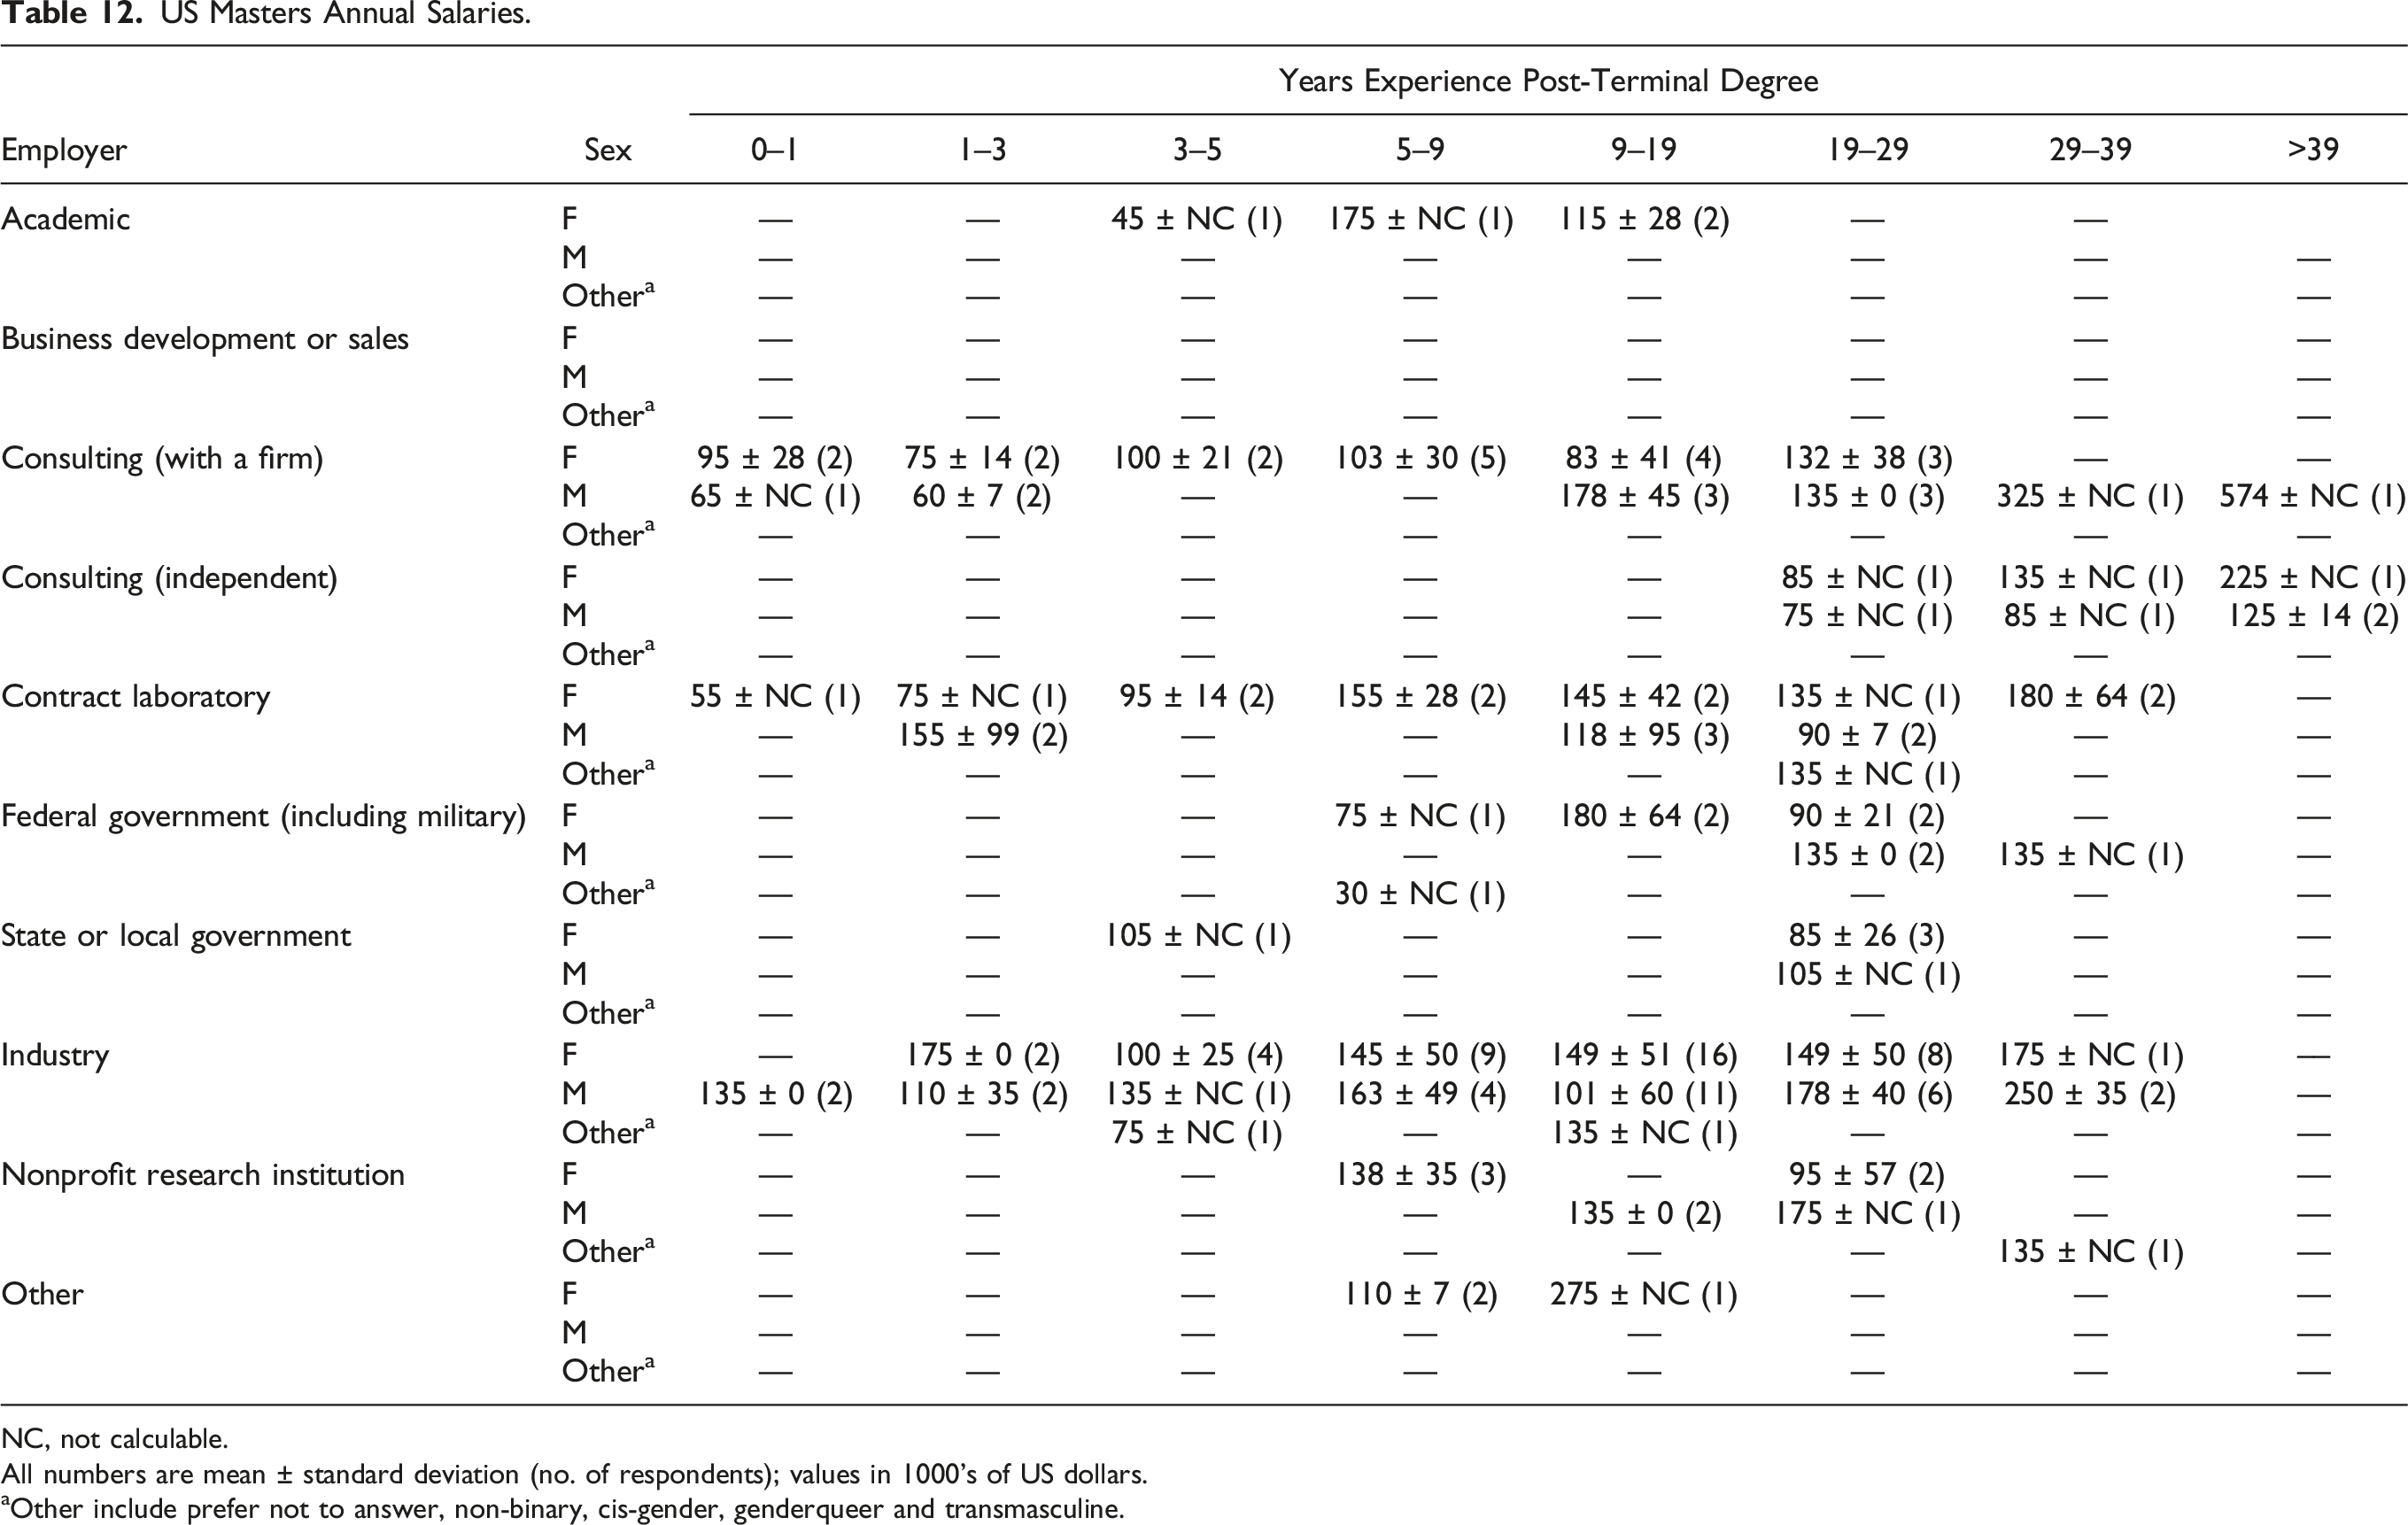
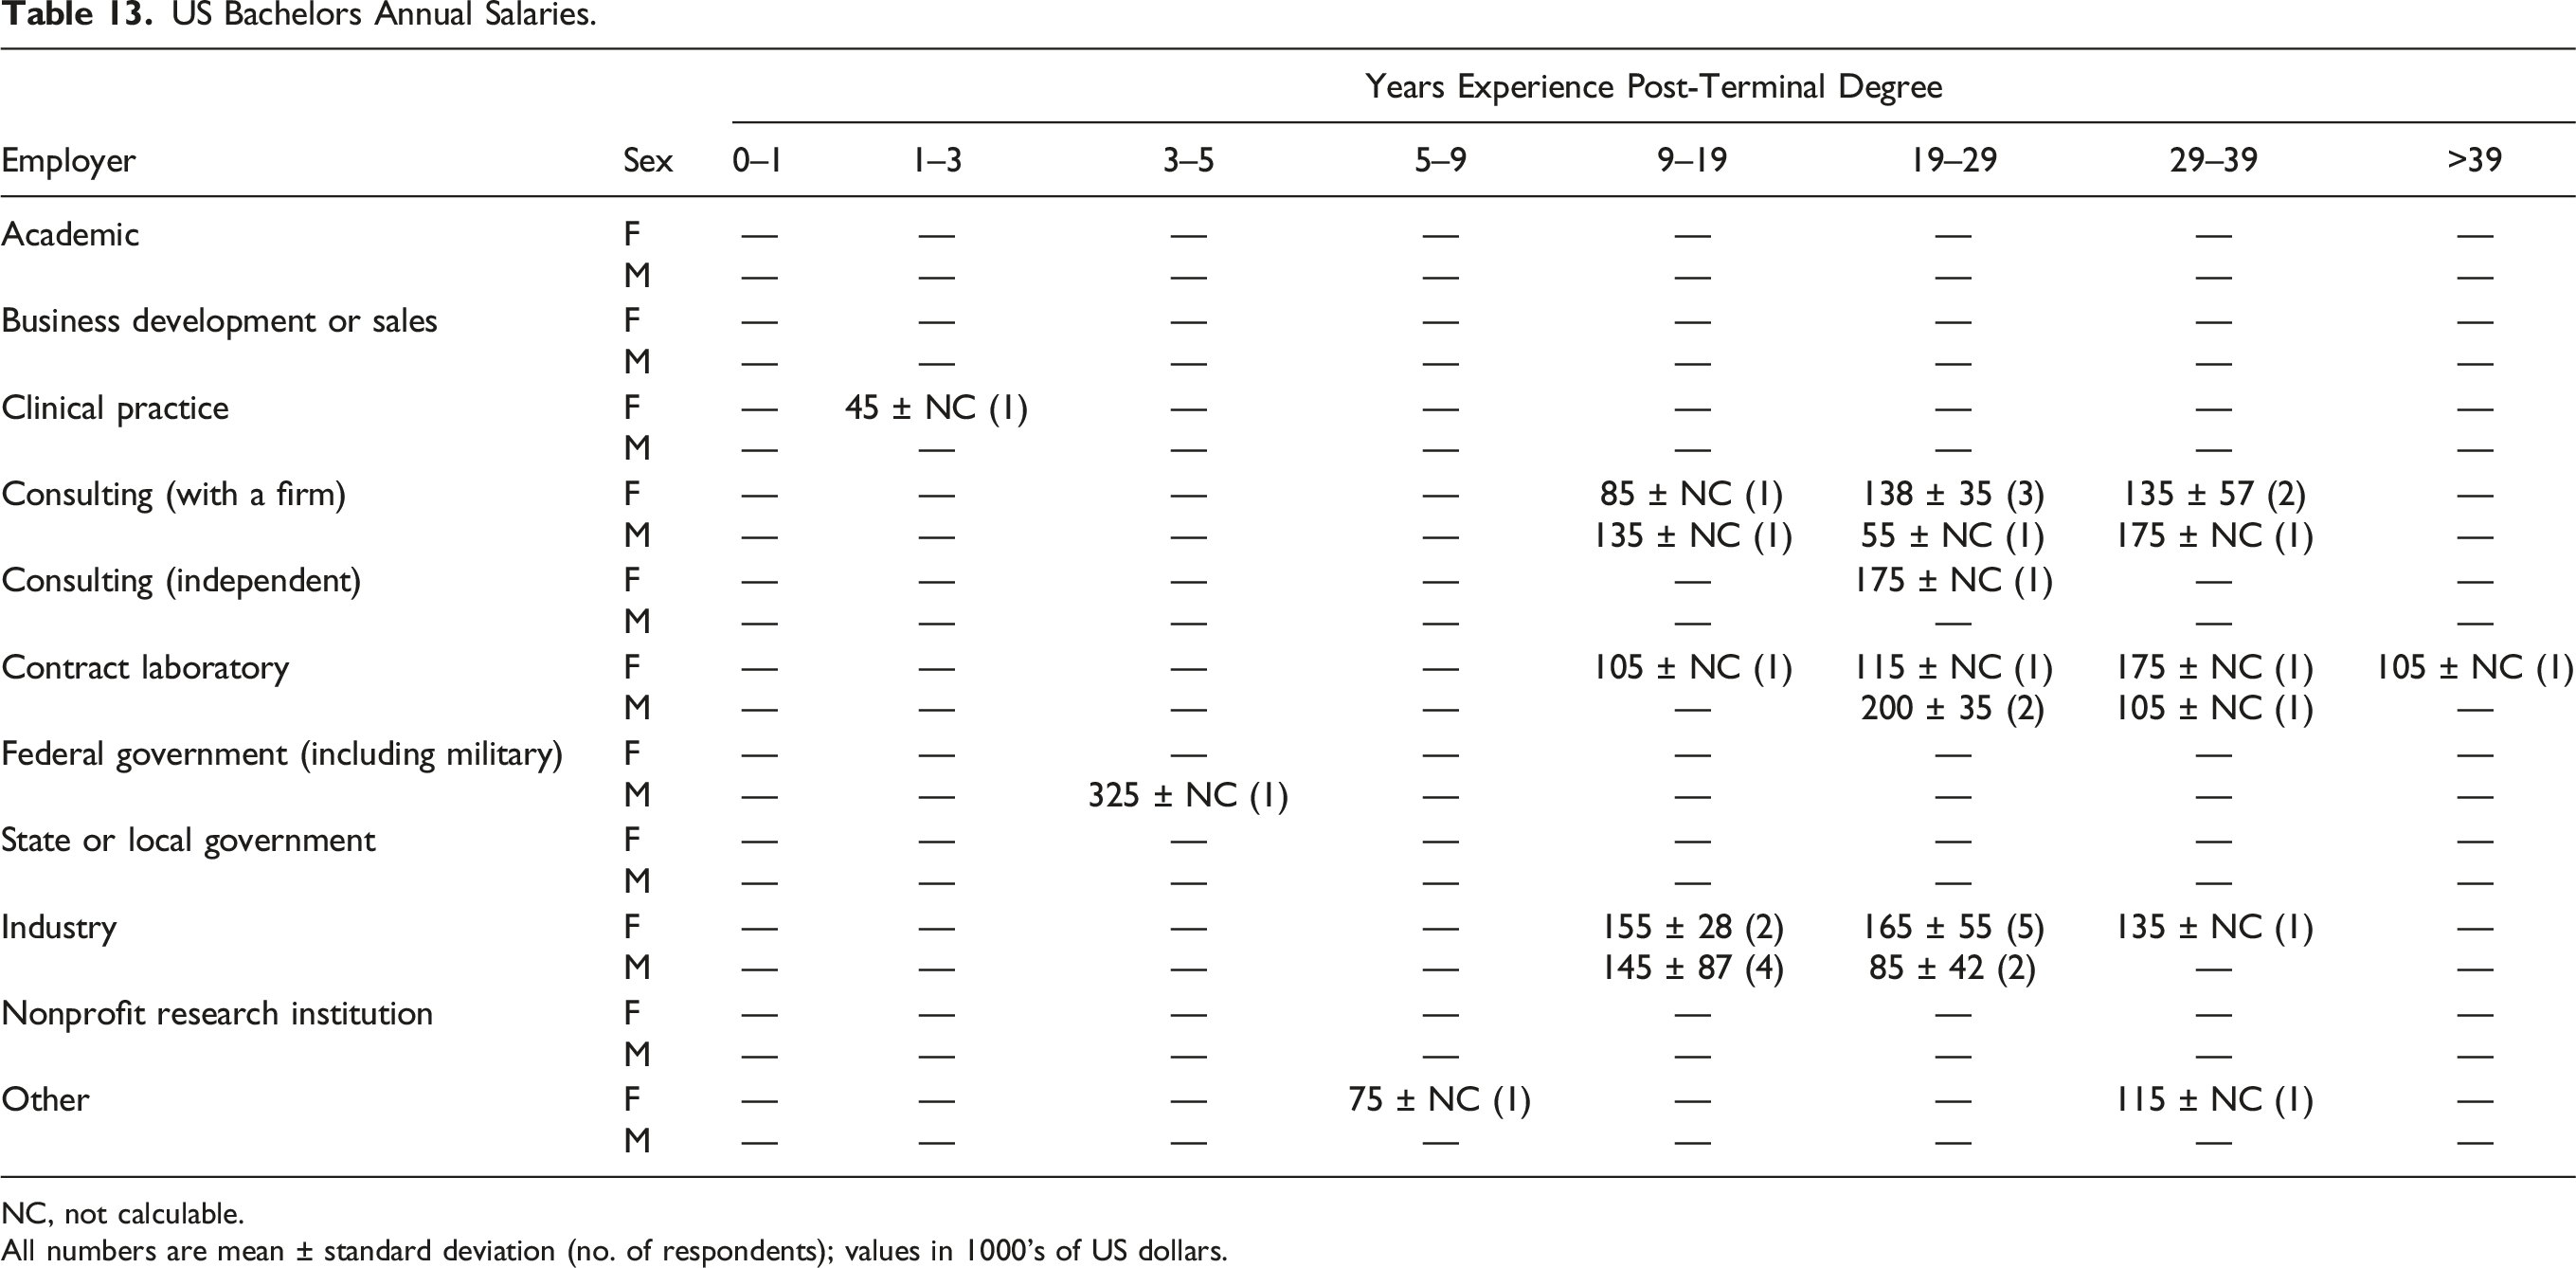
The mean salaries (±1 SD) for the 136 master’s level respondents from the U.S. are presented in Table 12. Likewise, the results from the 60 bachelor’s level respondents are presented in Table 13. The remaining respondents were not employed full-time during the reporting period (see Table 37 for detail) and are characterized as follows: graduate and postdoctoral students (4); working part-time (25); not specified (36); other (5).
All numbers are mean ± standard deviation (no. of respondents); values in 1000’s of US dollars.
aOther include prefer not to answer, non-binary, cis-gender, genderqueer and transmasculine.
US Bachelors Annual Salaries.
Employer
Sex
Years Experience Post-Terminal Degree
0–1
1–3
3–5
5–9
9–19
19–29
29–39
>39
Academic
F
—
—
—
—
—
—
—
—
M
—
—
—
—
—
—
—
—
Business development or sales
F
—
—
—
—
—
—
—
—
M
—
—
—
—
—
—
—
—
Clinical practice
F
—
45 ± NC (1)
—
—
—
—
—
—
M
—
—
—
—
—
—
—
—
Consulting (with a firm)
F
—
—
—
—
85 ± NC (1)
138 ± 35 (3)
135 ± 57 (2)
—
M
—
—
—
—
135 ± NC (1)
55 ± NC (1)
175 ± NC (1)
—
Consulting (independent)
F
—
—
—
—
—
175 ± NC (1)
—
—
M
—
—
—
—
—
—
—
—
Contract laboratory
F
—
—
—
—
105 ± NC (1)
115 ± NC (1)
175 ± NC (1)
105 ± NC (1)
M
—
—
—
—
—
200 ± 35 (2)
105 ± NC (1)
—
Federal government (including military)
F
—
—
—
—
—
—
—
—
M
—
—
325 ± NC (1)
—
—
—
—
—
State or local government
F
—
—
—
—
—
—
—
—
M
—
—
—
—
—
—
—
—
Industry
F
—
—
—
—
155 ± 28 (2)
165 ± 55 (5)
135 ± NC (1)
—
M
—
—
—
—
145 ± 87 (4)
85 ± 42 (2)
—
—
Nonprofit research institution
F
—
—
—
—
—
—
—
—
M
—
—
—
—
—
—
—
—
Other
F
—
—
—
75 ± NC (1)
—
—
115 ± NC (1)
—
M
—
—
—
—
—
—
—
—
NC, not calculable.
All numbers are mean ± standard deviation (no. of respondents); values in 1000’s of US dollars.
There were no associates degree respondents. This is worrisome but is potentially a reflection of those most likely to receive and participate in this survey, rather than an accurate representation of employment in this industry as a whole.
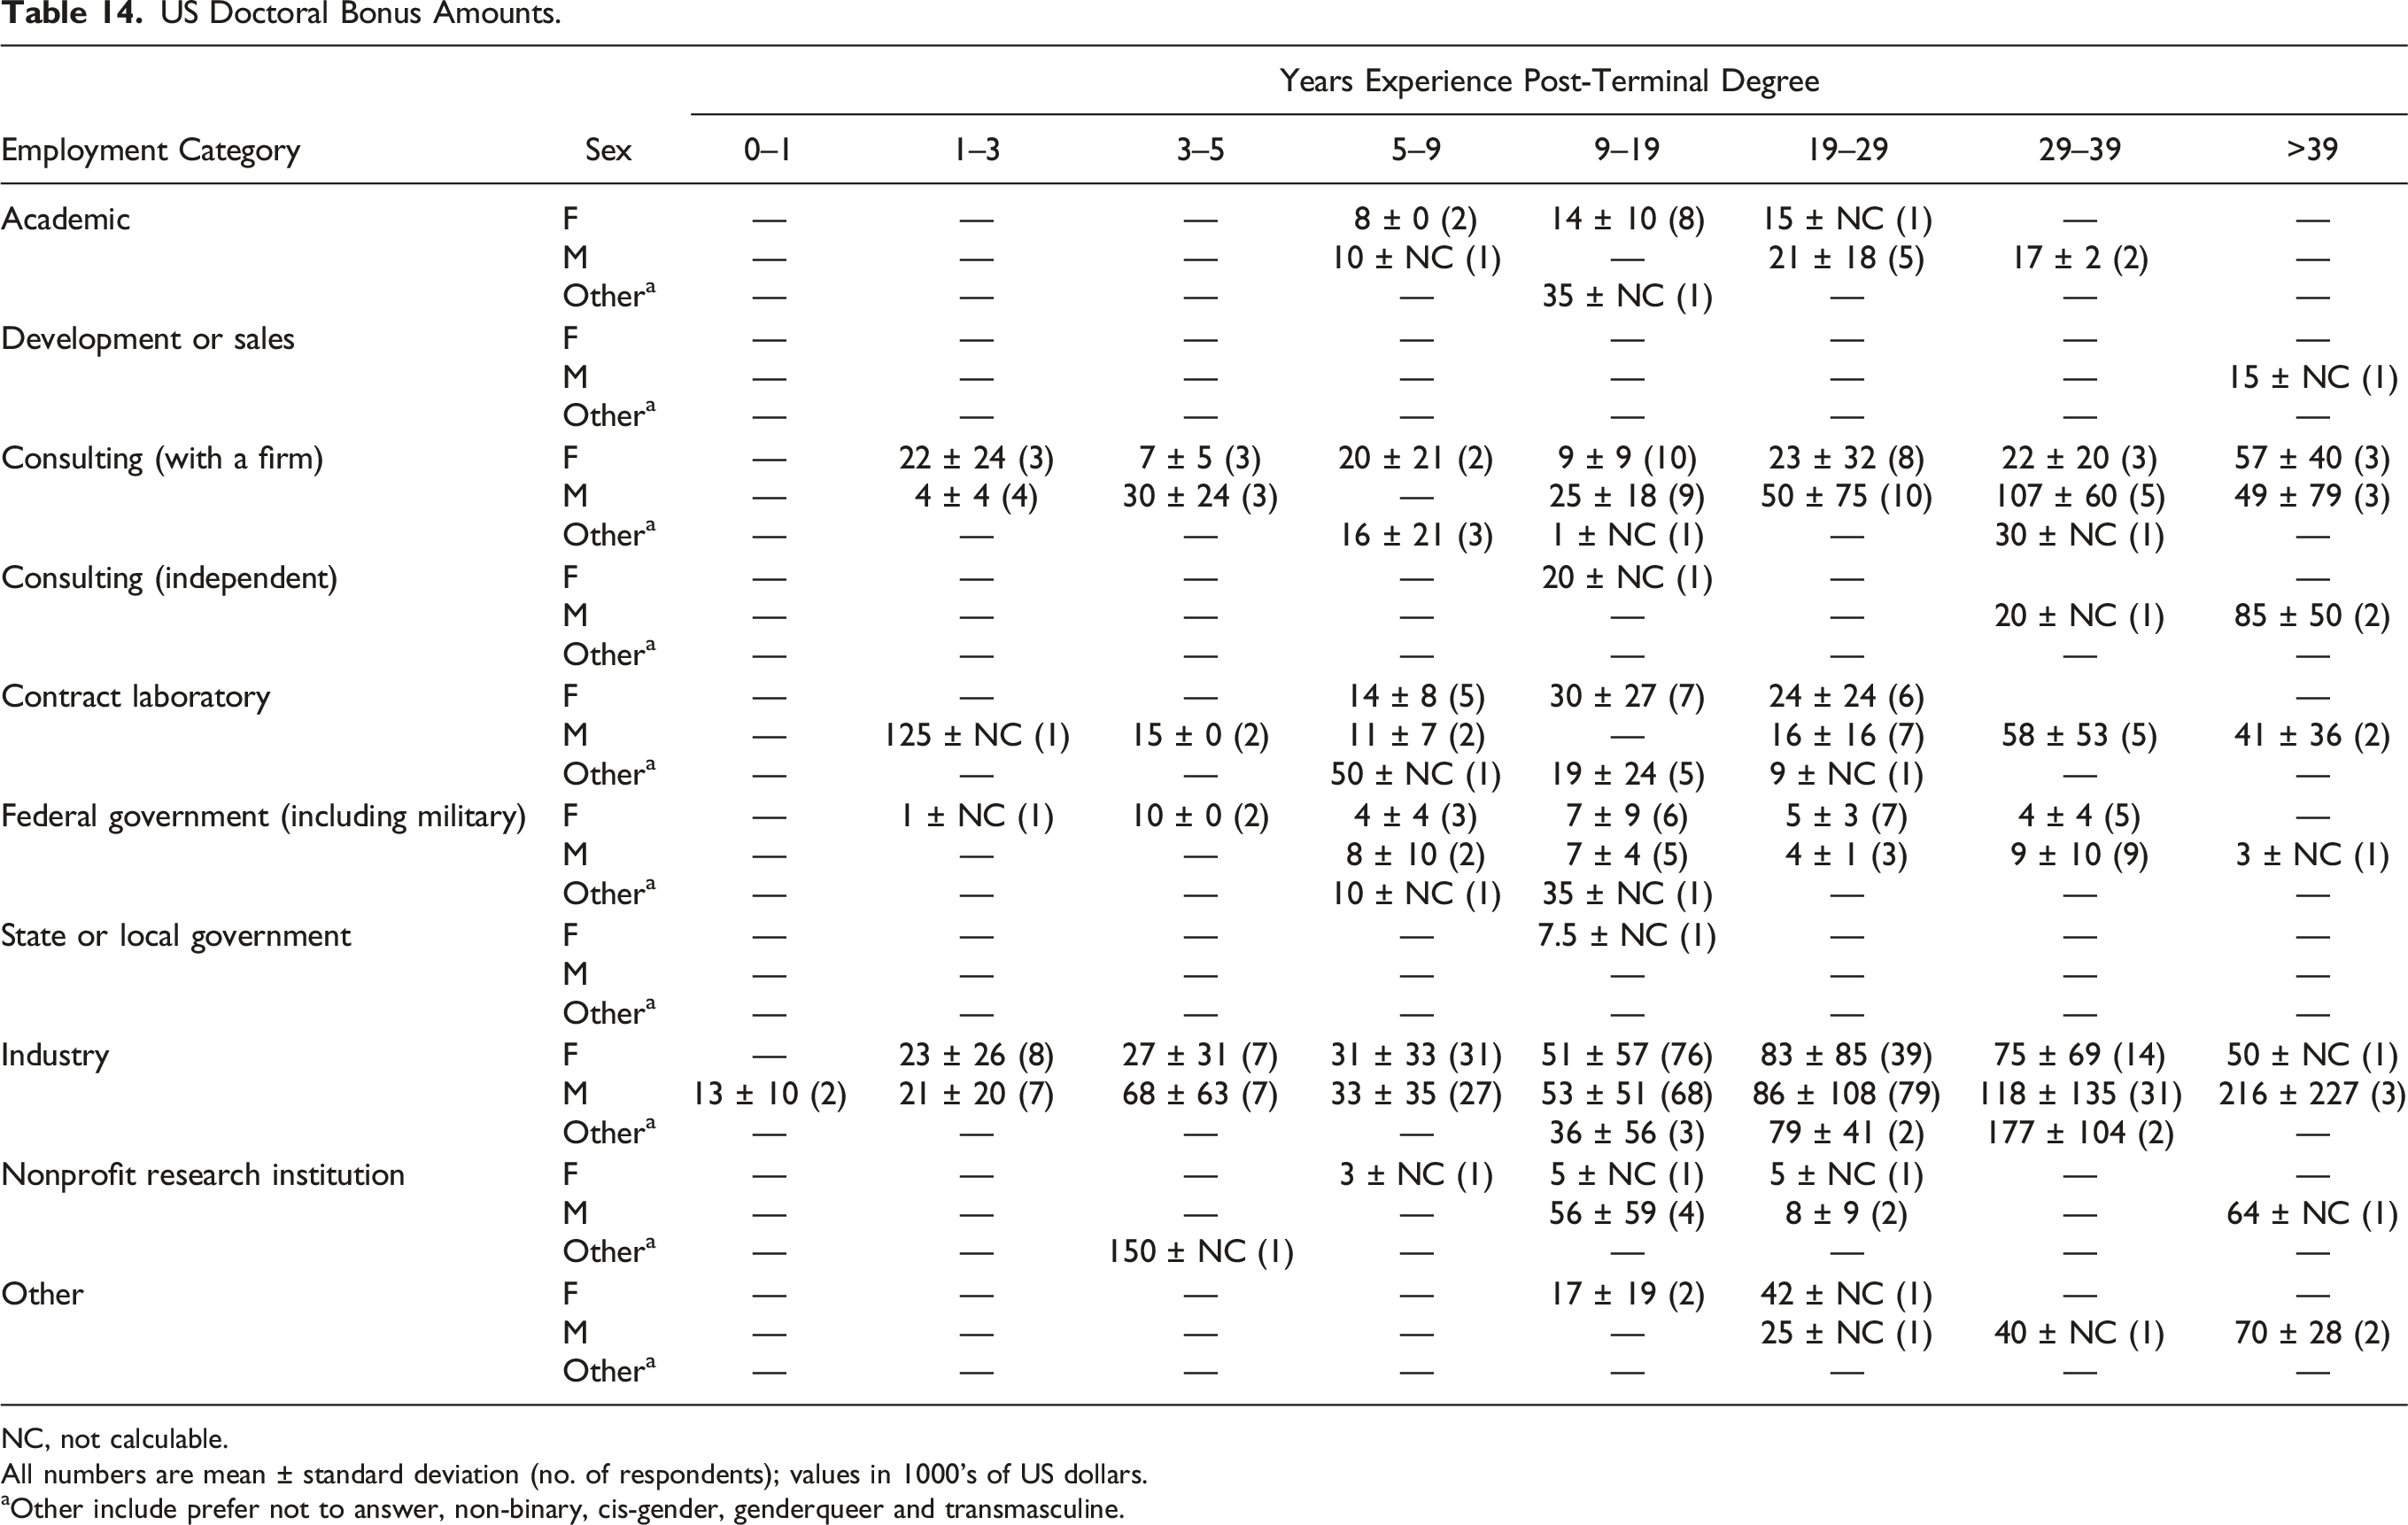
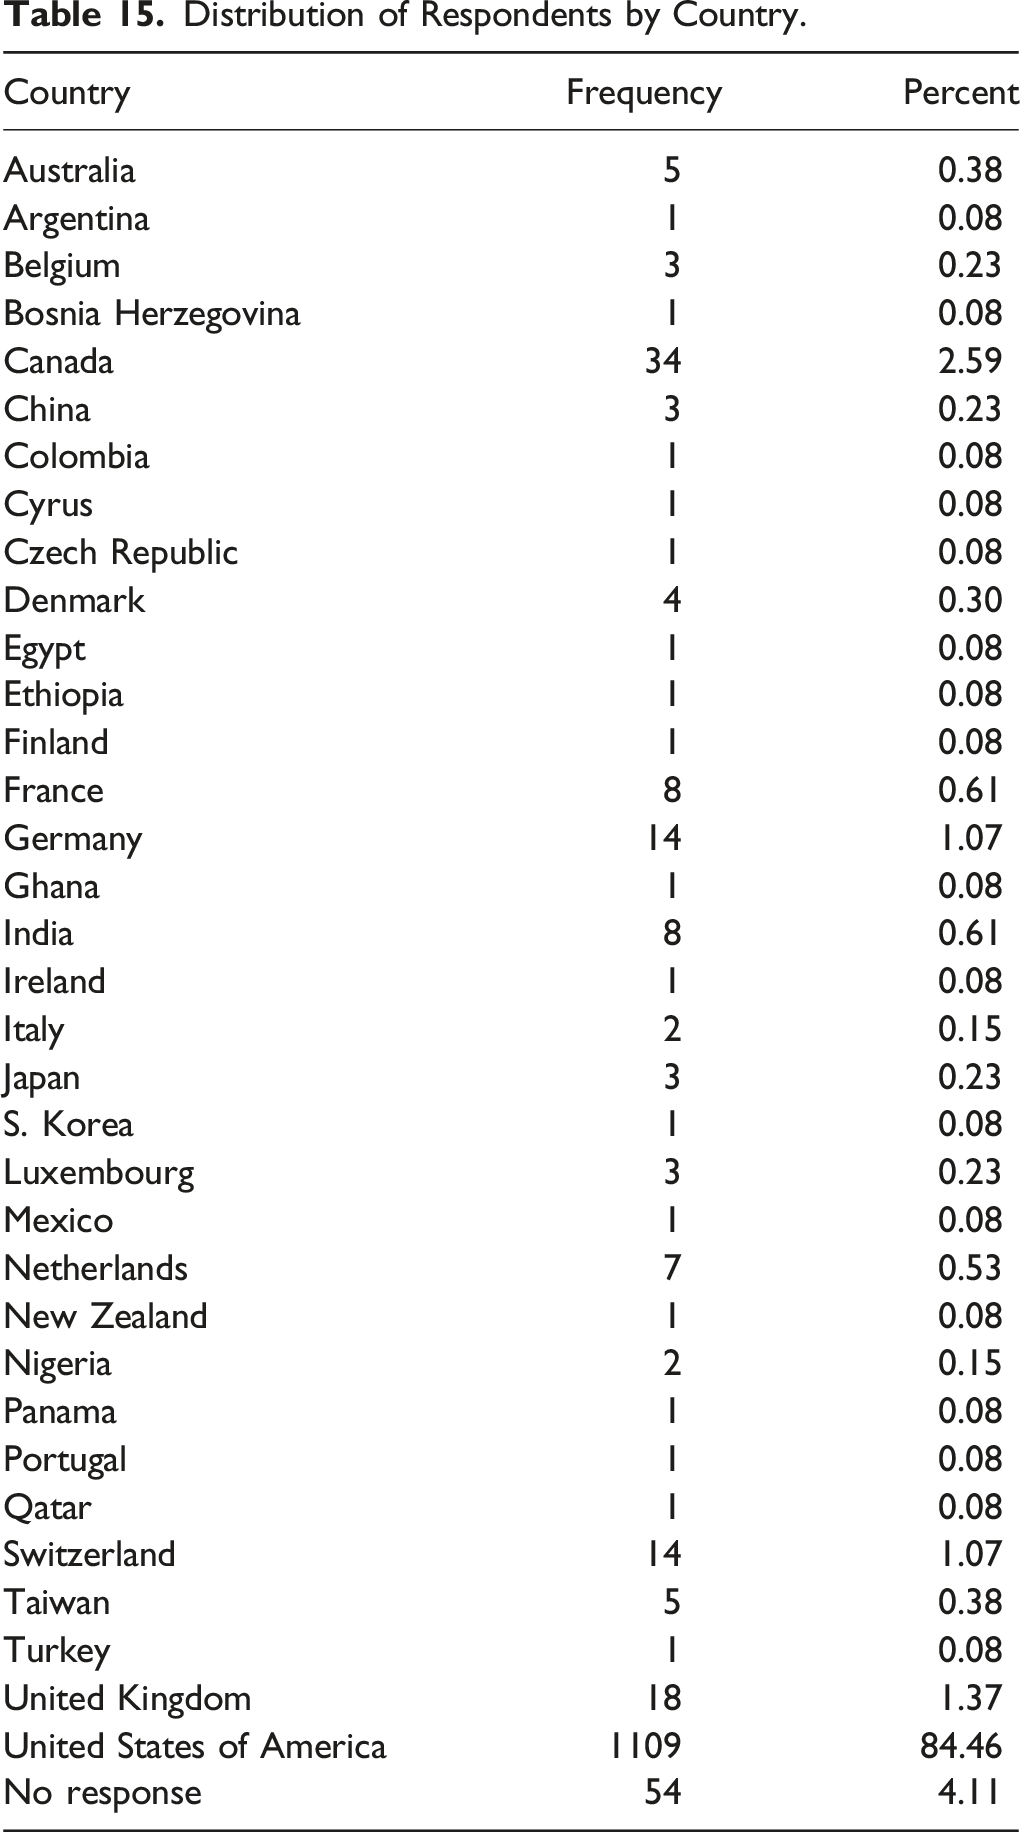
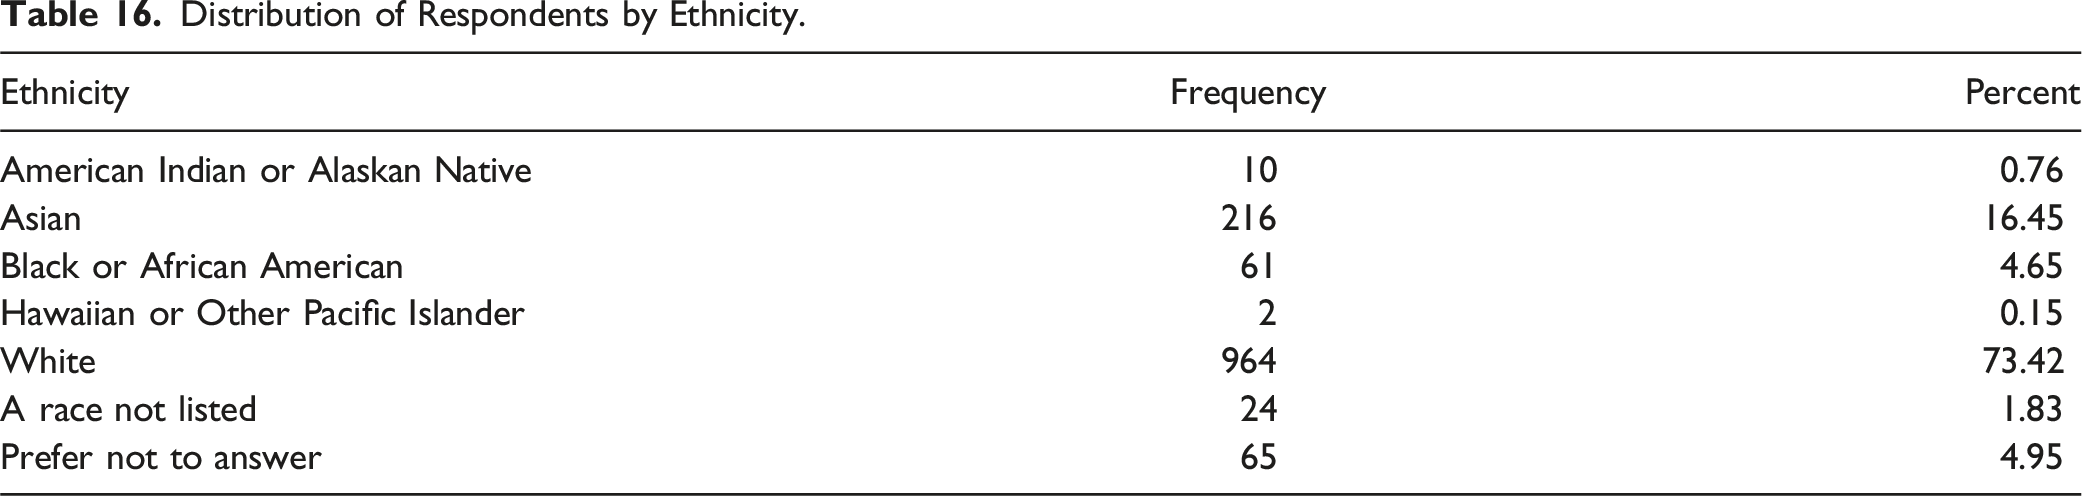
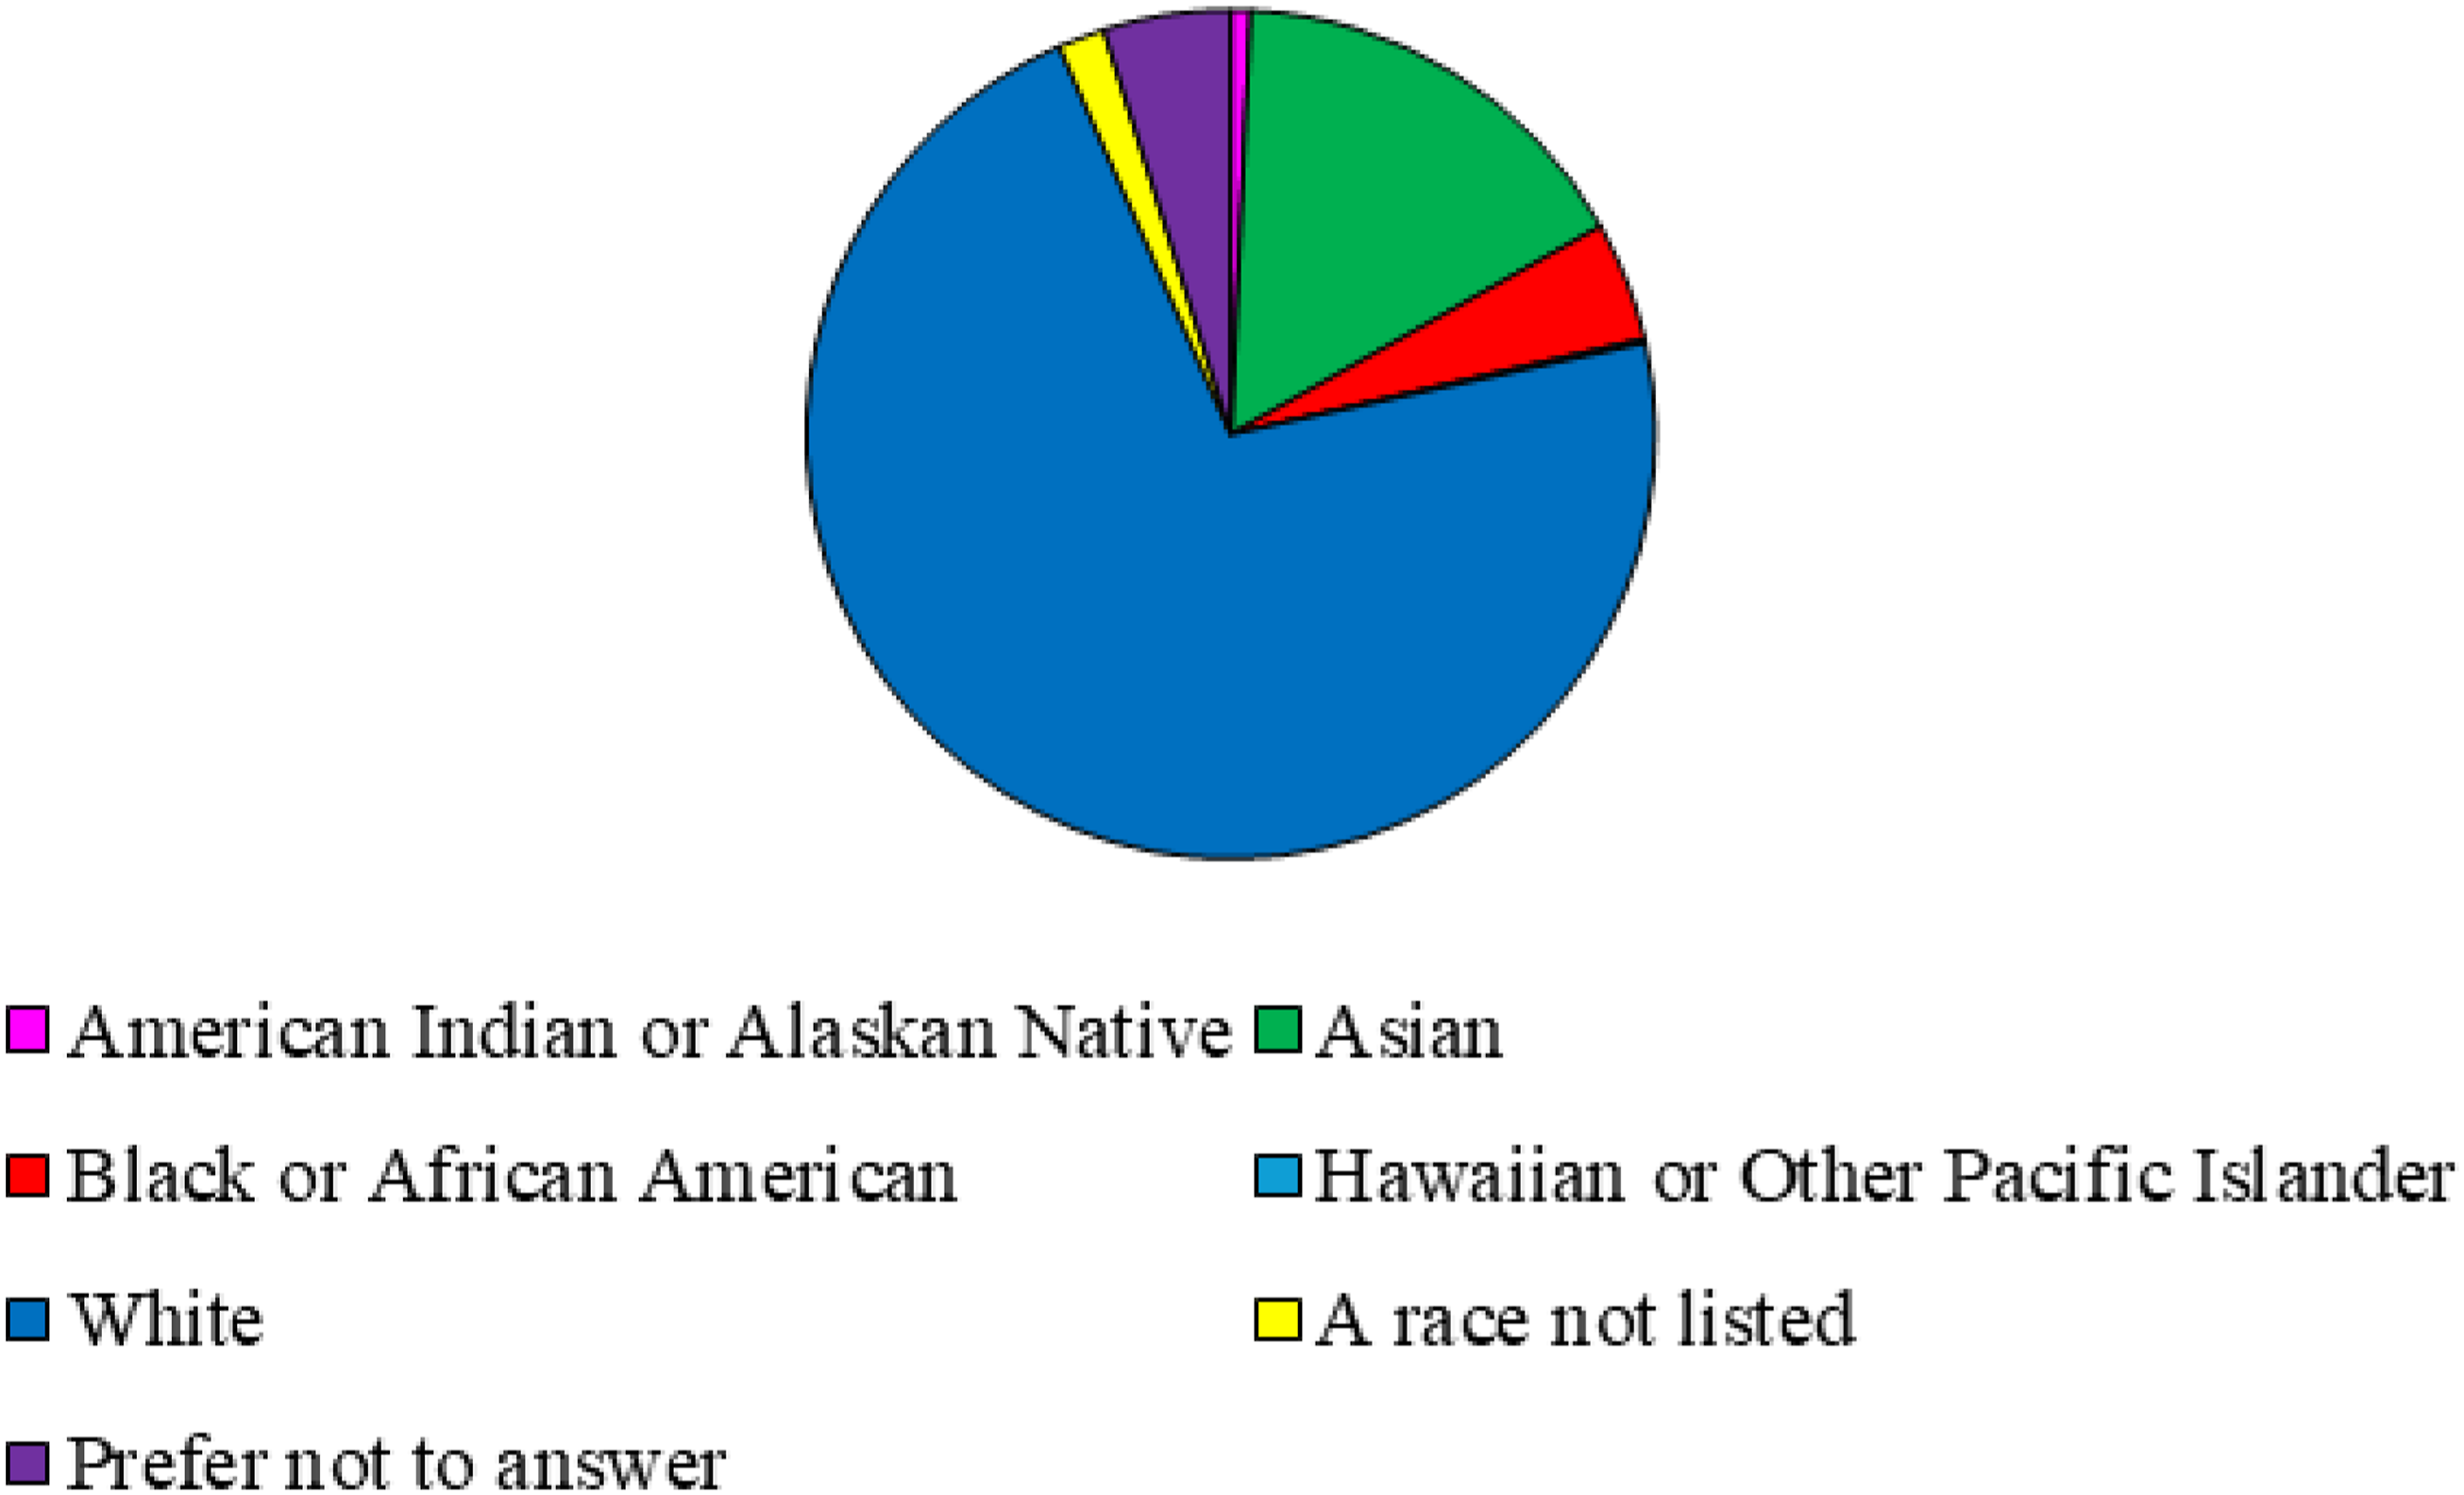
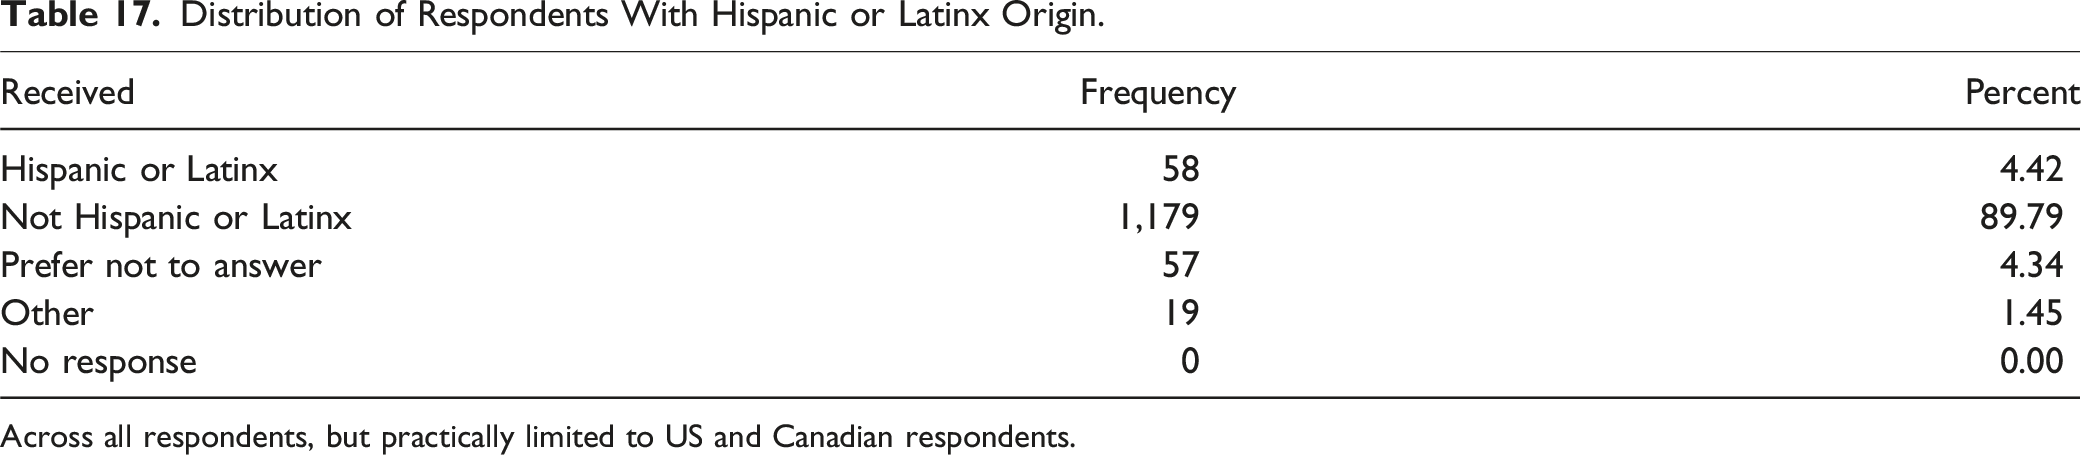
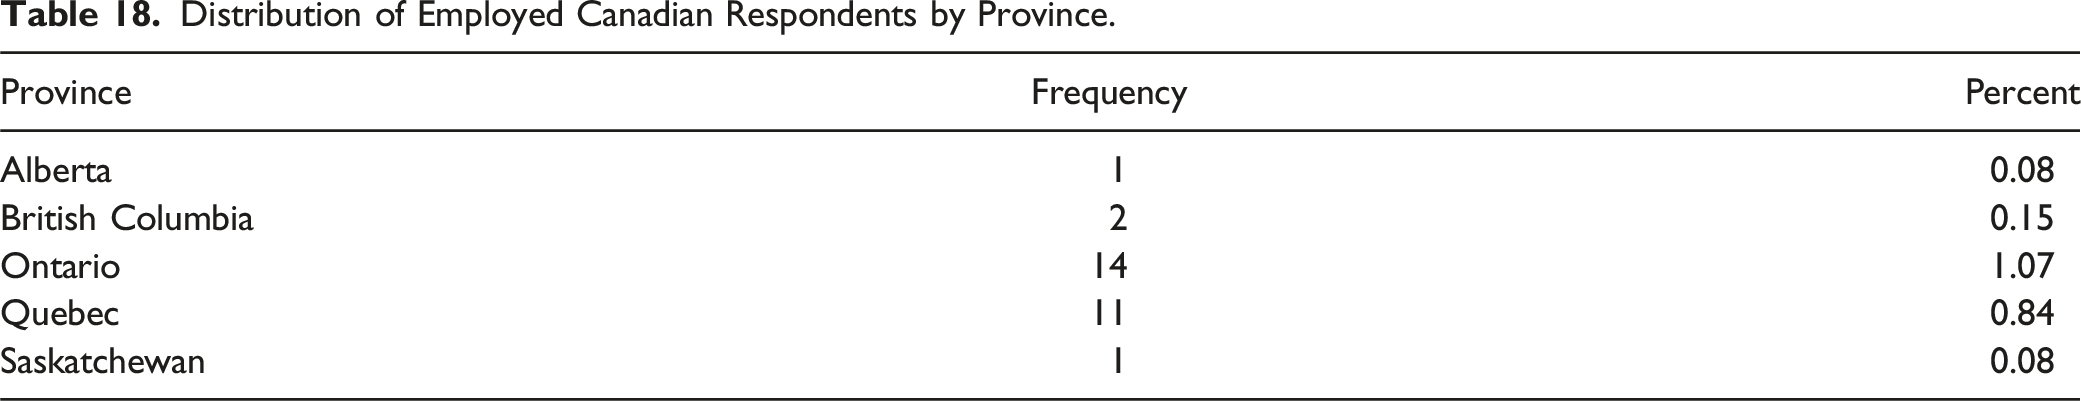
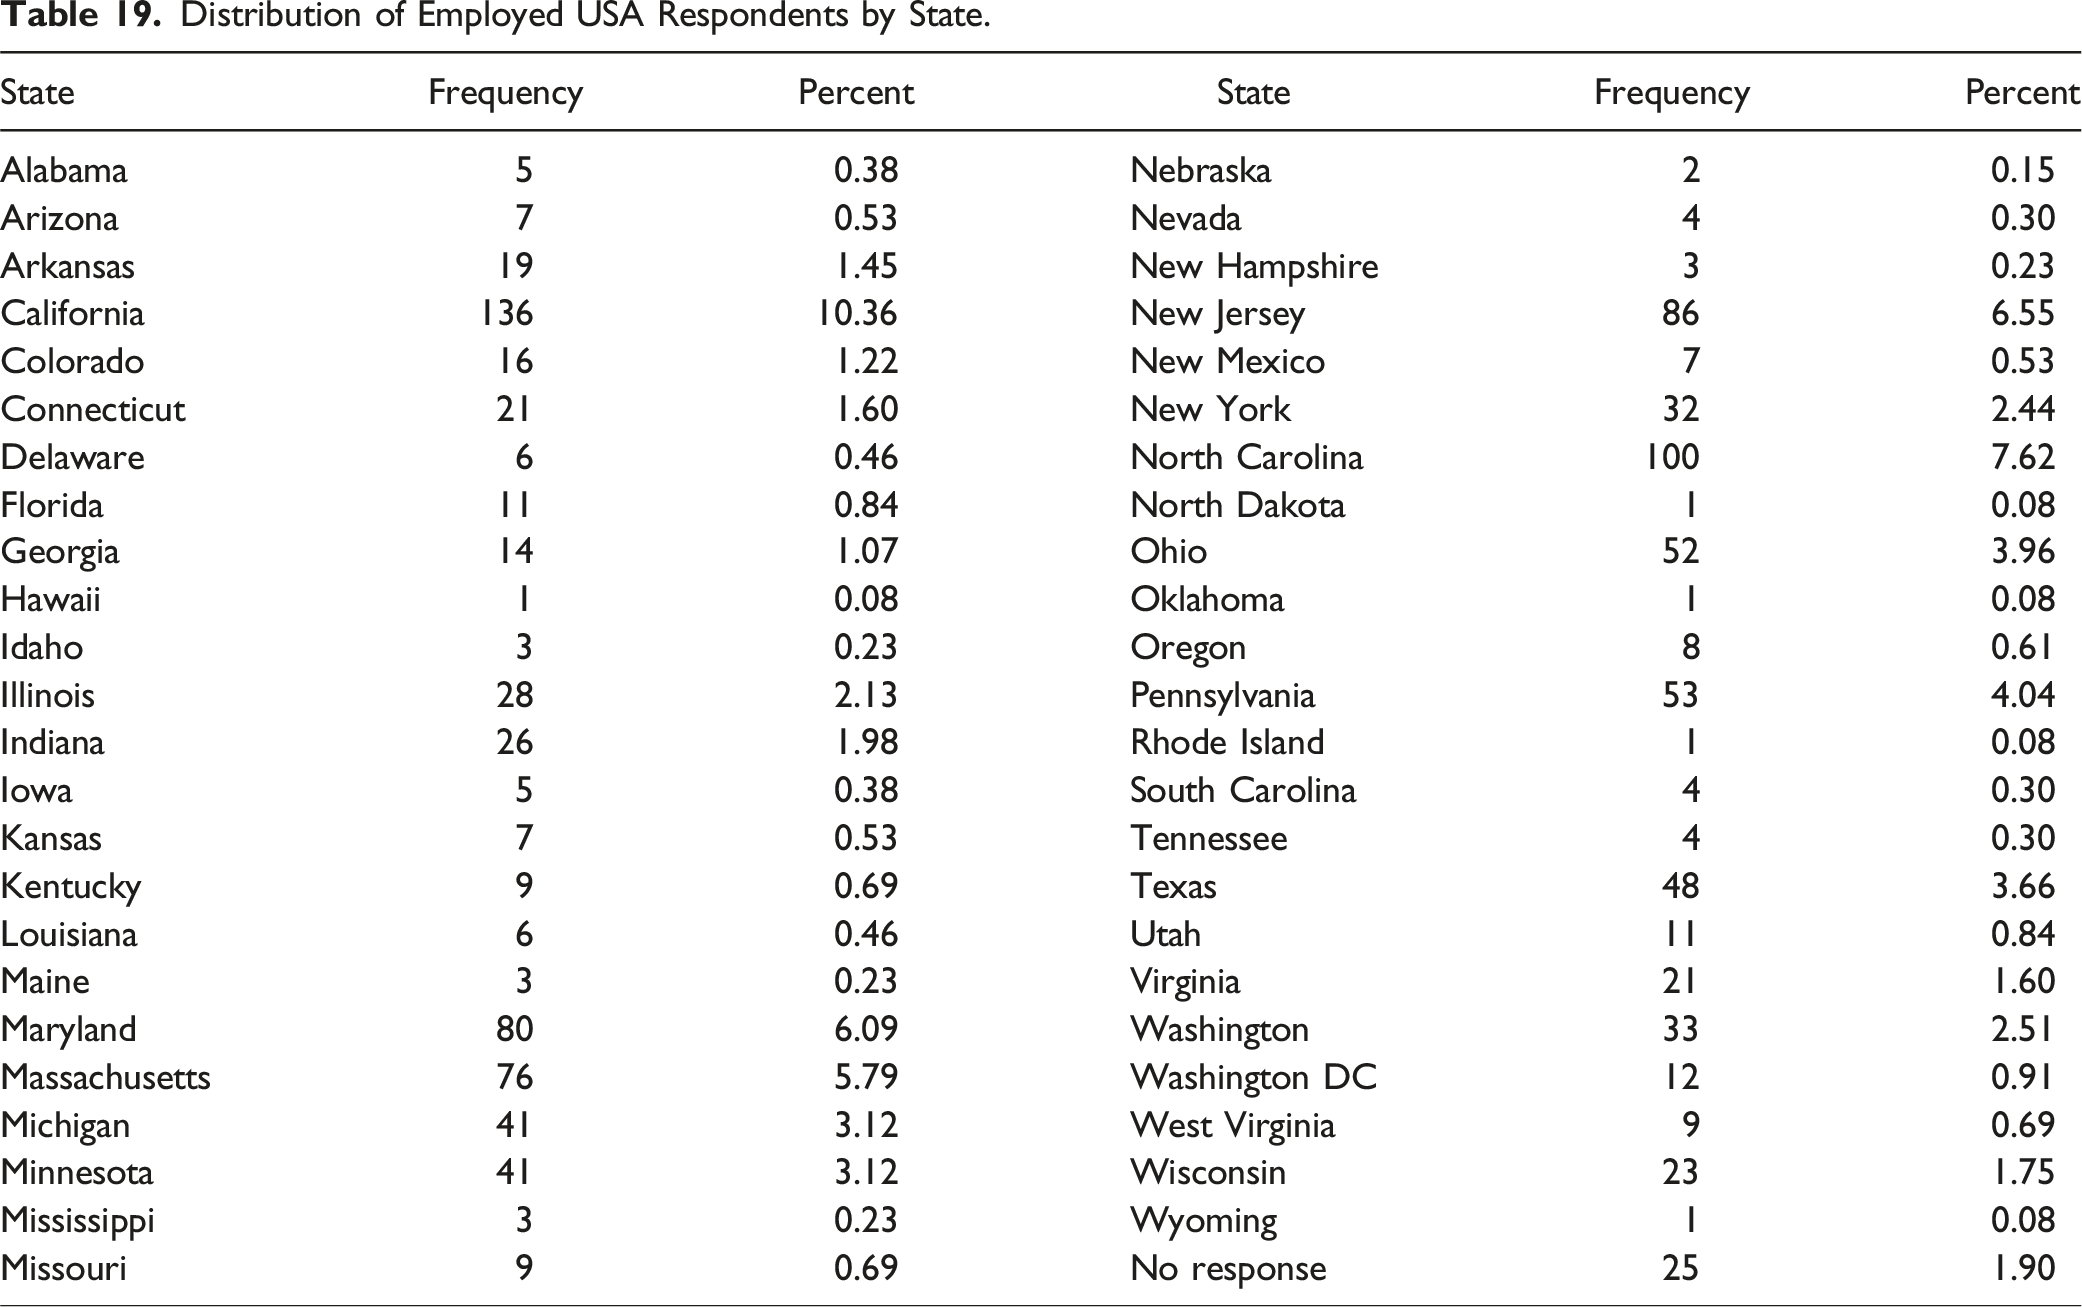
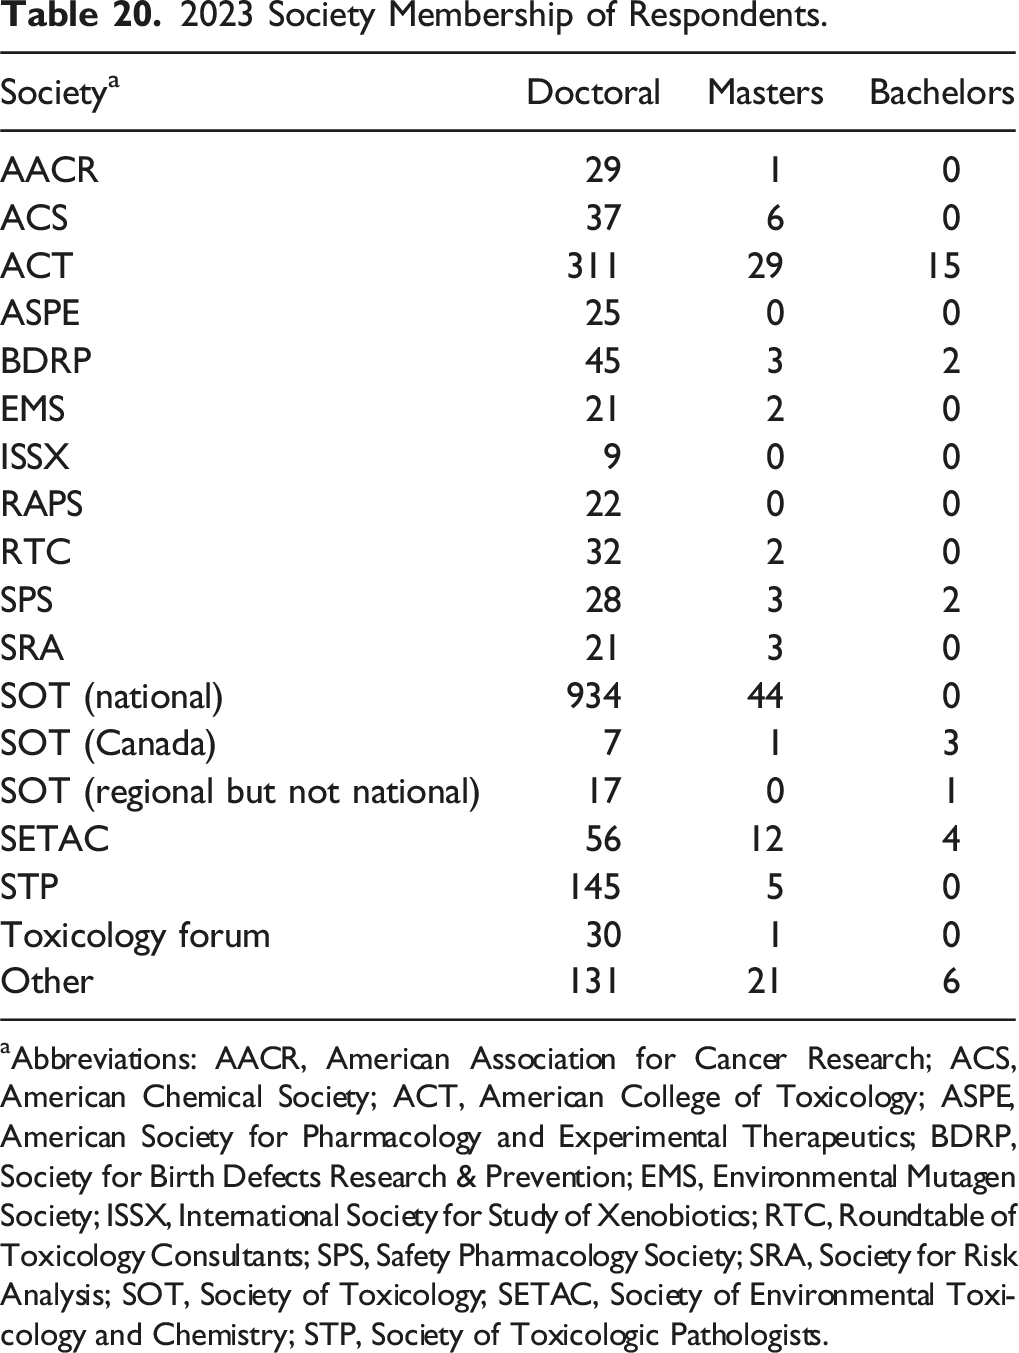
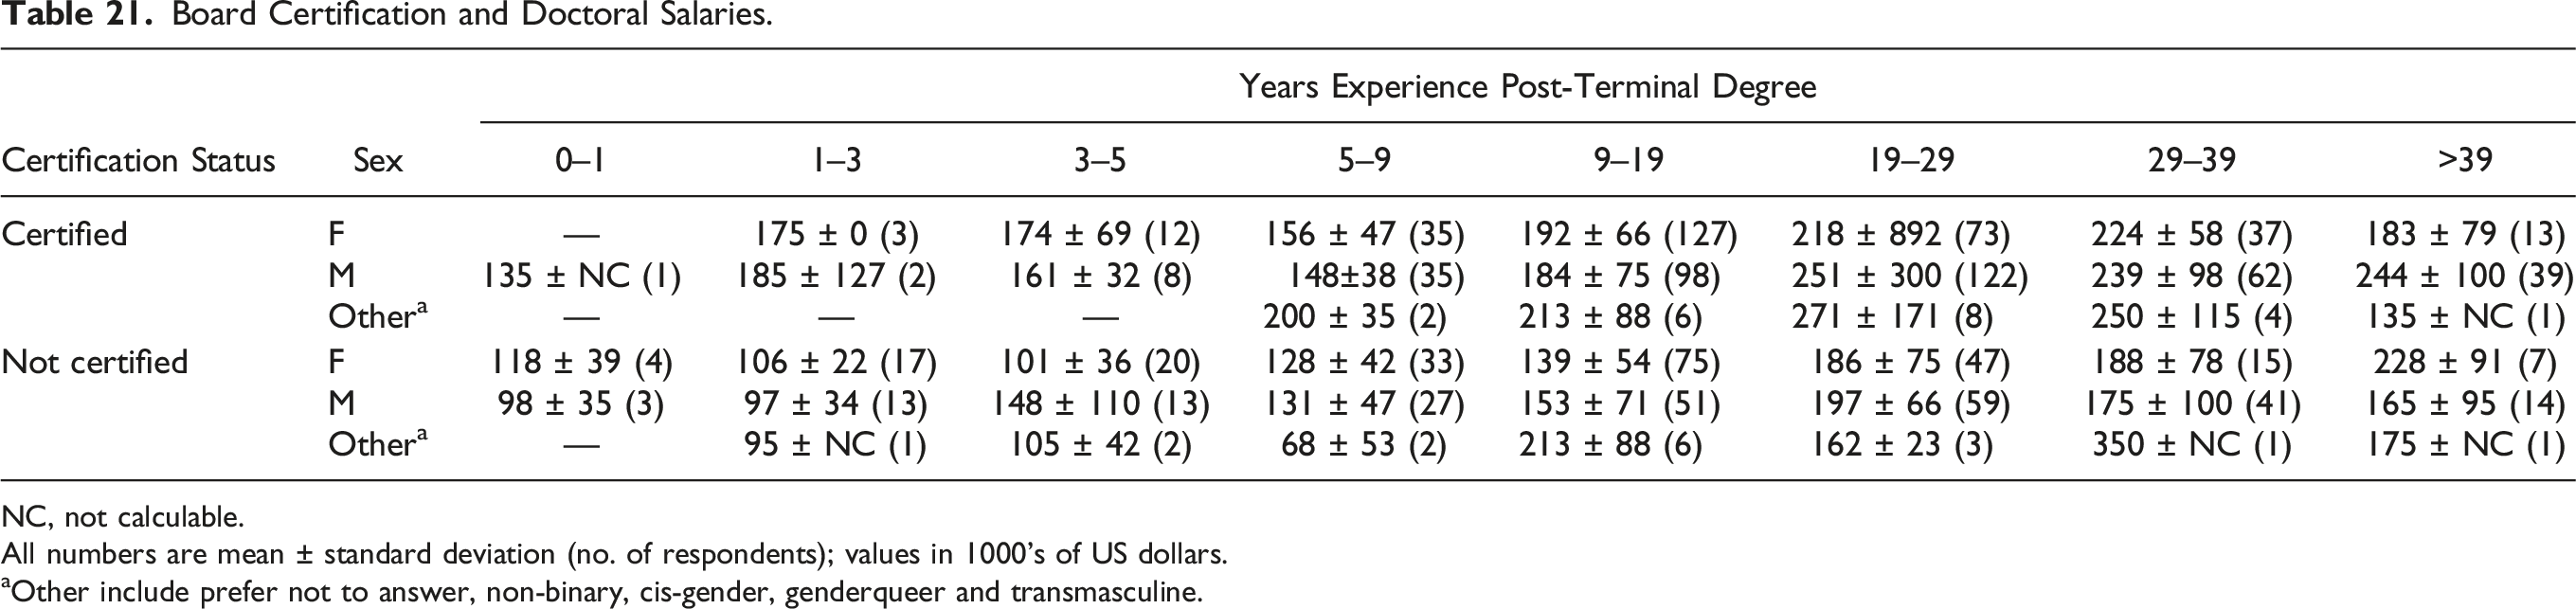
Table 14 presents a summary of data on those 542 (50.8% of all employed) doctoral recipients who received bonuses in addition to salary. Table 15 presents summaries of the geographic distributions of the survey respondents by country. Table 16 presents a summary by ethnicity and is graphically displayed in Figure 2. Table 17 of these reporting Hispanic or Latinx origin. Table 18 summarizes by province for Canadian responders. Table 19 presents a summary of distribution by state of employed U.S. responders. Table 20 summarizes the major professional society memberships of the respondents. Many respondents belong to more than one society. Table 21 provides a summary of the influence of certification on doctoral level salaries.
aAbbreviations: AACR, American Association for Cancer Research; ACS, American Chemical Society; ACT, American College of Toxicology; ASPE, American Society for Pharmacology and Experimental Therapeutics; BDRP, Society for Birth Defects Research & Prevention; EMS, Environmental Mutagen Society; ISSX, International Society for Study of Xenobiotics; RTC, Roundtable of Toxicology Consultants; SPS, Safety Pharmacology Society; SRA, Society for Risk Analysis; SOT, Society of Toxicology; SETAC, Society of Environmental Toxicology and Chemistry; STP, Society of Toxicologic Pathologists.
All numbers are mean ± standard deviation (no. of respondents); values in 1000’s of US dollars.
aOther include prefer not to answer, non-binary, cis-gender, genderqueer and transmasculine.
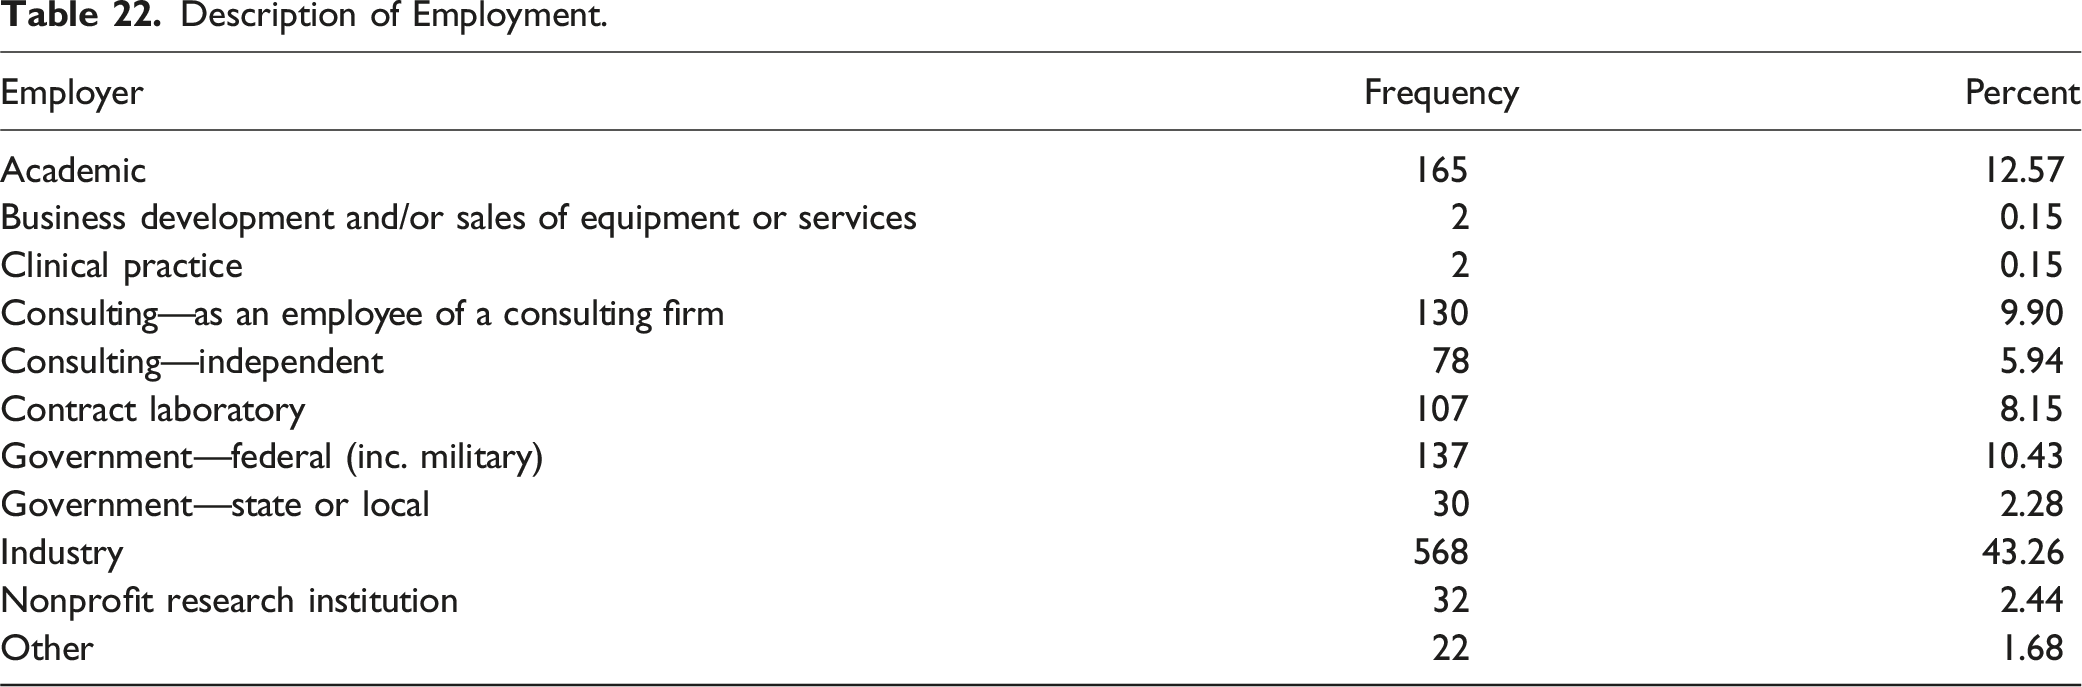
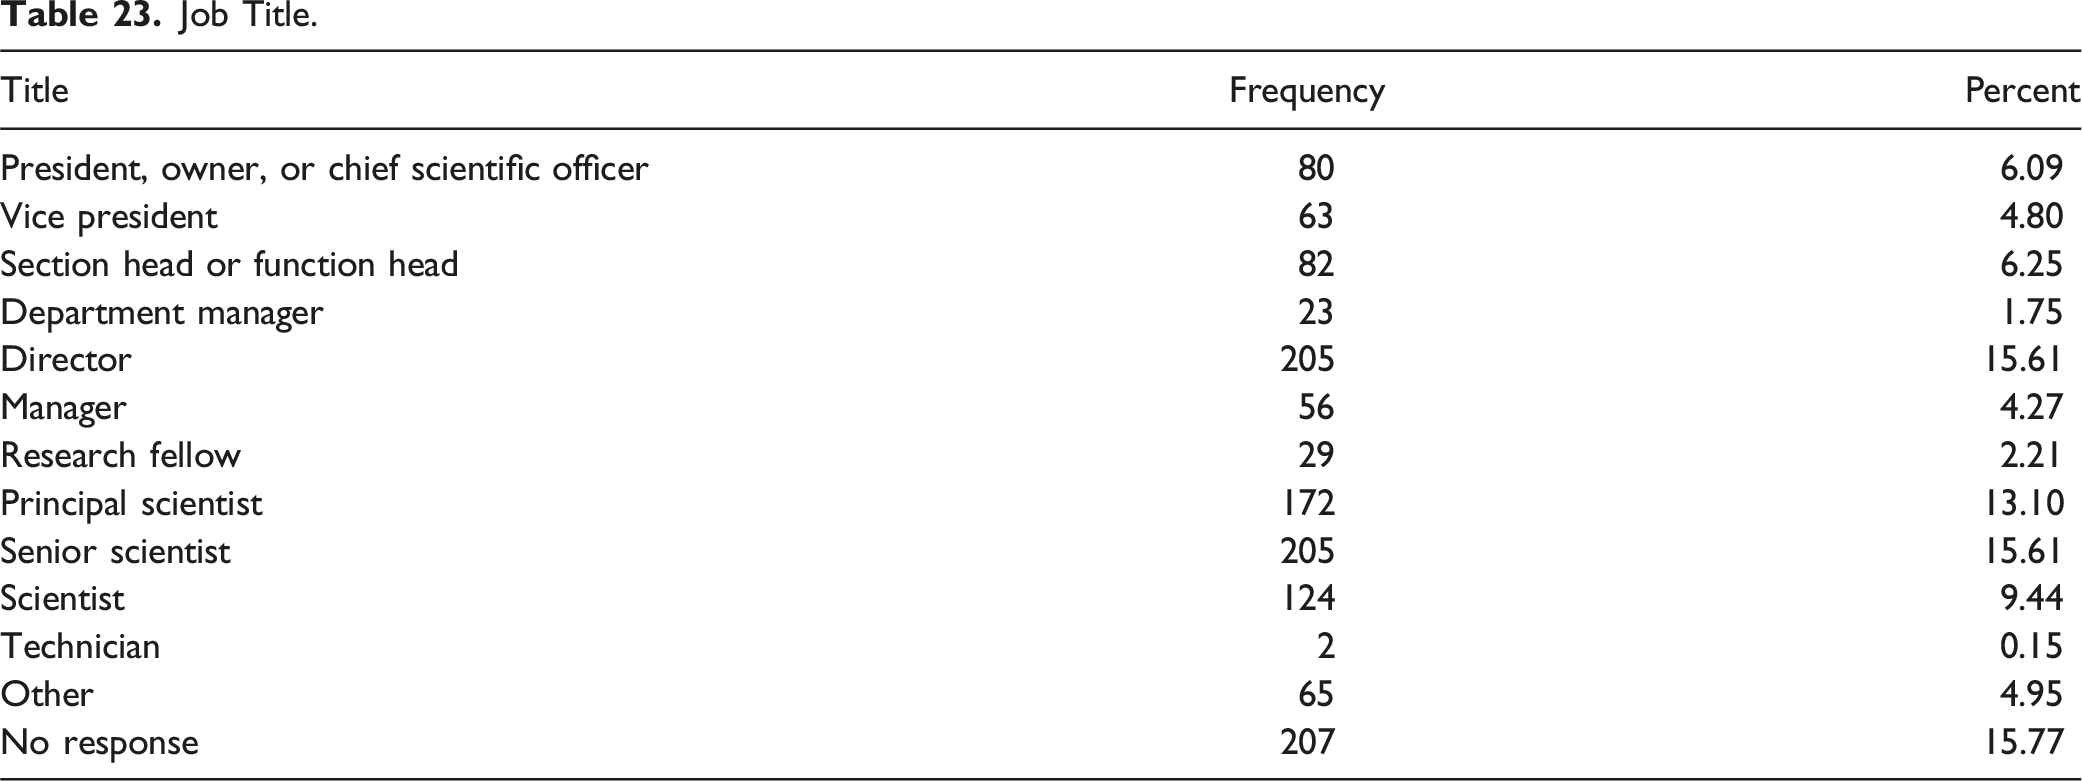
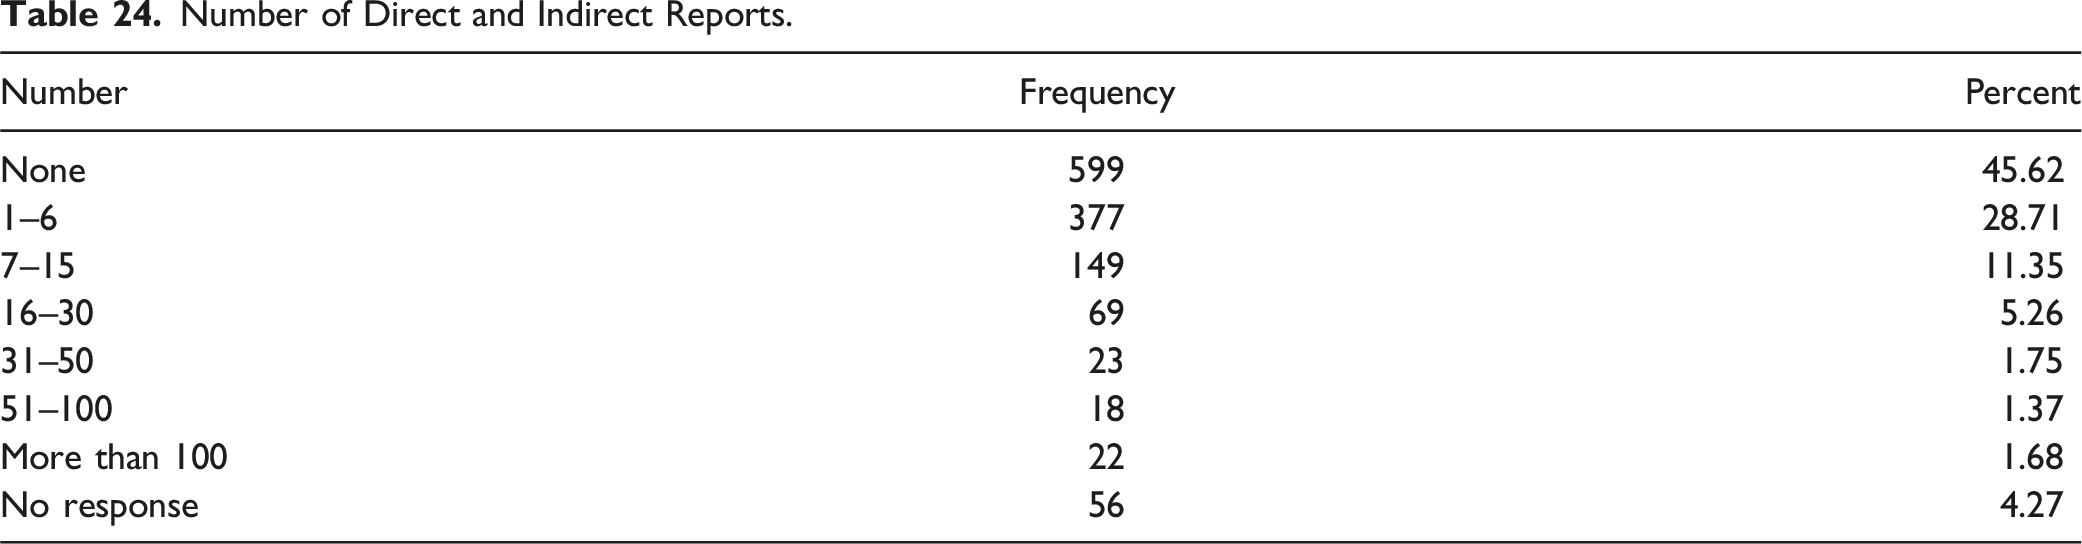
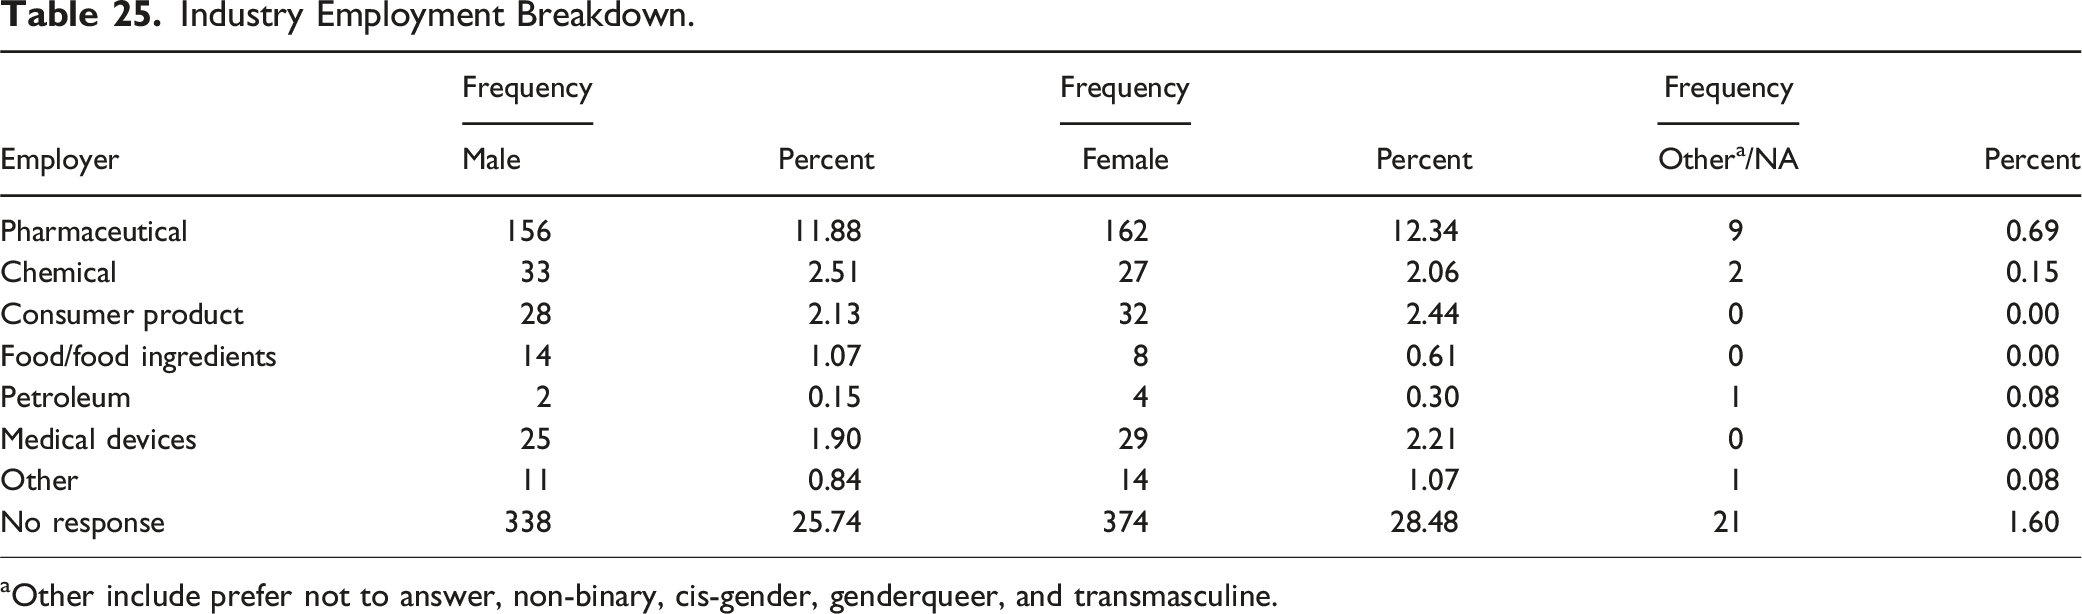
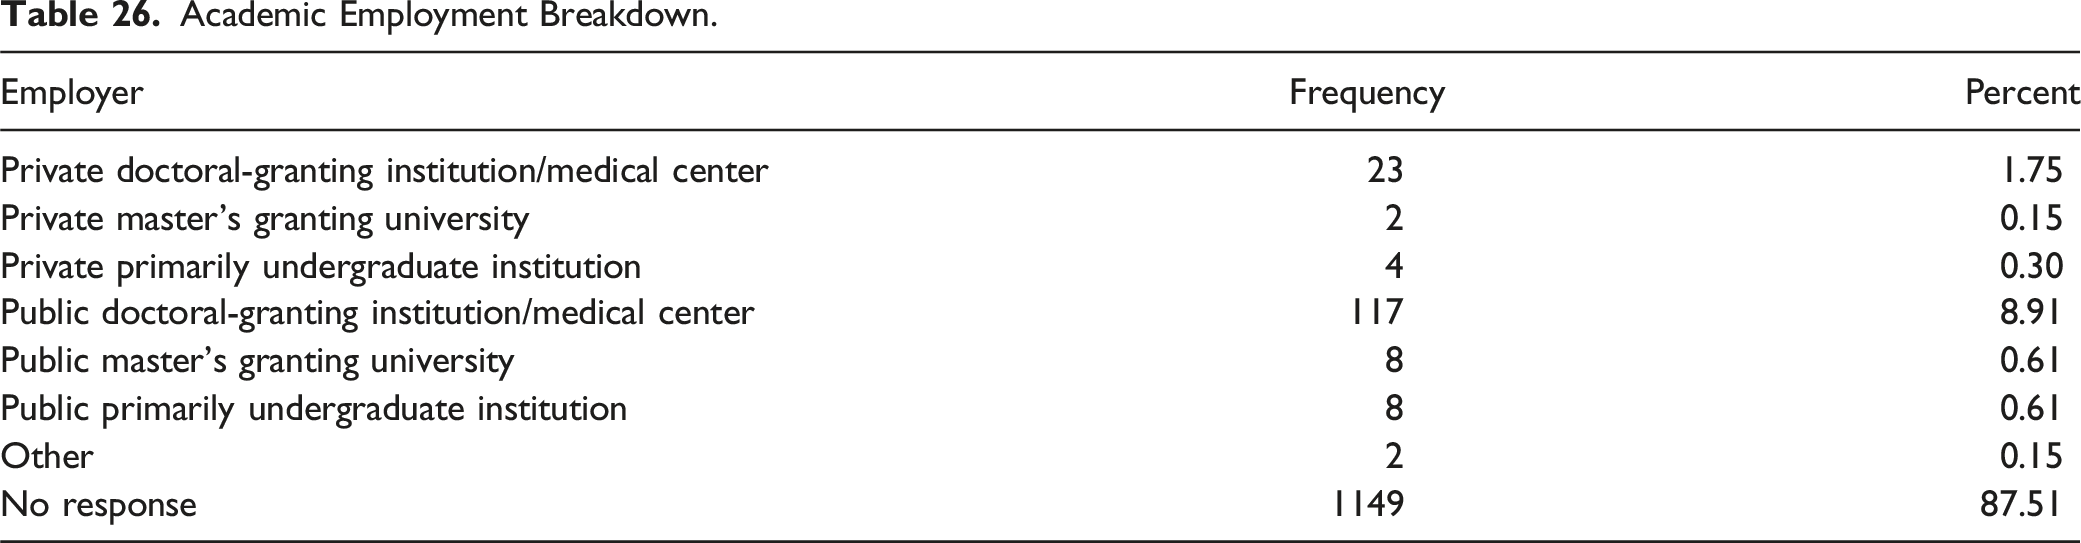
Table 22 presents a breakdown of respondents’ sector of employment. Table 23 presents responders self-reported job titles, Table 24 respondents’ numbers of direct reports. Table 25 breaks down employment by industry, while Table 26 by nature of academic institution for those working in academia. Each of these factors influences compensation levels, and the data were collected, but analysis of the influence of these factors is beyond the scope of this manuscript.
Description of Employment.
Employer
Frequency
Percent
Academic
165
12.57
Business development and/or sales of equipment or services
aOther include prefer not to answer, non-binary, cis-gender, genderqueer, and transmasculine.
Academic Employment Breakdown.
Employer
Frequency
Percent
Private doctoral-granting institution/medical center
23
1.75
Private master’s granting university
2
0.15
Private primarily undergraduate institution
4
0.30
Public doctoral-granting institution/medical center
117
8.91
Public master’s granting university
8
0.61
Public primarily undergraduate institution
8
0.61
Other
2
0.15
No response
1149
87.51
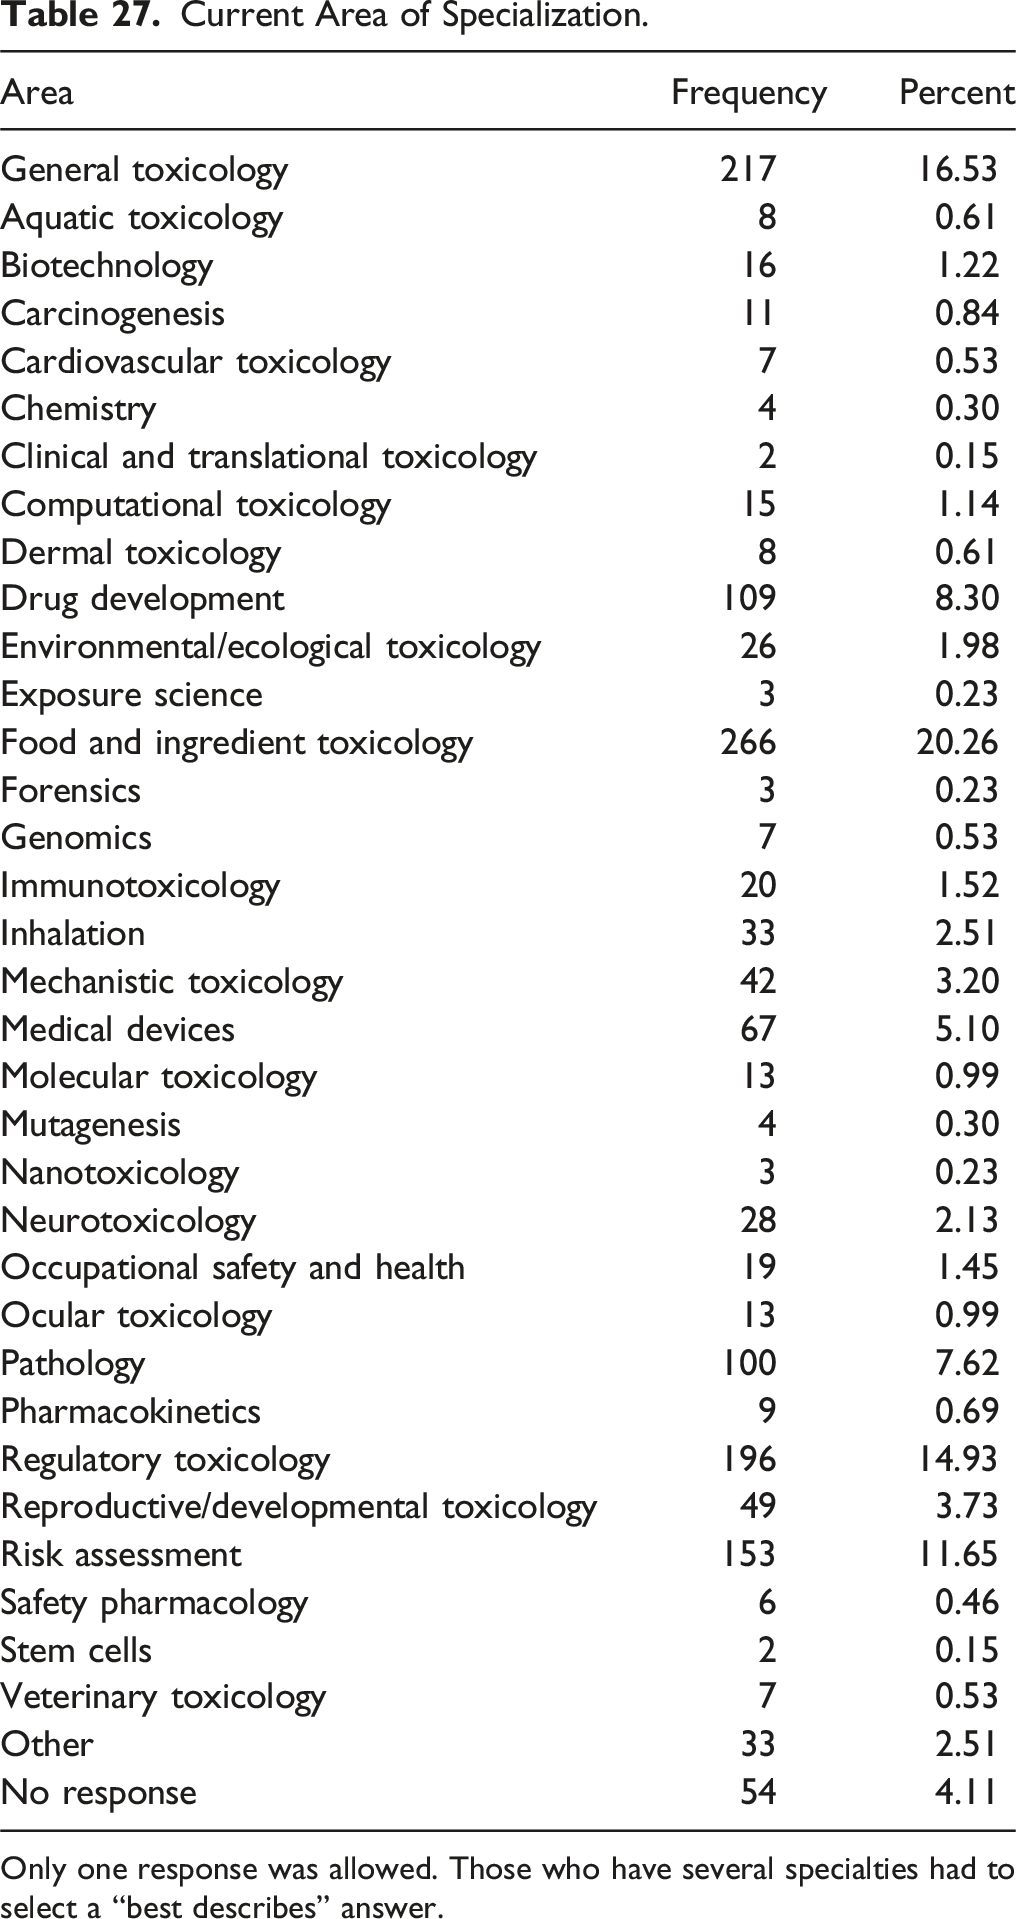
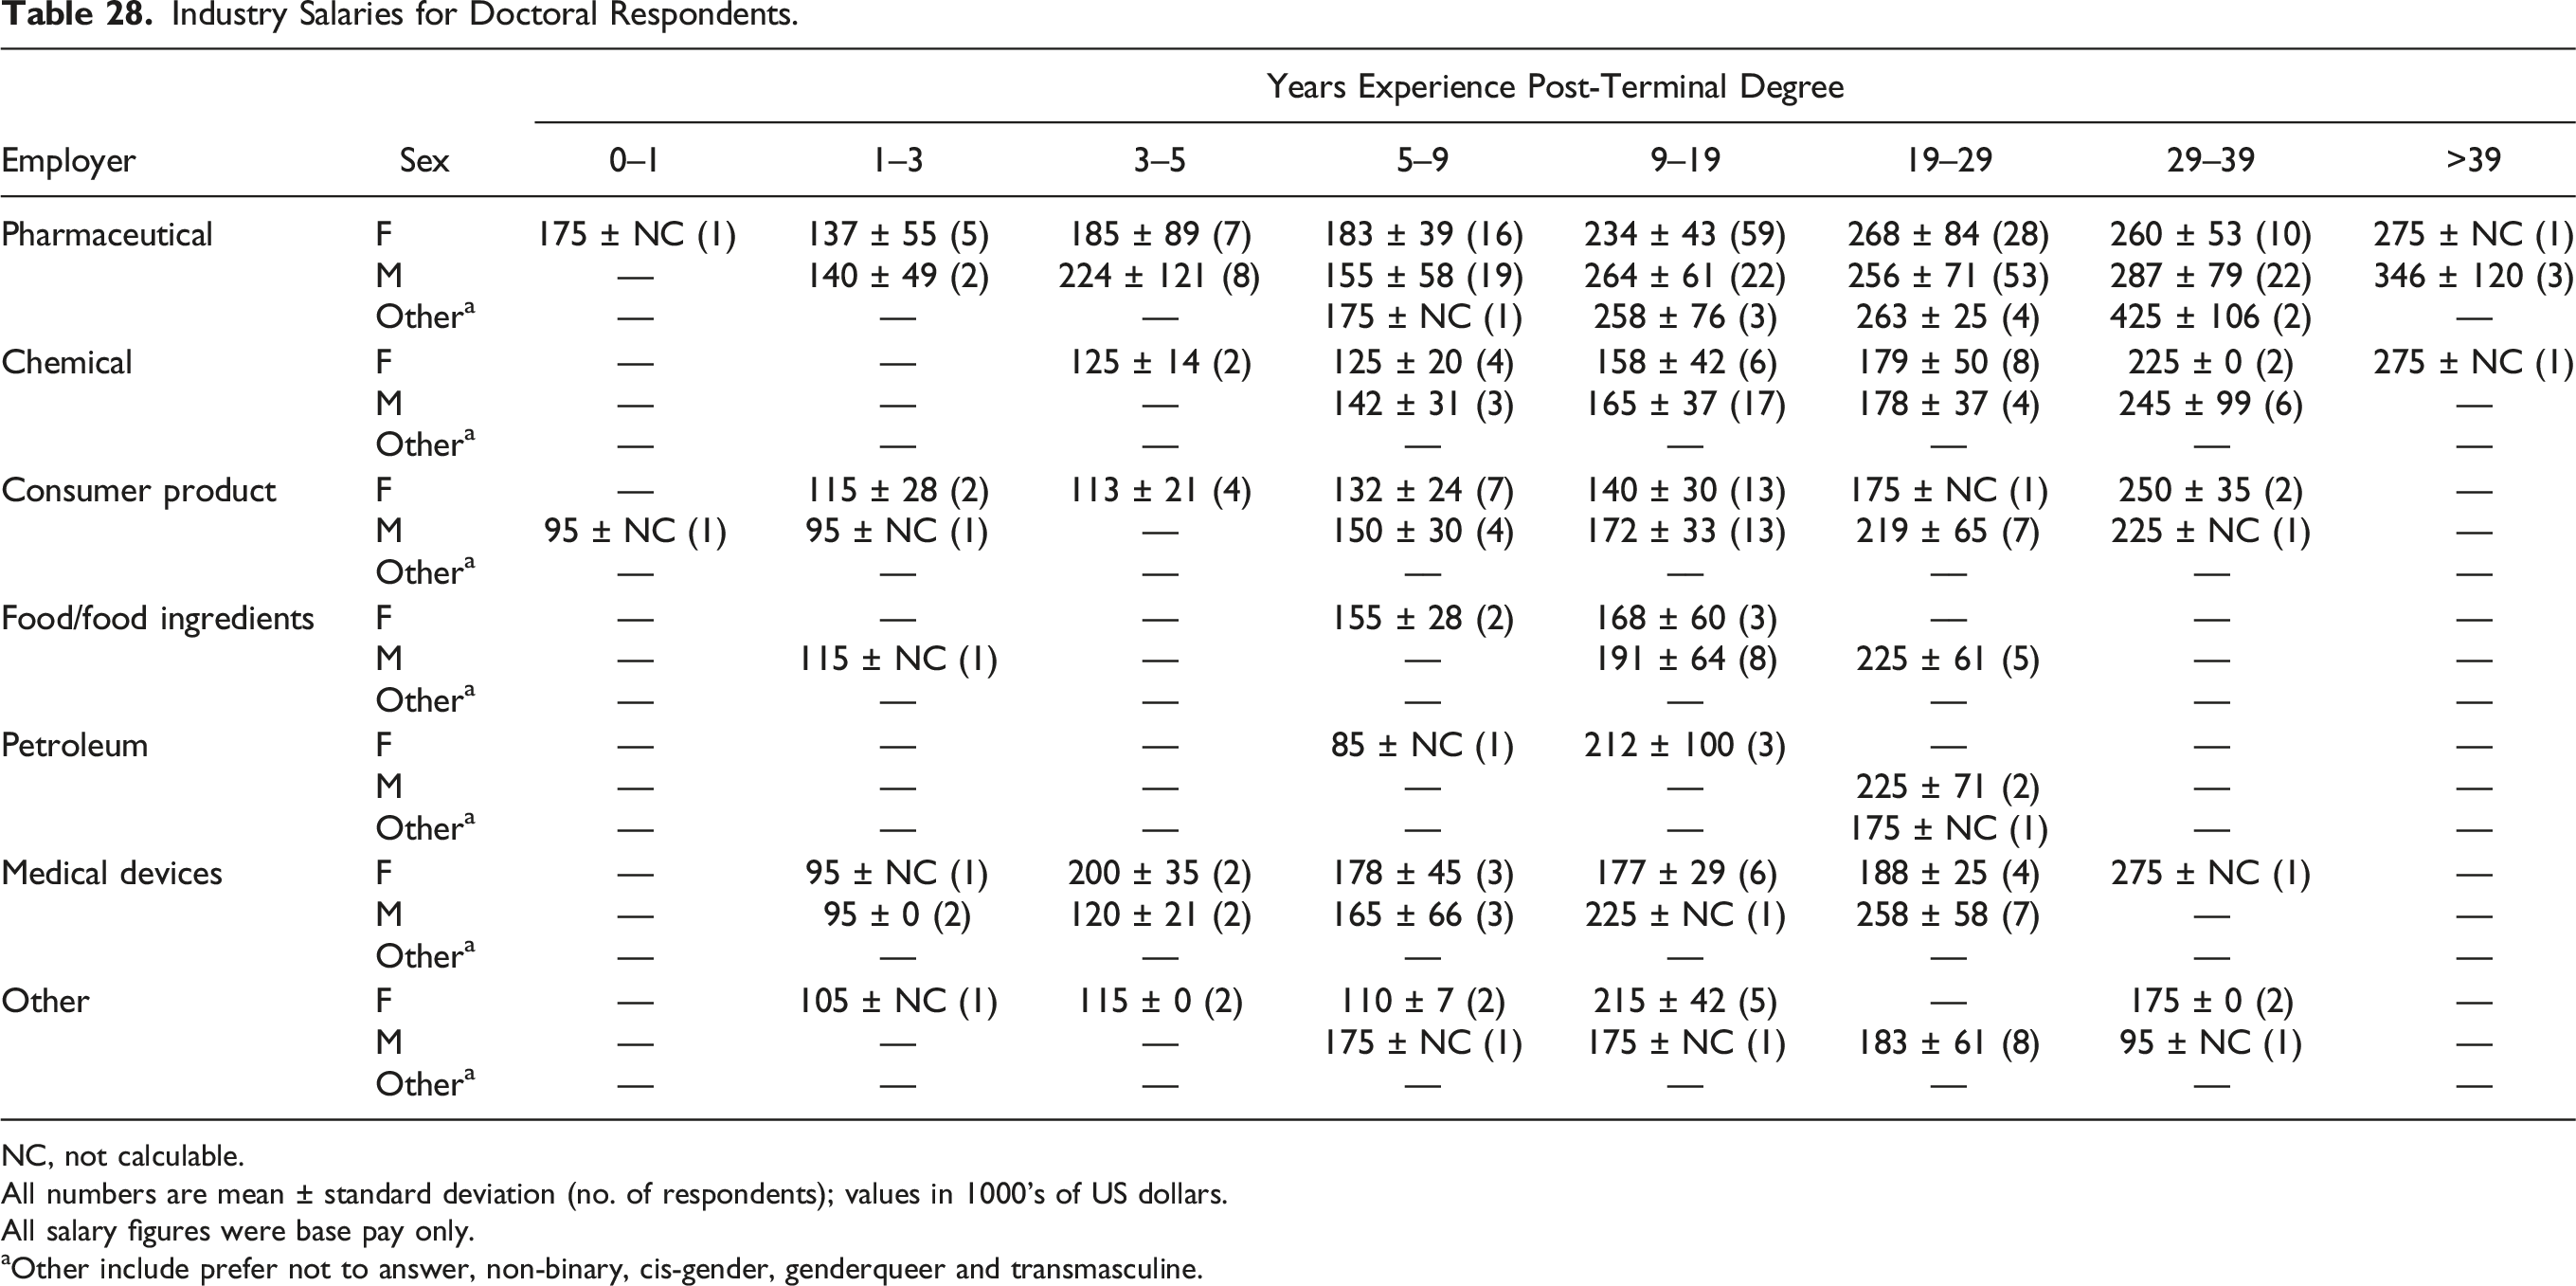
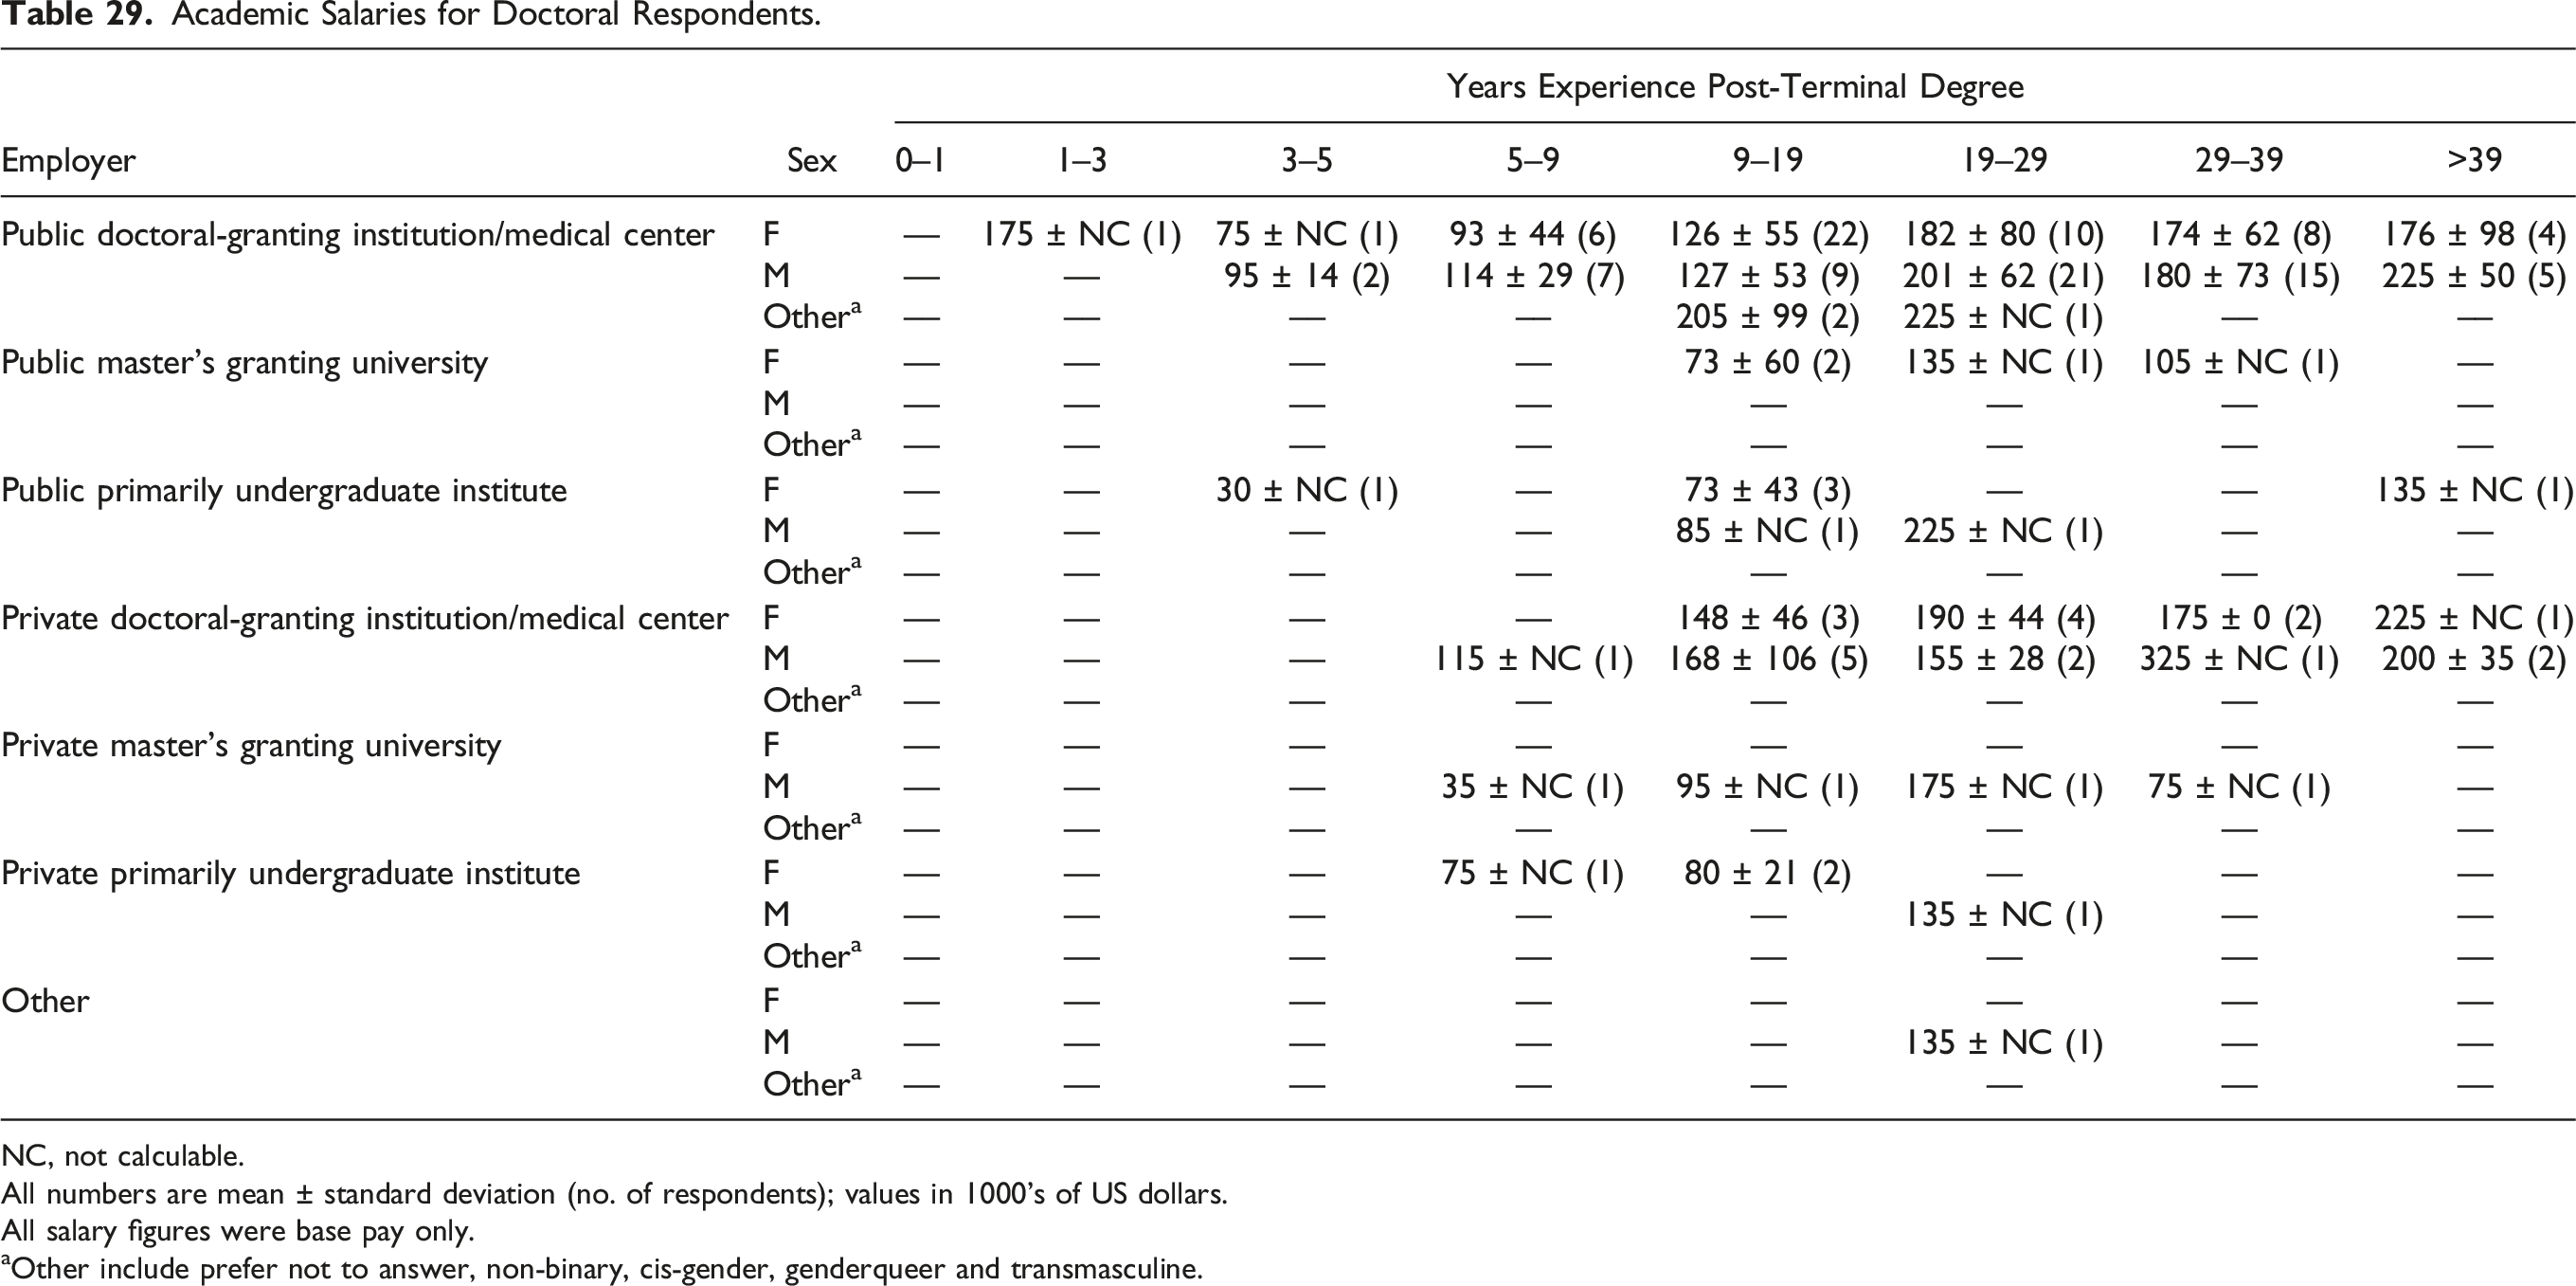
Toxicologists have a range of specialized areas of expertise and Table 27 presents a breakdown of areas of specialization and the distribution of respondents in these areas. As can be seen, food and ingredient toxicology, general toxicology, regulatory toxicology, and risk assessment are the largest areas of employment by areas of expertise. Both industries and academic institutions show wide variations in compensation for toxicologists. Tables 28 and 29, for different industrial sectors and academic institutions, respectively, express these differences for doctoral level toxicologists. Note that the industrial sector summaries do not include consultants, who tend to be more senior in experience and to potentially have greater compensation.
Current Area of Specialization.
Area
Frequency
Percent
General toxicology
217
16.53
Aquatic toxicology
8
0.61
Biotechnology
16
1.22
Carcinogenesis
11
0.84
Cardiovascular toxicology
7
0.53
Chemistry
4
0.30
Clinical and translational toxicology
2
0.15
Computational toxicology
15
1.14
Dermal toxicology
8
0.61
Drug development
109
8.30
Environmental/ecological toxicology
26
1.98
Exposure science
3
0.23
Food and ingredient toxicology
266
20.26
Forensics
3
0.23
Genomics
7
0.53
Immunotoxicology
20
1.52
Inhalation
33
2.51
Mechanistic toxicology
42
3.20
Medical devices
67
5.10
Molecular toxicology
13
0.99
Mutagenesis
4
0.30
Nanotoxicology
3
0.23
Neurotoxicology
28
2.13
Occupational safety and health
19
1.45
Ocular toxicology
13
0.99
Pathology
100
7.62
Pharmacokinetics
9
0.69
Regulatory toxicology
196
14.93
Reproductive/developmental toxicology
49
3.73
Risk assessment
153
11.65
Safety pharmacology
6
0.46
Stem cells
2
0.15
Veterinary toxicology
7
0.53
Other
33
2.51
No response
54
4.11
Only one response was allowed. Those who have several specialties had to select a “best describes” answer.
All numbers are mean ± standard deviation (no. of respondents); values in 1000’s of US dollars.
All salary figures were base pay only.
aOther include prefer not to answer, non-binary, cis-gender, genderqueer and transmasculine.
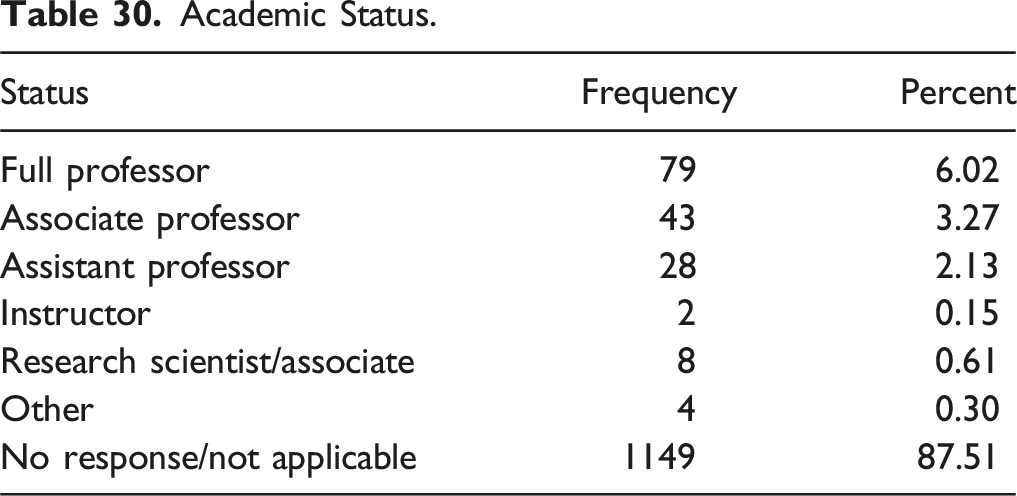
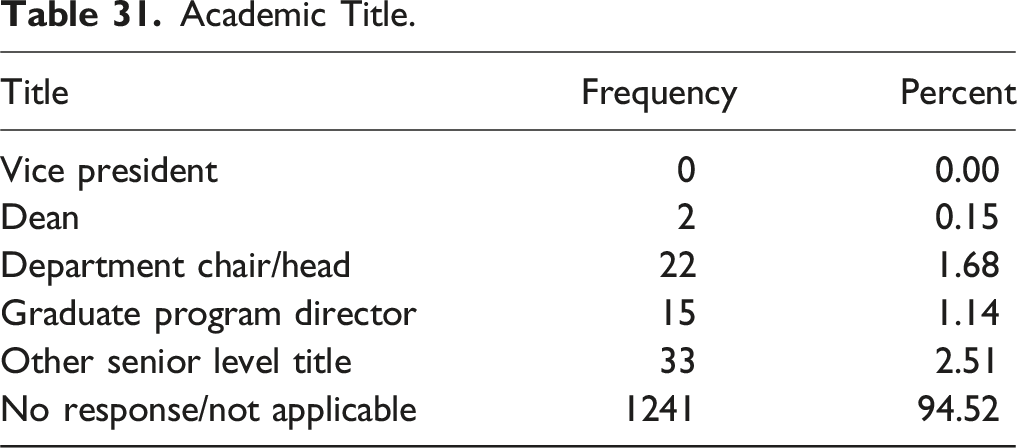
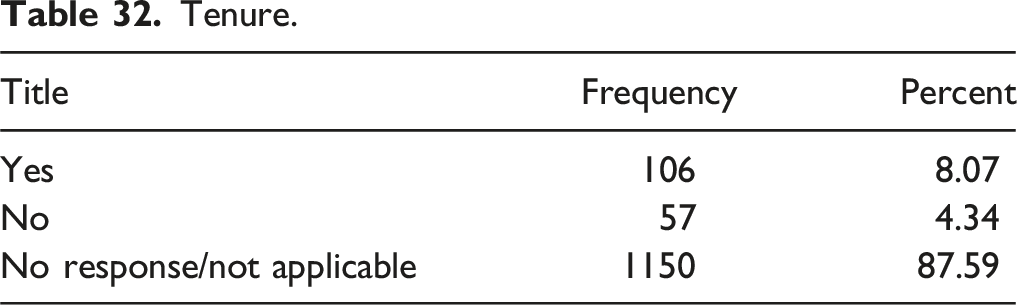
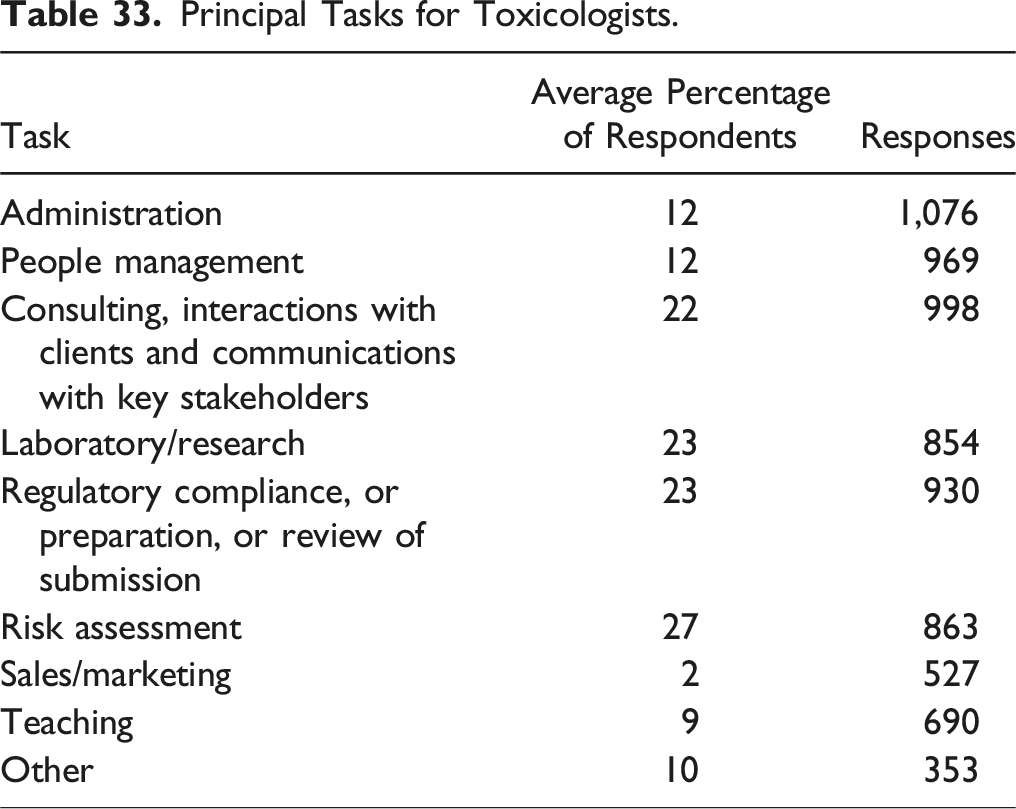
Tables 30–32 summarize responses from academic sector toxicologists as to academic rank (Table 30), title (Table 31), and whether the respondent holds tenure or not (Table 32). Responses summarized in Table 33 seek to understand what principal tasks for toxicologists were. Performing risk assessments, consulting/commercially with clients and key stakeholders, laboratory research, and regulatory compliance (including participation and review of submissions) represent the vast majority of responses.
Academic Status.
Status
Frequency
Percent
Full professor
79
6.02
Associate professor
43
3.27
Assistant professor
28
2.13
Instructor
2
0.15
Research scientist/associate
8
0.61
Other
4
0.30
No response/not applicable
1149
87.51
Academic Title.
Title
Frequency
Percent
Vice president
0
0.00
Dean
2
0.15
Department chair/head
22
1.68
Graduate program director
15
1.14
Other senior level title
33
2.51
No response/not applicable
1241
94.52
Tenure.
Title
Frequency
Percent
Yes
106
8.07
No
57
4.34
No response/not applicable
1150
87.59
Principal Tasks for Toxicologists.
Task
Average Percentage of Respondents
Responses
Administration
12
1,076
People management
12
969
Consulting, interactions with clients and communications with key stakeholders
22
998
Laboratory/research
23
854
Regulatory compliance, or preparation, or review of submission
23
930
Risk assessment
27
863
Sales/marketing
2
527
Teaching
9
690
Other
10
353
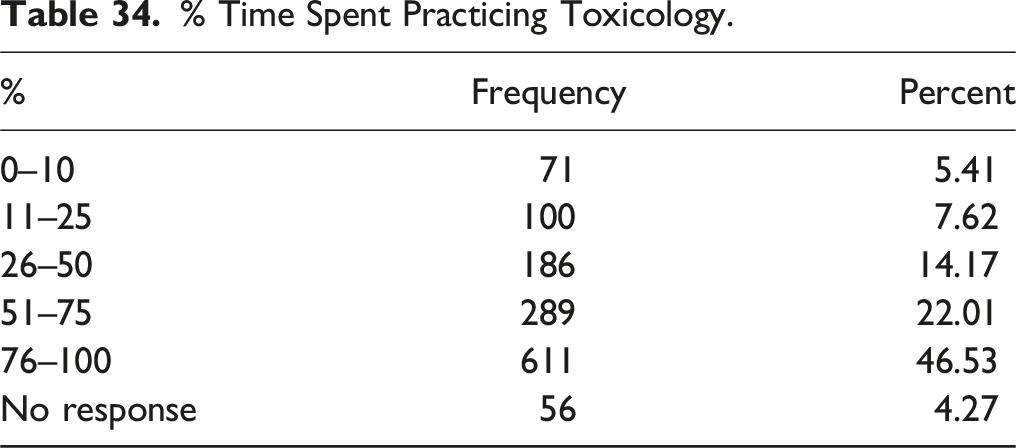
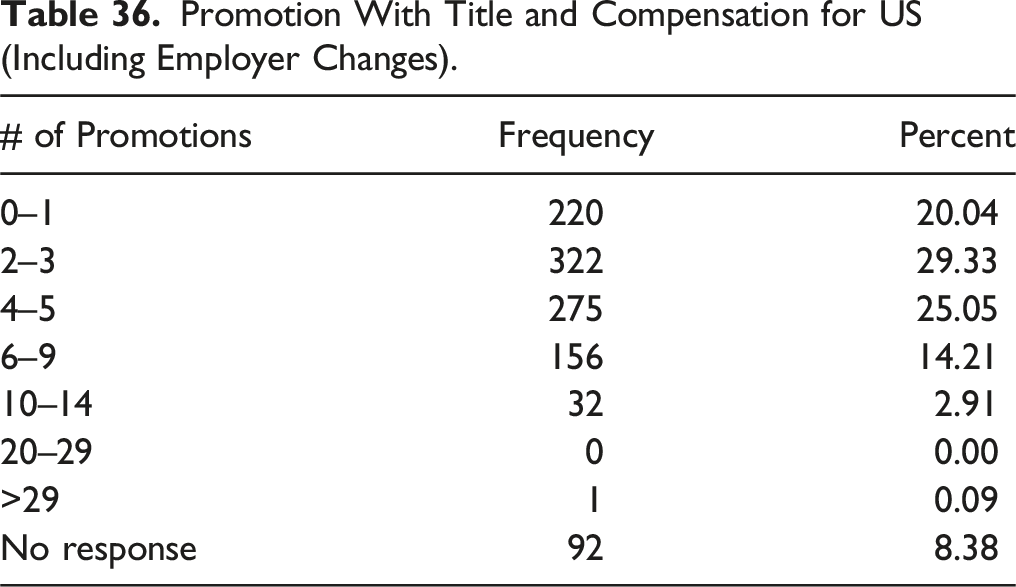
So, how much time is spent actually in the practice of toxicology? As summarized in Table 34, more than 68% of toxicologists spend the majority of their work time in the actual “practice” of our science. How long have respondents worked for their current employer? Table 35 addresses this question, with the most frequent answer being from 1–3 years. How many promotions with title change and increased compensation have respondents received during their careers? Approximately 78% of respondents (68% of the total) have received two or more over their career to date (Table 36).
% Time Spent Practicing Toxicology.
%
Frequency
Percent
0–10
71
5.41
11–25
100
7.62
26–50
186
14.17
51–75
289
22.01
76–100
611
46.53
No response
56
4.27
Years Worked for Current Employer.
Years
Frequency
Percent
0–1
130
9.90
1–3
272
20.72
3–5
169
12.87
5–9
193
14.70
9–19
286
21.78
19–29
145
11.04
>29
62
4.72
No response
56
4.27
Promotion With Title and Compensation for US (Including Employer Changes).
# of Promotions
Frequency
Percent
0–1
220
20.04
2–3
322
29.33
4–5
275
25.05
6–9
156
14.21
10–14
32
2.91
20–29
0
0.00
>29
1
0.09
No response
92
8.38
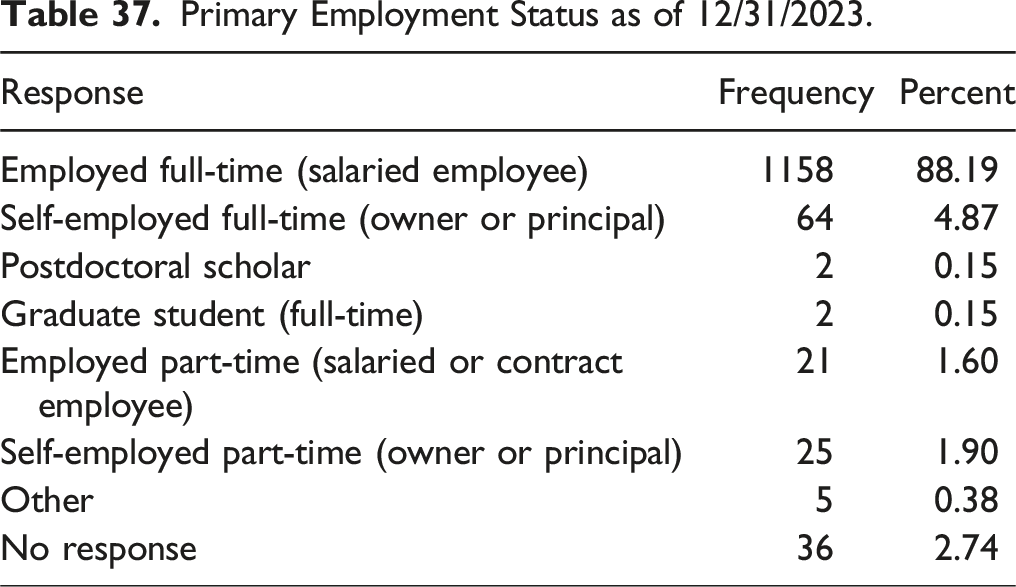
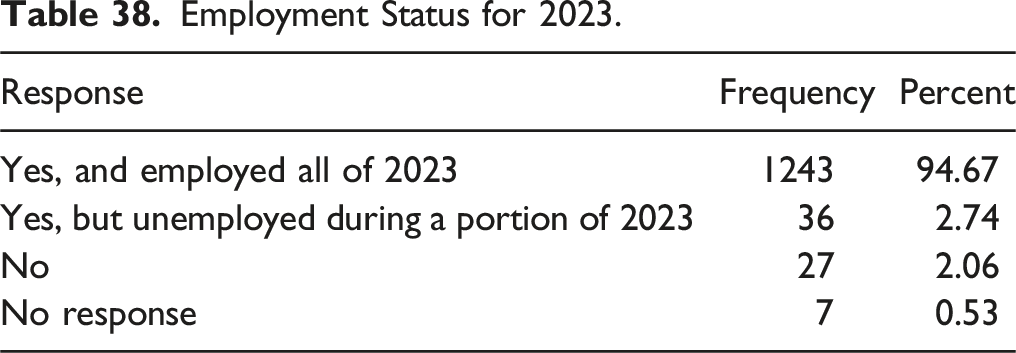
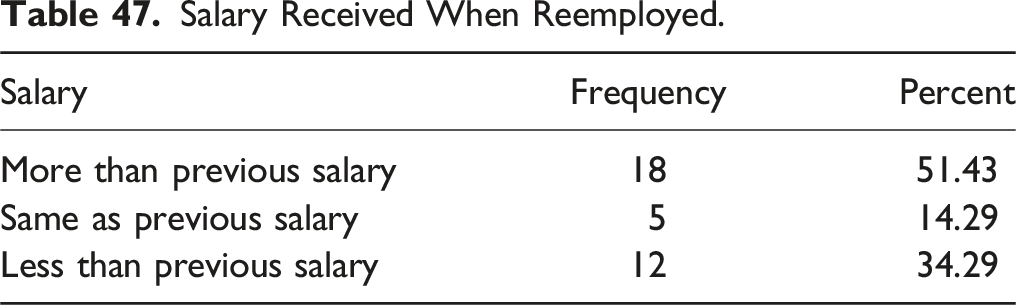
As Table 37 shows, more than 93% of respondents were employed full-time or owned their own businesses. As shown in Table 38, most respondents (94.67%) were employed throughout the calendar year in 2023. More than half of respondents (51.43%) that were unemployed report their salaries were more than their previous salary, while 14.29% had the same salary and 34.29% had lower salaries than before once they resumed work. Approximately 60% of individuals that responded (32 in total) retired in 2023, defined here as earning less than 50% of their income from active toxicology-related work, or chose not to work. Looking ahead, 80% of respondents do not anticipate retiring from the field of toxicology within the next 5 years.
Primary Employment Status as of 12/31/2023.
Response
Frequency
Percent
Employed full-time (salaried employee)
1158
88.19
Self-employed full-time (owner or principal)
64
4.87
Postdoctoral scholar
2
0.15
Graduate student (full-time)
2
0.15
Employed part-time (salaried or contract employee)
21
1.60
Self-employed part-time (owner or principal)
25
1.90
Other
5
0.38
No response
36
2.74
Employment Status for 2023.
Response
Frequency
Percent
Yes, and employed all of 2023
1243
94.67
Yes, but unemployed during a portion of 2023
36
2.74
No
27
2.06
No response
7
0.53
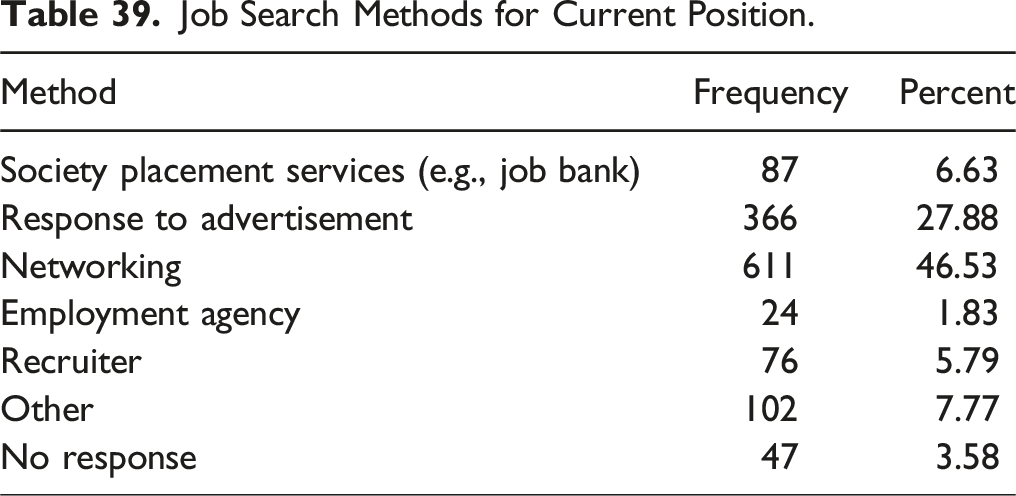
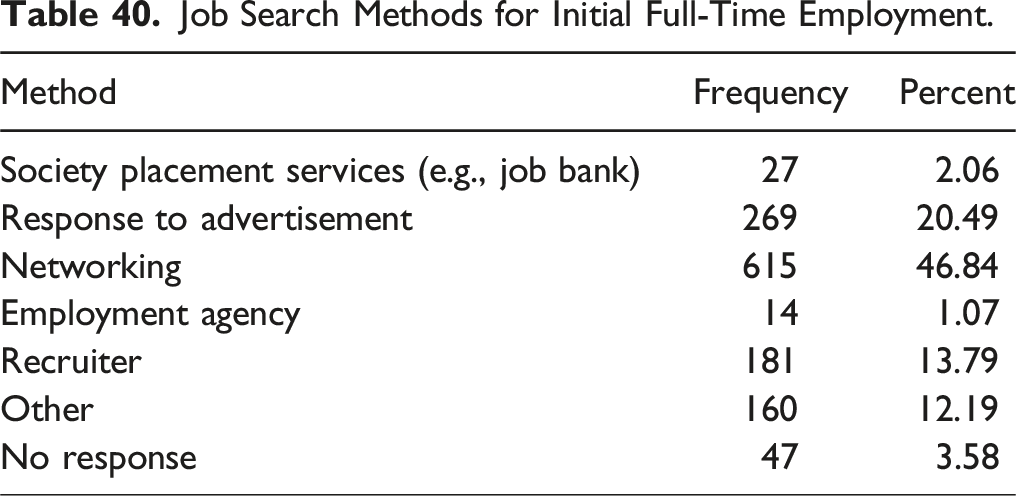
As the results summarized in Tables 39 and 40 show, networking contributed the most to both new and current employments were the result of networking, responding to an advertisement was the second most successful job search method for both initial and subsequent successes, significant but cited as successful in about half as many cases.
Job Search Methods for Current Position.
Method
Frequency
Percent
Society placement services (e.g., job bank)
87
6.63
Response to advertisement
366
27.88
Networking
611
46.53
Employment agency
24
1.83
Recruiter
76
5.79
Other
102
7.77
No response
47
3.58
Job Search Methods for Initial Full-Time Employment.
Method
Frequency
Percent
Society placement services (e.g., job bank)
27
2.06
Response to advertisement
269
20.49
Networking
615
46.84
Employment agency
14
1.07
Recruiter
181
13.79
Other
160
12.19
No response
47
3.58
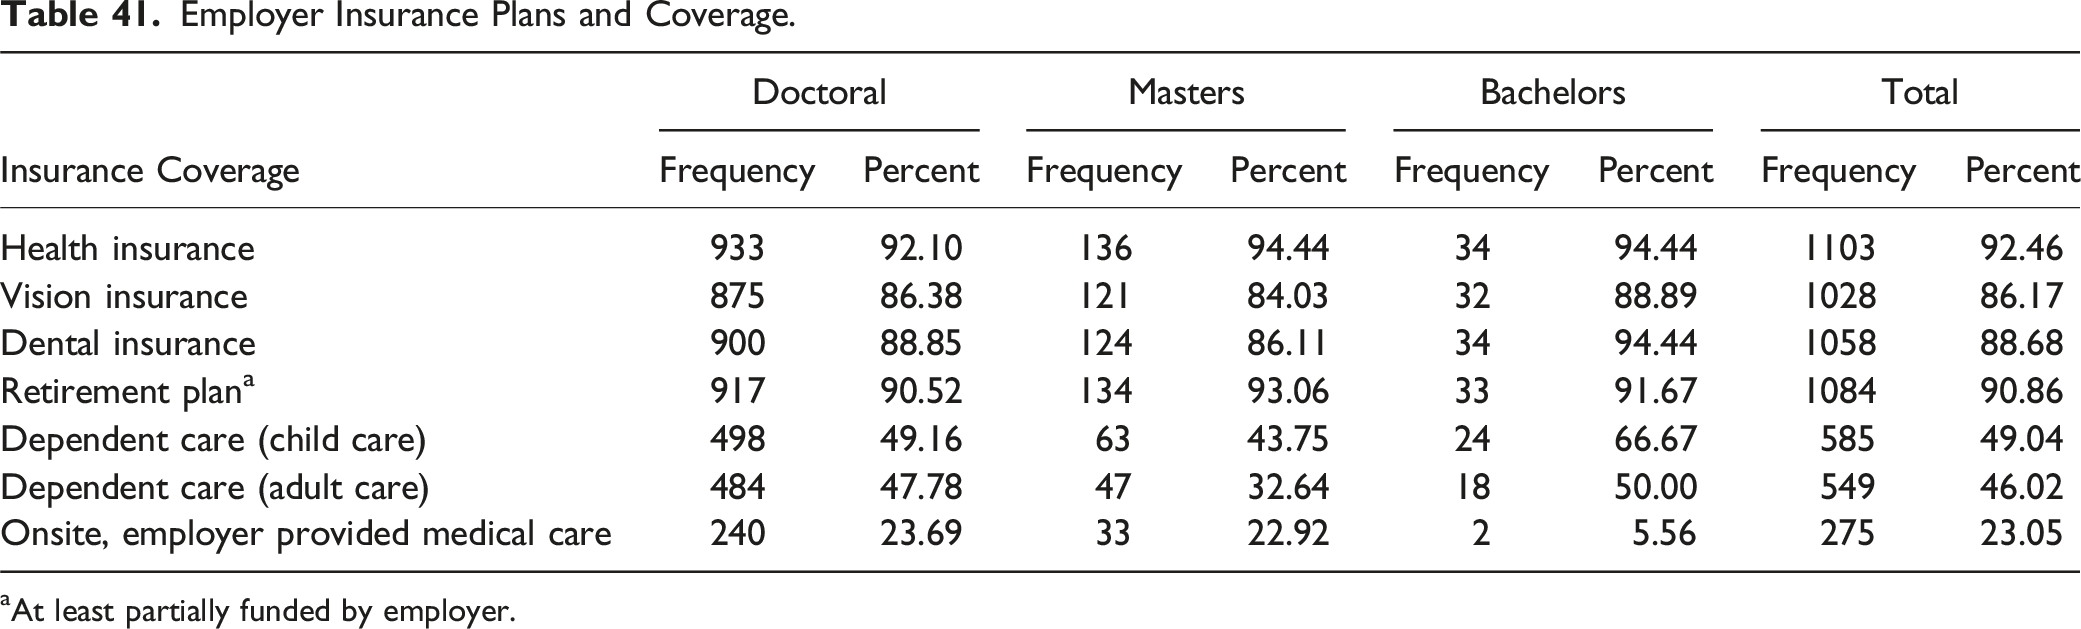
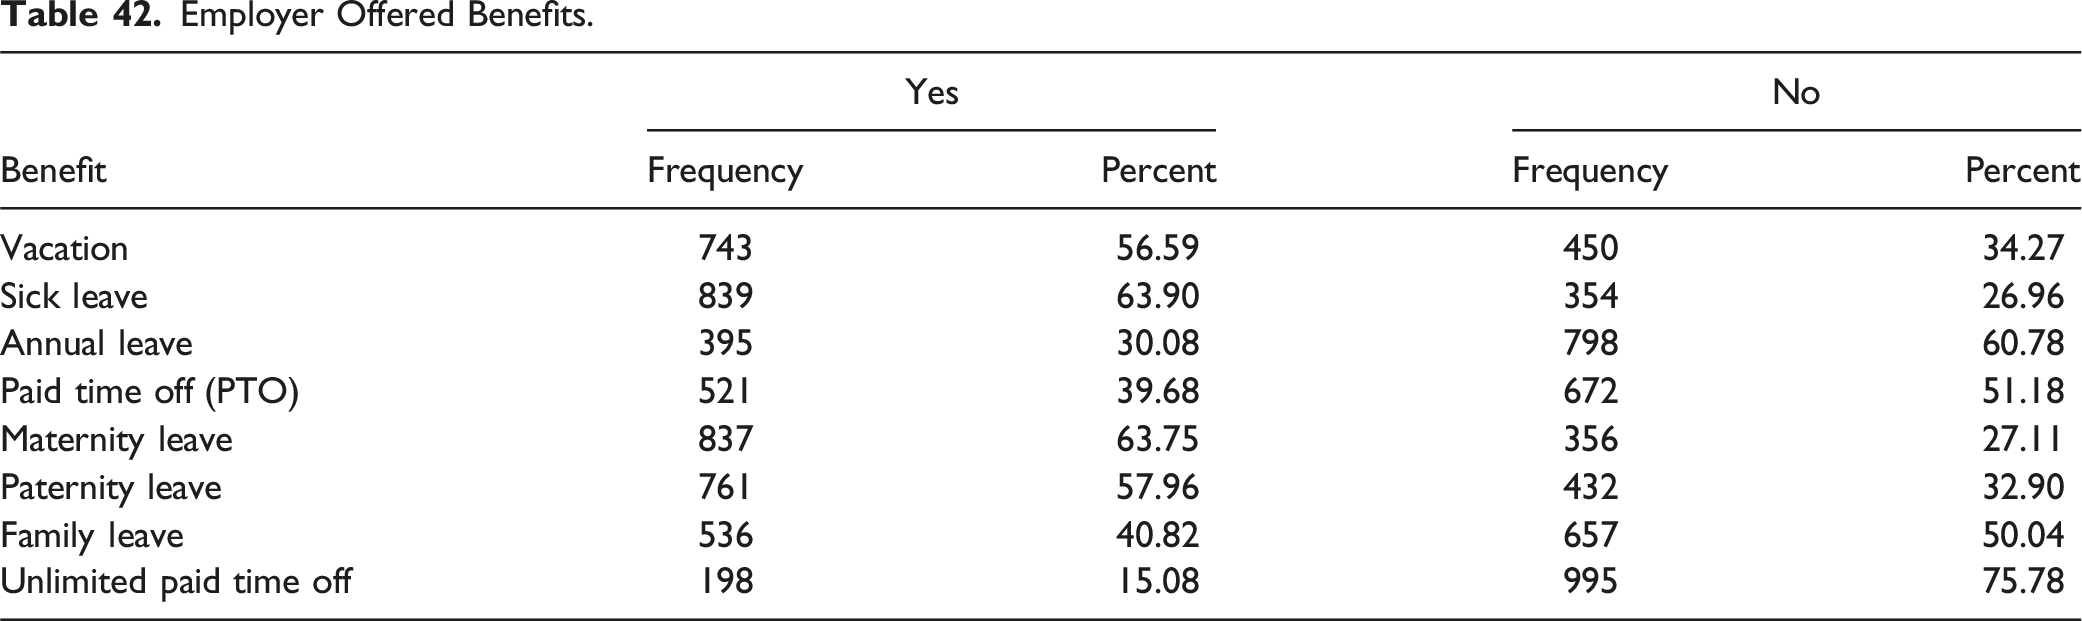
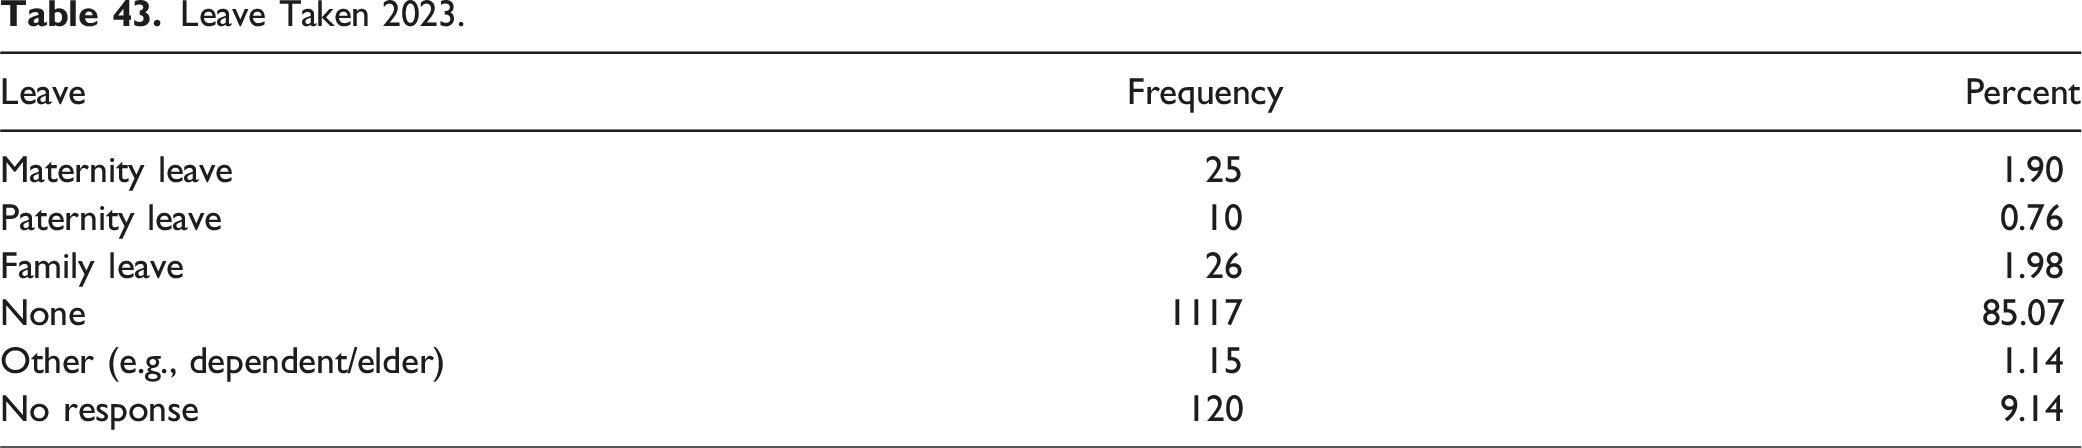
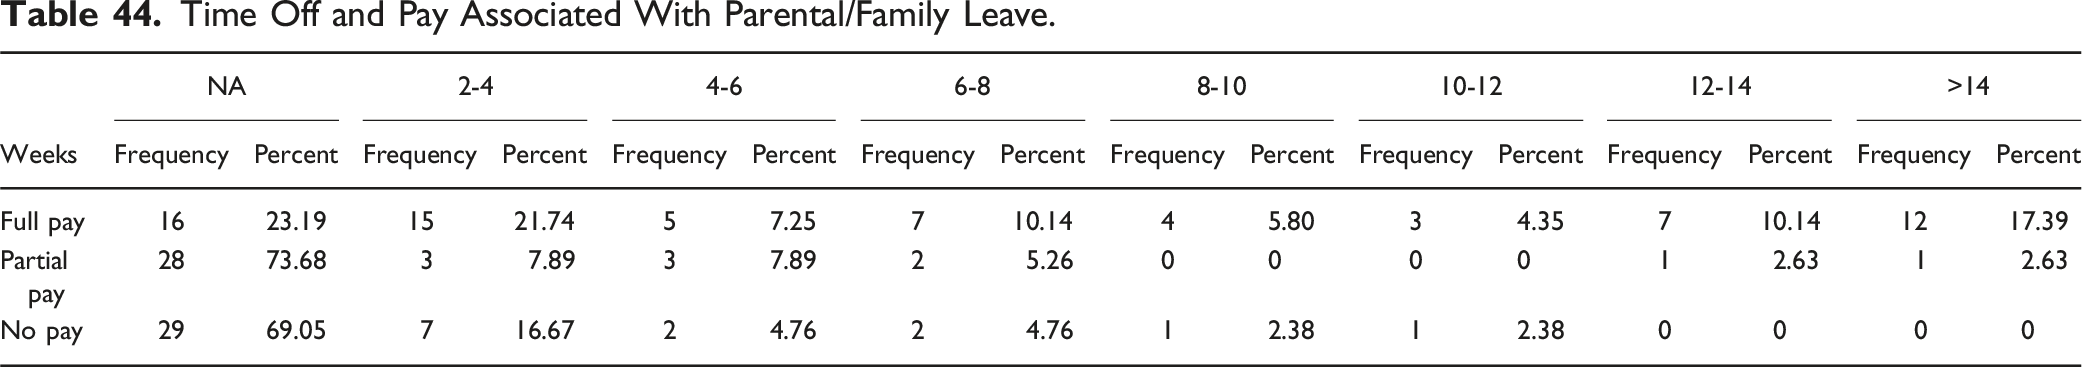
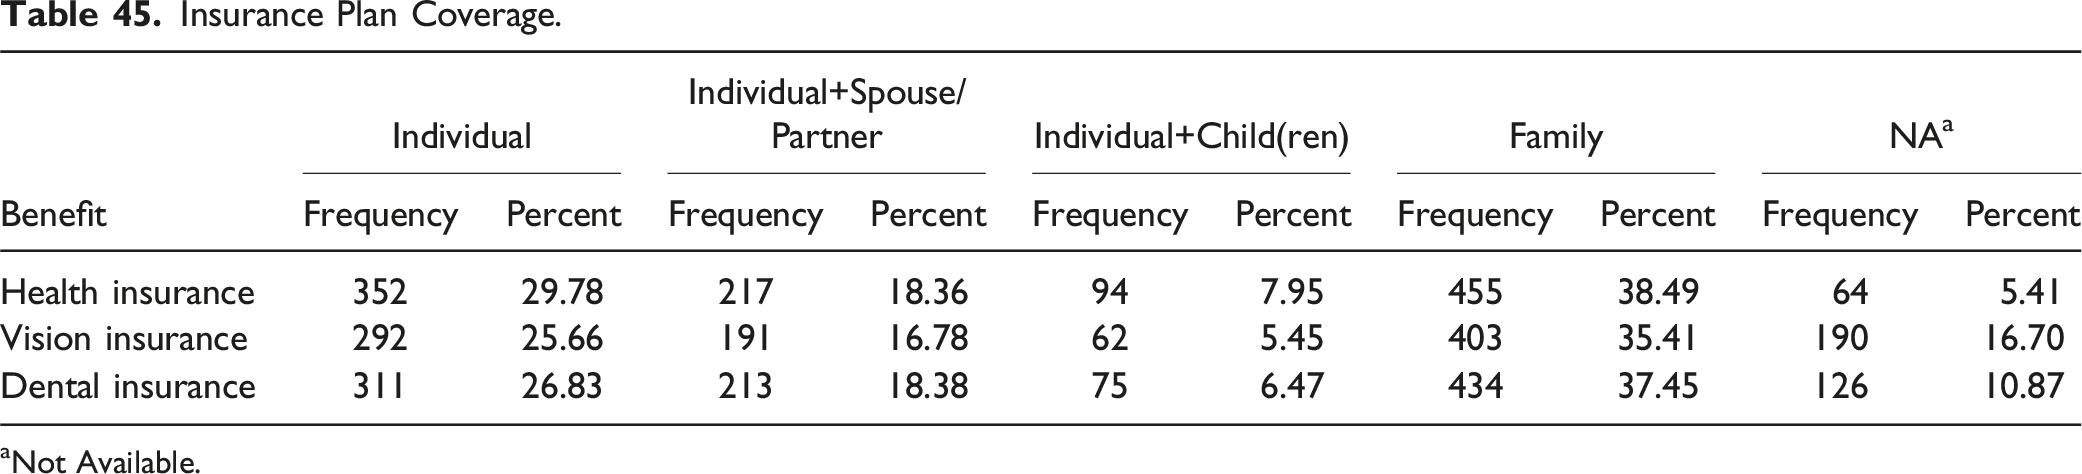
Of much more importance in today’s environment, employer provided benefits (starting with health insurance) are a major consideration in evaluating a potential job. Financial benefits (summarized in Table 41) can be extensive, with health insurance being the leader. More than 84% of employers offer the basic four benefits (health, vision and dental insurance, and some form of retirement). Dependent care (for children or adults) is also common. According to respondents, vacation, sick leave, paid time off, maternity/paternity, and family leave (summarized in Table 42) are generally well provided. However, as Table 43 shows, most employees have not taken maternity/paternity leave or family leave in the period covered by this survey. The devil is in the details, of course, for parental and family leave. As Table 44 presents, most often full pay during periods of leave is not provided, and the extent of health-related insurance coverage provided to employees, their spouses/partners, and children varies (Table 45).
Since 1989, the toxicology salary survey has been conducted 12 times—approximately every 3 years with most recent data being collected at the end of 2023.
The survey questions have changed over the years, making exact comparisons more difficult in some cases. However, there are clear trends over the 35 years that should be noted. Looking across these years, several trends in the data are clear.
How Much Have Salaries Increased?
The average doctoral starting salaries in 1989 were $44,460 for men and $30,789 for women. All respondents specified a gender.
In 2023, depending on field of employment, starting salaries are $137,000 for females and $140,000 for males for the respondents in the highest responding employment field (pharmaceuticals). For academics, at 3–5 years on the job (the earliest that there is data) for males is $95,000 and for females $75,000, starting salaries have increased more than three-fold for males and four-fold for females over 35 years.
The Salary Gap Between Males and Females Has Decreased
In 1989, starting mean doctoral salaries for males was $44,460. For females, it was $30,789. With 20 plus years’ experience males made $75,190 and females $57,700.0. By 2023, male and female average industrial salaries were comparable across the range of years’ experience. In academia, female entry and early career salaries still tended to lag behind the males across the years of employment (Table 29).
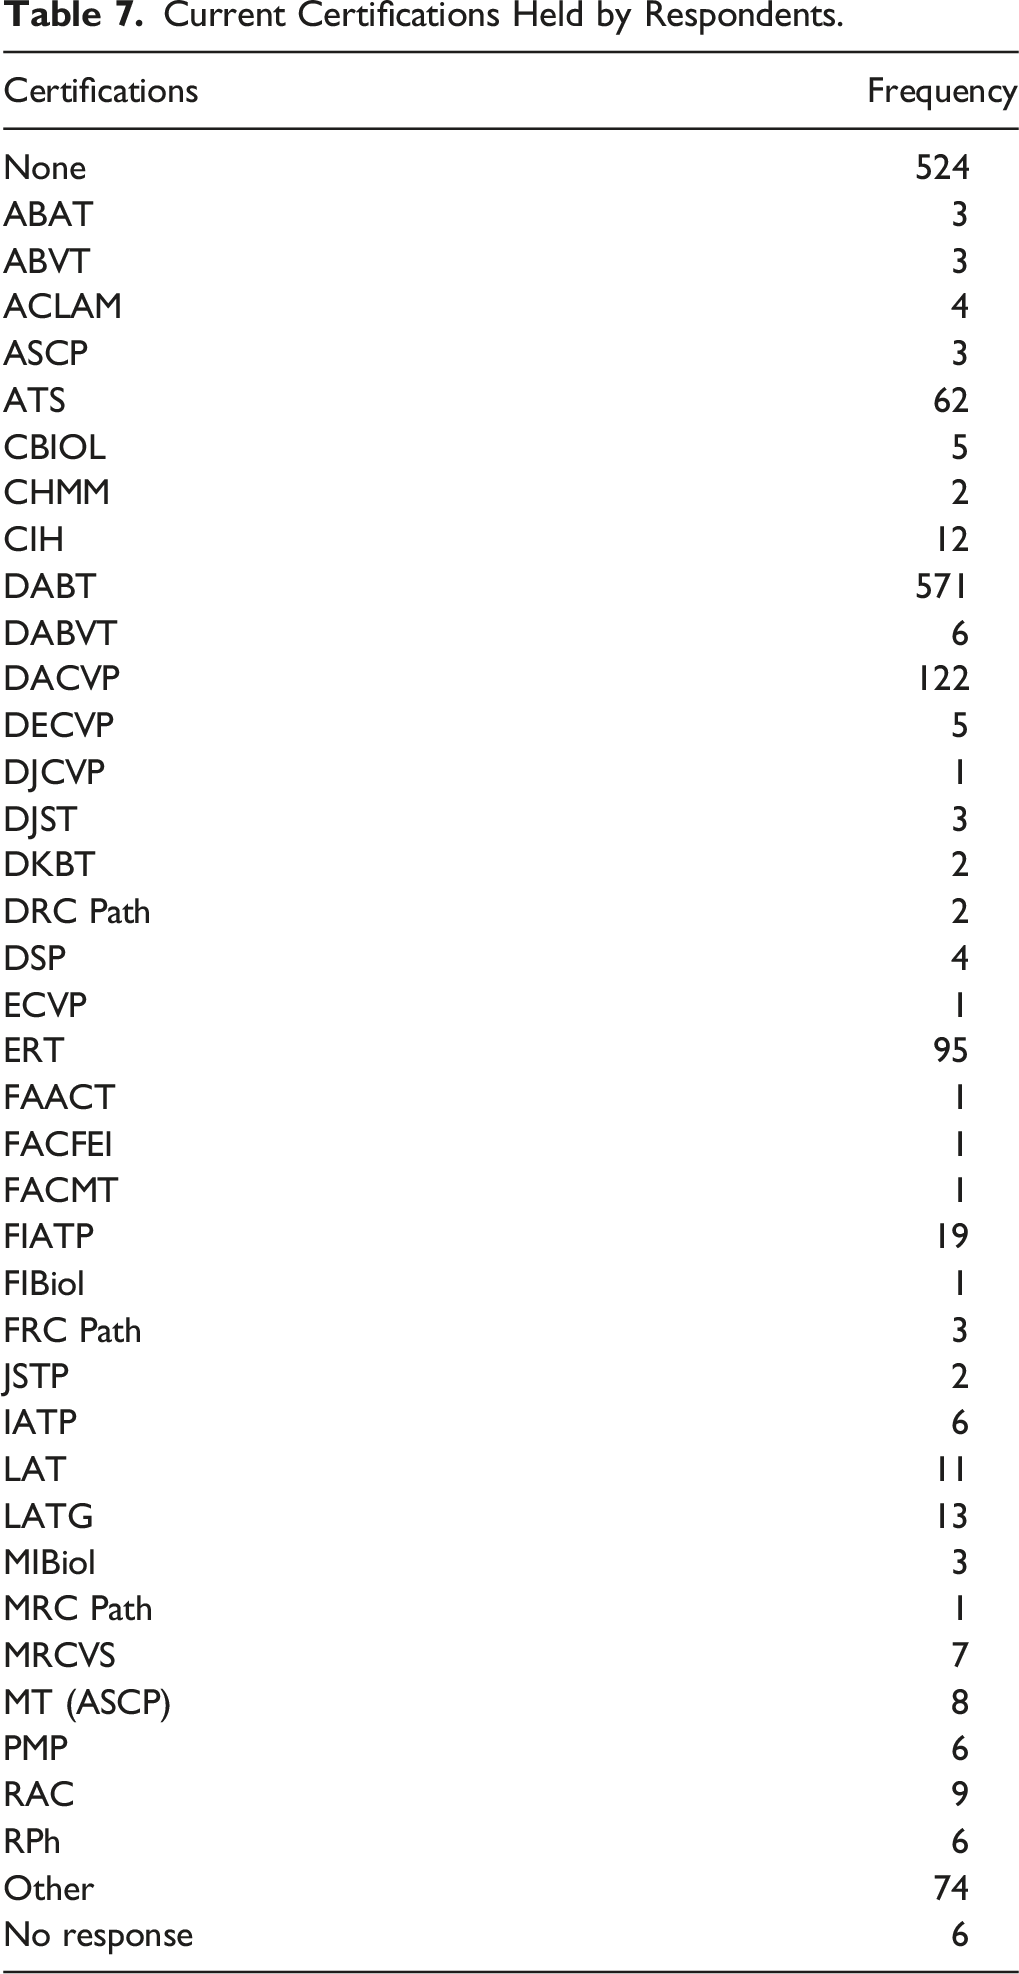
Effect of Certification on Salaries
In 2023, 60.9% of respondents (810 out of 1334) reported having certifications (Table 7). By far, the most common was the DABT (42.8%) with the next highest being the DACVP (9.1%). In 1989, 30.2% of doctrinal respondents reported having DABT certification. The second (1991) survey had a similar (28.8%) incidence of certification. The survey responses are primarily from the US and Canada. While in the early years there was an attempt to do a meaningful analysis of data from other countries, the number of respondents has never been sufficient to support meaningful analysis. There were 72 foreign respondents in 1989, with the largest number being from Japan (18) and the UK (16), allowing for some analysis of salary data for respondents from these countries. Most recently, foreign responses (excluding US and Canada) remained limited, with the UK (18), Switzerland, and Germany (14 each) having double-digit response rates from these three countries. Only Germany has shown a marginal increase in responses.
In 2023, certification was worth an average of $20,000 higher annual salary. This figure also was not influenced by gender. The figure remains approximately consistent regardless of years of experience.
Respondents by Gender
In 1989, PhD respondents included 1334 males and 327 females. In 2023, there were 614 males and 666 females.
Trends in Employment Sectors
In 1989, academic positions (526) were the most numerous for doctoral level respondents followed by pharmaceutical (239), federal government (202), contract lab (175), and chemical industry (169).
By 2023, consulting was the largest, followed by academic, pharmaceutical, and federal government. The chemical industry has shown the greatest reduction in the number of responses.
Discussion and Conclusions
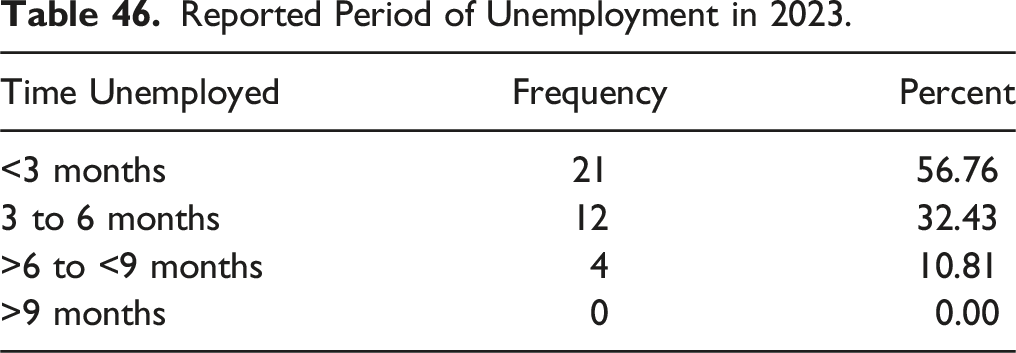
The current survey results point to a number of different trends that deserve attention by major professional societies, and add some insights into the job market, career path, and the conduct of future toxicology salary surveys. First, although the situation continues to improve for most entry-level and early-career positions, women continue to be compensated at a lower level than their male counterparts though their overall representation in the doctoral level of responses has steadily increased becoming a majority for the first time in this years’ survey. Second, salaries as a whole have increased in the field, but the most impressive differences are not by geographic location of place of employment, but rather by type of employer. Additionally, certification continues to play a significant positive role in compensation. Periods of unemployment remained low in 2023, with most unemployment lasting 6 months or less as shown in Table 46. When reemployed, most earned a higher salary than prior to unemployment (see Table 47). Most employers of respondents (over 91%) provided health insurance and retirement savings plans for employees.
Reported Period of Unemployment in 2023.
Time Unemployed
Frequency
Percent
<3 months
21
56.76
3 to 6 months
12
32.43
>6 to <9 months
4
10.81
>9 months
0
0.00
Salary Received When Reemployed.
Salary
Frequency
Percent
More than previous salary
18
51.43
Same as previous salary
5
14.29
Less than previous salary
12
34.29
Furthermore, the inclusion of those who were not holders of doctorates was insufficient to allow for meaningful analyses. In recent years, surveys were not distributed to regional SOT chapters severely limiting non-doctoral responses. The data collection for the next survey should be revised to improve the range of coverage of potential respondents as well as decrease the timing from survey distribution to publication.
Finally, the lag between survey responses being provided by the main participant organization, the availability of data for analysis, and the publication of these data has previously been excessive. With this years’ survey, however, the lag was reduced to less than 8 months.
Proposals for Improvements of Future Surveys
Future surveys should return to including members of the regional SOT chapters so as to again capture data from those who are not members of the national society. This would serve to represent (and engage) particularly those who have degrees less than doctoral and otherwise may not yet qualify for full SOT membership. This population includes both many of those employed in laboratory positions and those who strive to advance to full membership.
Footnotes
Author Contributions
Gad, SC., Sullivan Jr., D., and Pitts, D.A. contributed to conception and design, contributed to analysis and interpretation, drafted manuscript, critically revised manuscript, gave final approval, and agree to be accountable for all aspects of work ensuring integrity and accuracy.
Declaration of Conflicting Interests
The author(s) declared no potential conflicts of interest with respect to the research, authorship, and/or publication of this article.
Funding
The author(s) received no financial support for the research, authorship, and/or publication of this article.
ORCID iD
Shayne C. Gad
References
1.
GadSC. The first international salary survey for toxicologists. J Am Coll Toxicol. 1989;8(5):1053-1070.