
Abstract
This is the eleventh in a series of salary surveys for toxicologists conducted at three-year intervals that began in 1988. Previous salary surveys were conducted in 1988, 1991, 1995, 1998, 2001, 2004, 2007 (which was posted electronically, but not published), 2012, 2016 and 2020. In addition to presenting the 2022 results, herein we are providing additional data and an analysis of the trends for employment and pay in toxicology over the last 35 years. The eleventh Triennial Toxicology Salary Survey was conducted as a joint project by the American College of Toxicology (ACT) and the Society of Toxicology (SOT). In addition to the two parent organizations, eight others (the Society for Birth Defects Research, the Society of Toxicologic Pathology, the Safety Pharmacology Society, the American Board of Toxicology (ABT), the Academy of Toxicological Sciences, the Roundtable of Toxicology Consultants, the Society of Environmental Toxicology and Chemistry (SETAC), and the Environmental Mutagenesis and Genomics Society) supported the effort by distributing the Survey Monkey-based instrument to their memberships. Surveys were not distributed to regional SOT chapters, causing there to be minimal responses below the doctorate and master's degree levels. It should be noted that there continues to be a significant increase in the number of individuals reporting six-figure incomes and in those receiving significant sums as bonuses.
Keywords
This is the eleventh in a series of salary surveys conducted at three-year intervals for toxicologists that began in 1988. Previous salary surveys were conducted in 1988, 1 1991, 2 1995, 3 1998, 4 2001, 5 2004, 6 2007 (which was posted electronically, but not published), 2012, 7 2016 8 and 2020. 9 In addition to presenting the 2022 results, herein we are providing additional data and an analysis of the trends for employment and pay in toxicology over the last 35 years.
The eleventh Triennial Toxicology Salary Survey was conducted as a joint project by the American College of Toxicology (ACT) and the Society of Toxicology (SOT). In addition to the 2 parent organizations, 8 others (the Society for Birth Defects Research, the Society of Toxicologic Pathology, the Safety Pharmacology Society, the American Board of Toxicology (ABT), the Academy of Toxicological Sciences, the Roundtable of Toxicology Consultants, the Society of Environmental Toxicology and Chemistry (SETAC), and the Environmental Mutagenesis and Genomics Society) supported the effort by distributing the Survey Monkey-based instrument to their memberships. Surveys were not distributed to regional SOT chapters.
Survey instruments were distributed electronically, with responses going to Survey Monkey. A total of 980 responses were received, down from the 1338 responses received for the previous survey.
9
Figure 1 provides a summary of the number of doctoral respondents across the thirty-three years of surveys. Number of doctoral-level respondents across surveys.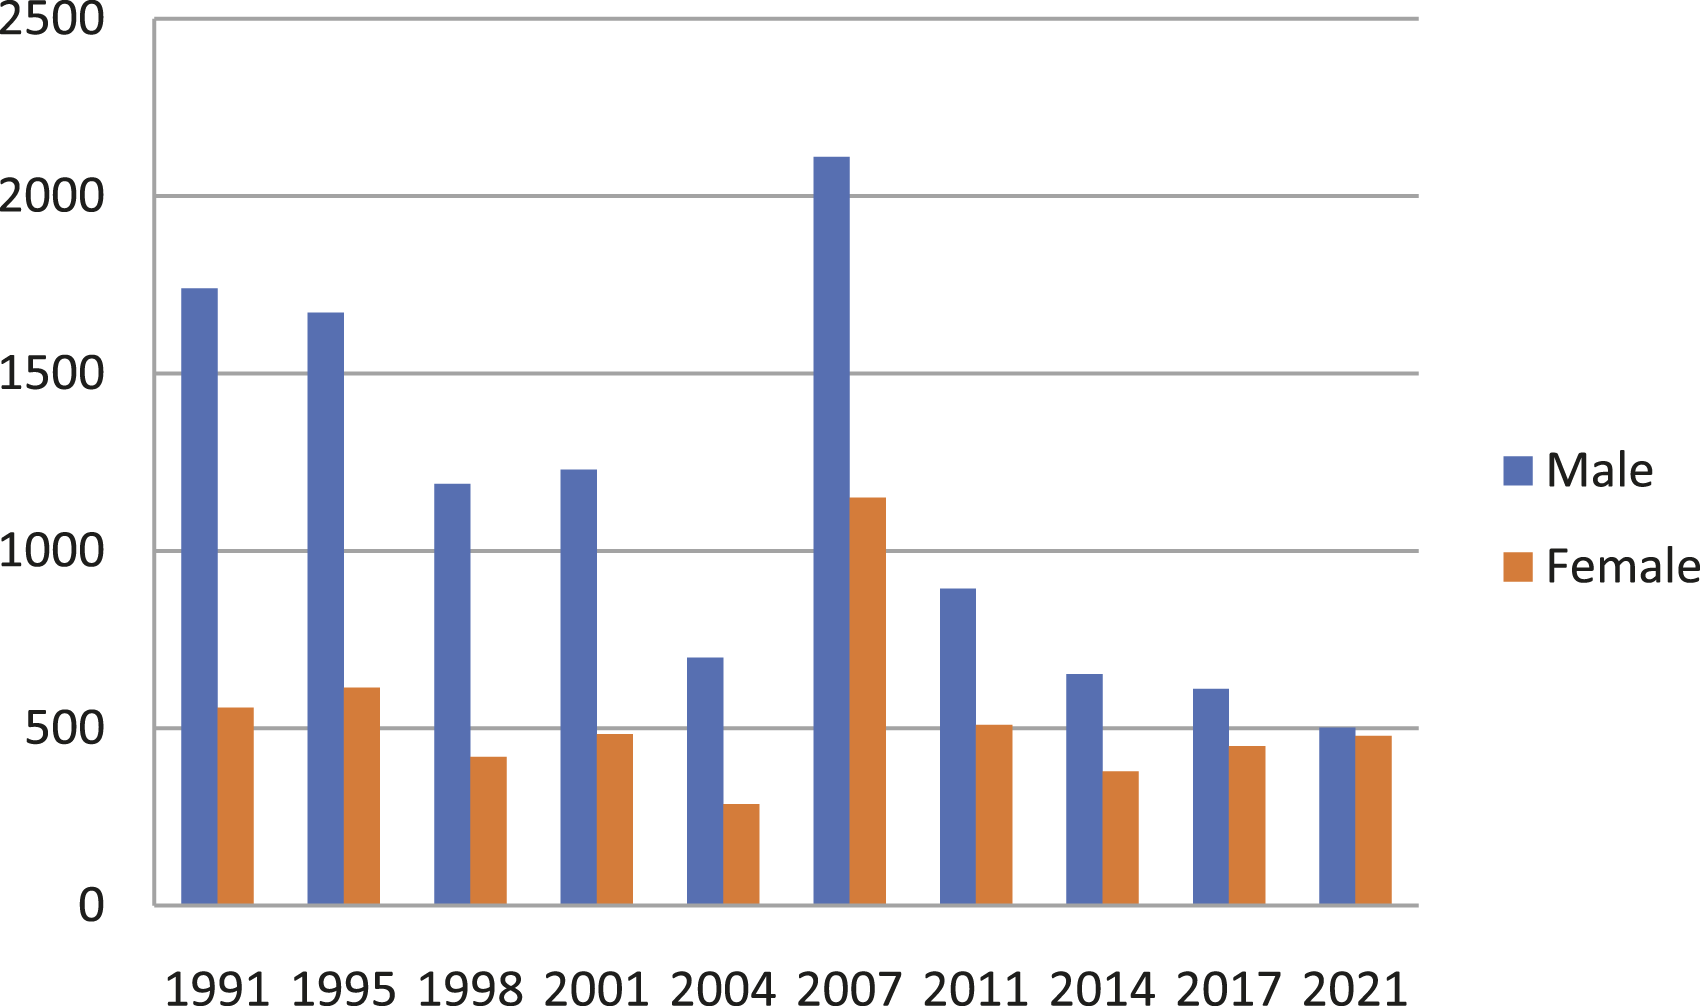
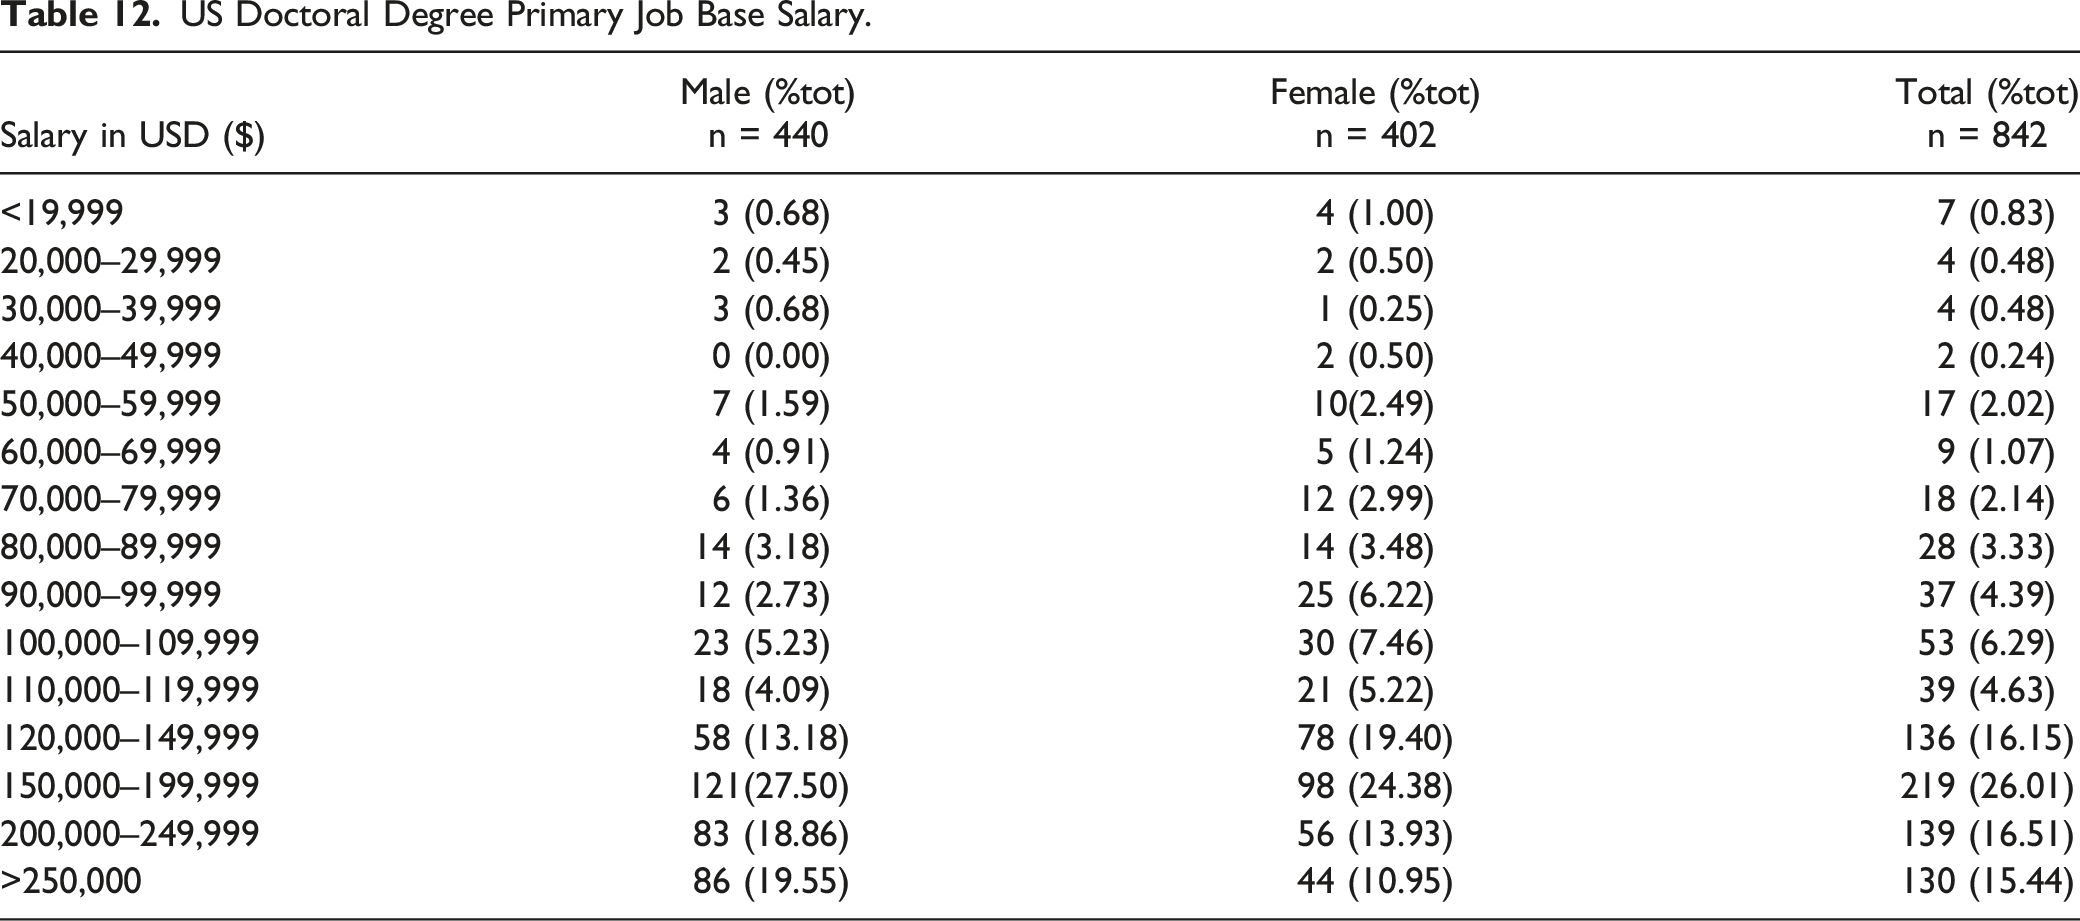
Primary Job Base Salary*.
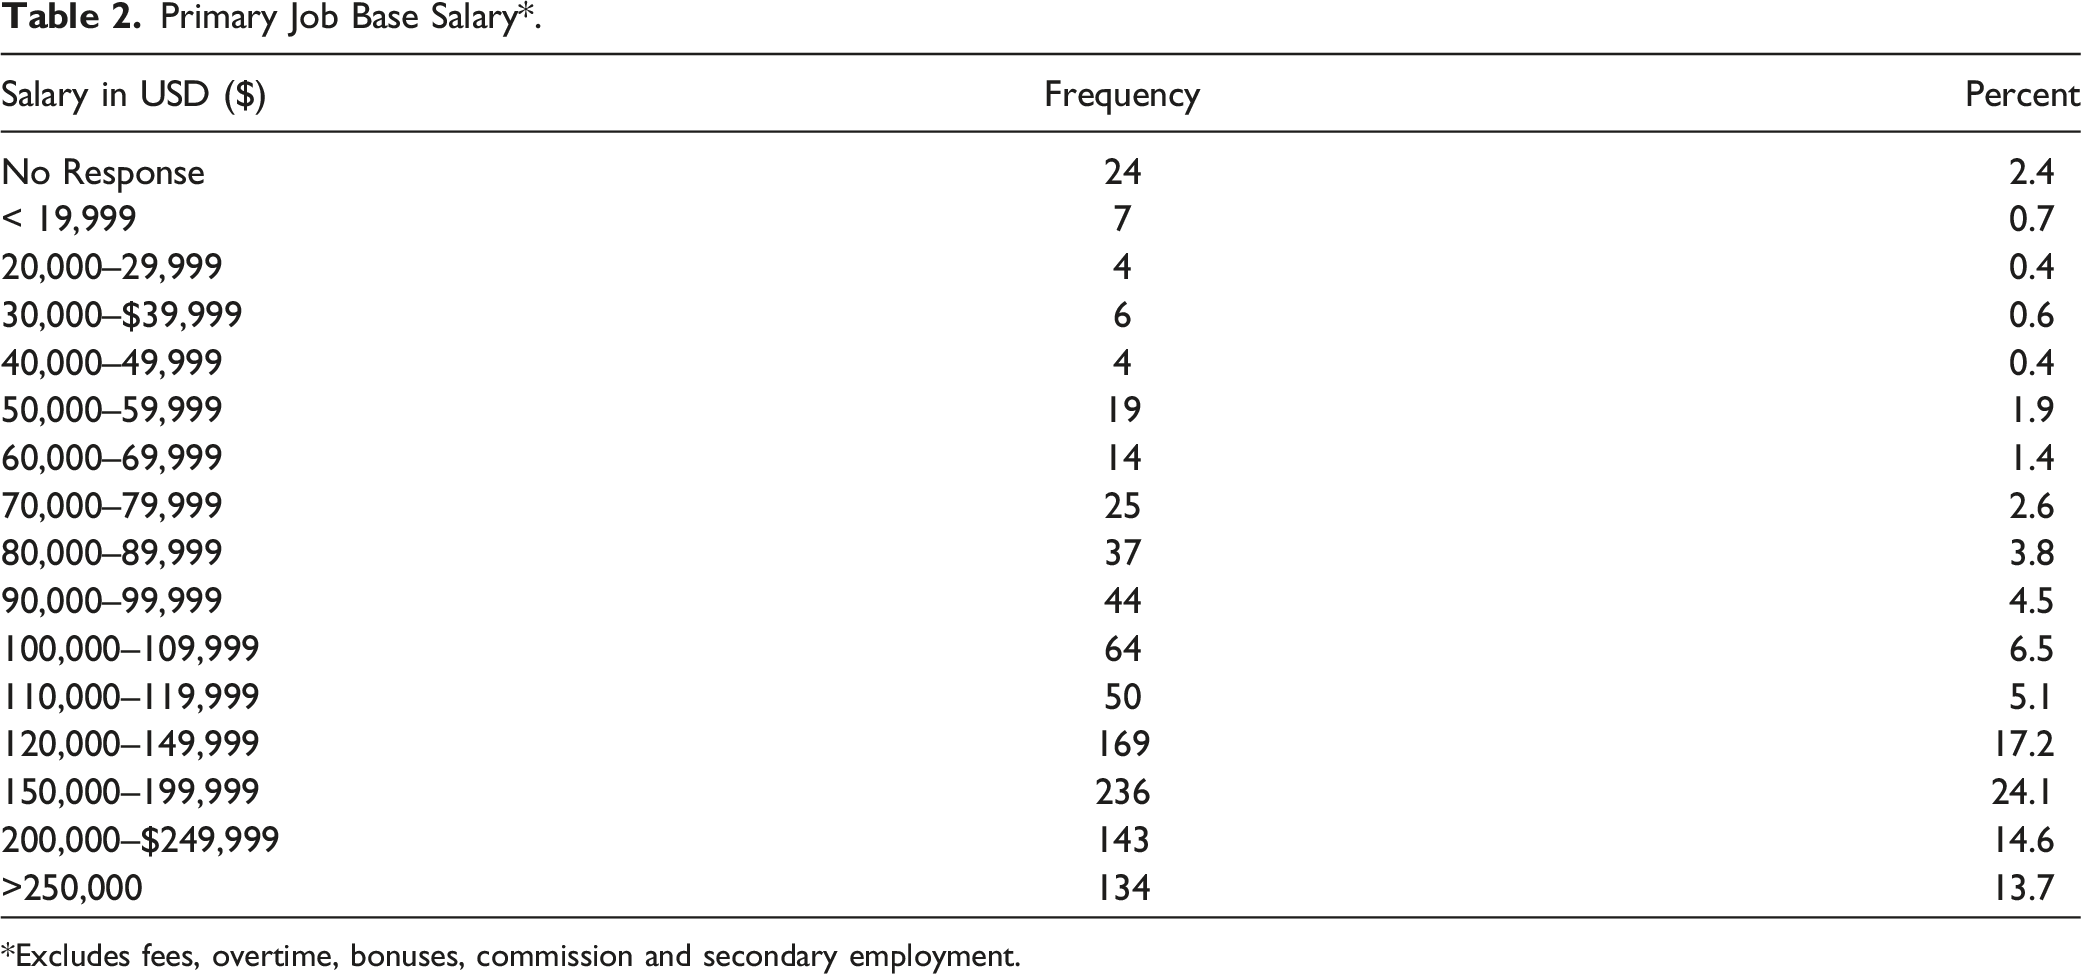
*Excludes fees, overtime, bonuses, commission and secondary employment.
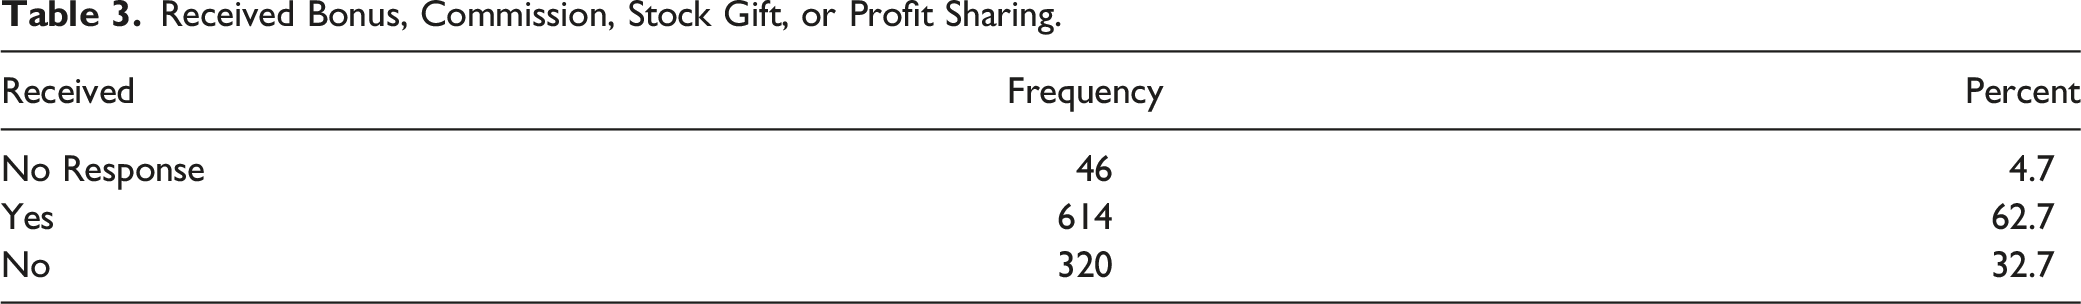
Received Bonus, Commission, Stock Gift, or Profit Sharing.
Additional Professional Income Outside Primary Employer.
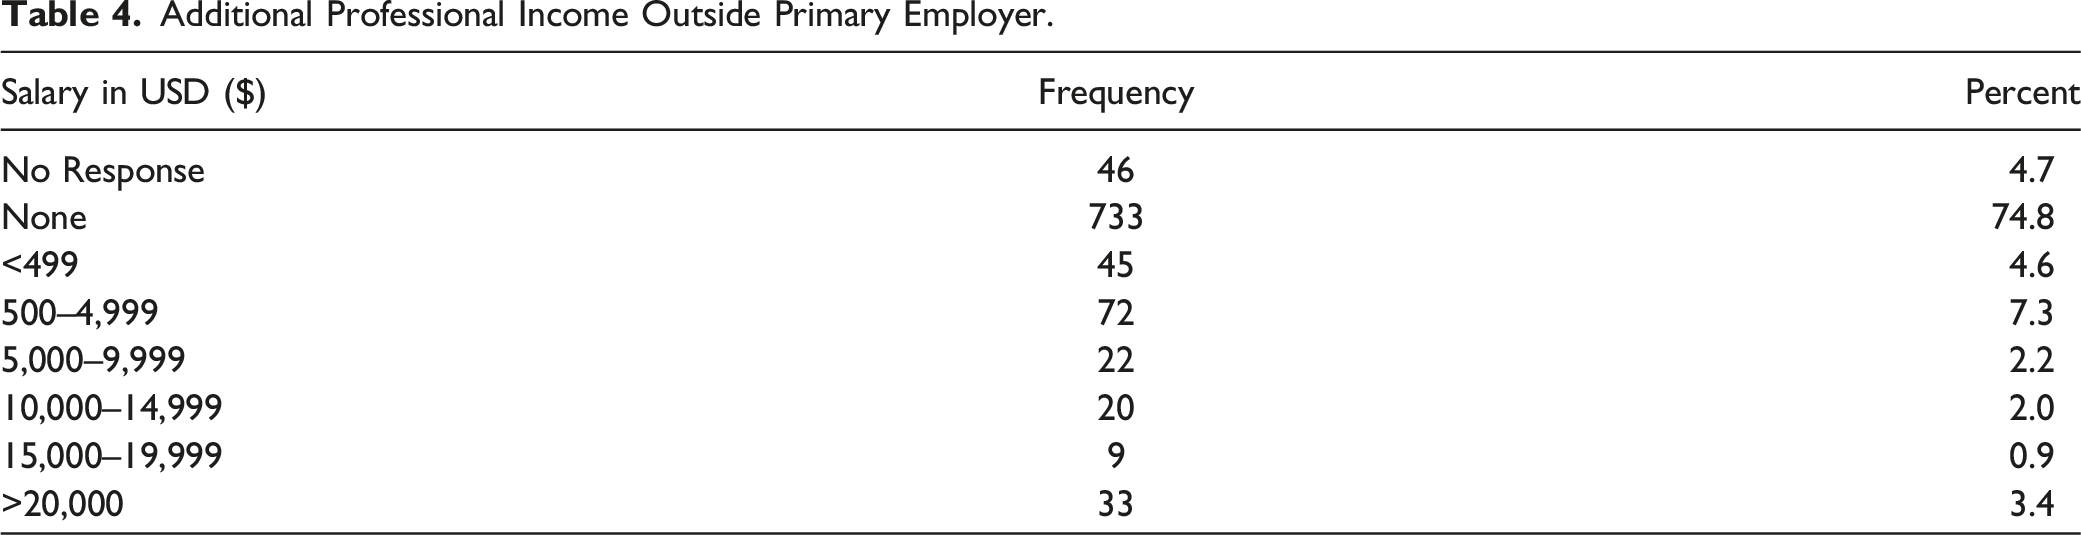
Salary estimates for purposes of calculation were taken to be the midpoint of the range by each cohort, e.g. for the salary range of $90,000-$99,999, a mean value of $95,000 was used in all calculations. In addition, there was a significant number of incomplete responses that required further estimation by statistical methods. The incomplete responses and the methods used to handle them were: • Fourteen (14) respondents did not indicate a gender. These results were not included in the breakdowns. • Twelve (12) respondents indicated a salary >$250,000 without writing in the actual amount in the area provided. The salary used for calculation was $250,000. This probably led to a bias towards lower average values. • One hundred eight six (186) respondents indicated they received bonuses, commission, stock options, or profit sharing without indicating the amount. These were excluded from consideration.
US Doctoral Annual Salaries.
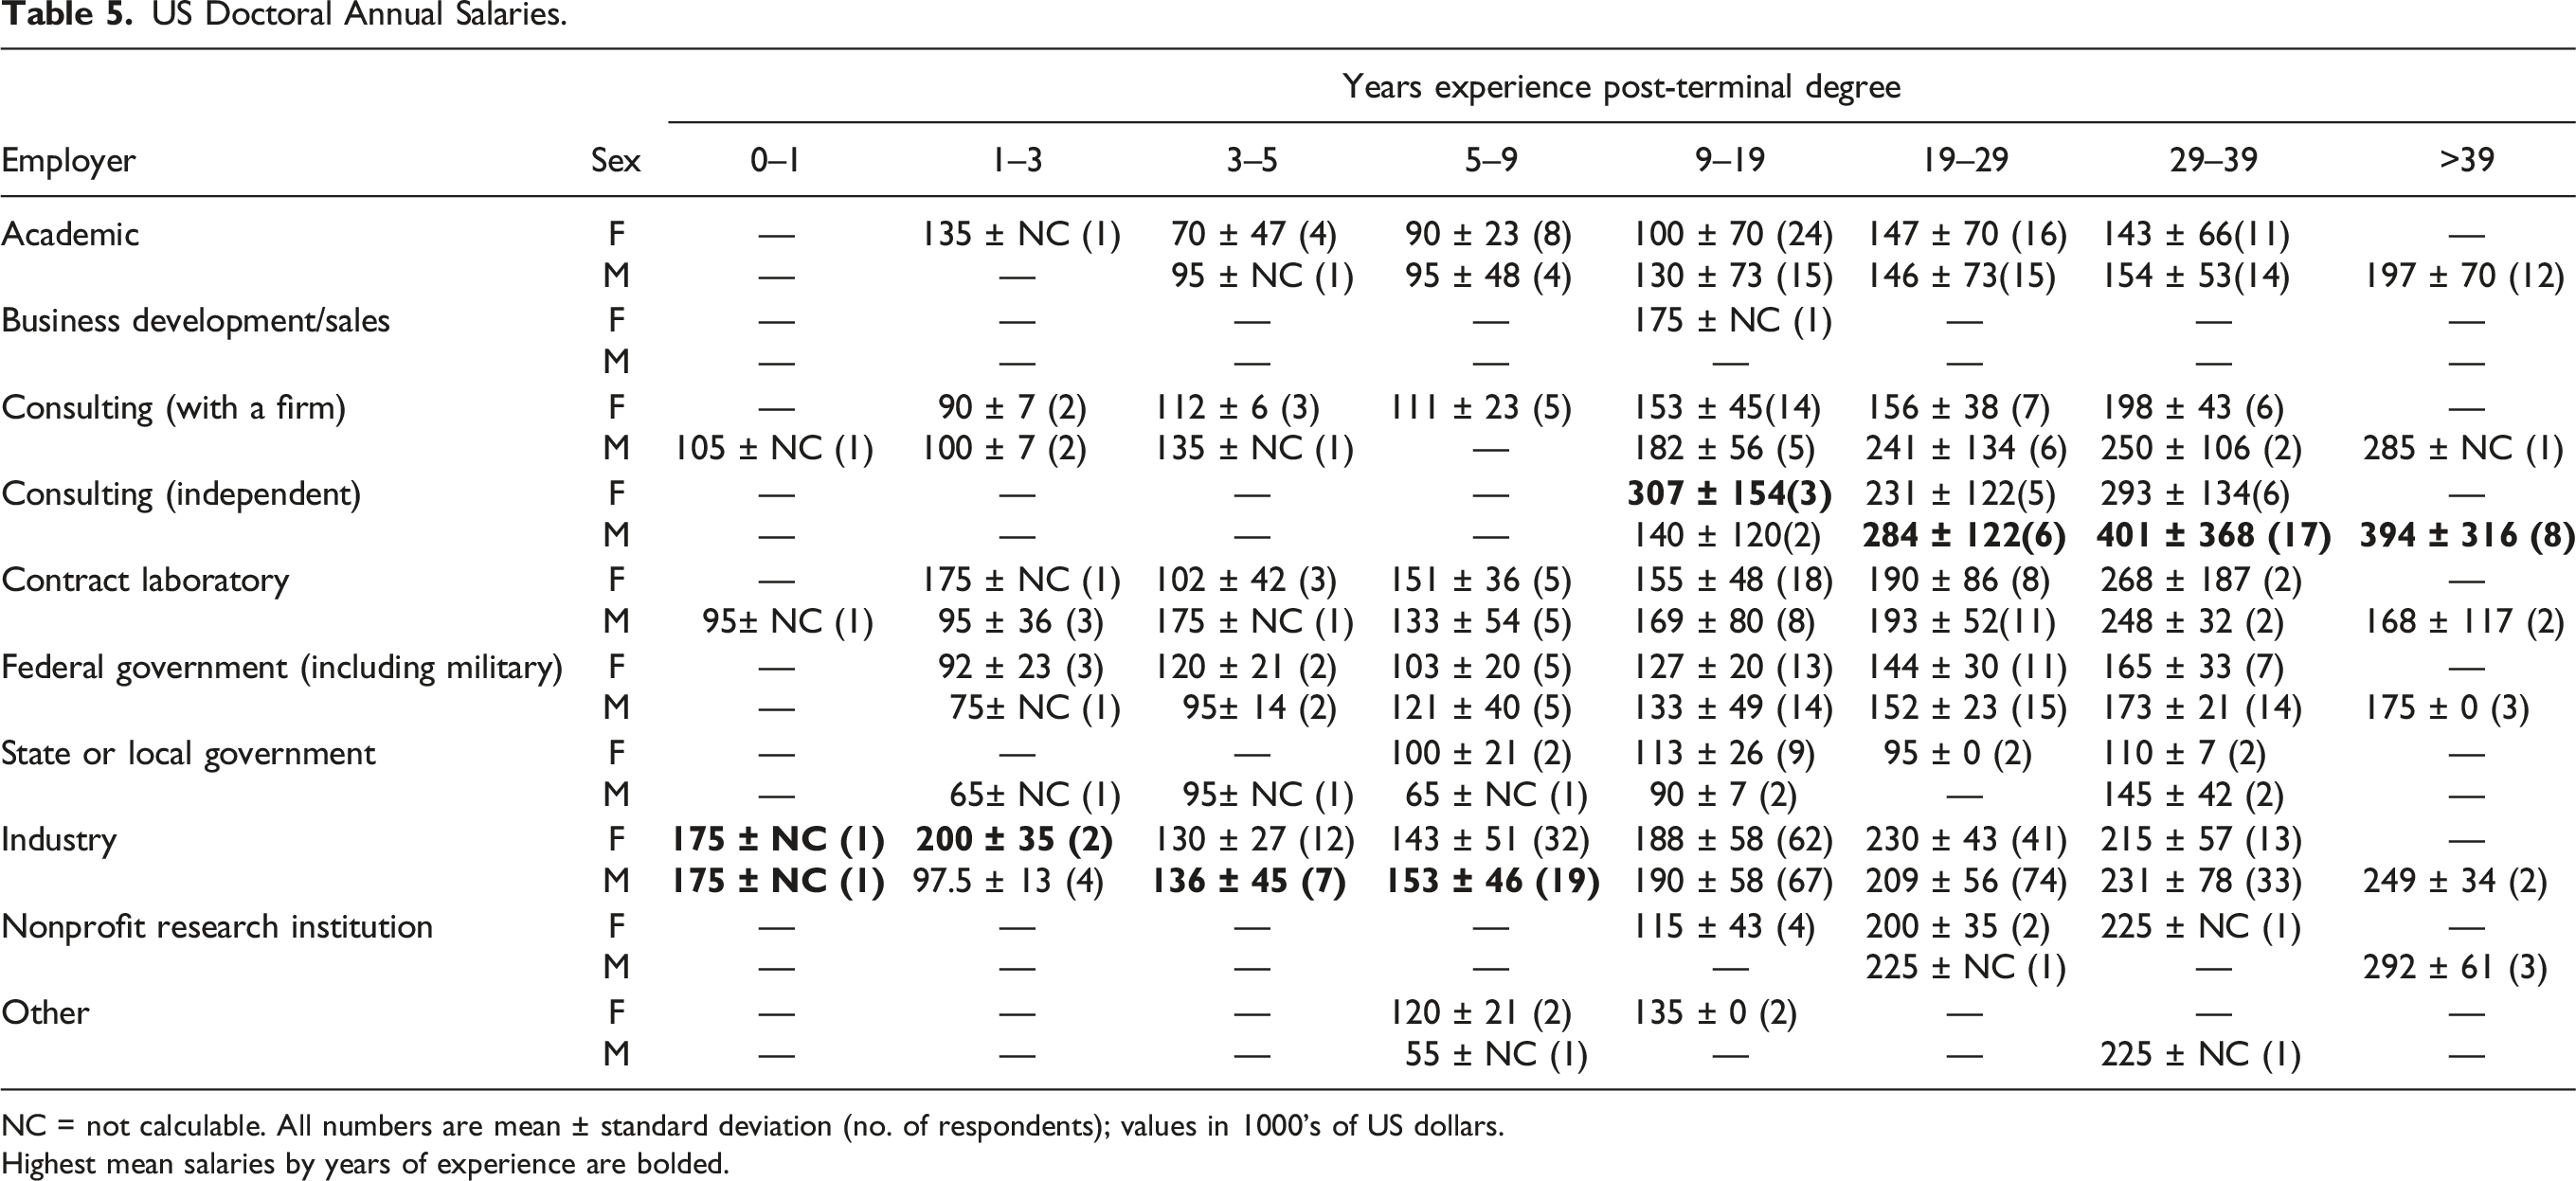
NC = not calculable. All numbers are mean ± standard deviation (no. of respondents); values in 1000’s of US dollars.
Highest mean salaries by years of experience are bolded.
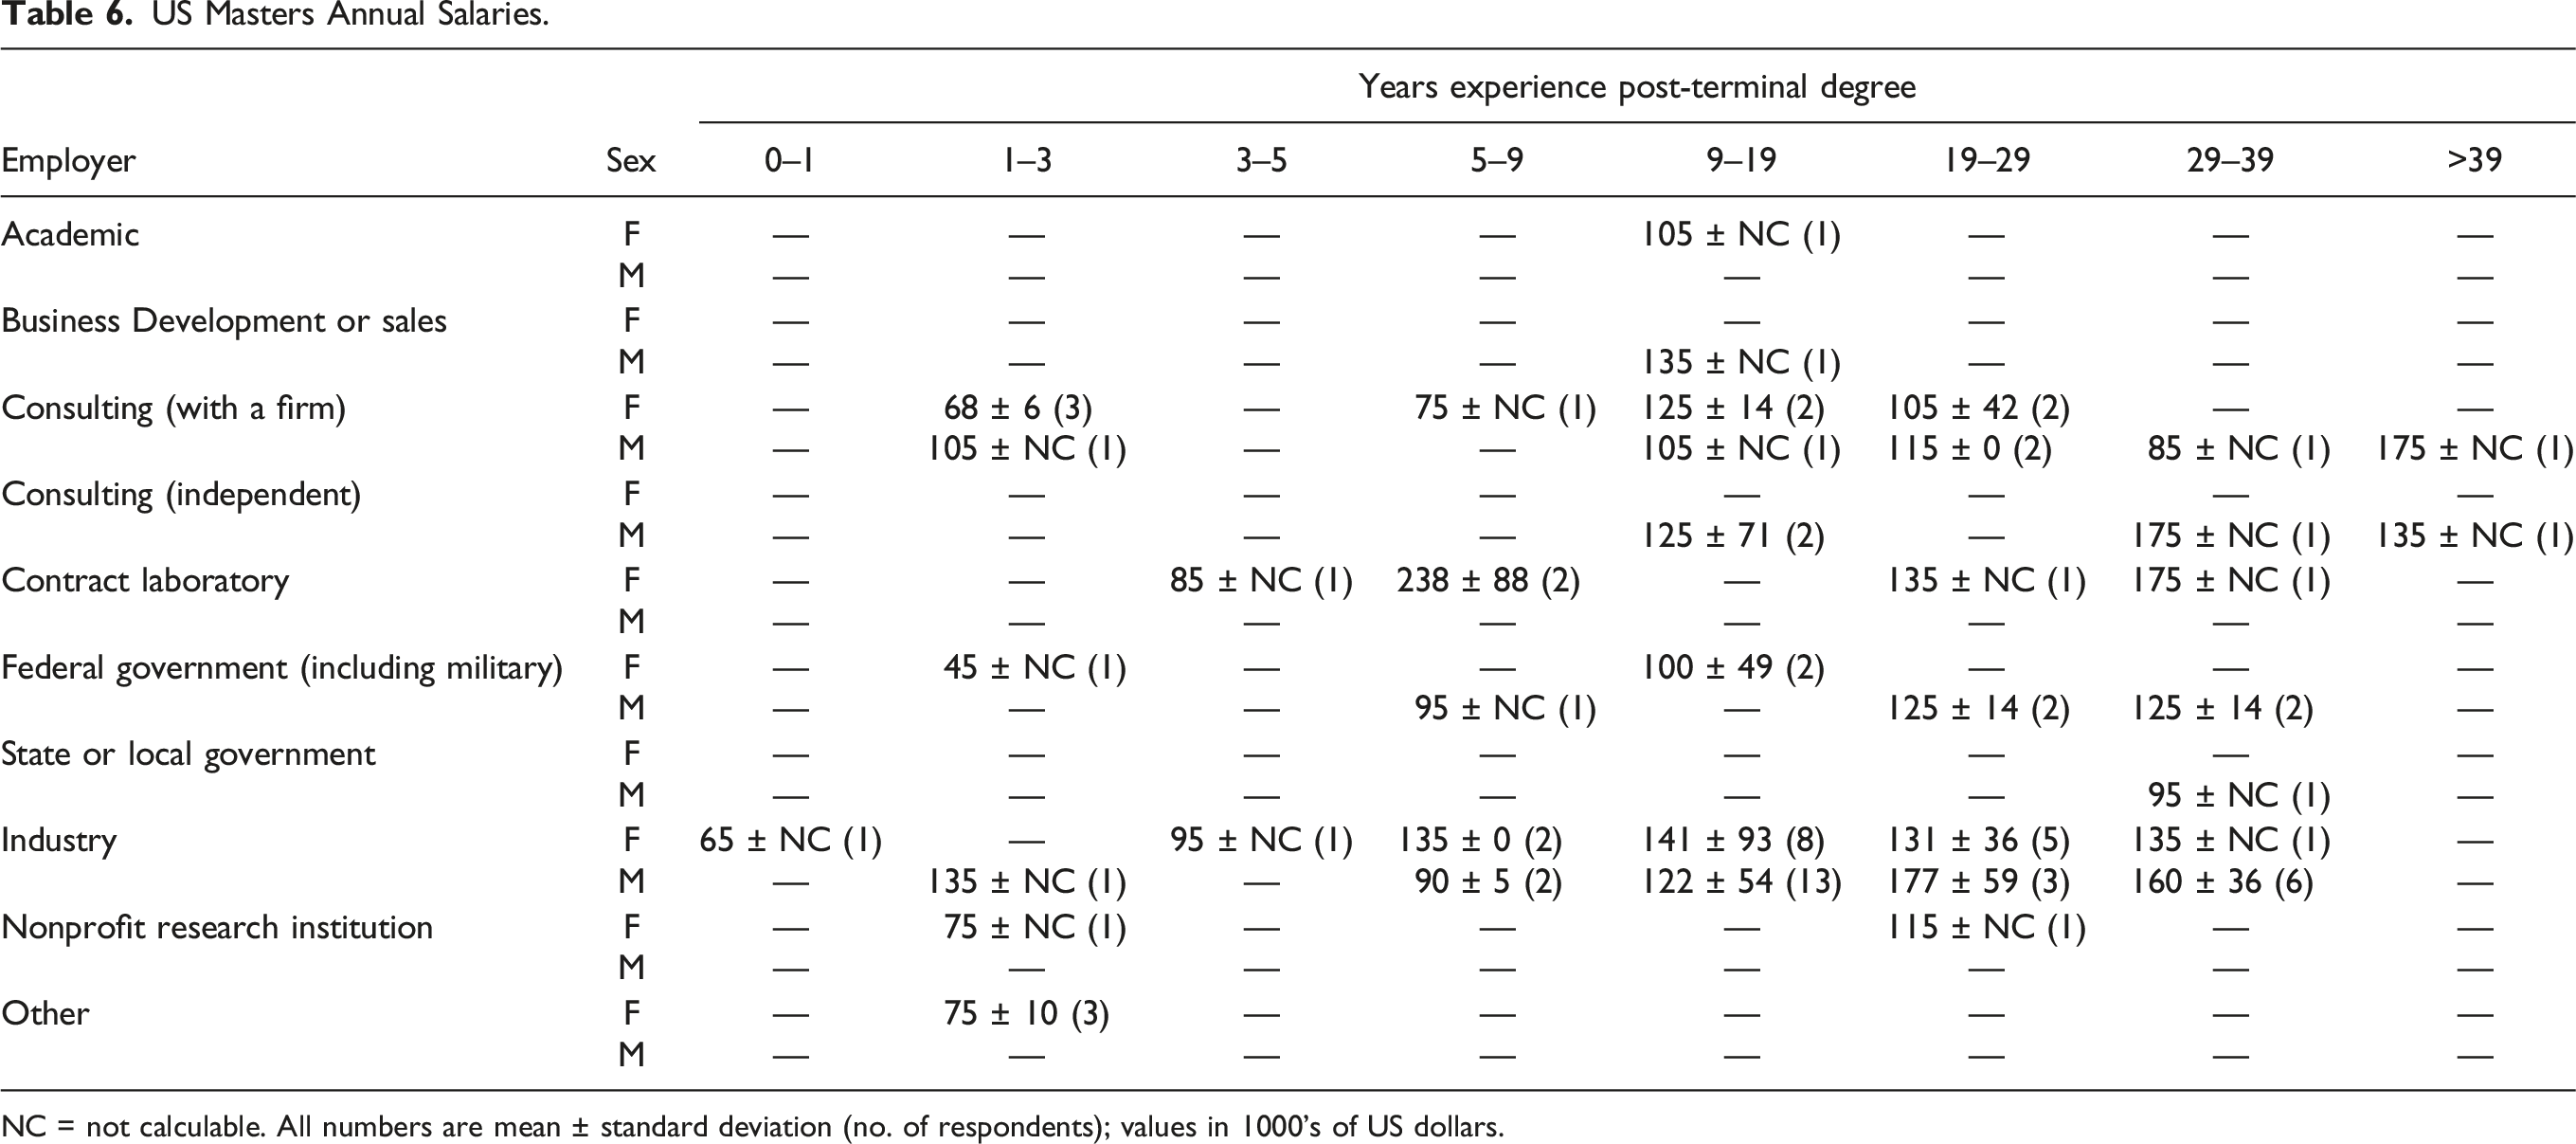
The mean salaries (± 1 SD) for the 136 master’s level respondents from the U.S. are presented in Table 6. Likewise, the results from the 60 bachelor’s level respondents are presented in Table 7. The remaining respondents were not employed full-time during the reporting period and are characterized as follows: Graduate and Postdoctoral students (10) Working part-time (42) Retired (41) Other (9) US Masters Annual Salaries. NC = not calculable. All numbers are mean ± standard deviation (no. of respondents); values in 1000’s of US dollars. US Bachelors Annual Salaries. NC = not calculable. All numbers are mean ± standard deviation (no. of respondents); values in 1000’s of US dollars
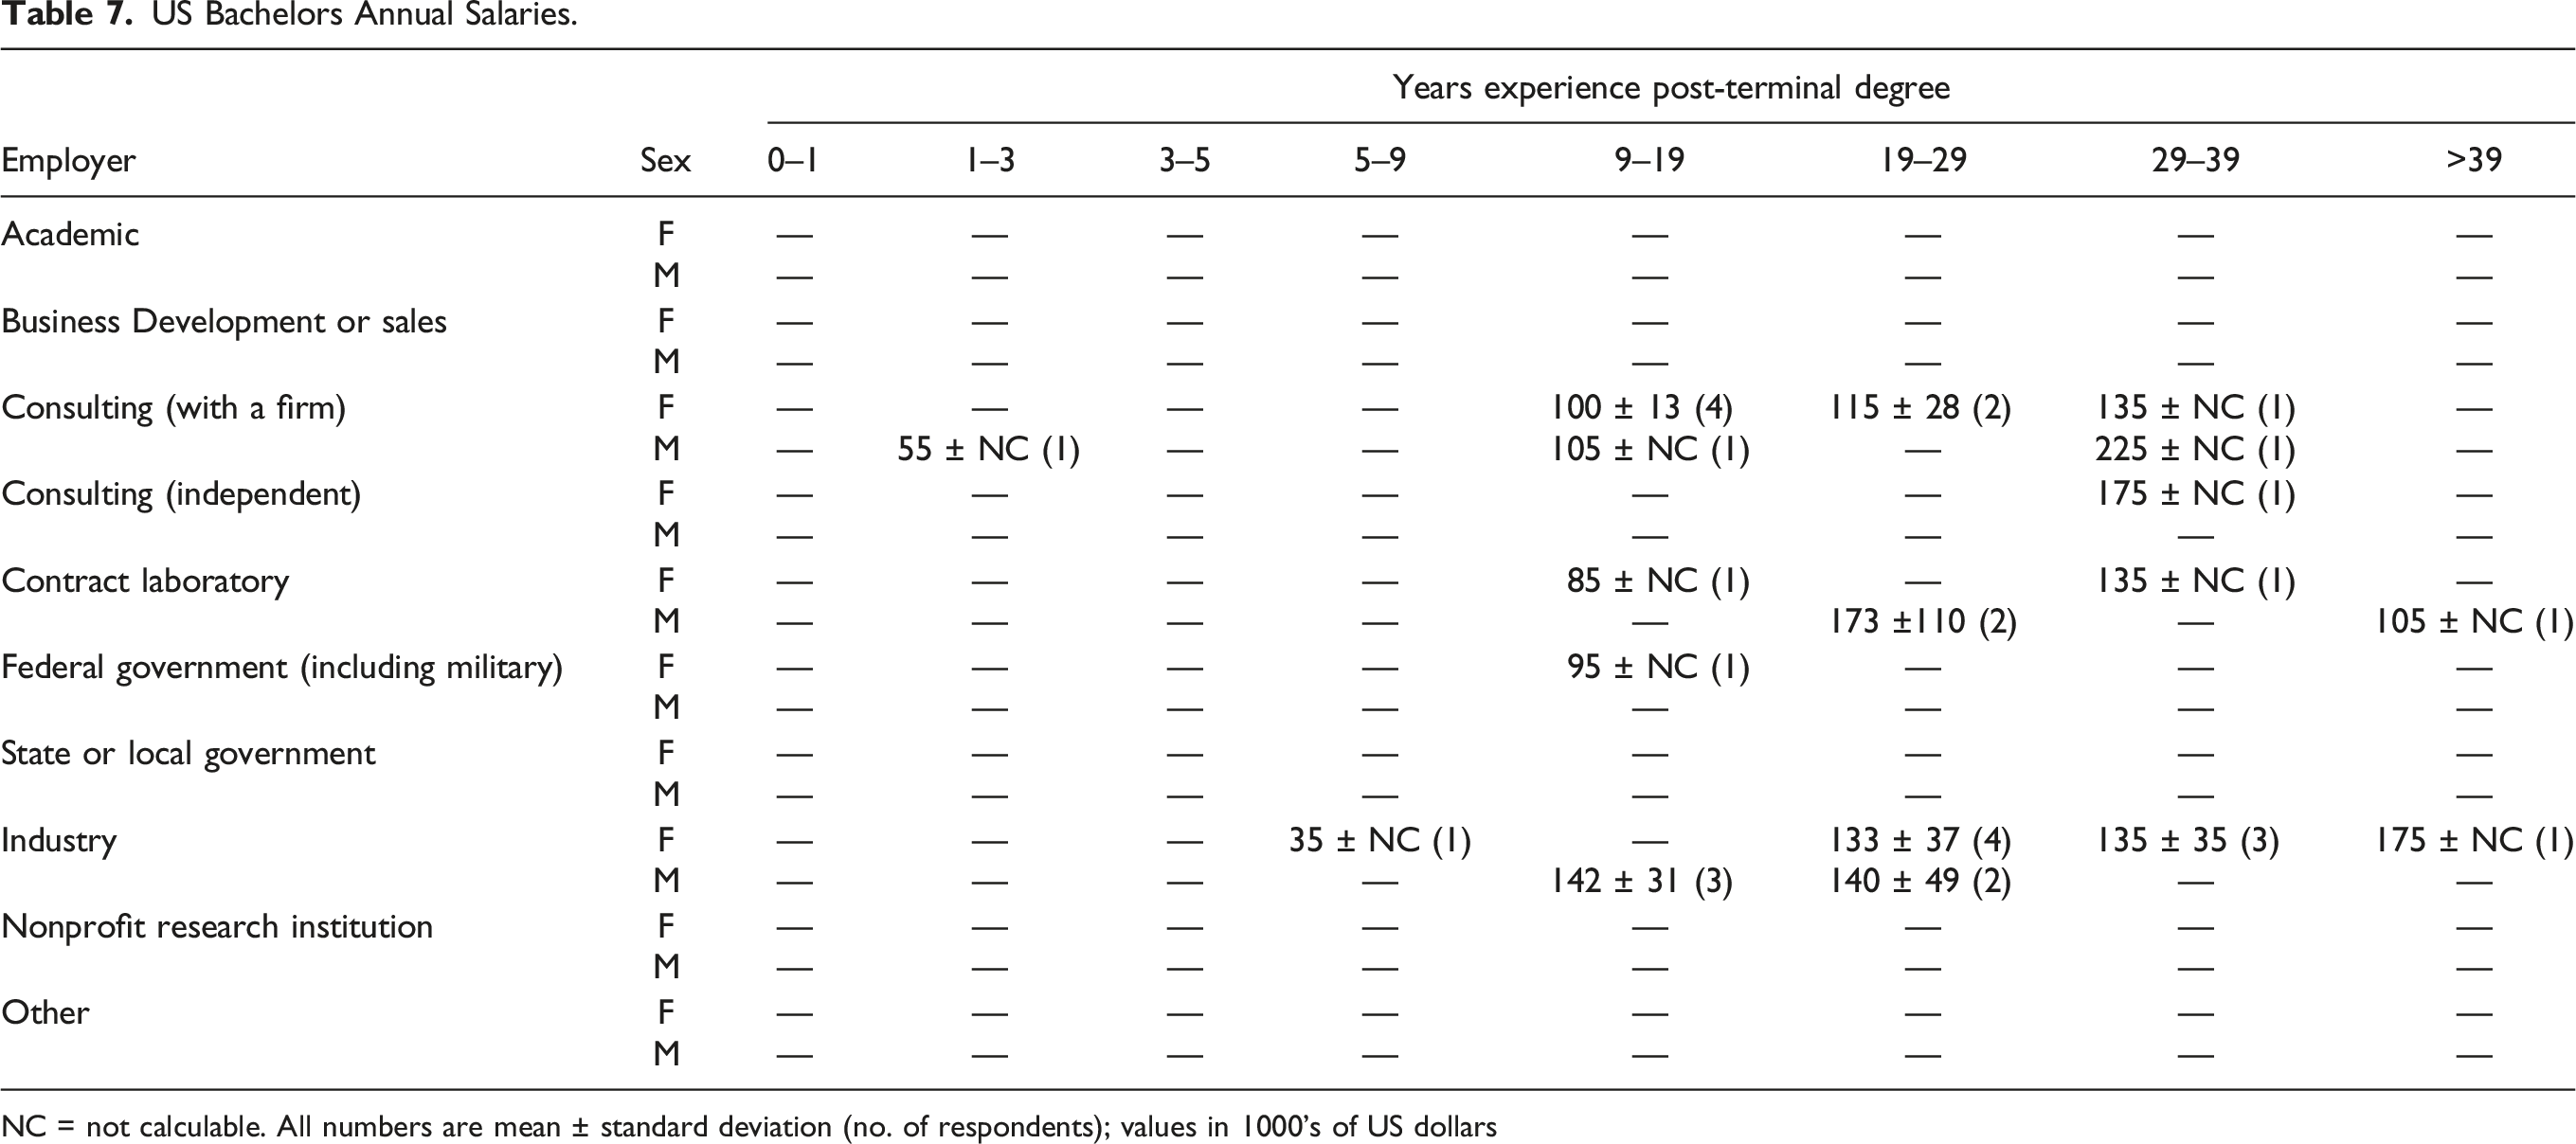
There were no associates degree respondents. This is worrisome and probably reflects those who received the survey rather than actual employed individuals.
US Doctoral Bonus Amounts.
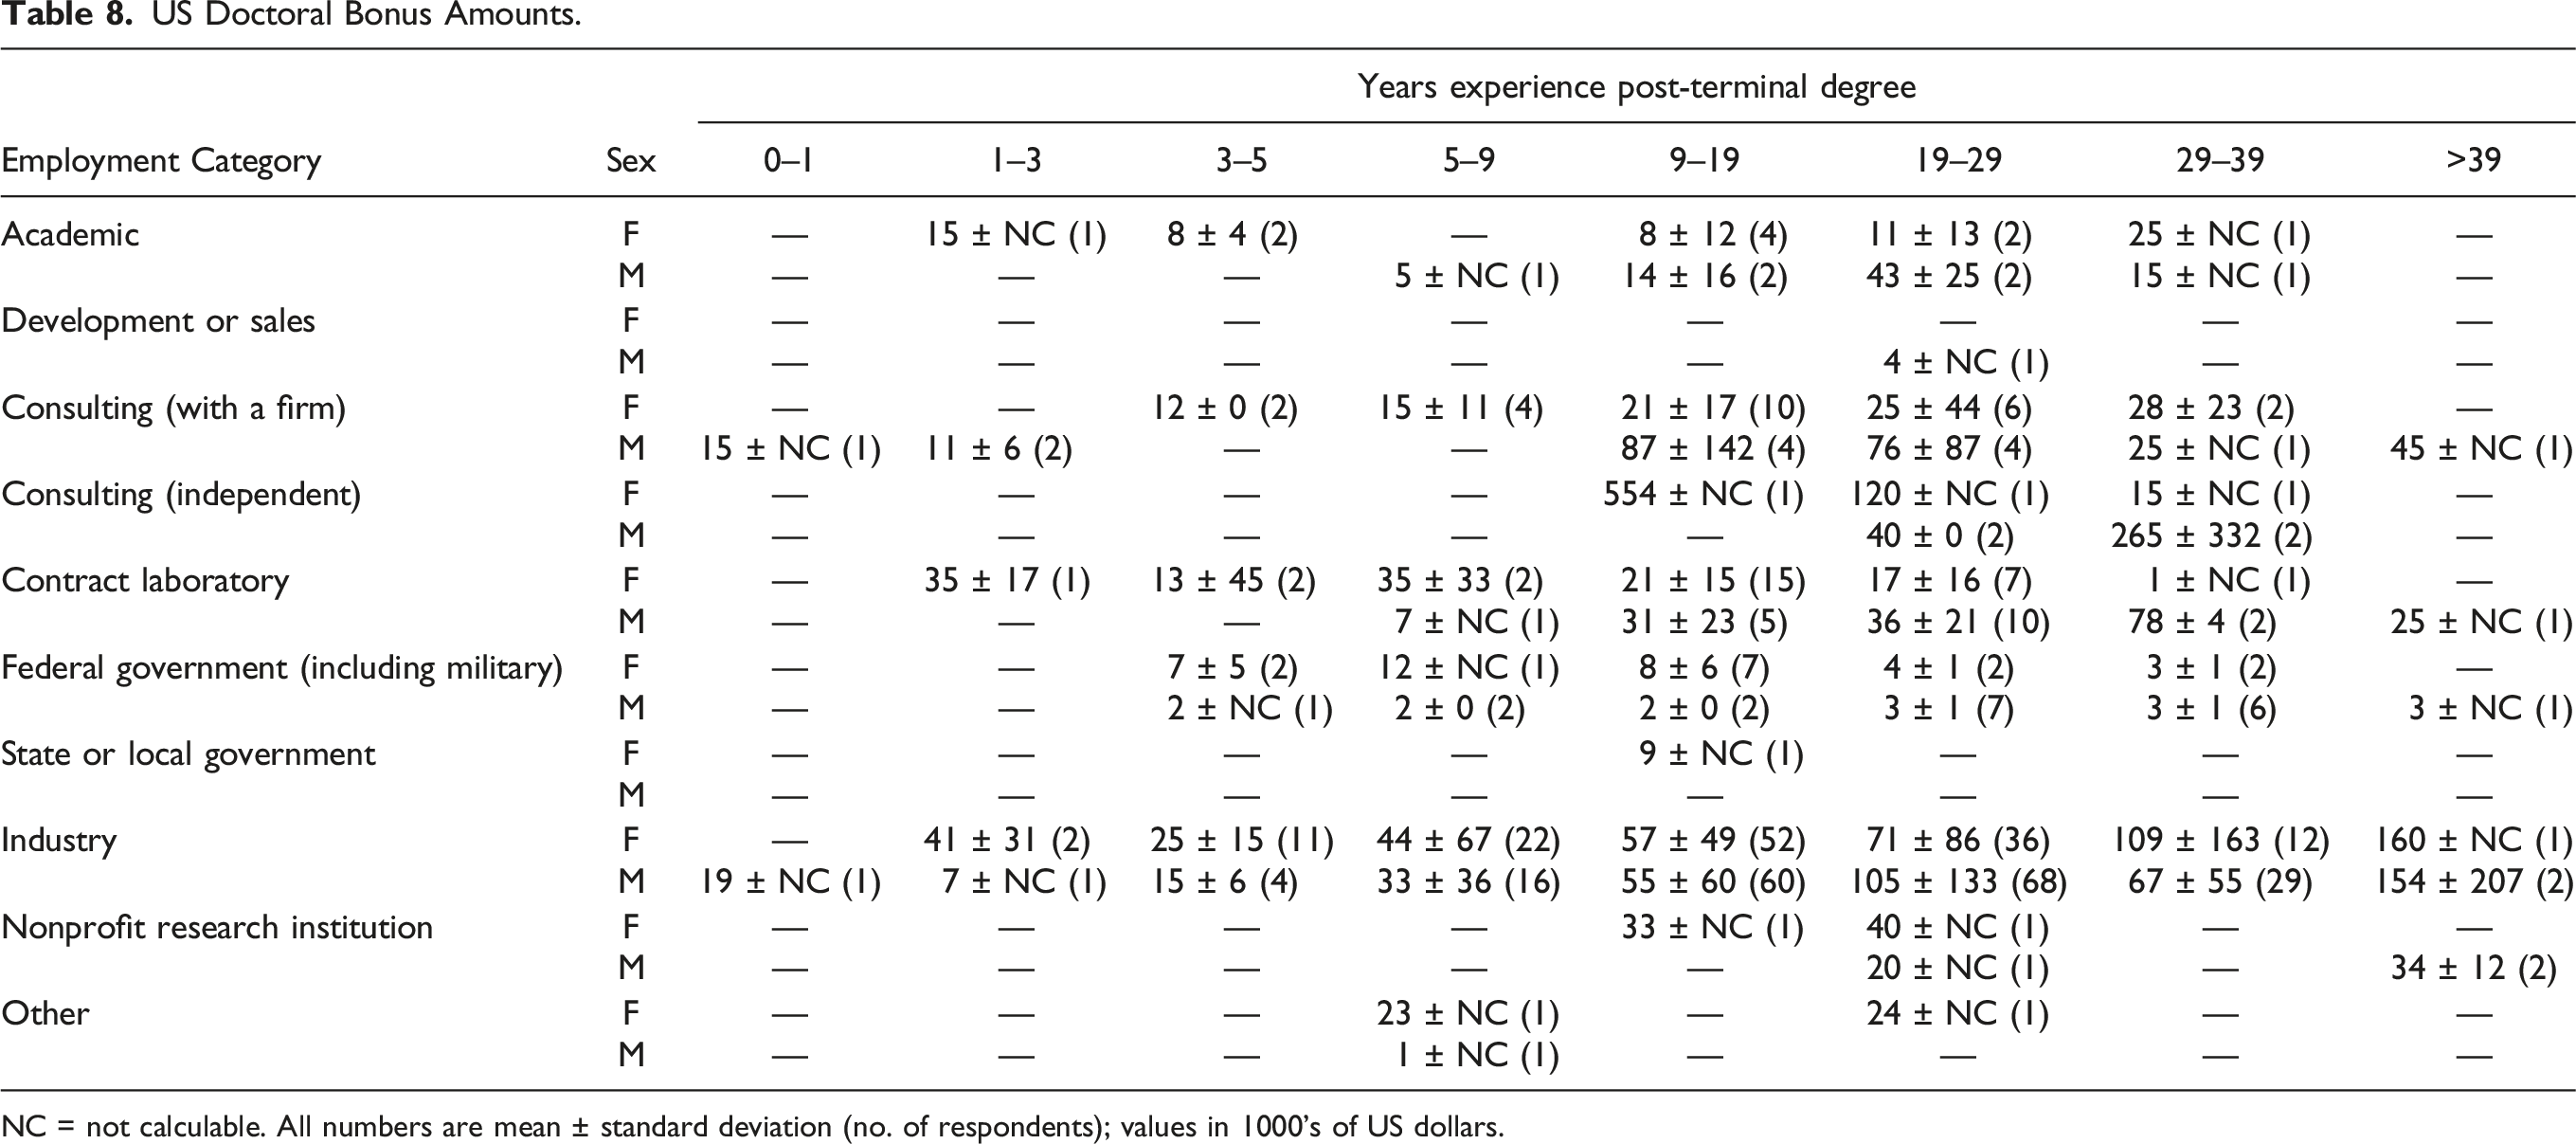
NC = not calculable. All numbers are mean ± standard deviation (no. of respondents); values in 1000’s of US dollars.
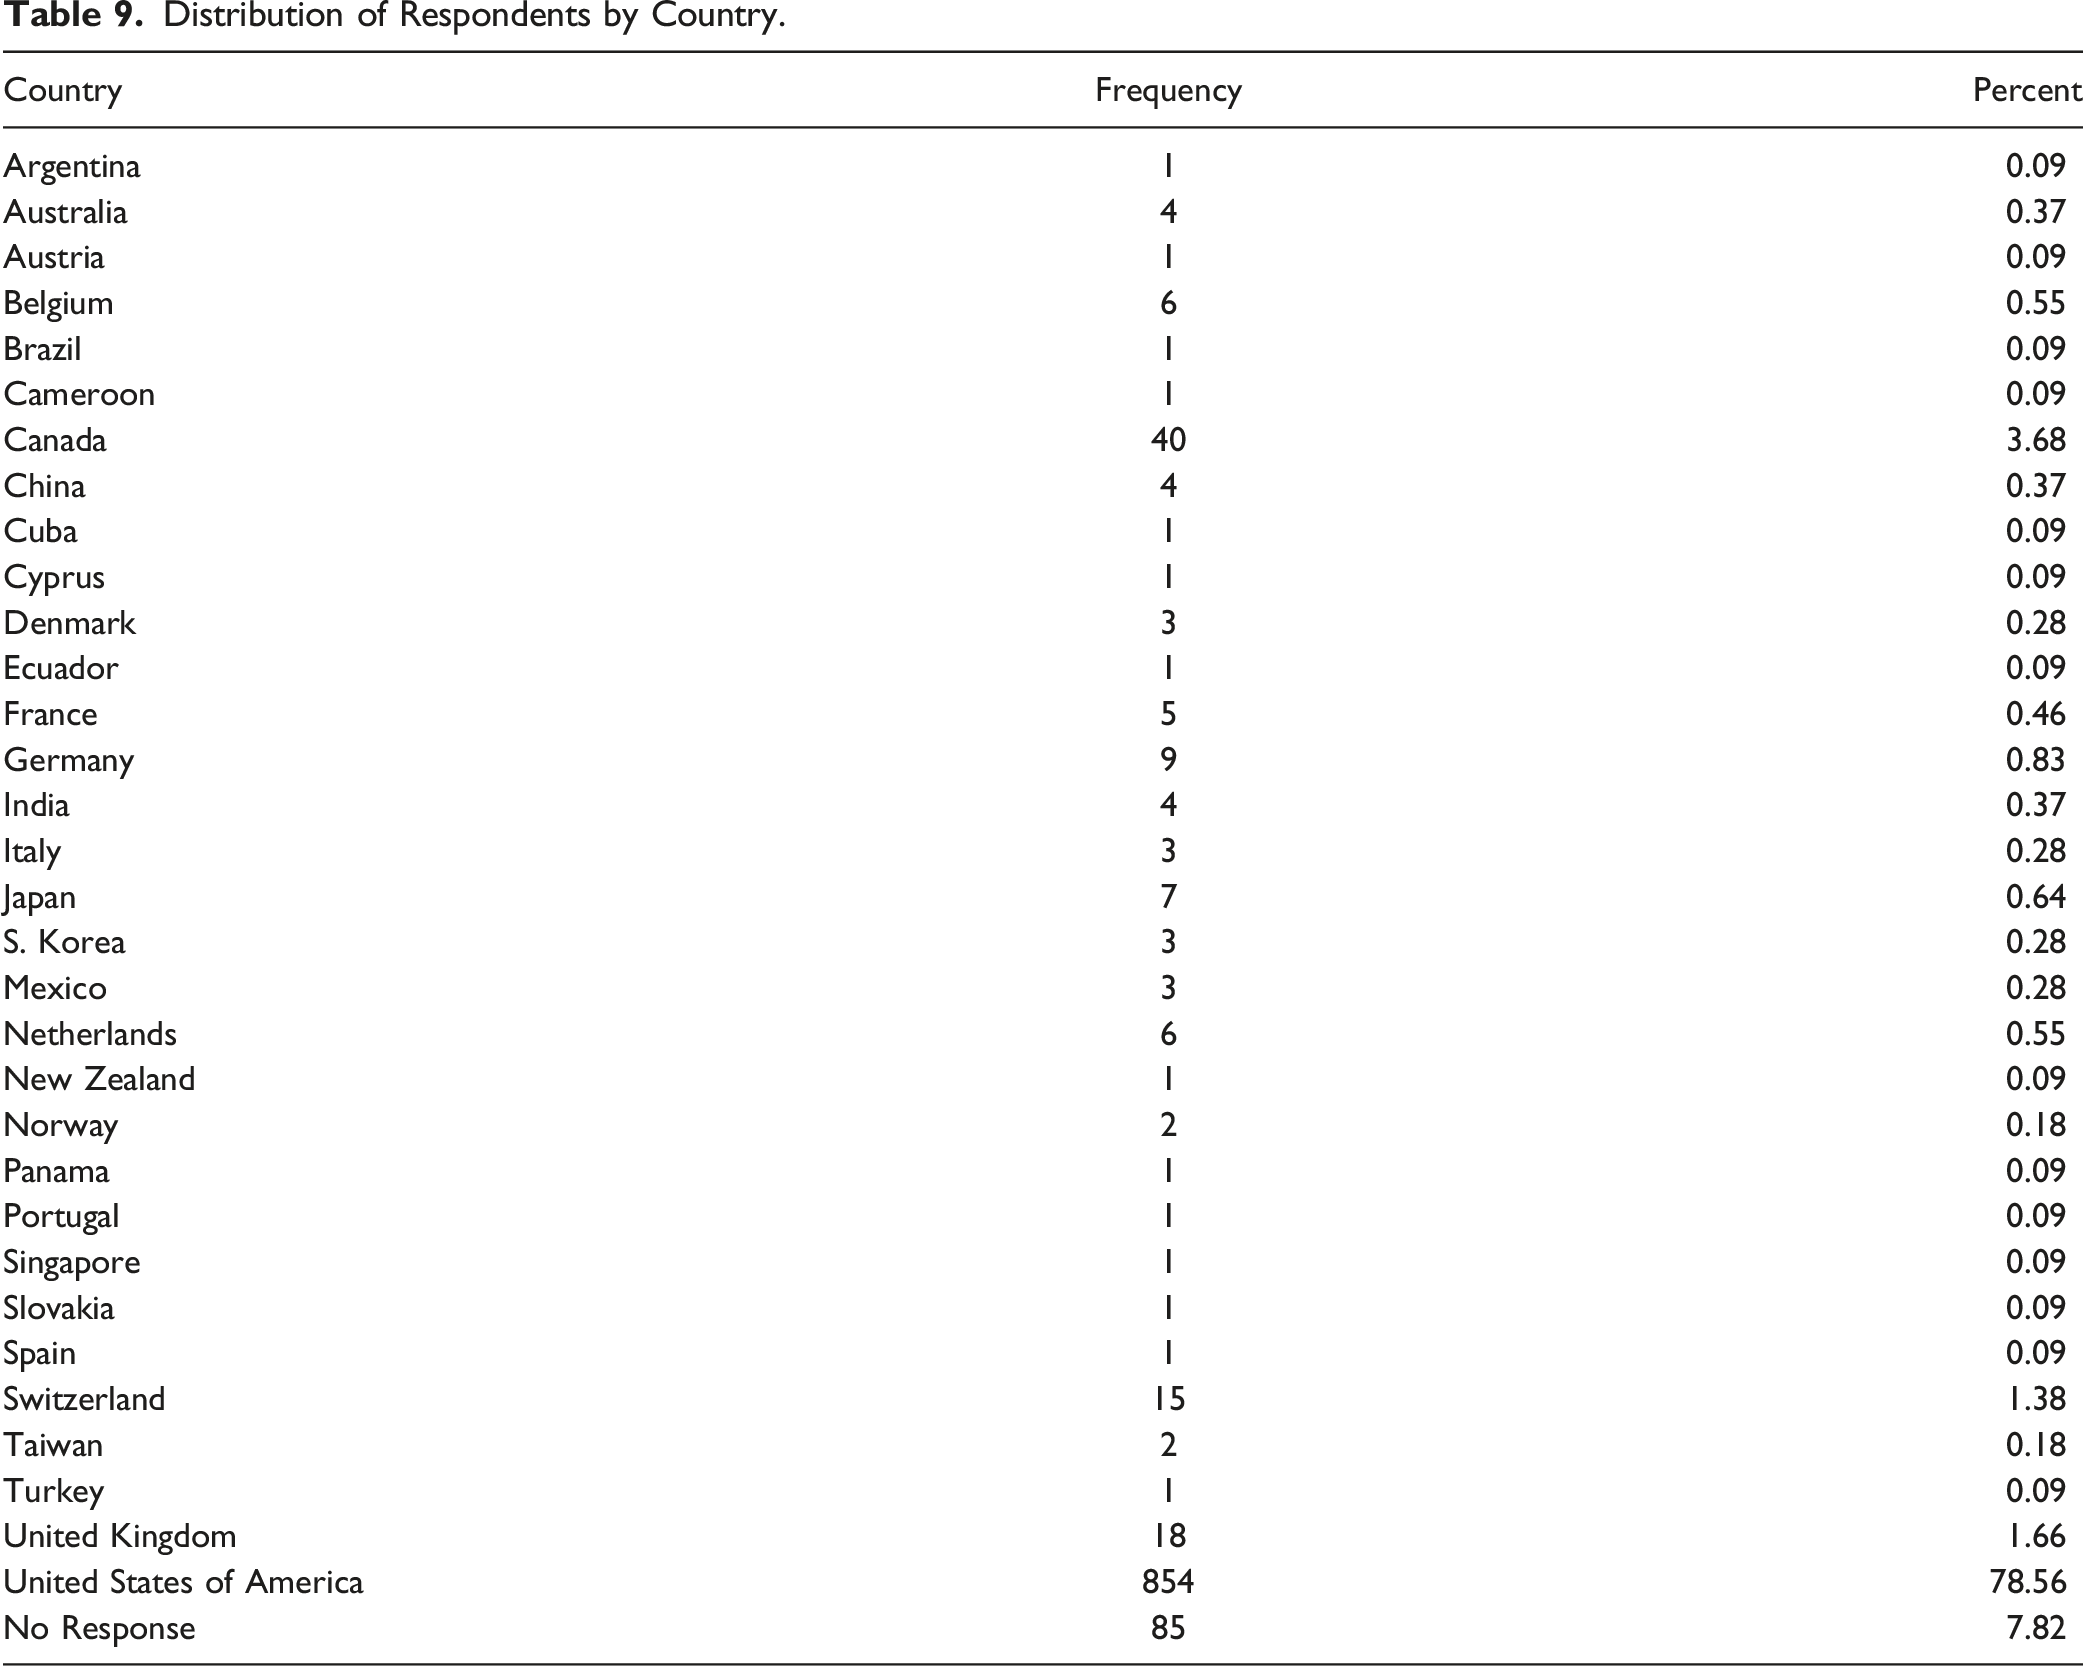
Distribution of Respondents by Country.
2021 Society Membership of Respondents.
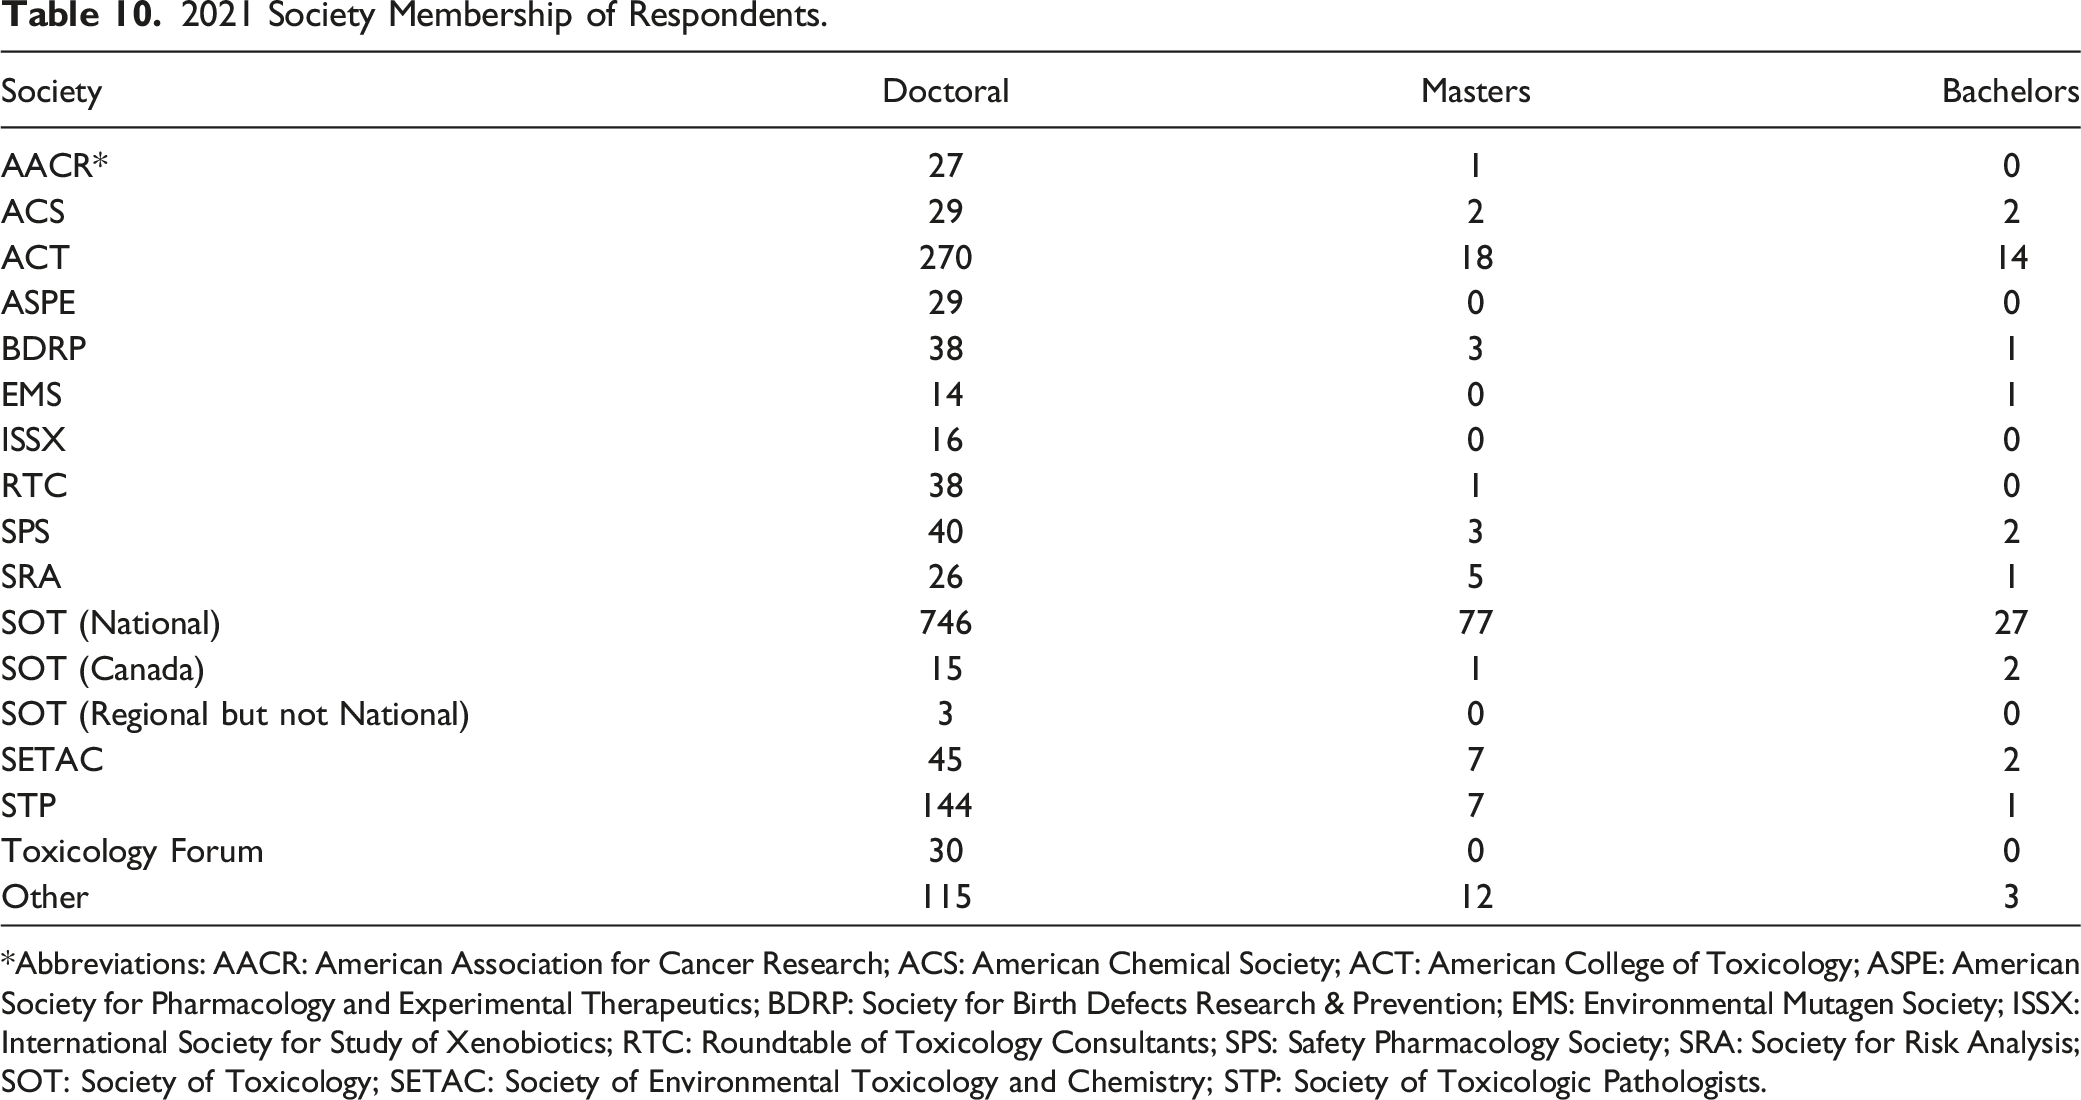
*Abbreviations: AACR: American Association for Cancer Research; ACS: American Chemical Society; ACT: American College of Toxicology; ASPE: American Society for Pharmacology and Experimental Therapeutics; BDRP: Society for Birth Defects Research & Prevention; EMS: Environmental Mutagen Society; ISSX: International Society for Study of Xenobiotics; RTC: Roundtable of Toxicology Consultants; SPS: Safety Pharmacology Society; SRA: Society for Risk Analysis; SOT: Society of Toxicology; SETAC: Society of Environmental Toxicology and Chemistry; STP: Society of Toxicologic Pathologists.
Board Certification and Doctoral Salaries.
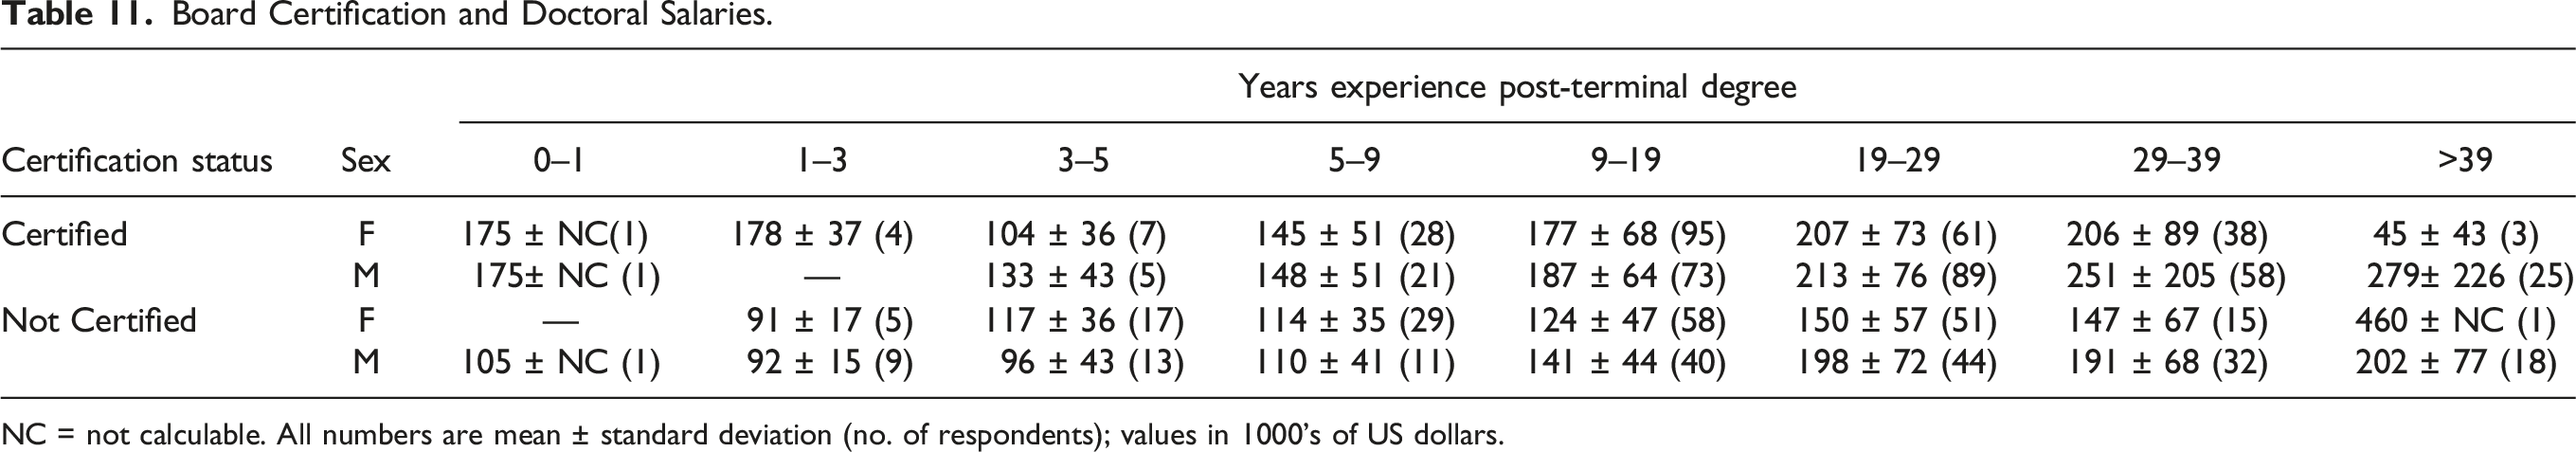
NC = not calculable. All numbers are mean ± standard deviation (no. of respondents); values in 1000’s of US dollars.
US Doctoral Degree Primary Job Base Salary.
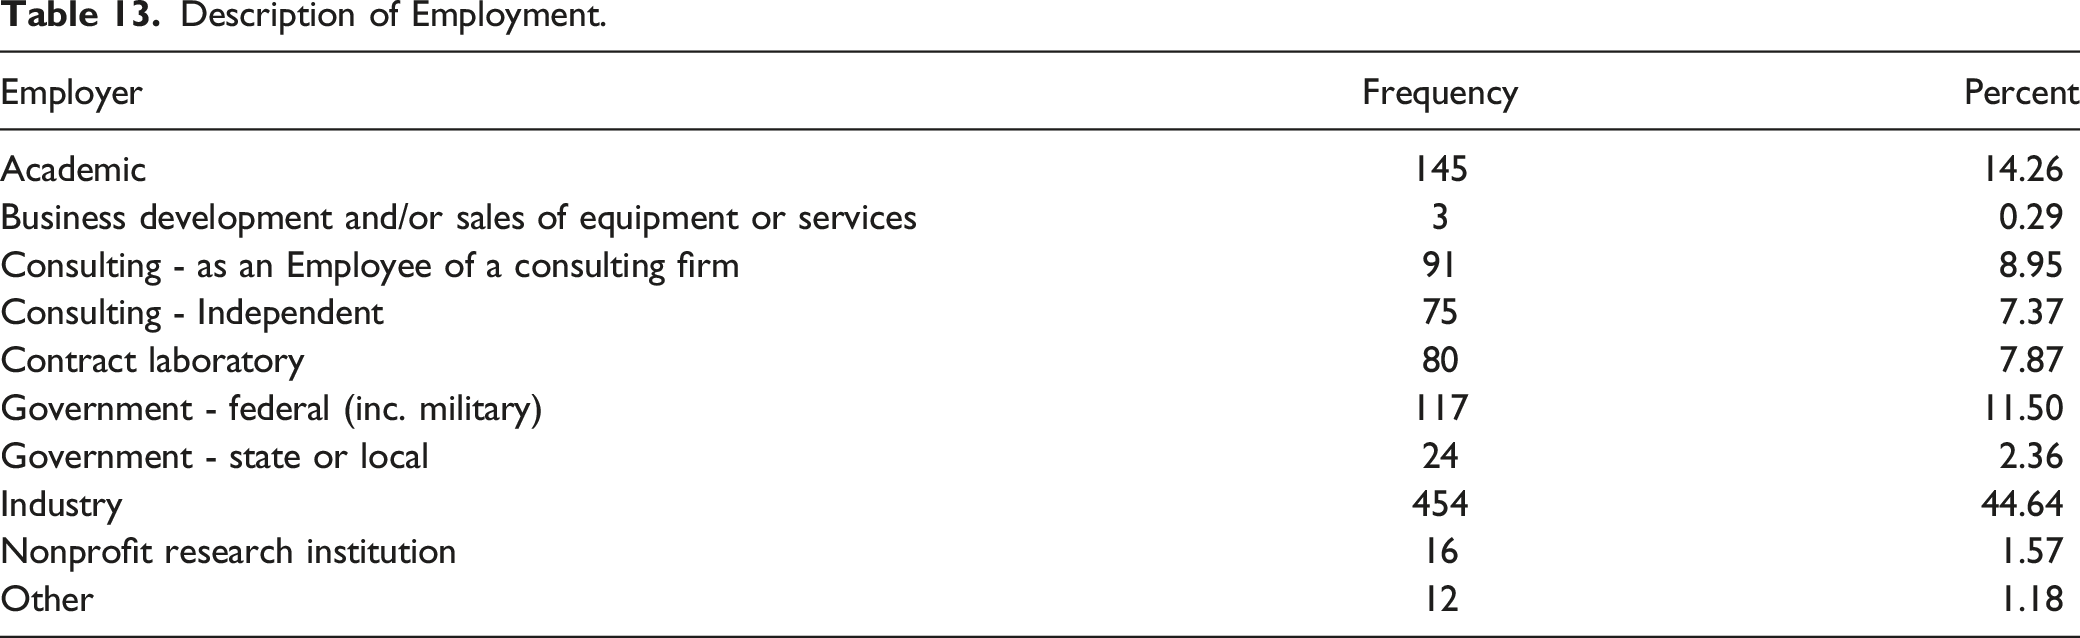
Description of Employment.
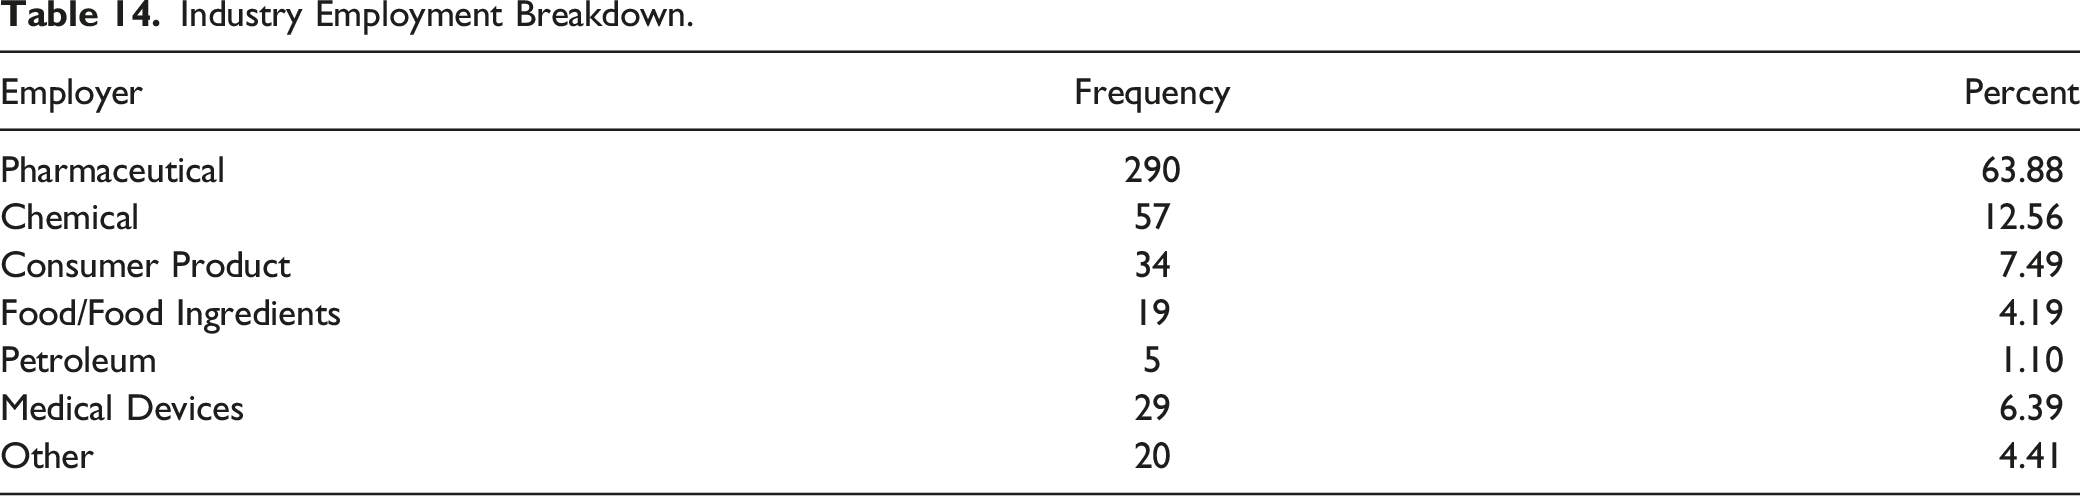
Industry Employment Breakdown.
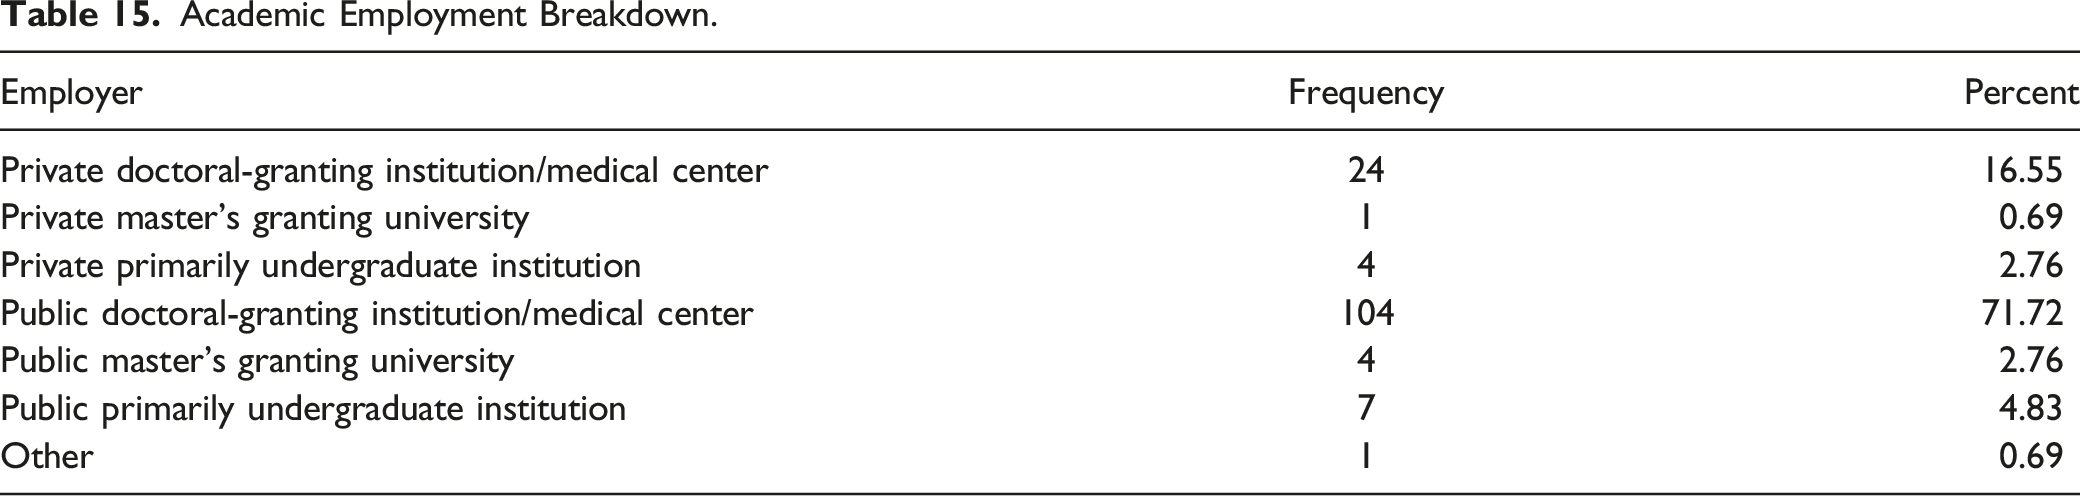
Academic Employment Breakdown.
Industry Salaries for Doctoral Respondents.
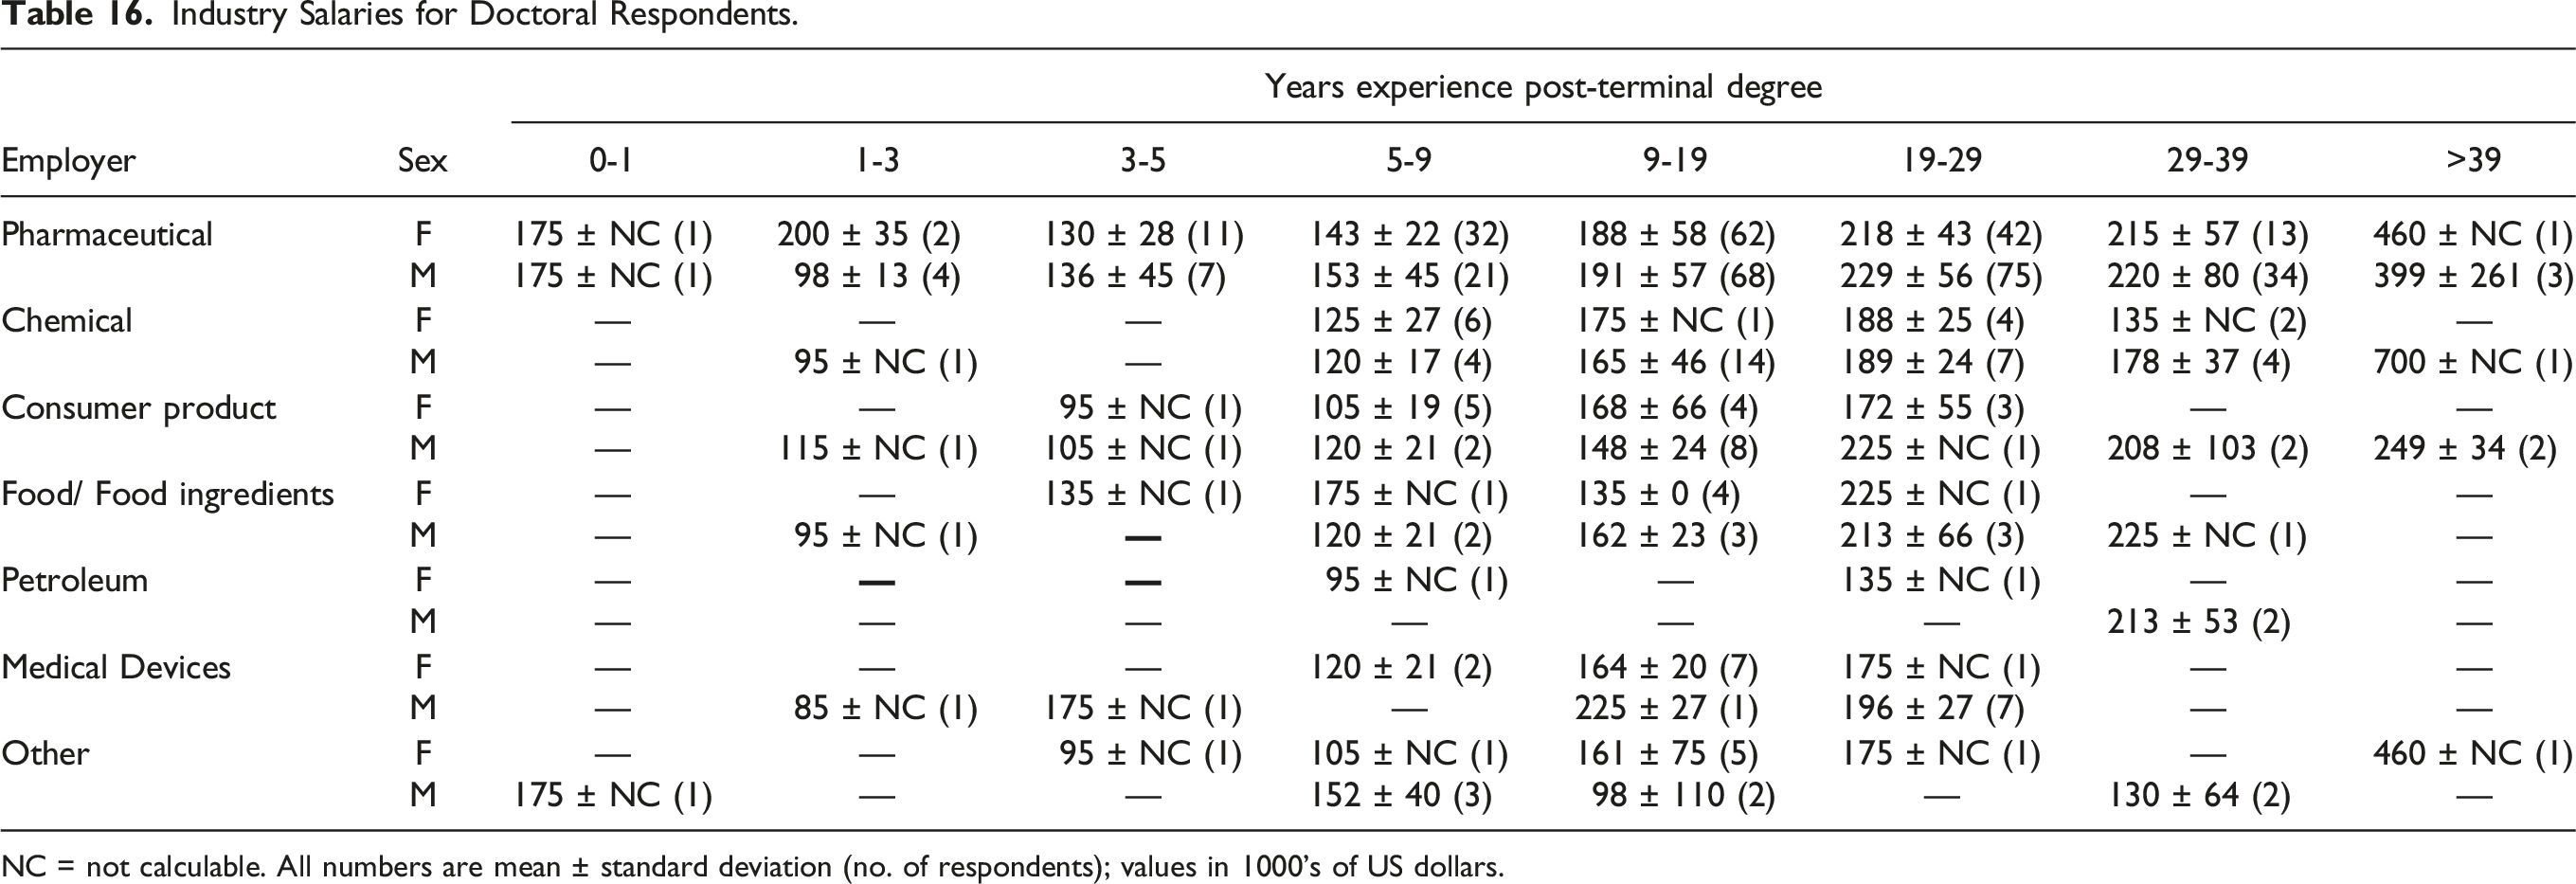
NC = not calculable. All numbers are mean ± standard deviation (no. of respondents); values in 1000’s of US dollars.
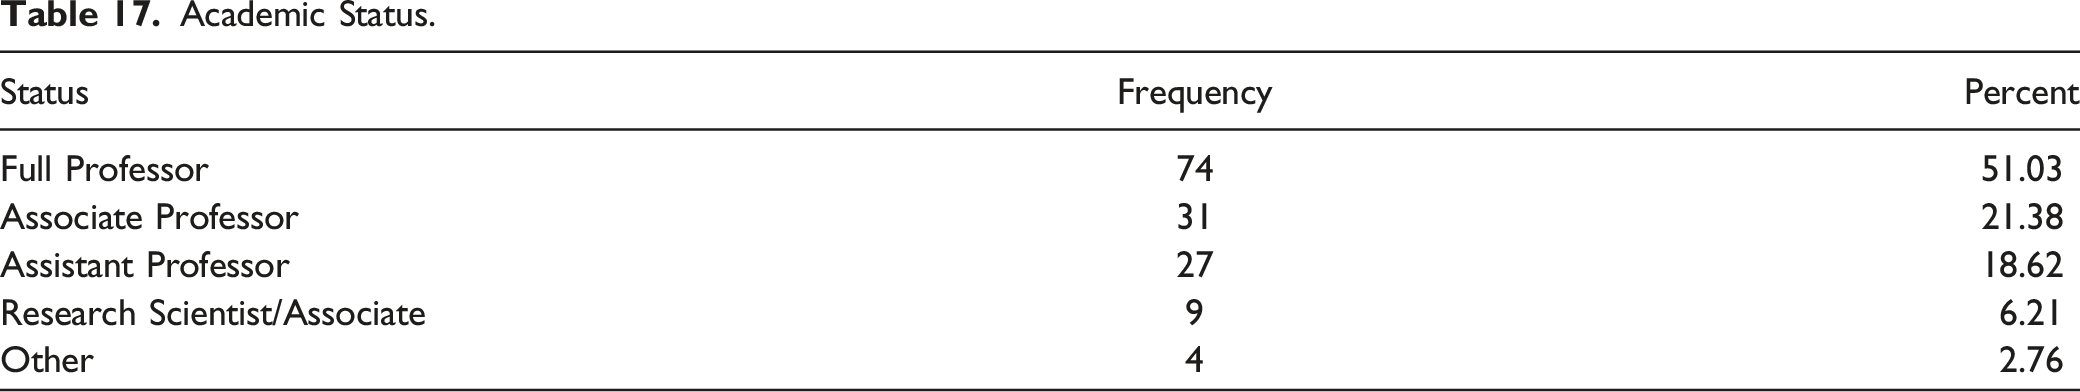
Academic Status.
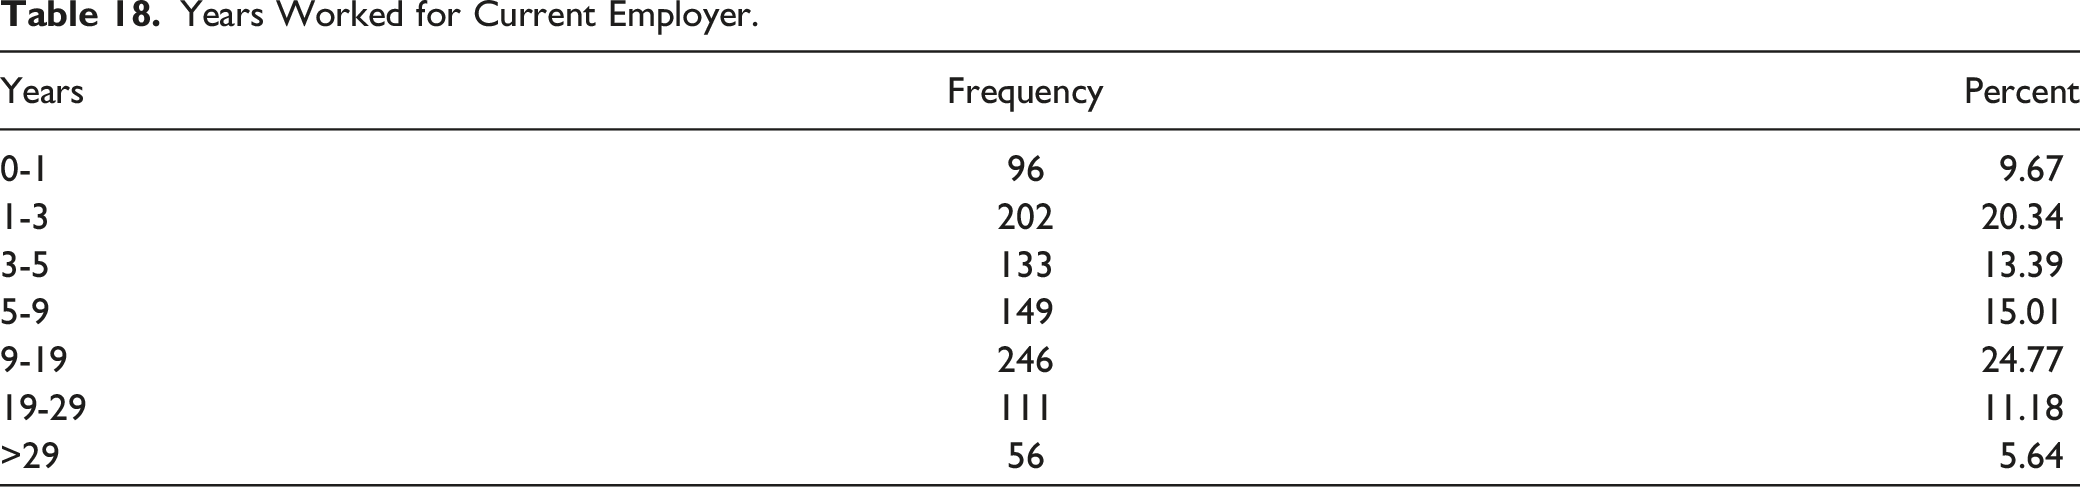
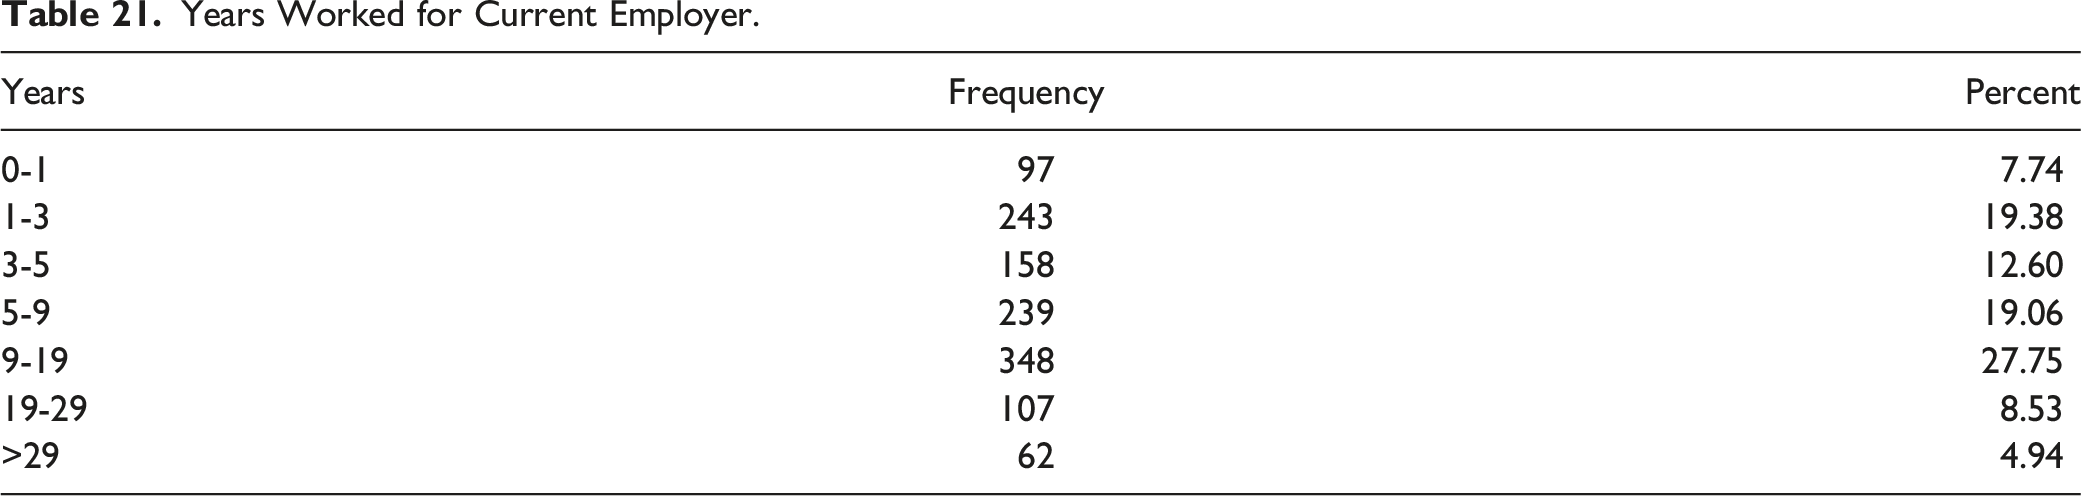
Years Worked for Current Employer.
Employer-Provided Benefits.
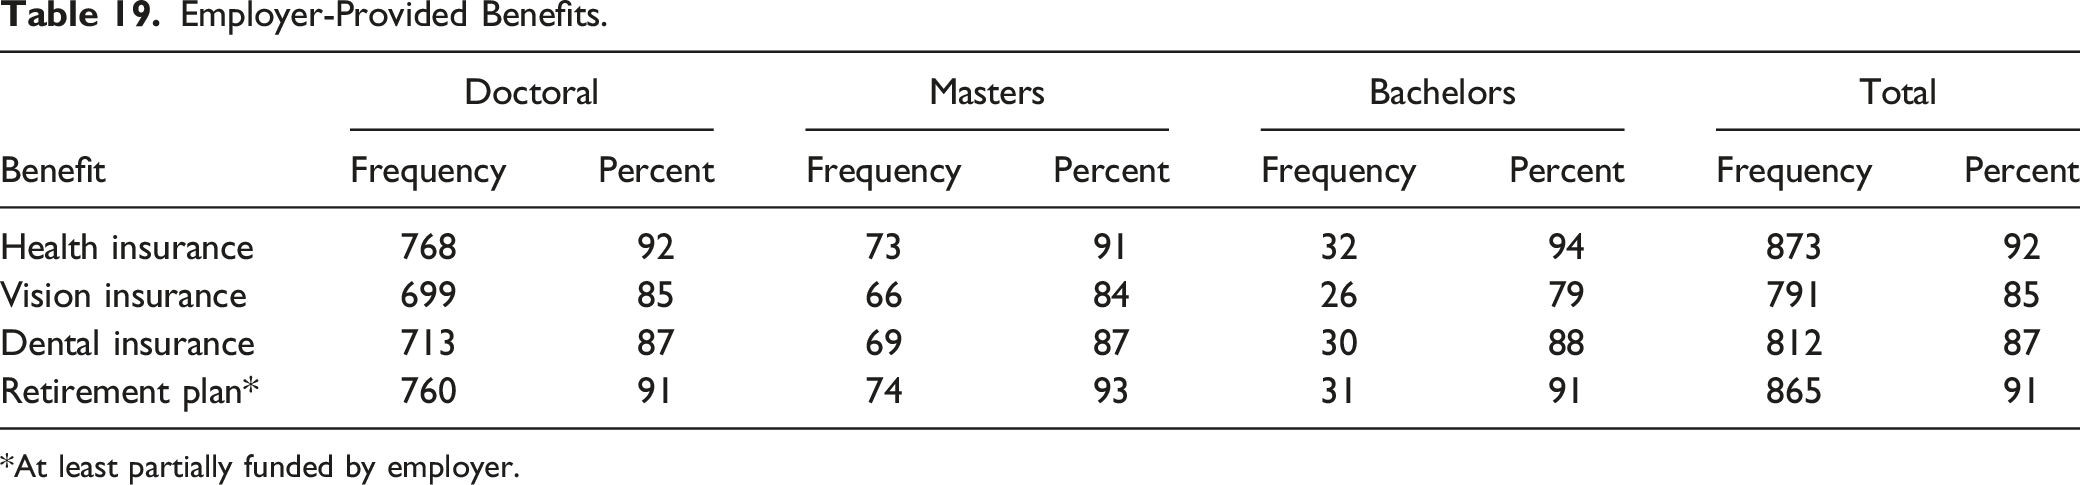
*At least partially funded by employer.
Insurance Premiums Paid by Employees.
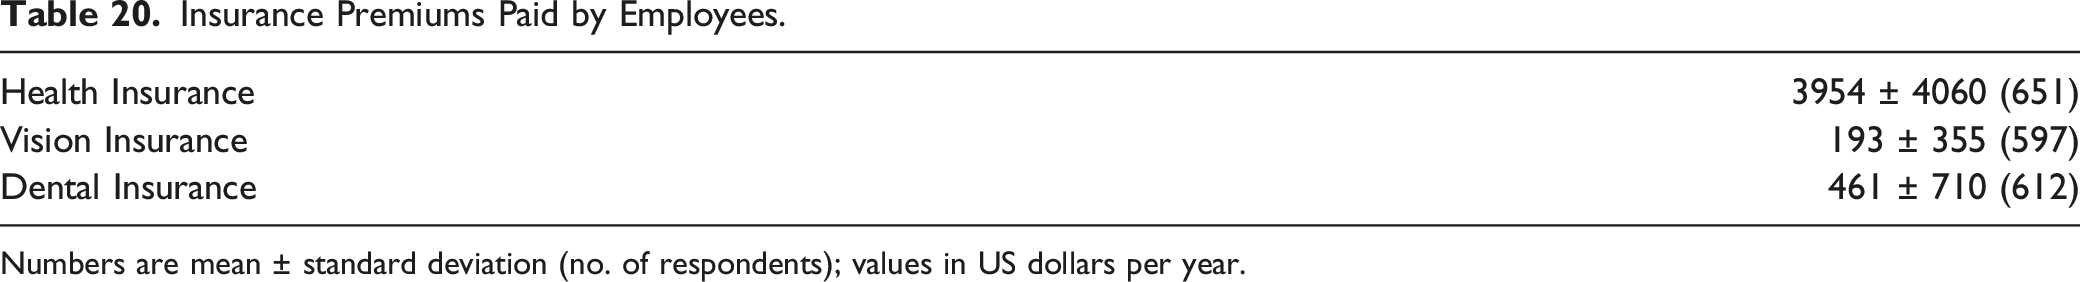
Numbers are mean ± standard deviation (no. of respondents); values in US dollars per year.
Years Worked for Current Employer.
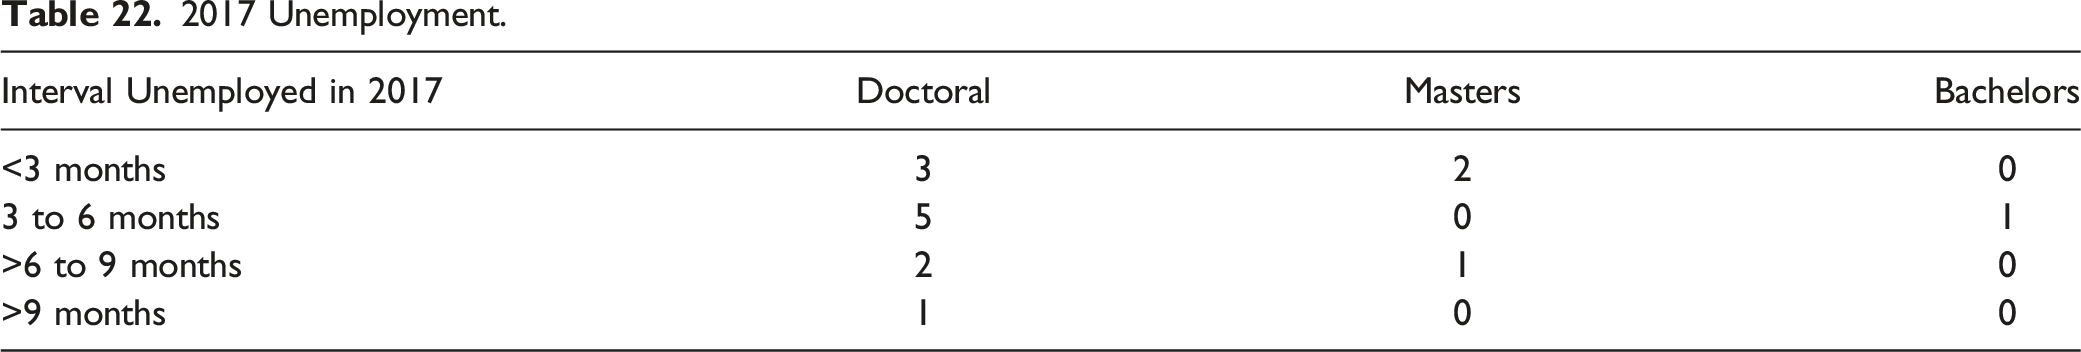
2017 Unemployment.
Employer-Provided Benefits.
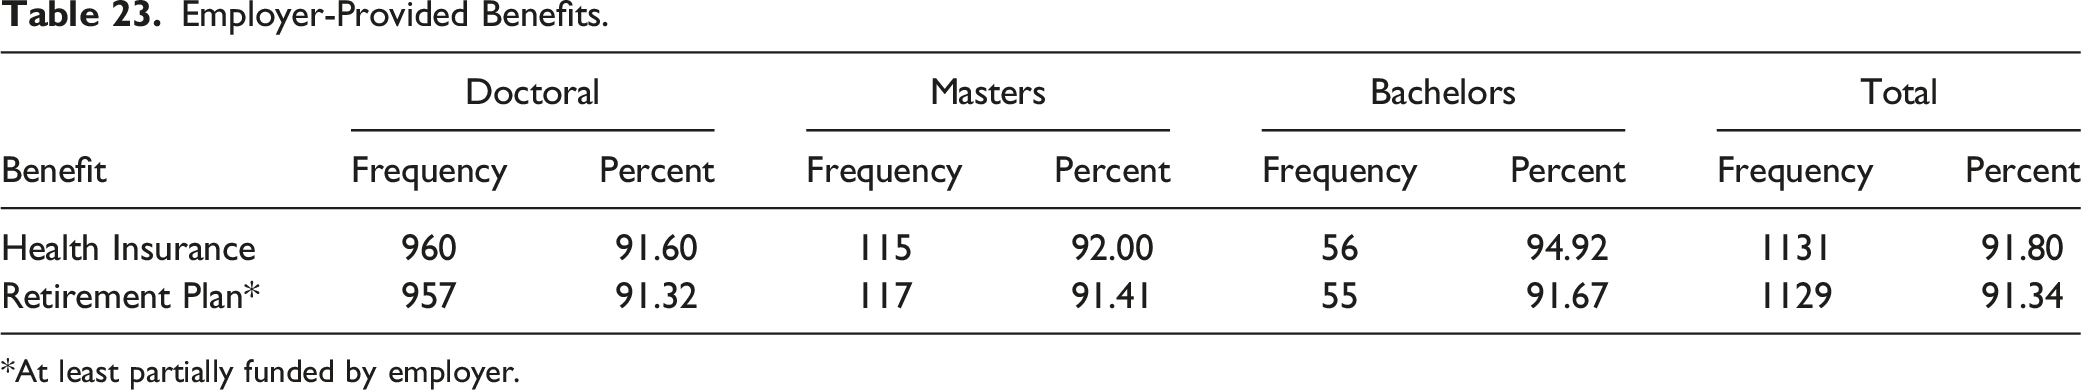
At least partially funded by employer.
Discussion and Conclusions
The current survey results point to a number of different trends that deserve attention by major professional societies, and add some insights into the job market, career path, and the conduct of future toxicology salary surveys. First, although the situation continues to improve for most entry-level and early-career positions, women continue to be compensated at a lower level than their male counterparts. Secondly, salaries as a whole have increased in the field, but the most impressive differences are not by geographic location of place of employment, but rather by type of employer. Additionally, certification continues to play a significant positive role in compensation. Periods of unemployment remained low in 2021, with most unemployment lasting 6 months or less. Most employers (over 91%) provided health insurance and retirement plans for employees.
Finally, the lag between survey responses being provided by the main participant organization, the availability of data for analysis, and the publication of this data were excessive. Furthermore, the inclusion of those who were not holders of doctorates was insufficient. The data collection for the next survey should be revised to improve the range of coverage of potential respondents as well as decrease the timing from survey distribution to publication.
Footnotes
Author Contributions
Gad, S. and Sullivan Jr., D. contributed to conception and design, contributed to analysis and interpretation, drafted manuscript, critically revised manuscript, gave final approval, and agree to be accountable for all aspects of work ensuring integrity and accuracy.
Declaration of Conflicting Interests
The author(s) declared no potential conflicts of interest with respect to the research, authorship, and/or publication of this article.
Funding
The author(s) received no financial support for the research, authorship, and/or publication of this article.