
Abstract
This survey serves as the tenth in a series of toxicology salary surveys conducted at 3-year intervals and beginning in 1988. An electronic survey instrument was distributed to members of the Society of Toxicology, American College of Toxicology, and 8 additional professional organizations. Question items inquired about gender, age, degree, years of experience, certifications held, areas of specialization, society membership, employment and income. Overall, 1338 responses were received. The results of the toxicology salary survey provide insight into the job market and career path for current and future toxicologists.
Keywords
This is the 10th in a series of salary surveys conducted at 3-year intervals for toxicologists that began in 1988. Previous salary surveys were conducted in 1988, 1 1991, 2 1995, 3 1998, 4 2001, 5 2004, 6 2007 (which was posted electronically but not published), 2012, 7 and 2016. 8 In addition to presenting the 2020 results, herein we are providing additional data and an analysis of the trends for employment and pay in toxicology over the last 30 years.
The 10th Triennial Toxicology Salary Survey was conducted as a joint project by the American College of Toxicology and the Society of Toxicology (SOT). In addition to the 2 parent organizations, 8 others (the Teratology Society, the Society of Toxicologic Pathology, the Safety Pharmacology Society, the American Board of Toxicology, the Academy of Toxicological Sciences, the Roundtable of Toxicology Consultants, the Society of Environmental Toxicology and Chemistry, and the Environmental Mutagenesis and Genomics Society) supported the effort by distributing the Survey Monkey-based instrument to their memberships.
Survey instruments were distributed electronically, with responses going to Survey Monkey. A total of 1,338 responses were received, up slightly from the 1,293 responses received for the previous survey. Figure 1 provides a summary of the number of doctoral respondents across the 30 years of surveys.
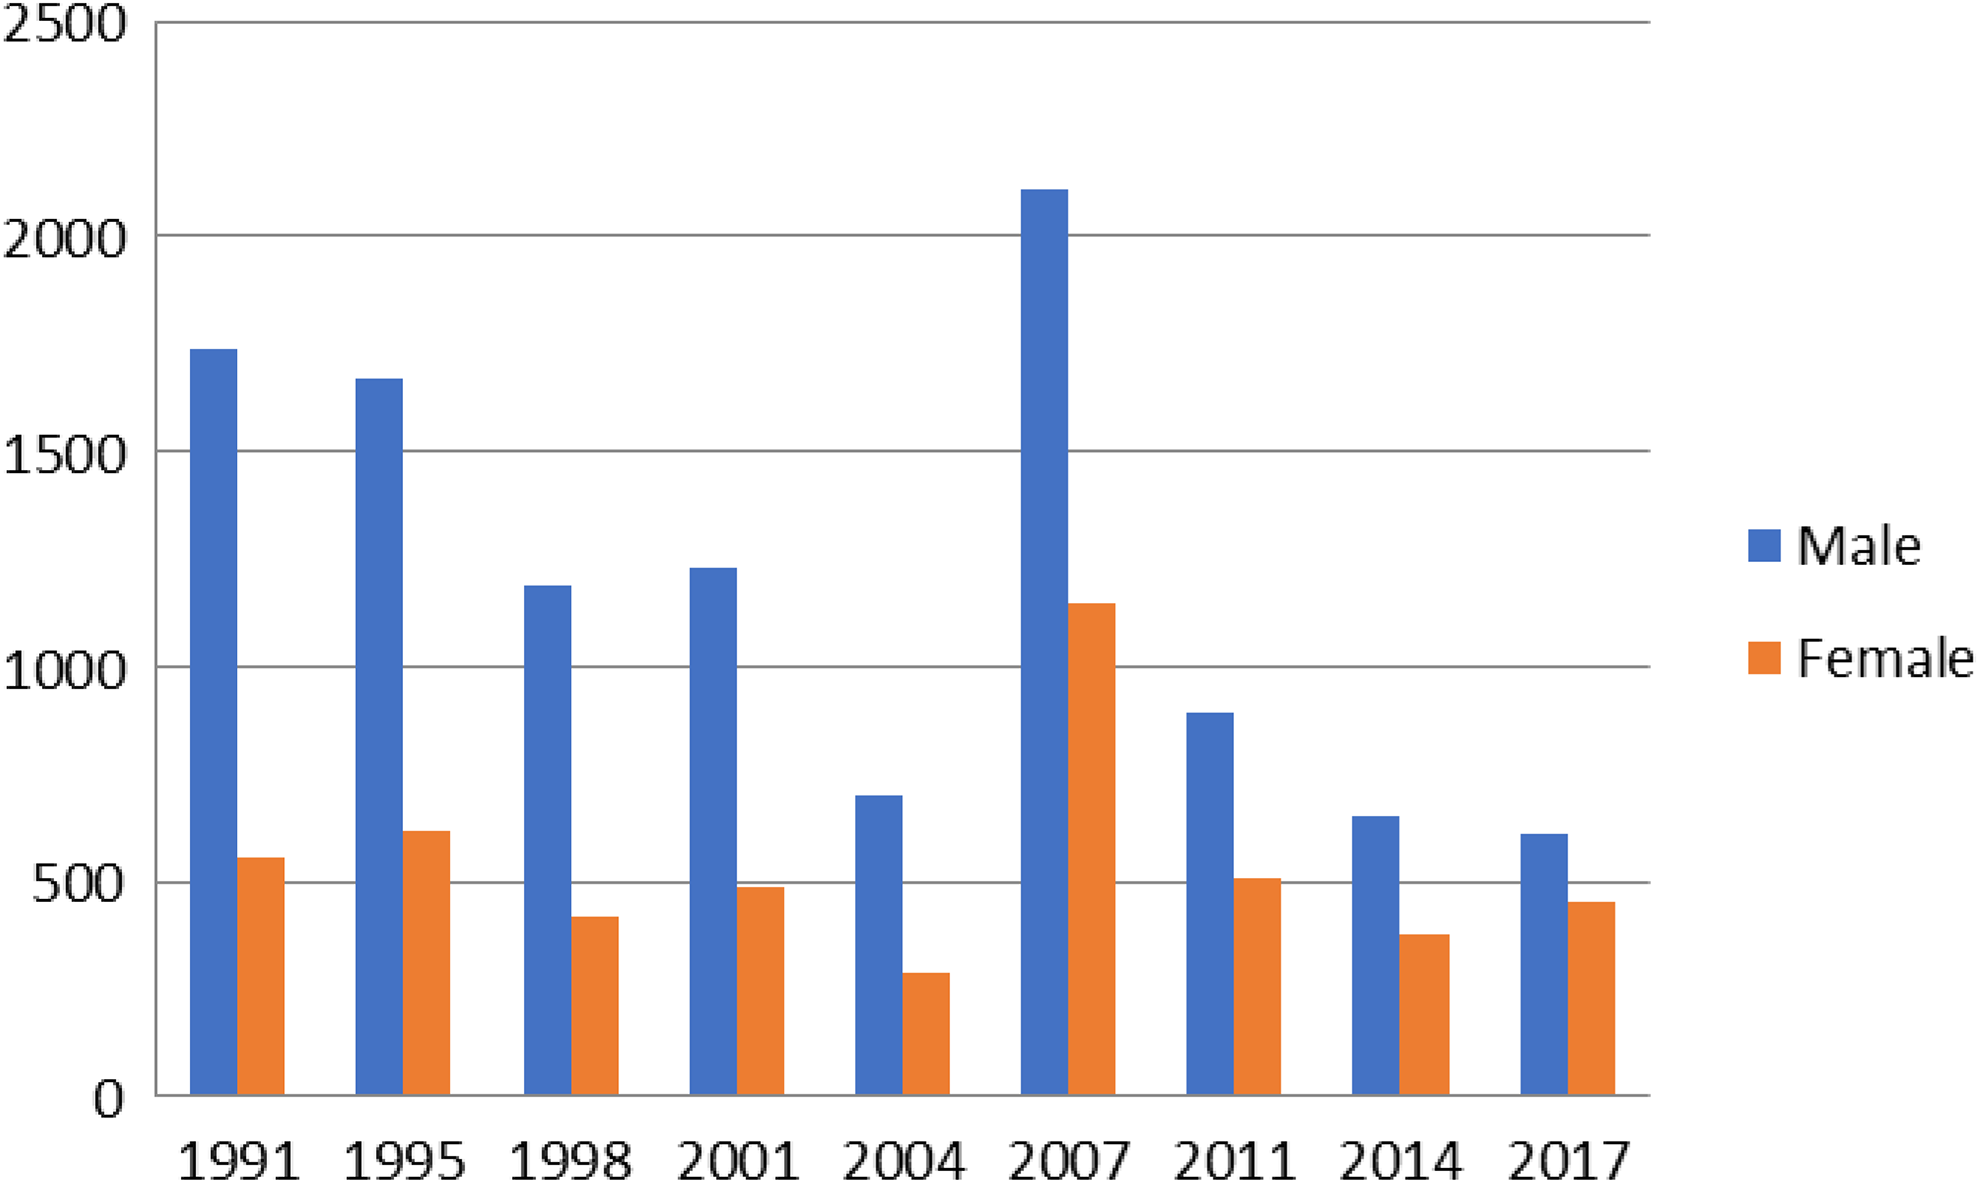
Number of doctoral-level respondents across surveys.
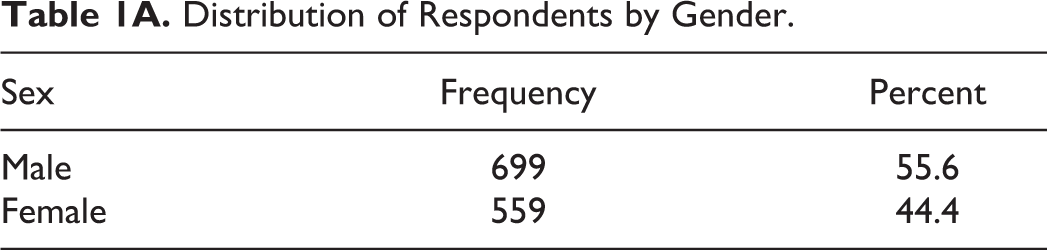
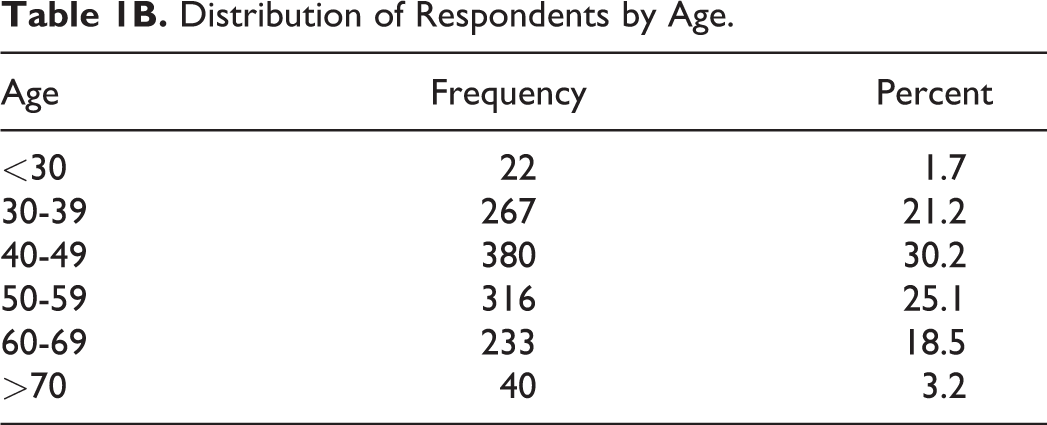
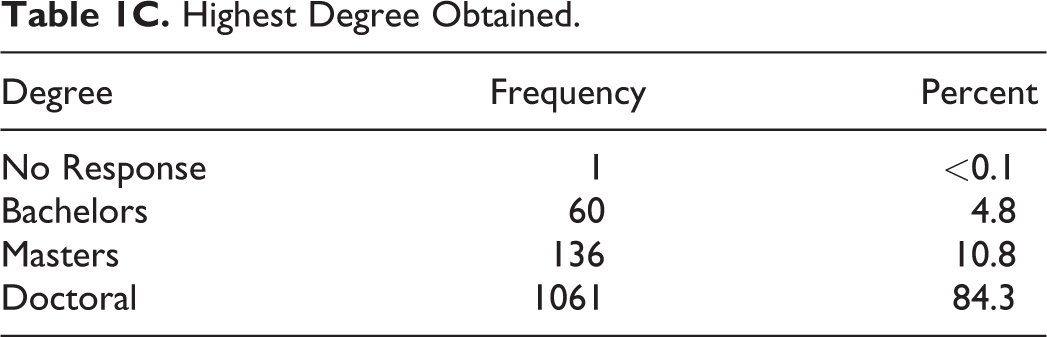
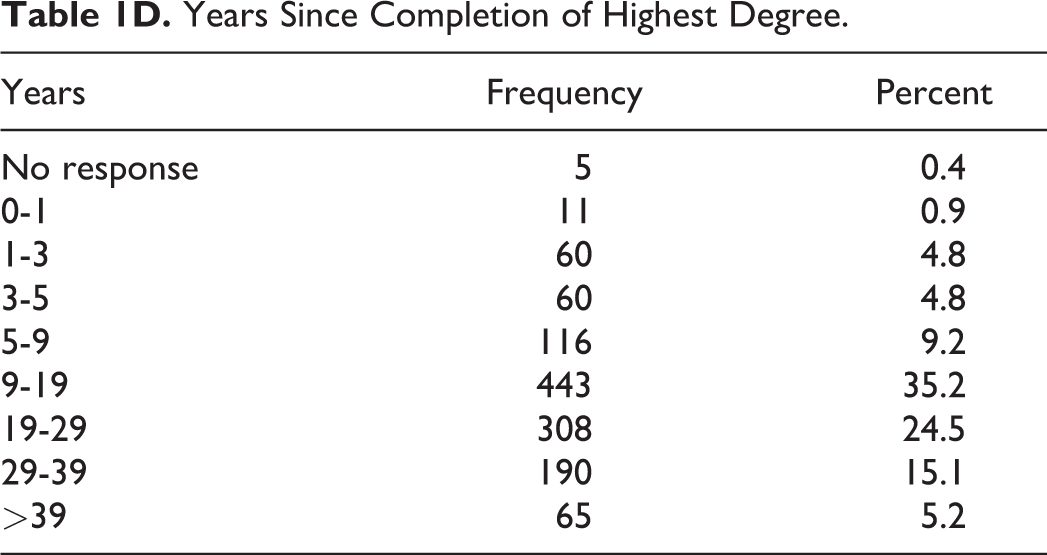
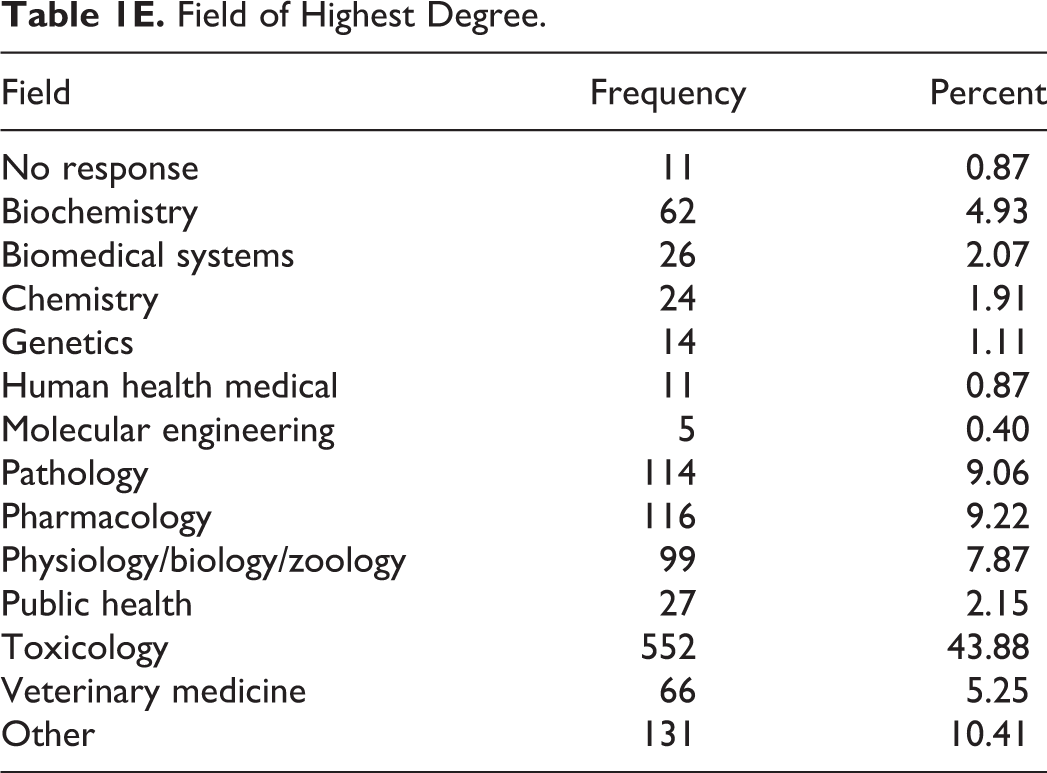
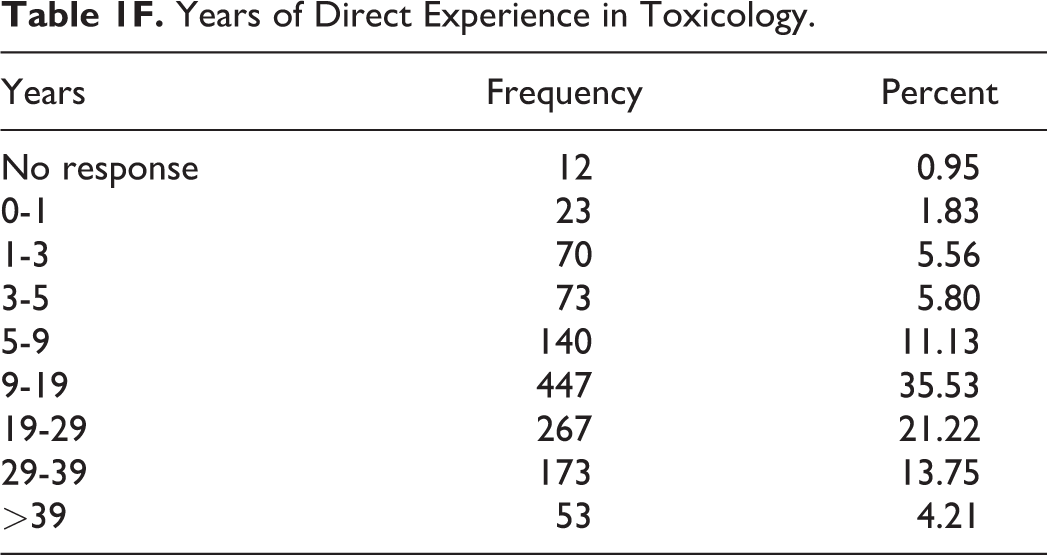
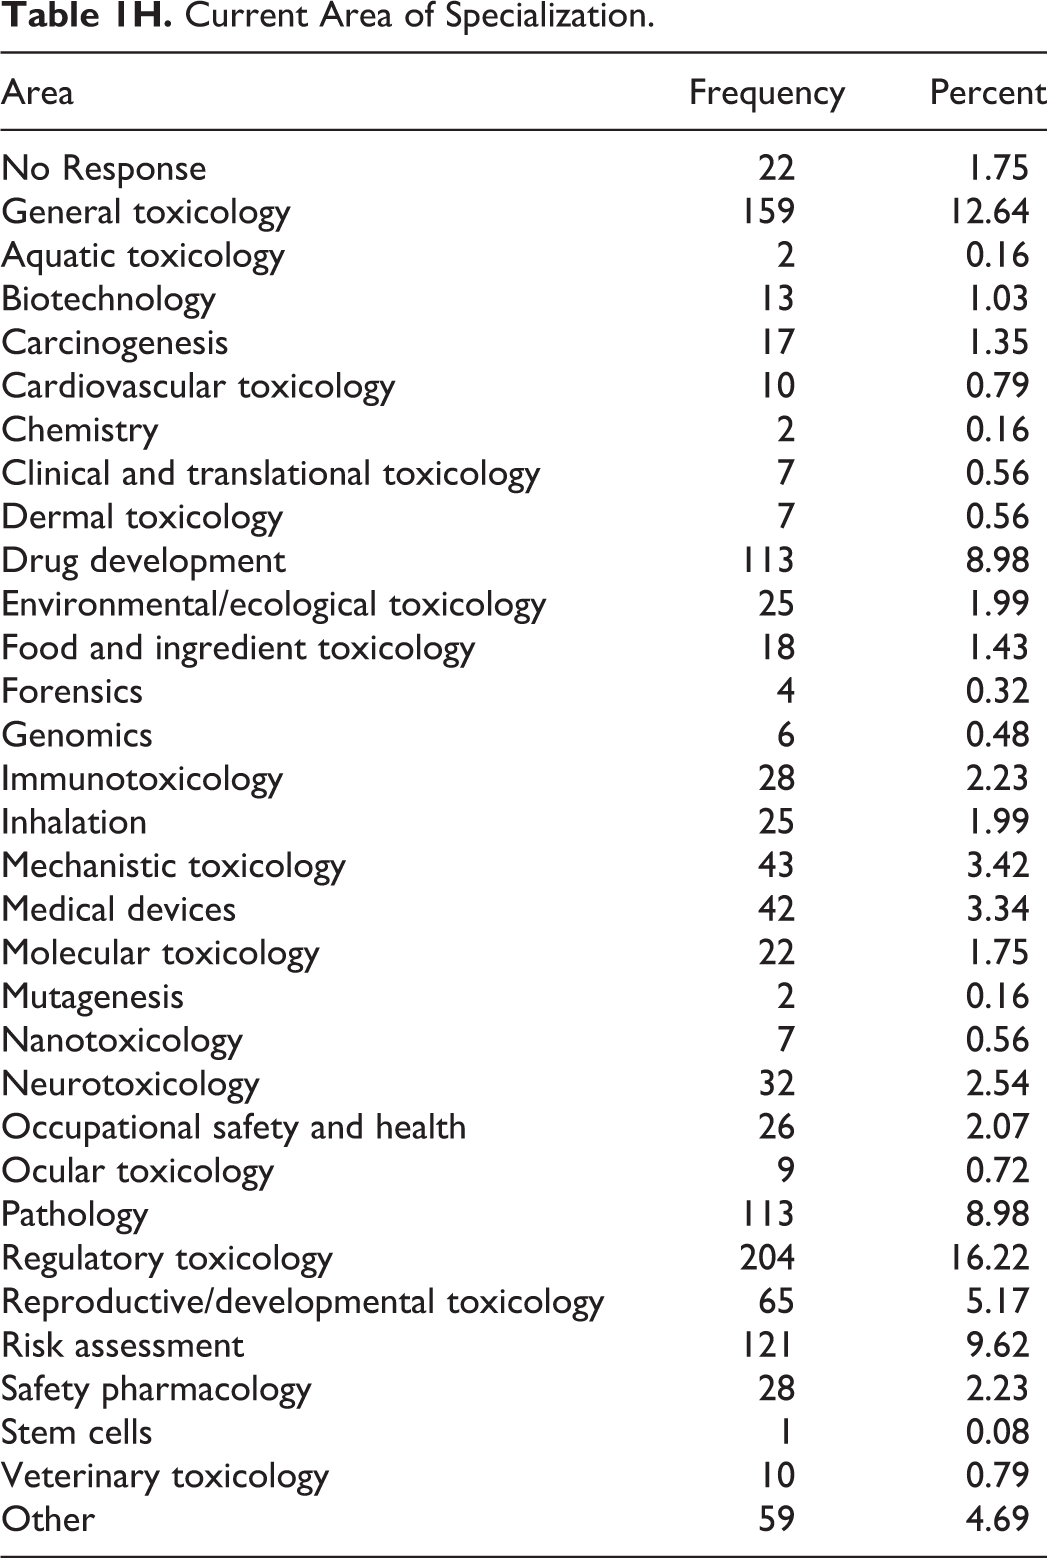
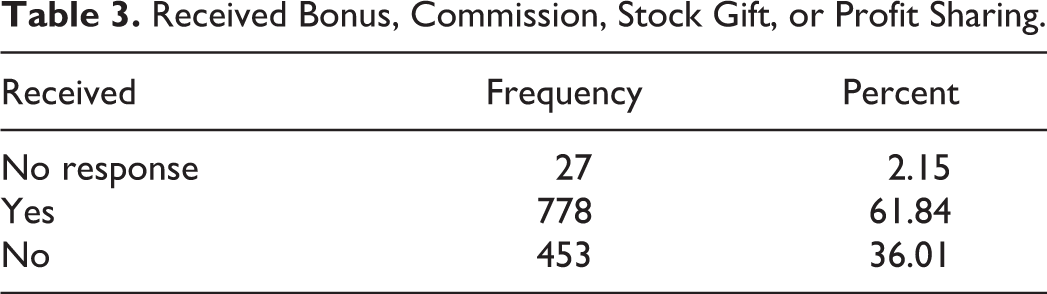
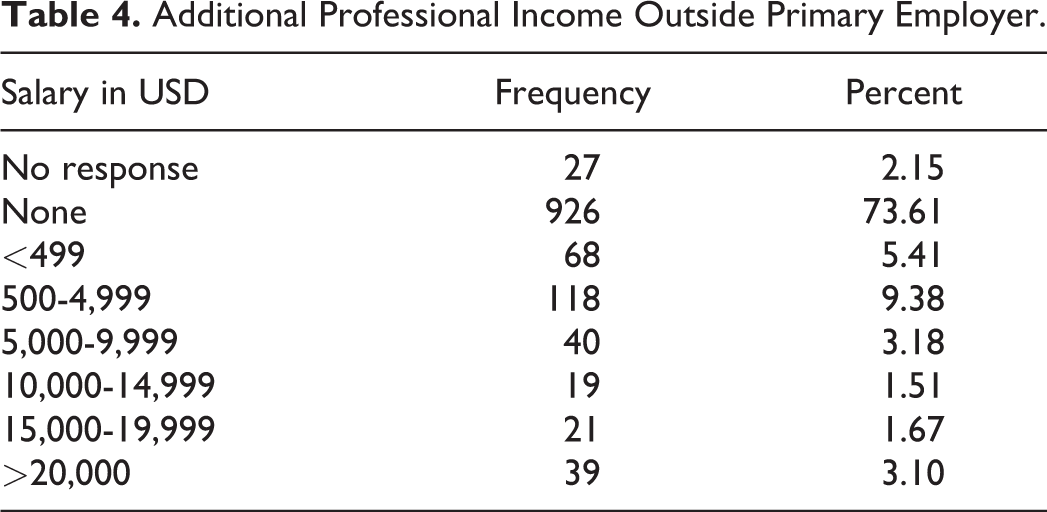
The demographics of responses are summarized in Tables 1A through 1H and include respondents’ gender, age, degree, years of experience, certifications held, and areas of specialization. The survey instrument was similar to the form of the 2016 survey, developed in conjunction with the SOT Career Resource and Development services, which included questions evaluating periods of unemployment. It should be noted that there continues to be a significant increase in the number of individuals reporting 6-figure incomes and in those receiving significant sums as bonuses, as is reflected particularly in Tables 2 and 3. In addition, about 25% of respondents received additional professional income outside their primary employer, as shown in Table 4. The survey methodology employed conformed to standard procedures, 9 though the response rate for this survey remains high for such endeavors.
Distribution of Respondents by Gender.
Distribution of Respondents by Age.
Highest Degree Obtained.
Years Since Completion of Highest Degree.
Field of Highest Degree.
Years of Direct Experience in Toxicology.
Certifications Held.
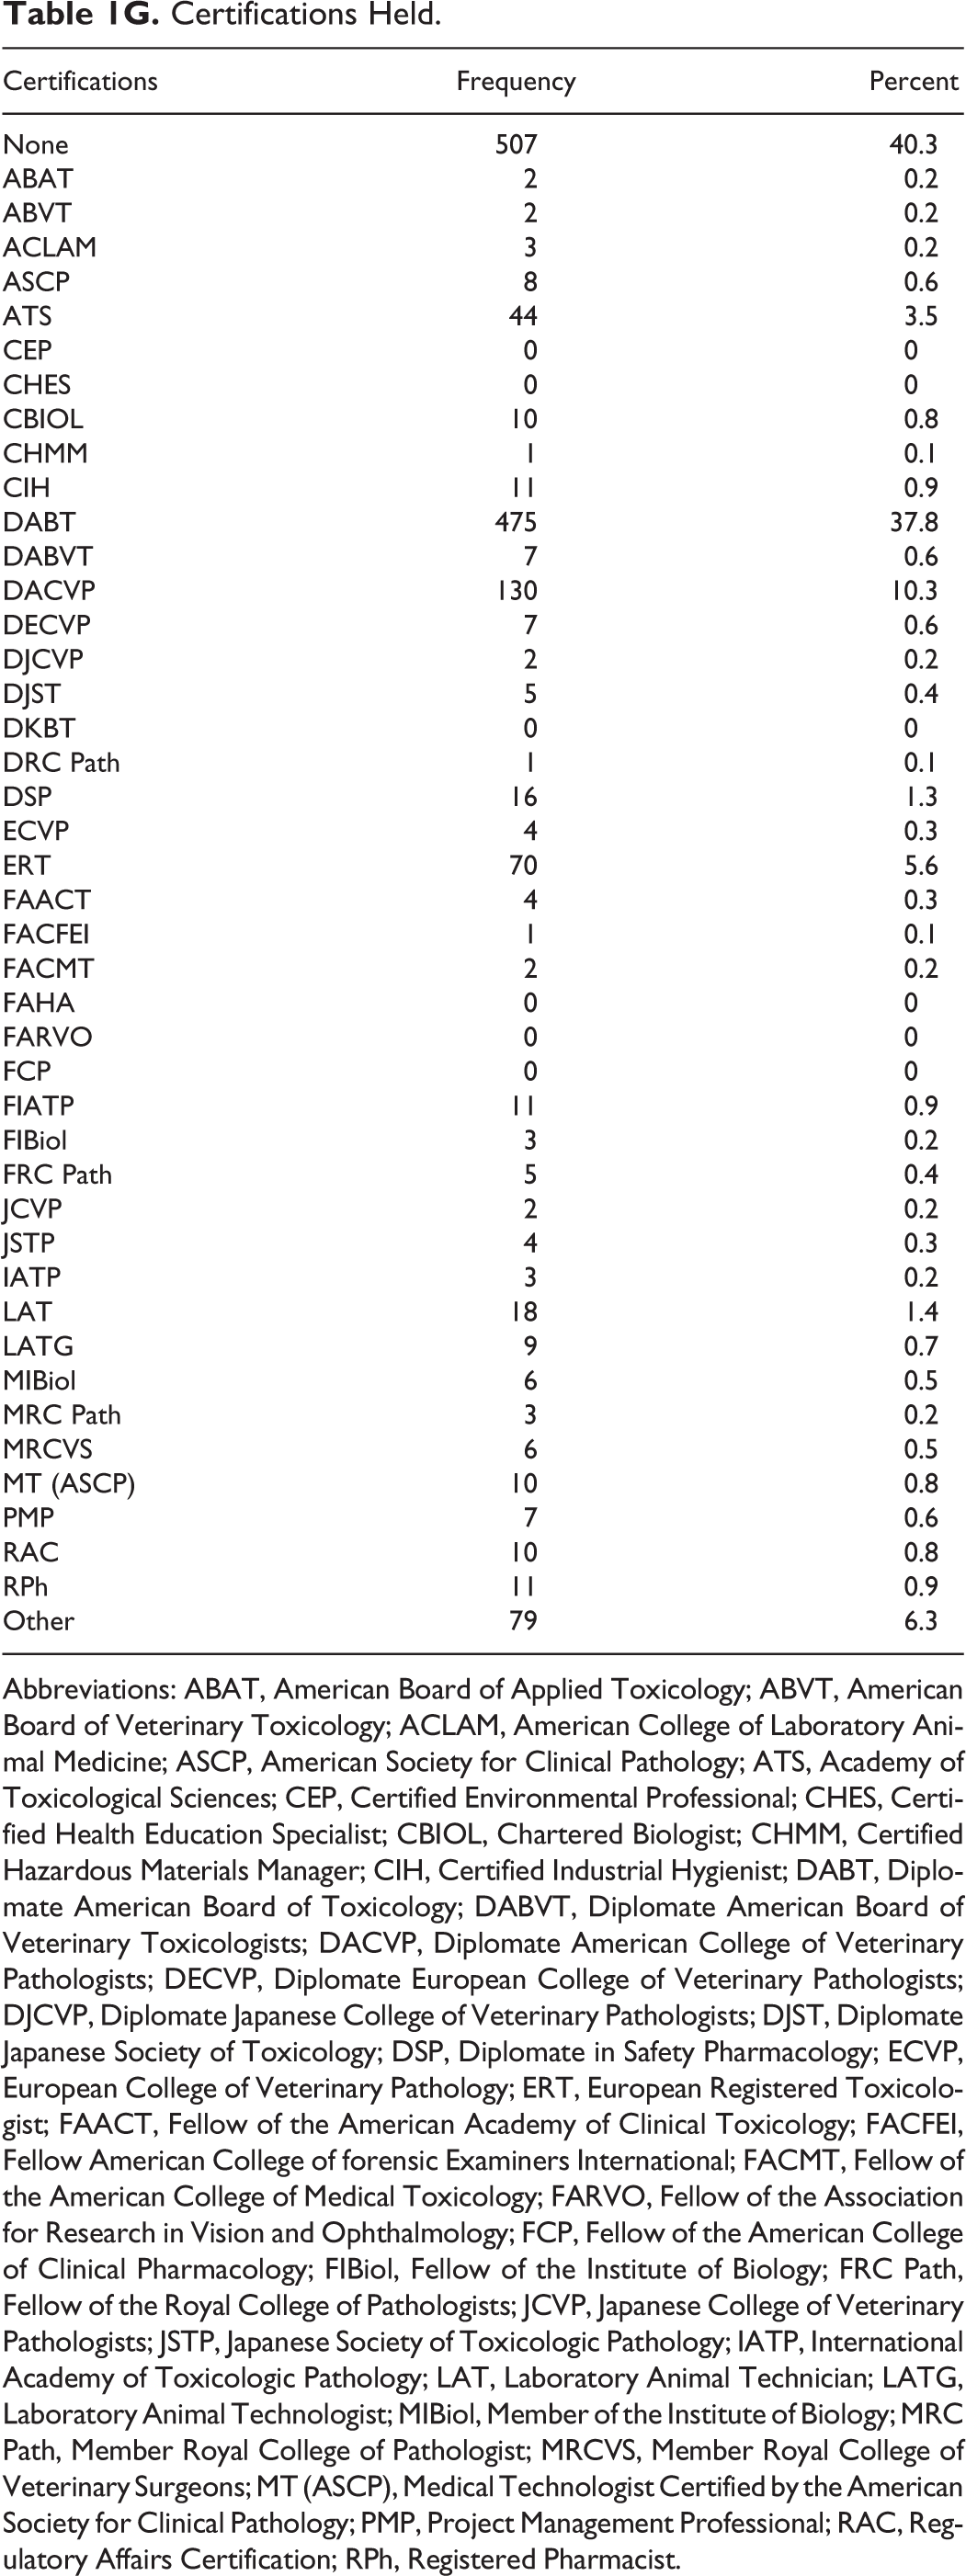
Abbreviations: ABAT, American Board of Applied Toxicology; ABVT, American Board of Veterinary Toxicology; ACLAM, American College of Laboratory Animal Medicine; ASCP, American Society for Clinical Pathology; ATS, Academy of Toxicological Sciences; CEP, Certified Environmental Professional; CHES, Certified Health Education Specialist; CBIOL, Chartered Biologist; CHMM, Certified Hazardous Materials Manager; CIH, Certified Industrial Hygienist; DABT, Diplomate American Board of Toxicology; DABVT, Diplomate American Board of Veterinary Toxicologists; DACVP, Diplomate American College of Veterinary Pathologists; DECVP, Diplomate European College of Veterinary Pathologists; DJCVP, Diplomate Japanese College of Veterinary Pathologists; DJST, Diplomate Japanese Society of Toxicology; DSP, Diplomate in Safety Pharmacology; ECVP, European College of Veterinary Pathology; ERT, European Registered Toxicologist; FAACT, Fellow of the American Academy of Clinical Toxicology; FACFEI, Fellow American College of forensic Examiners International; FACMT, Fellow of the American College of Medical Toxicology; FARVO, Fellow of the Association for Research in Vision and Ophthalmology; FCP, Fellow of the American College of Clinical Pharmacology; FIBiol, Fellow of the Institute of Biology; FRC Path, Fellow of the Royal College of Pathologists; JCVP, Japanese College of Veterinary Pathologists; JSTP, Japanese Society of Toxicologic Pathology; IATP, International Academy of Toxicologic Pathology; LAT, Laboratory Animal Technician; LATG, Laboratory Animal Technologist; MIBiol, Member of the Institute of Biology; MRC Path, Member Royal College of Pathologist; MRCVS, Member Royal College of Veterinary Surgeons; MT (ASCP), Medical Technologist Certified by the American Society for Clinical Pathology; PMP, Project Management Professional; RAC, Regulatory Affairs Certification; RPh, Registered Pharmacist.
Current Area of Specialization.
Primary Job Base Salary.a
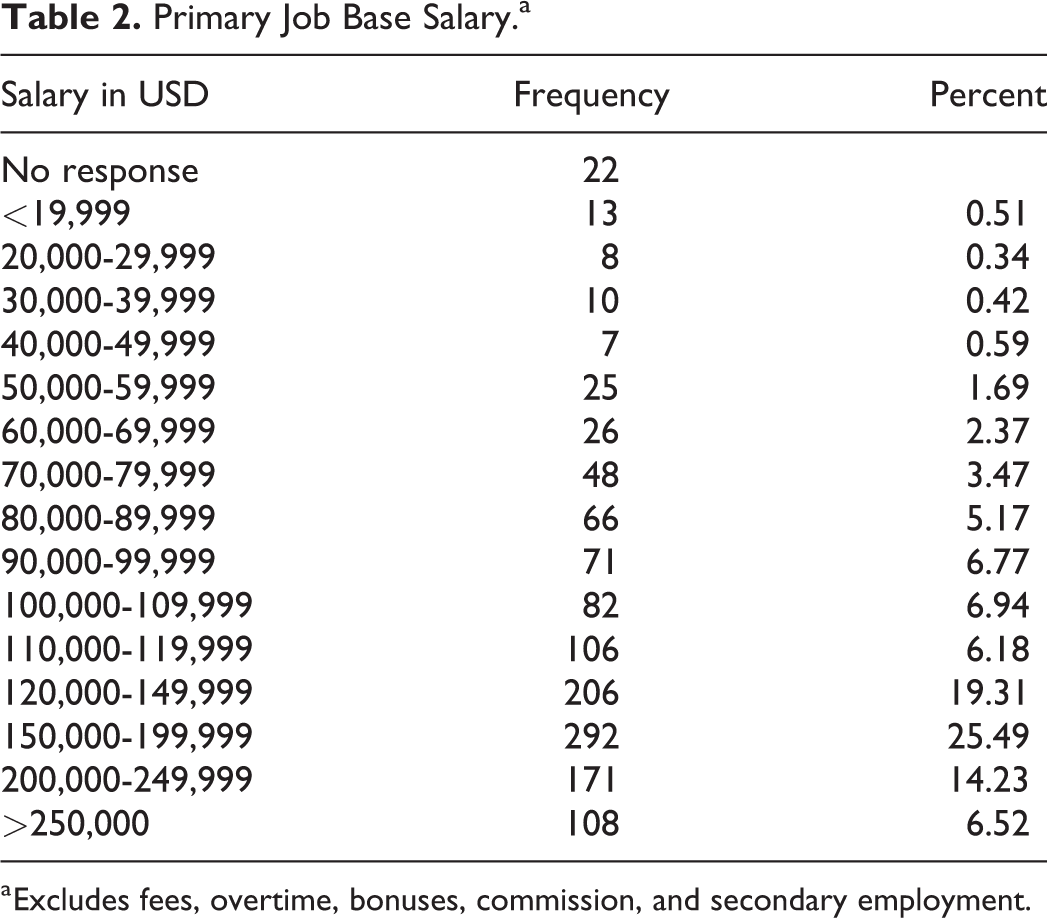
a Excludes fees, overtime, bonuses, commission, and secondary employment.
Received Bonus, Commission, Stock Gift, or Profit Sharing.
Additional Professional Income Outside Primary Employer.
Salary estimates for purposes of calculation were taken to be the midpoint of the range, for example, for the salary range of US$90,000 to US$99,999, a mean value of US$95,000 was used in all calculations. In addition, there was a significant number of incomplete responses that required further estimation by statistical methods. The incomplete responses and the methods used to handle them were: Nineteen respondents did not indicate a gender. These results were not included in the breakdowns. Fourteen respondents indicated a salary >US$250,000 without writing the actual amount in the area provided. The salary used for calculation was US$250,000. This probably led to a bias toward lower average values. Fifty-three respondents indicated they received bonuses, commission, stock options, or profit sharing without indicating the amount. These were excluded from consideration.
A total of 1,021 of the respondents (588 men and 433 women) were full-time employed holders of doctoral degrees in the United States. Table 5 presents the mean salaries (± 1 standard deviation [SD]) for these individuals, sorted by years of experience after receipt of their degrees, gender, and field of employment. Salaries are in thousands of US dollars per year, with necessary conversions having been made for other currencies. Figure 2 provides an across-survey analysis of doctoral salaries for respondents with 1 to 3 years of experience postterminal degree.
US Doctoral Annual Salaries.a
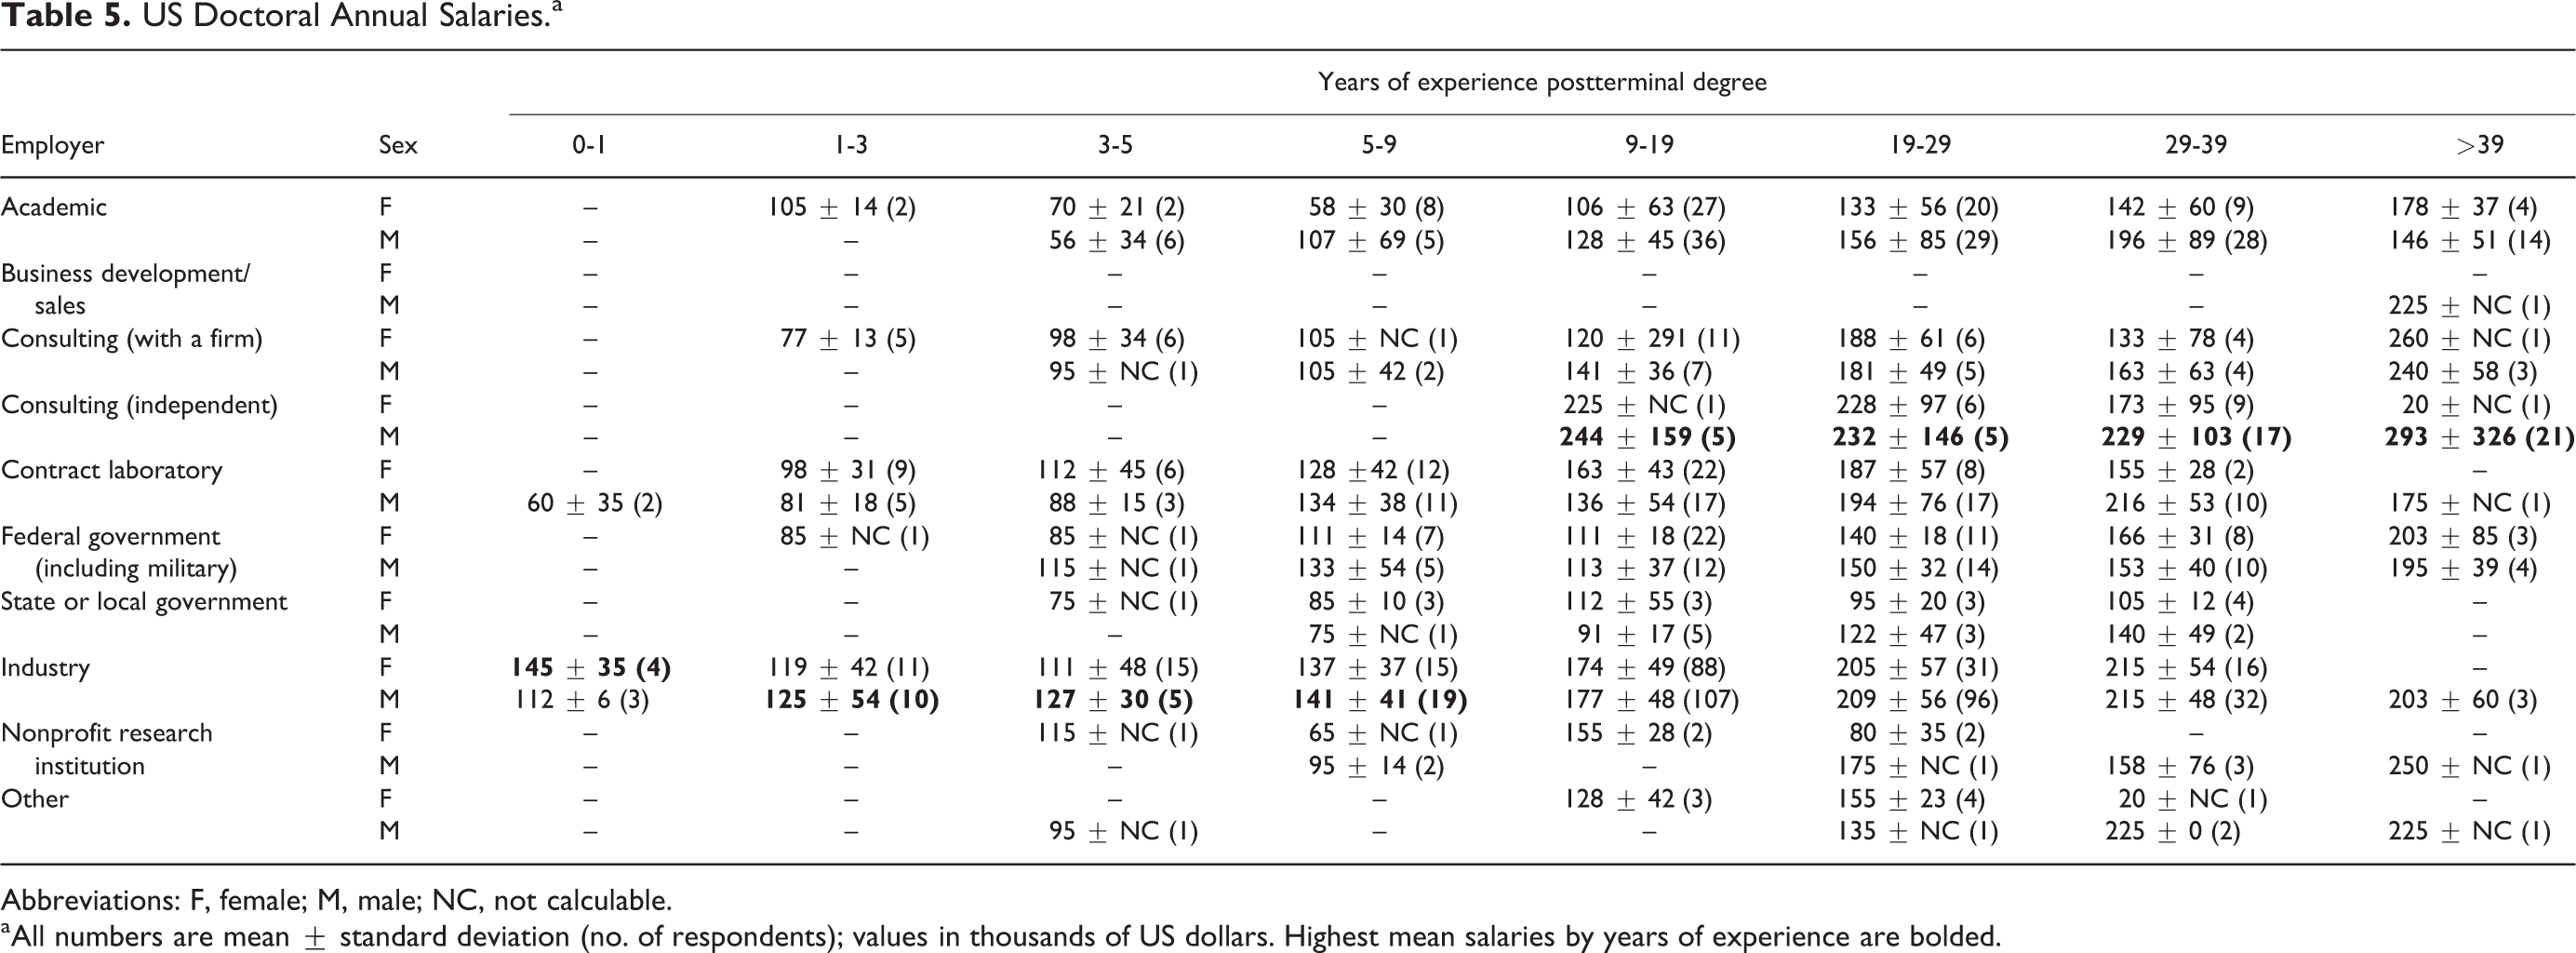
Abbreviations: F, female; M, male; NC, not calculable.
a All numbers are mean ± standard deviation (no. of respondents); values in thousands of US dollars. Highest mean salaries by years of experience are bolded.
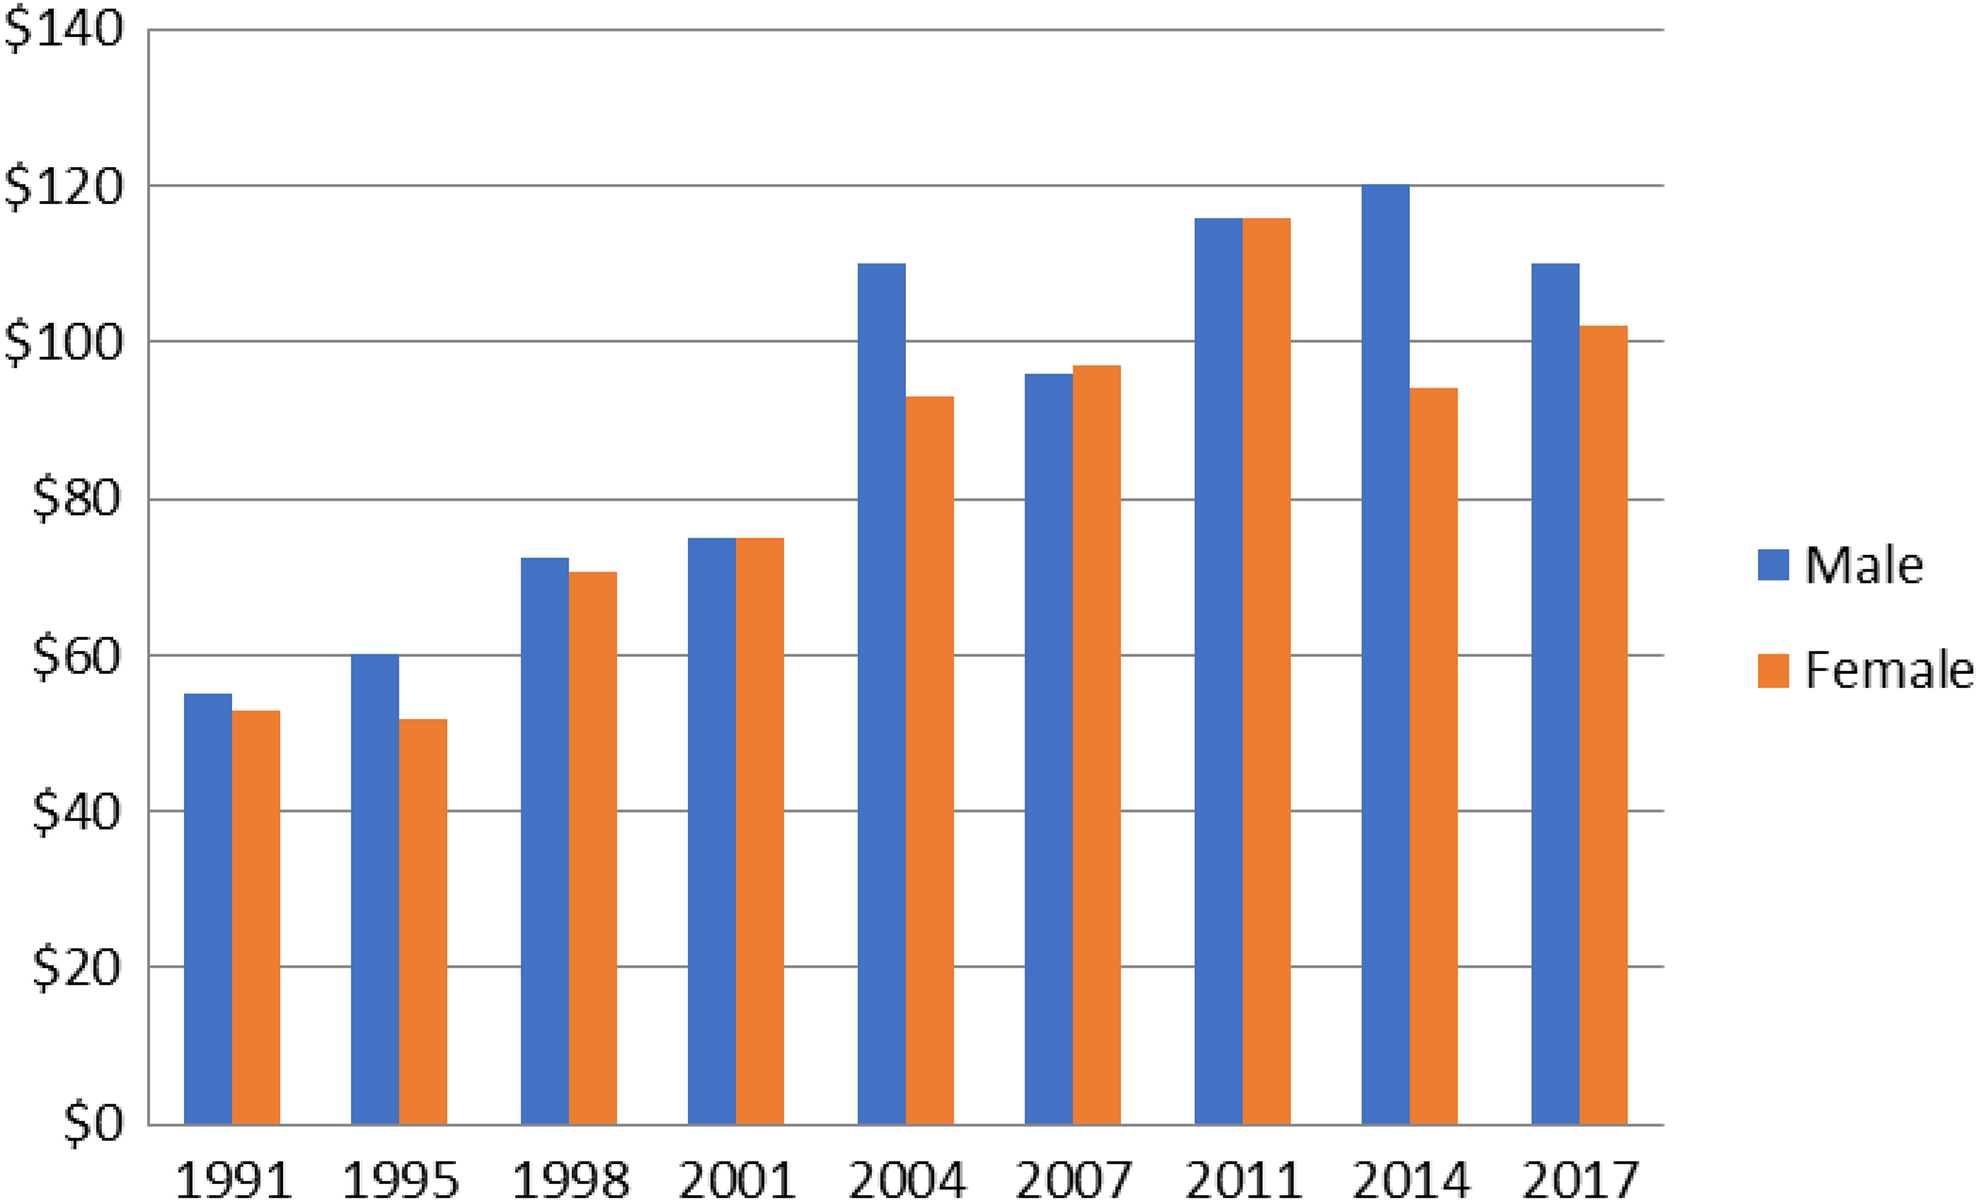
US doctoral annual salaries for respondents with 1 to 3 years of experience postterminal degree. Values are in thousands of US dollars.
The mean salaries (± 1SD) for the 113 master’s level respondents from the United States are presented in Table 6. Likewise, the results from the 61 bachelor’s level respondents are presented in Table 7. The remaining respondents were not employed full time during the reporting period and are characterized as follows:
graduate and postdoctoral students (10),
working part-time (42),
retired (41), and
other (9)
US Masters Annual Salaries.a
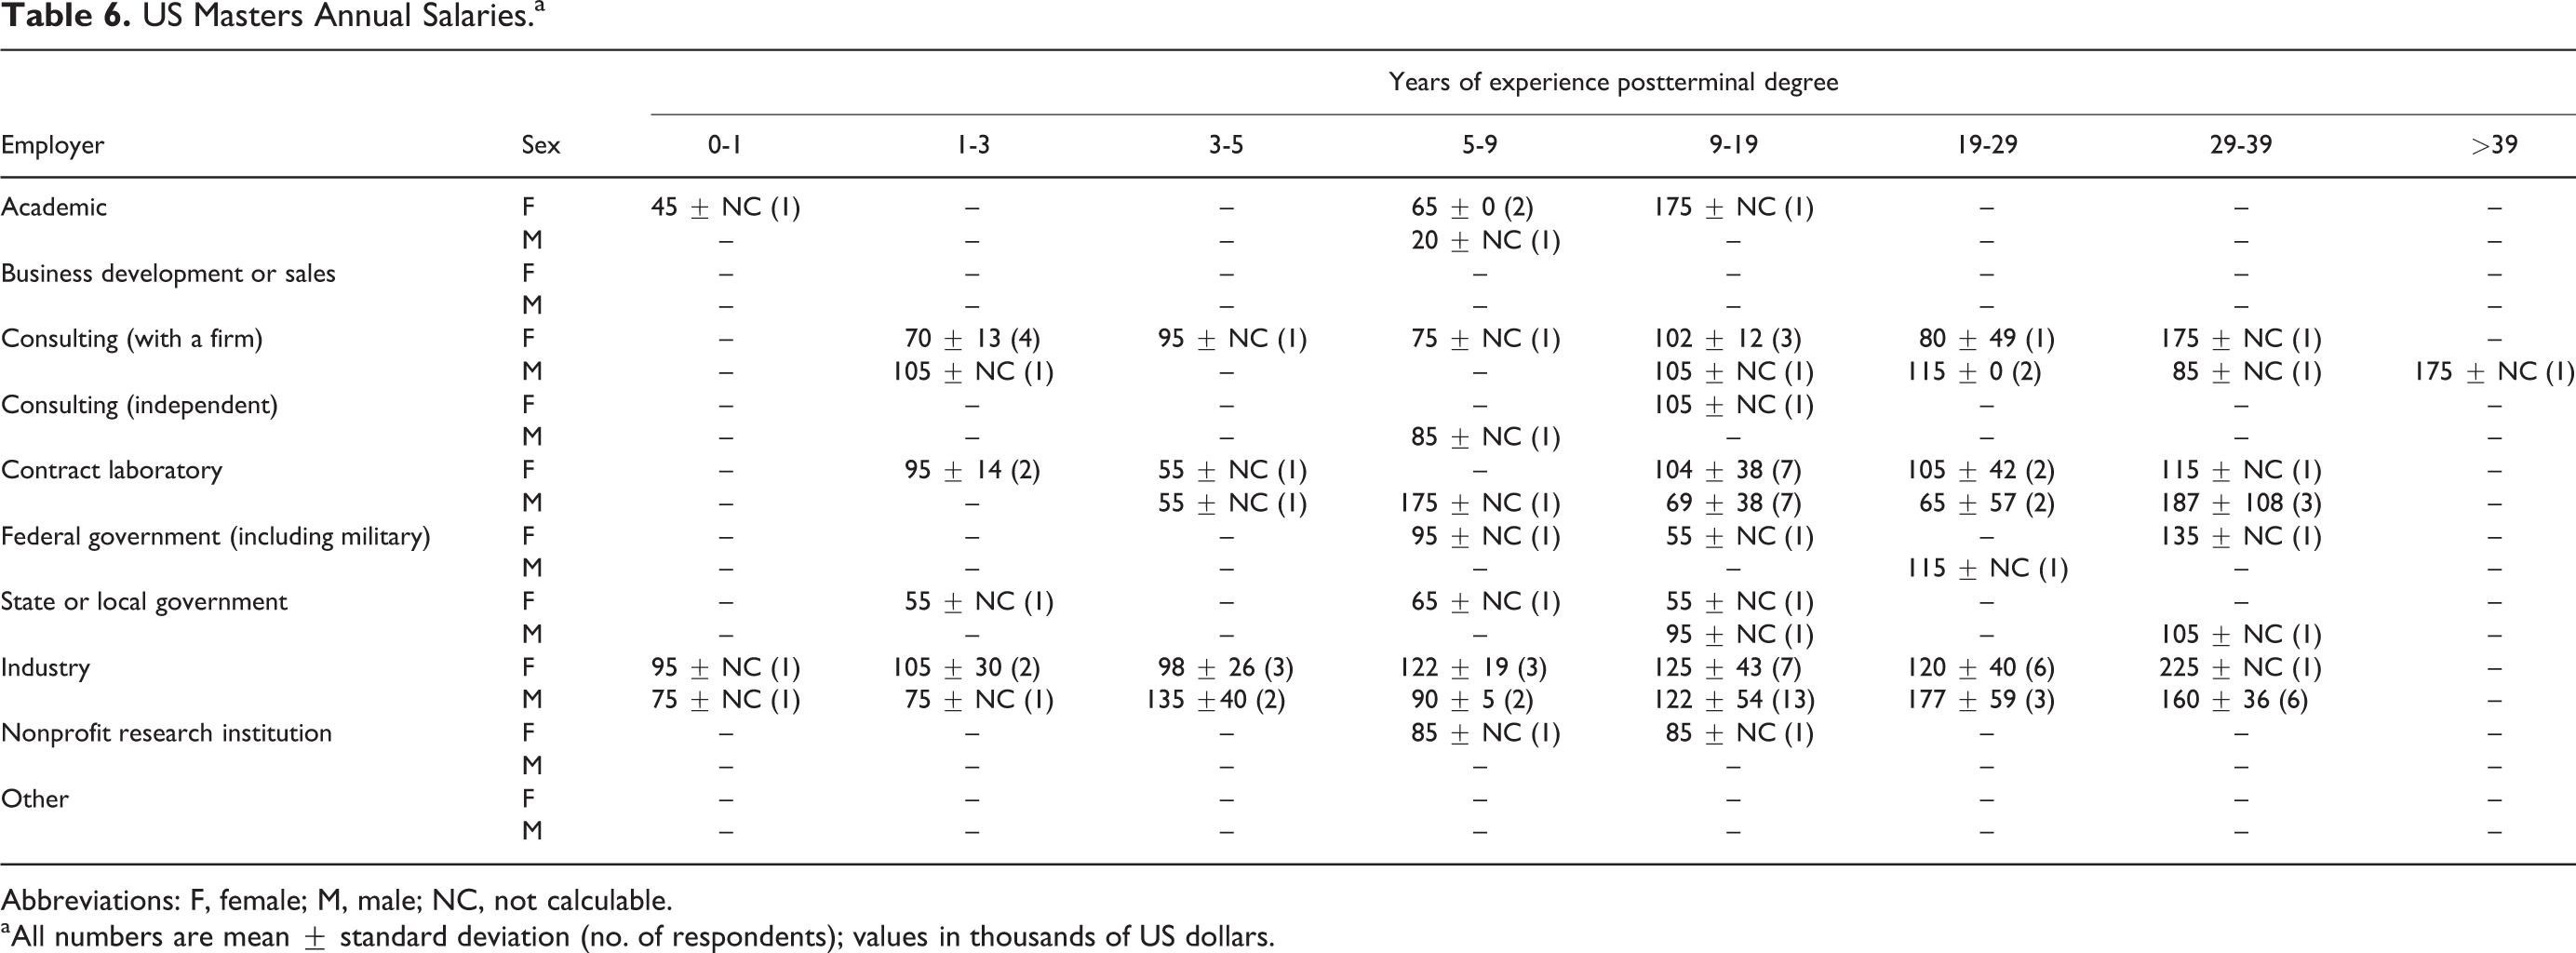
Abbreviations: F, female; M, male; NC, not calculable.
a All numbers are mean ± standard deviation (no. of respondents); values in thousands of US dollars.
US Bachelors Annual Salaries.a
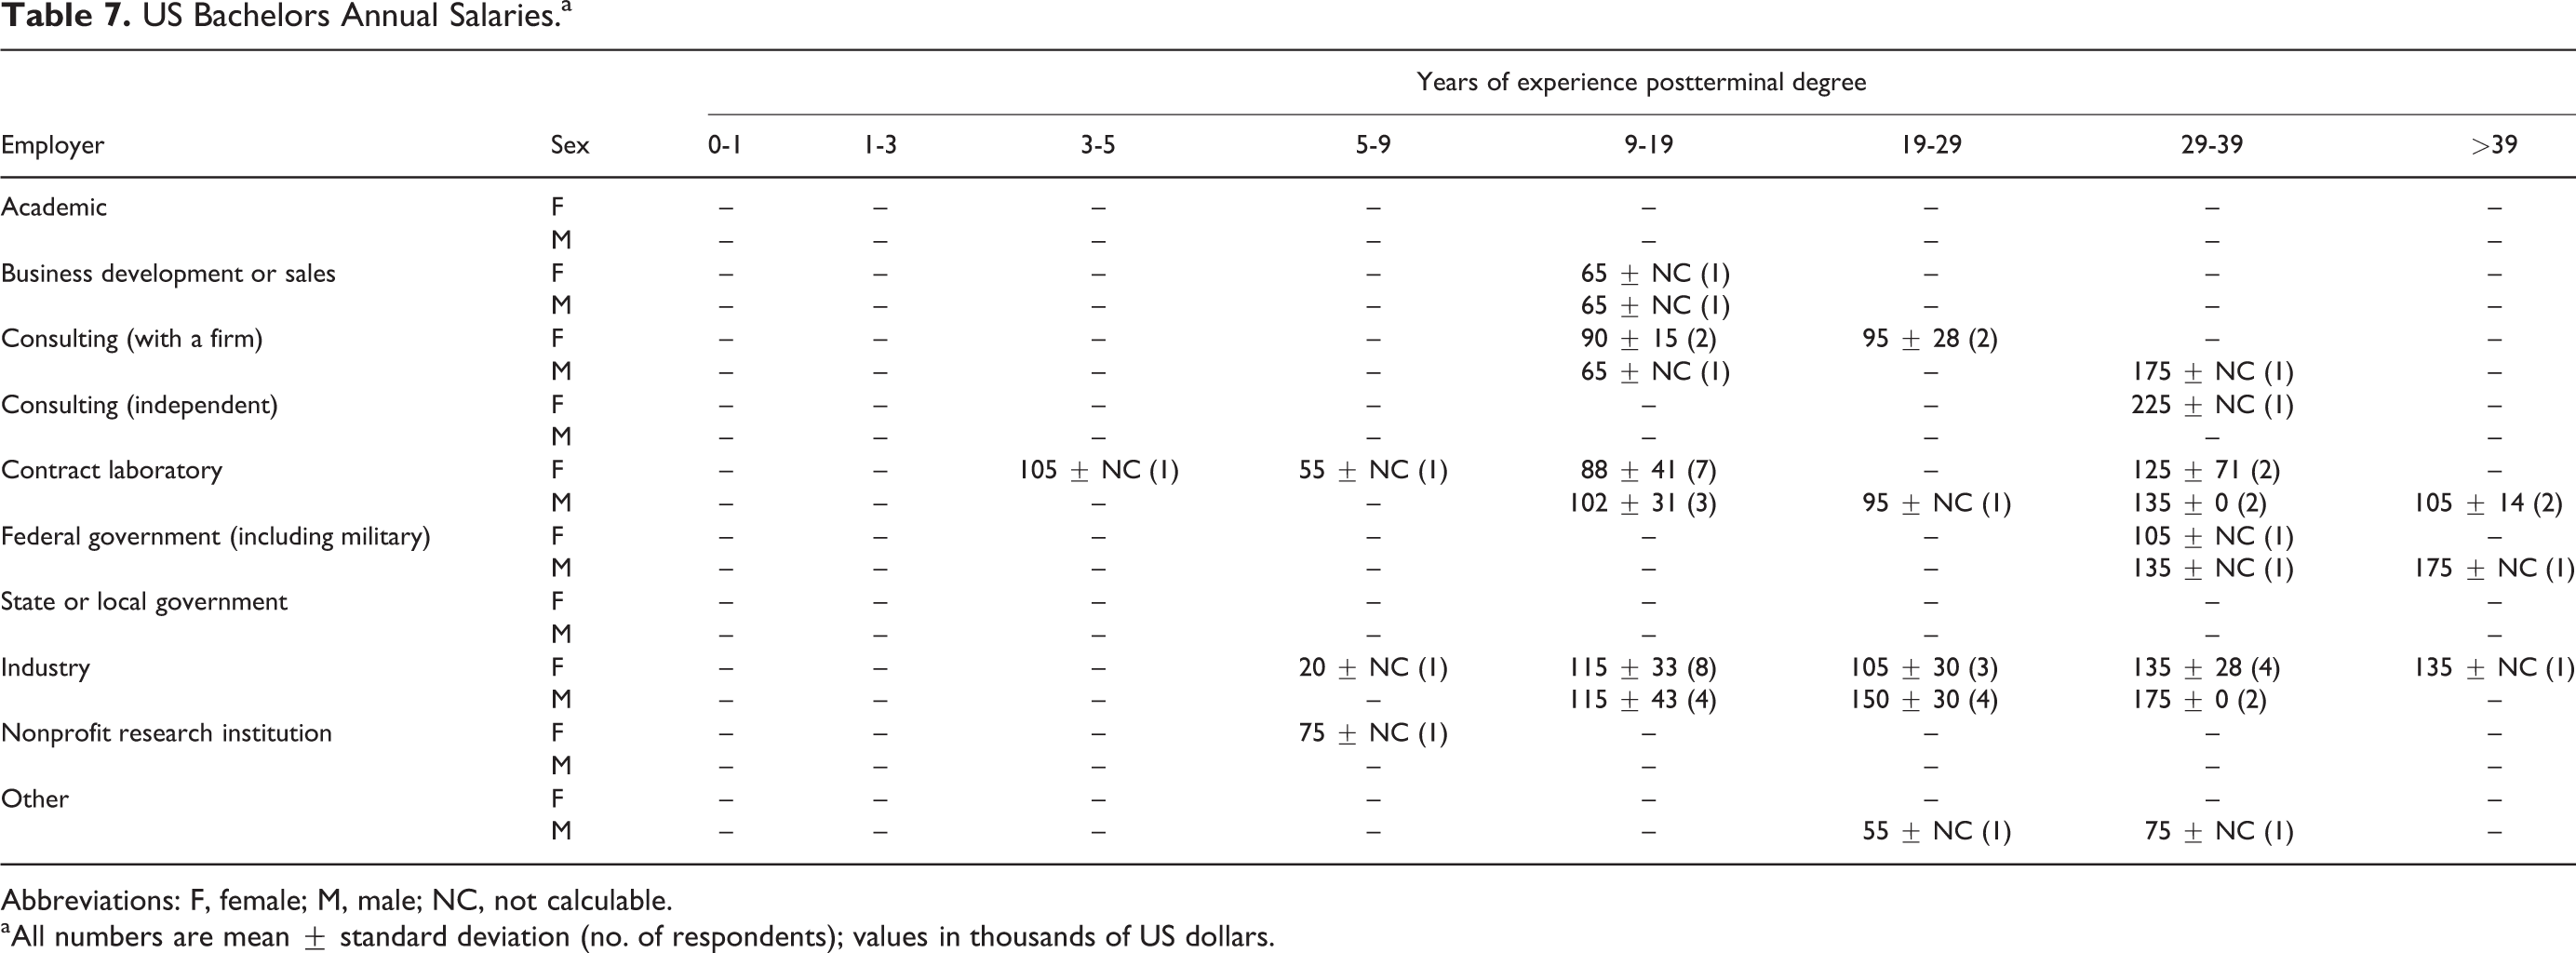
Abbreviations: F, female; M, male; NC, not calculable.
a All numbers are mean ± standard deviation (no. of respondents); values in thousands of US dollars.
There were no associates degree respondents.
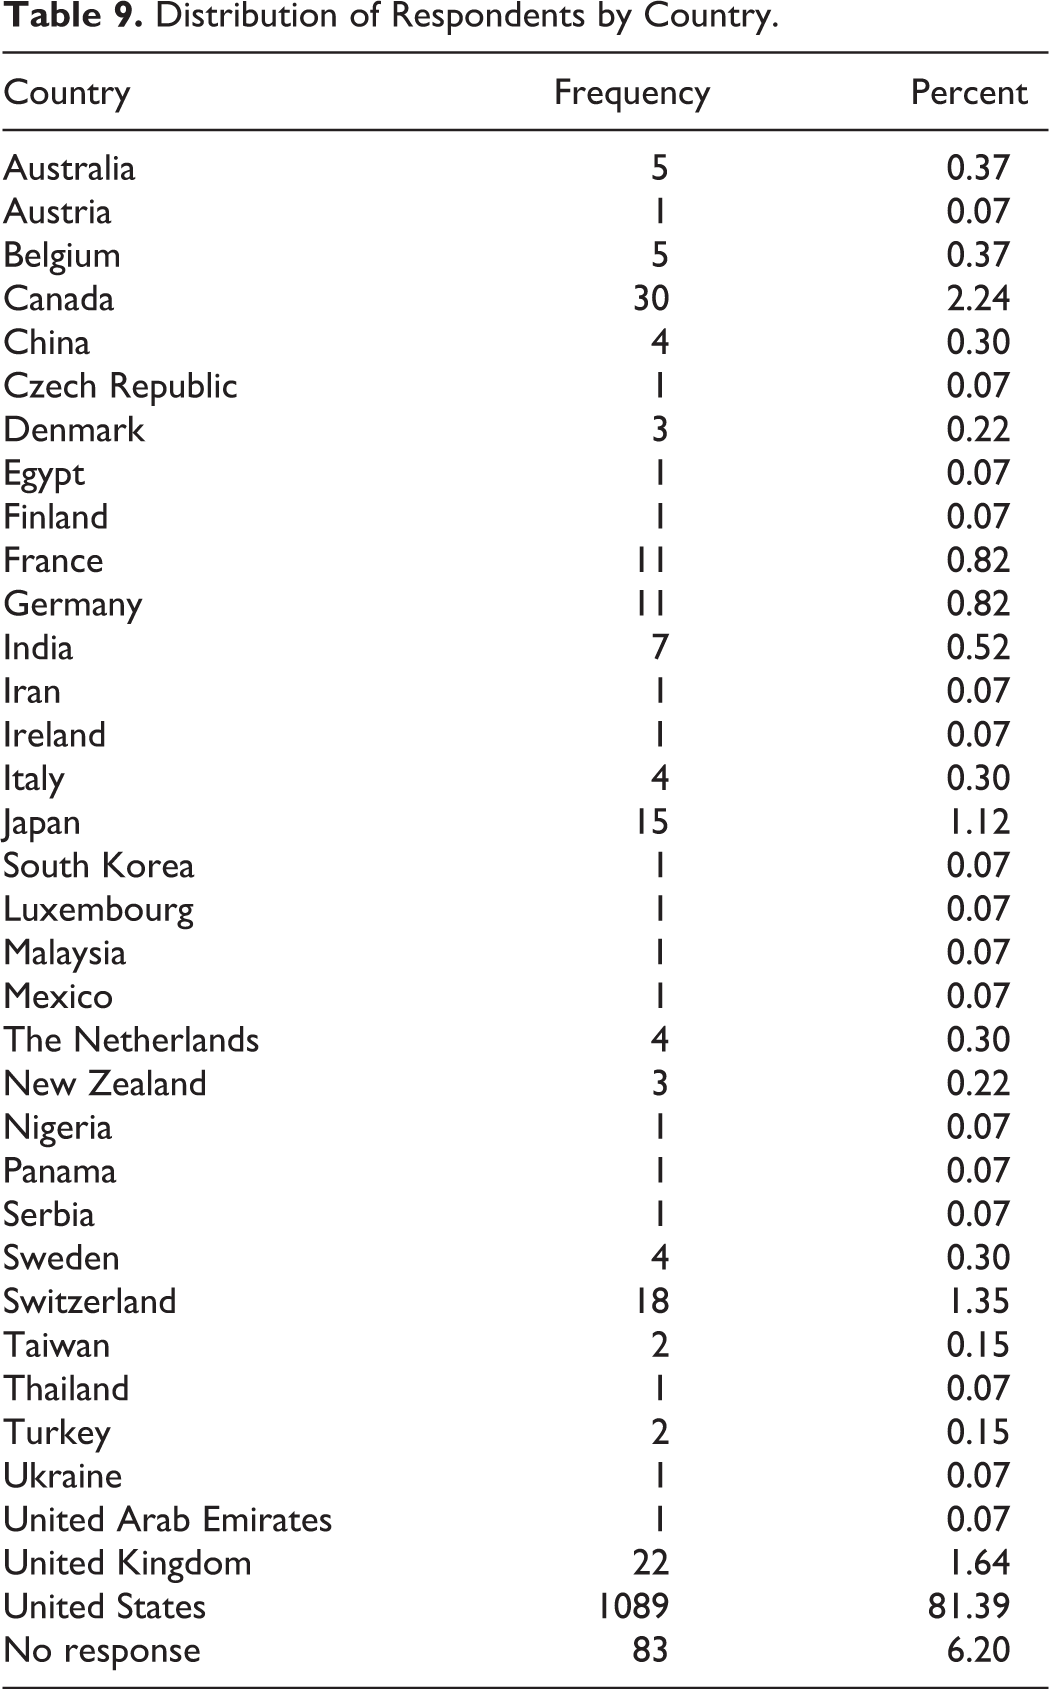
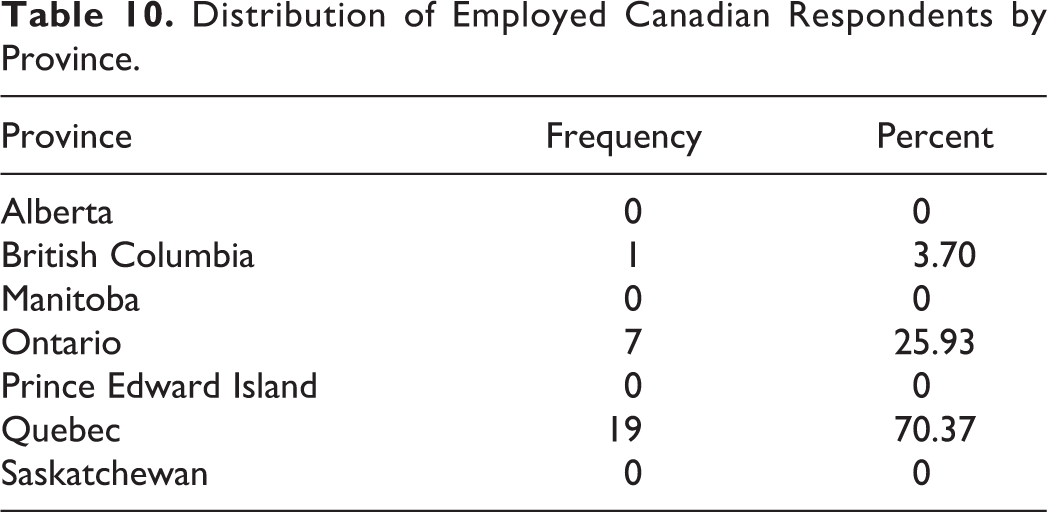
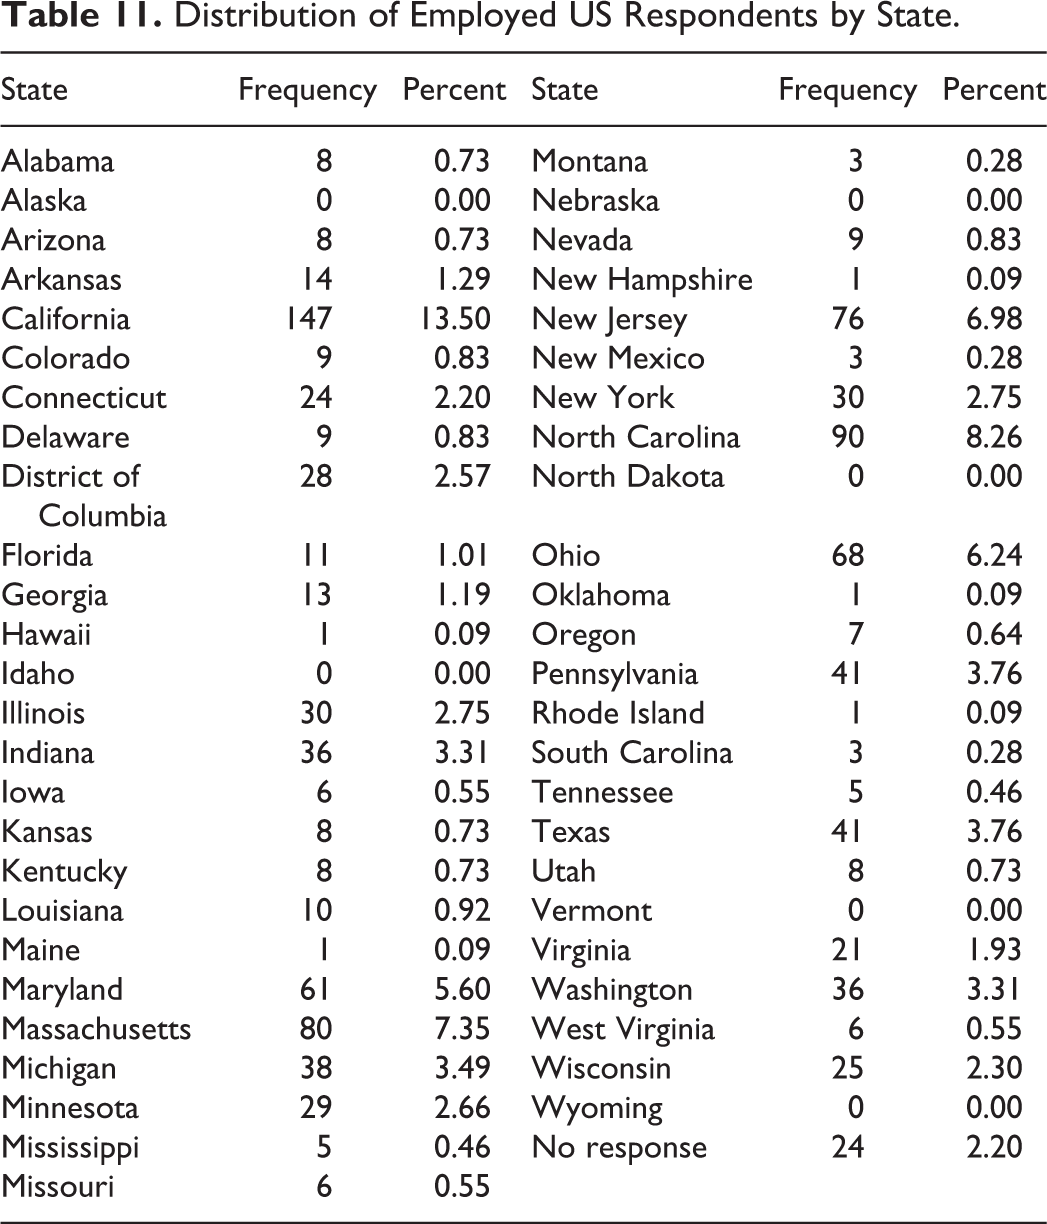
Table 8 presents a summary of data on those 645 (62.0% of all employed) doctoral recipients who received bonuses in addition to salary. Tables 9 to 11 present summaries of the geographic distributions of the survey respondents by country, Canadian province, and American state, respectively. Table 12 summarizes the major professional society memberships of the respondents. Many respondents belong to more than one society. Table 13 provides a summary of the influence of certification on doctoral-level salaries.
US Doctoral Bonus Amounts.a
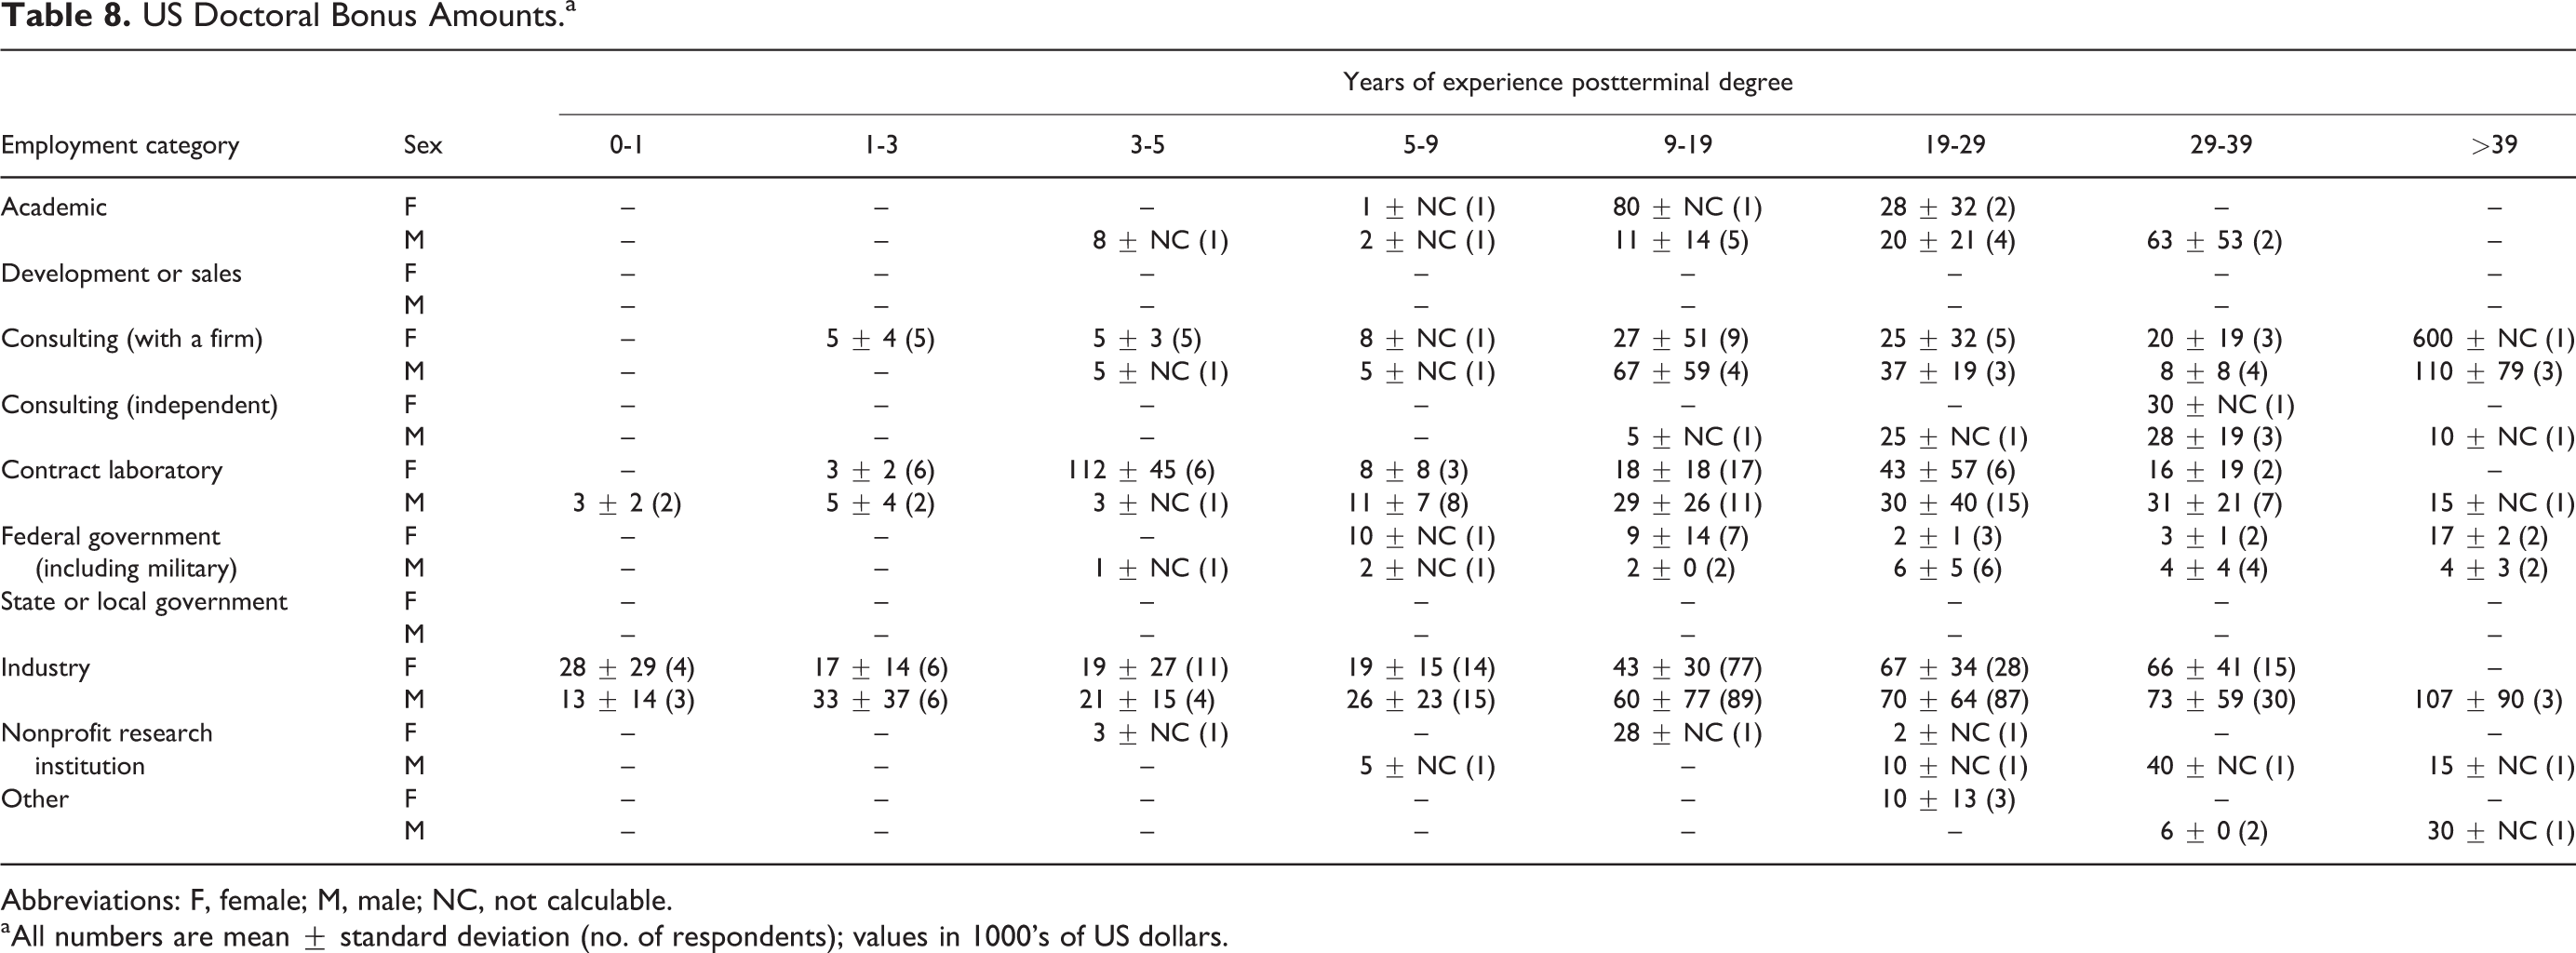
Abbreviations: F, female; M, male; NC, not calculable.
a All numbers are mean ± standard deviation (no. of respondents); values in 1000’s of US dollars.
Distribution of Respondents by Country.
Distribution of Employed Canadian Respondents by Province.
Distribution of Employed US Respondents by State.
2017 Society Membership of Respondents.
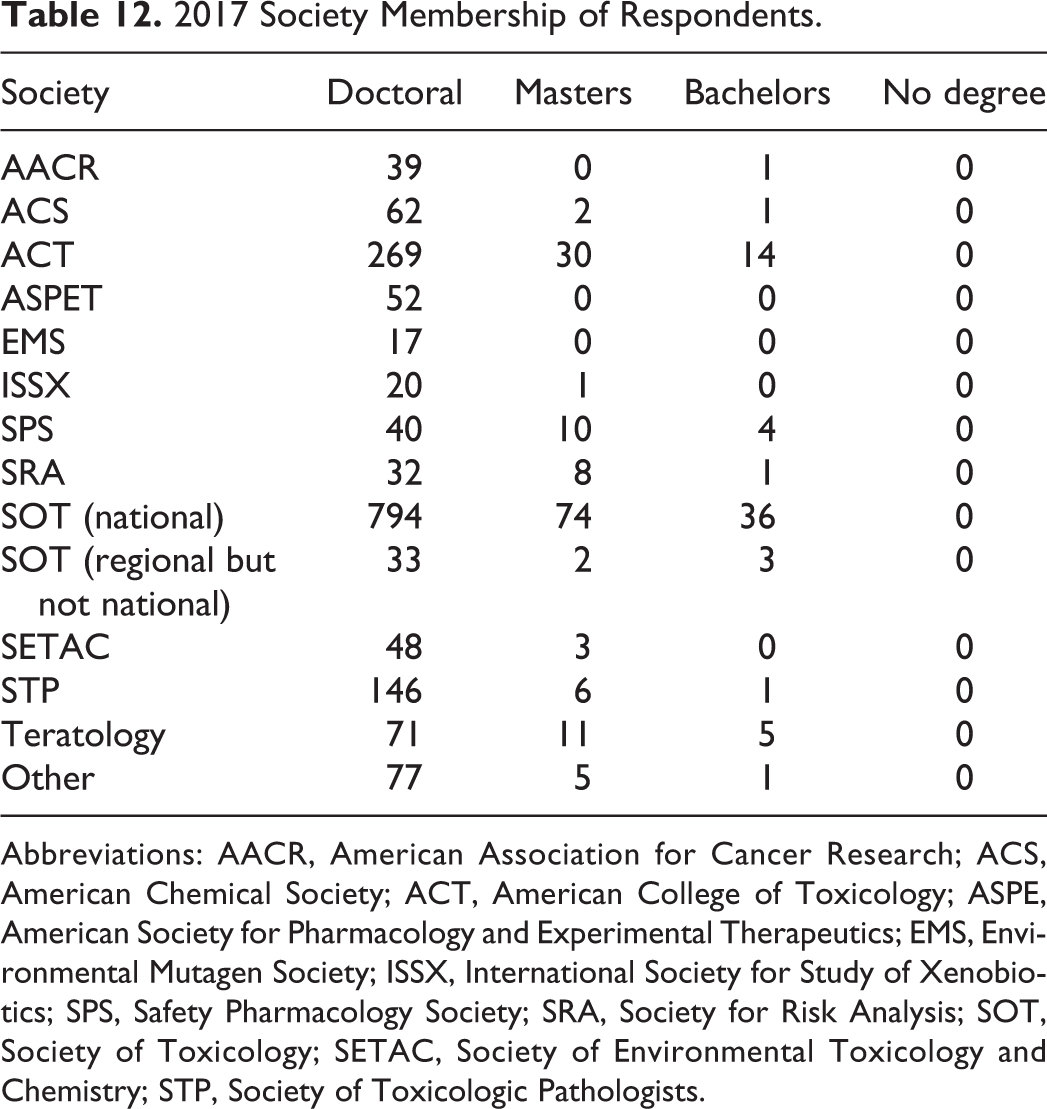
Abbreviations: AACR, American Association for Cancer Research; ACS, American Chemical Society; ACT, American College of Toxicology; ASPE, American Society for Pharmacology and Experimental Therapeutics; EMS, Environmental Mutagen Society; ISSX, International Society for Study of Xenobiotics; SPS, Safety Pharmacology Society; SRA, Society for Risk Analysis; SOT, Society of Toxicology; SETAC, Society of Environmental Toxicology and Chemistry; STP, Society of Toxicologic Pathologists.
Board Certification and Doctoral Salaries.a
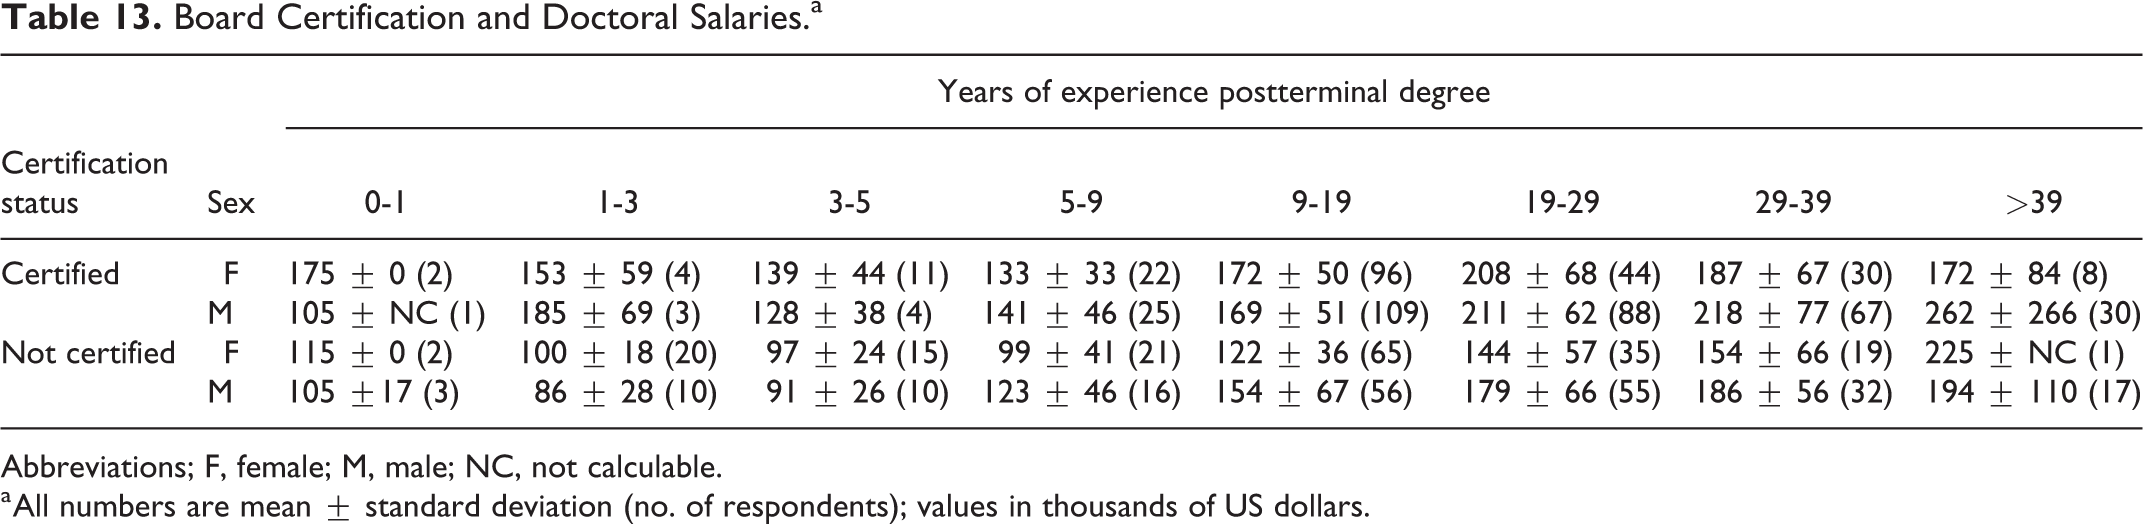
Abbreviations; F, female; M, male; NC, not calculable.
a All numbers are mean ± standard deviation (no. of respondents); values in thousands of US dollars.
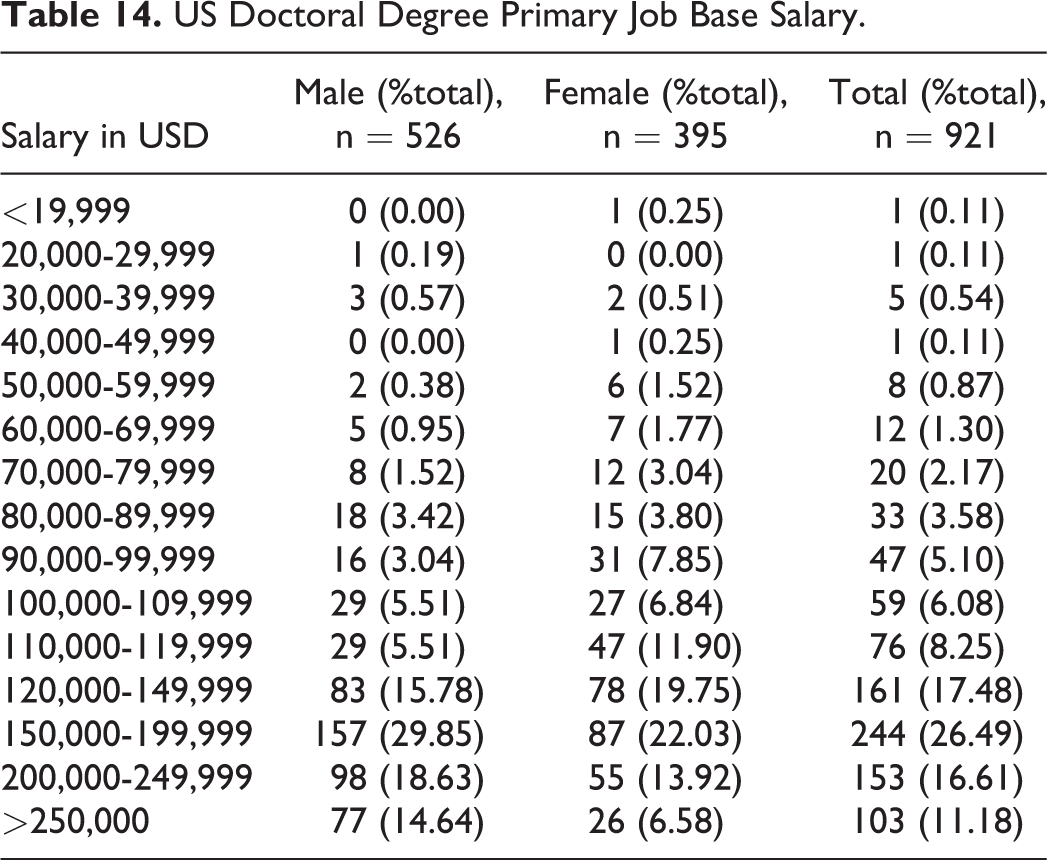
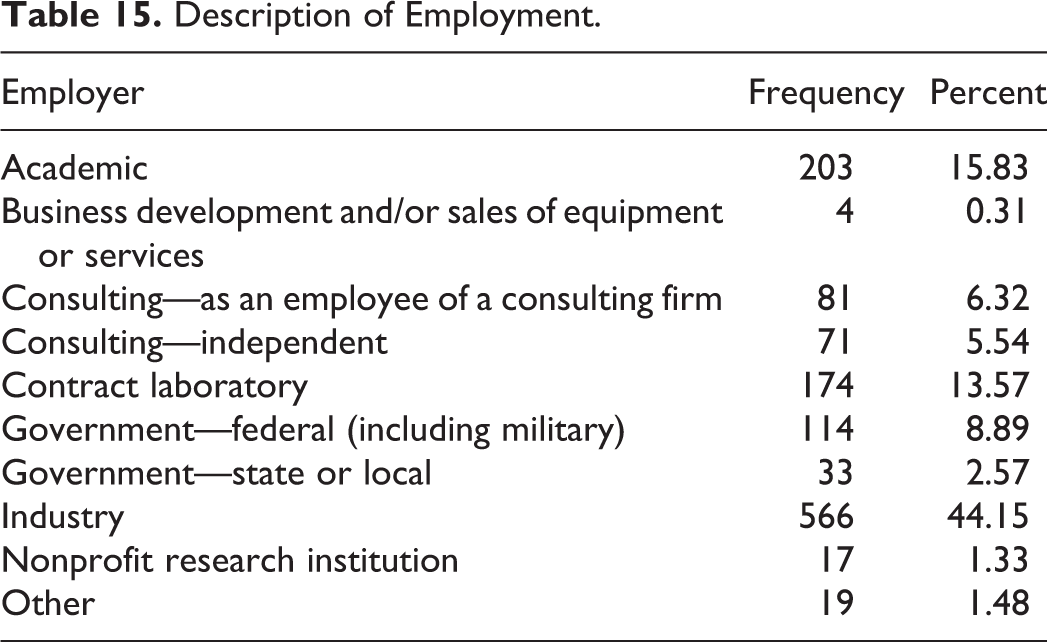
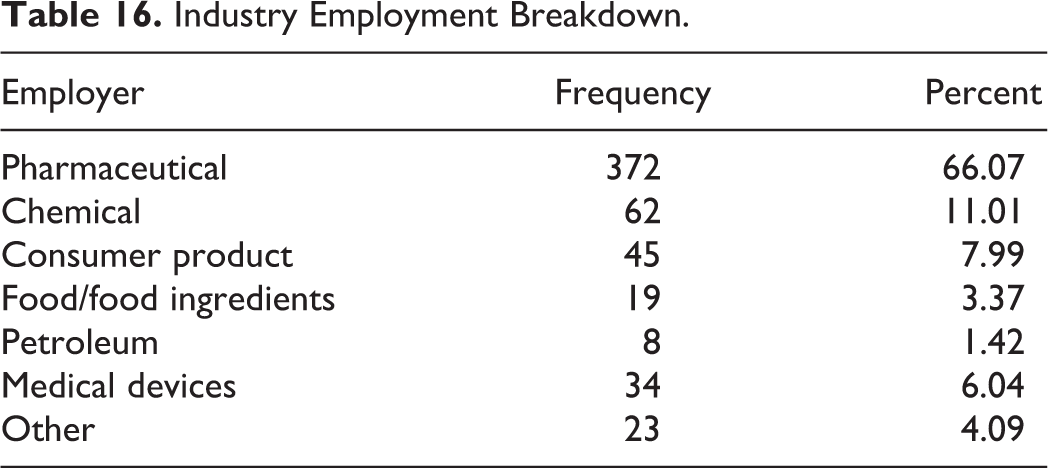
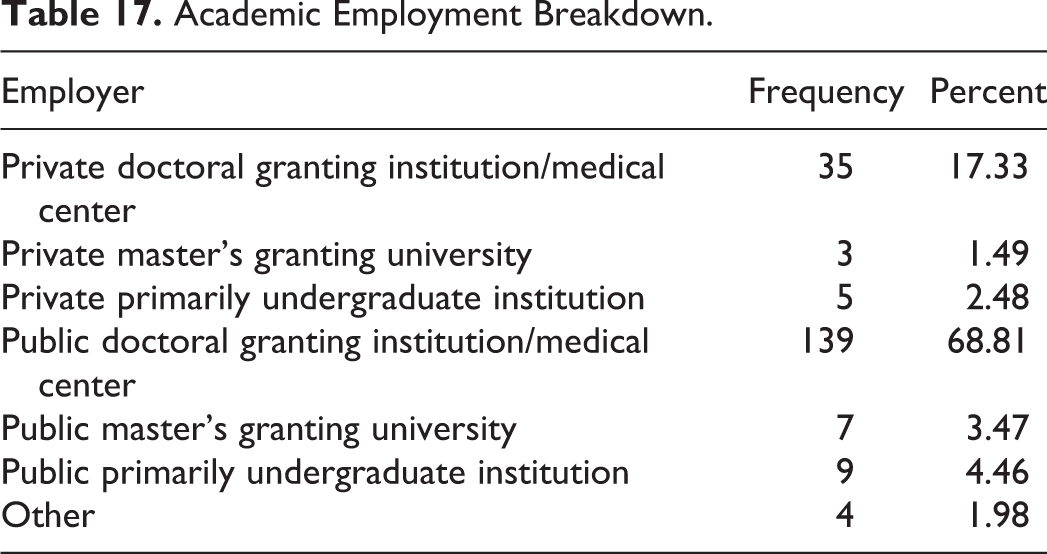
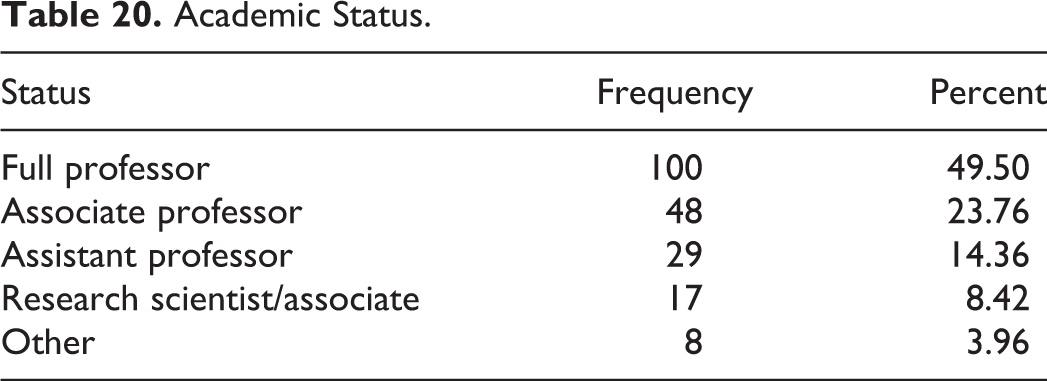
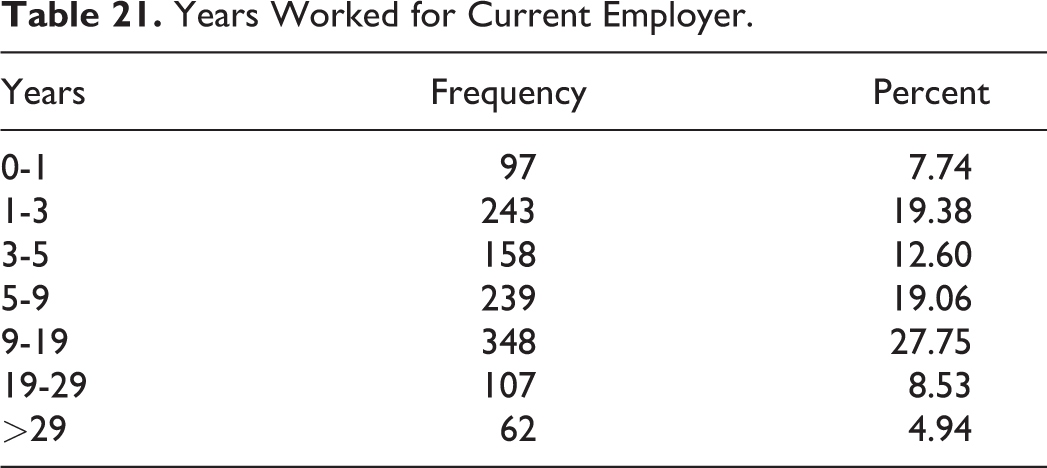
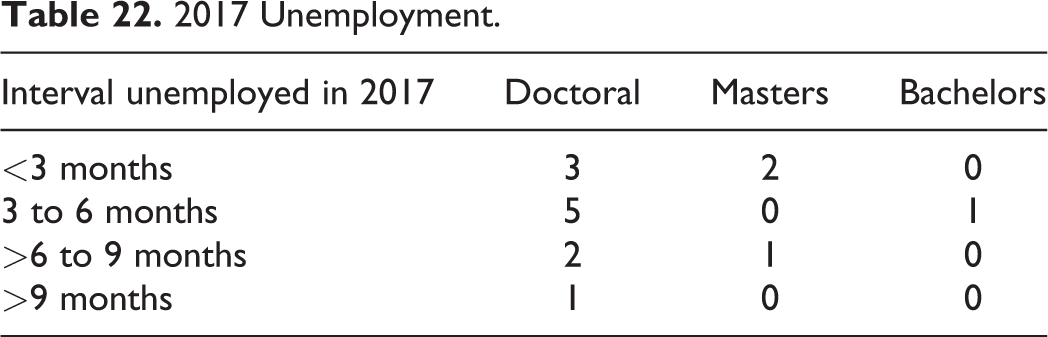
Table 14 presents a summary of base salaries for doctoral degrees. Table 15 provides an overview of employment with the 2 largest categories, industry and academia, broken down into Tables 16 and 17, respectively. Doctoral-level salaries for industrial and academic subcategories are reported in Tables 18 and 19, respectively. Table 20 summarizes academic employee status. Table 21 presents an overview of the number of years respondents have worked for their current employer. Table 22 provides a summary of unemployment and unemployment intervals during 2017. Finally, Table 23 summarizes employer-provided benefits, including health insurance and retirement plans.
US Doctoral Degree Primary Job Base Salary.
Description of Employment.
Industry Employment Breakdown.
Academic Employment Breakdown.
Industry Salaries for Doctoral Respondents.a
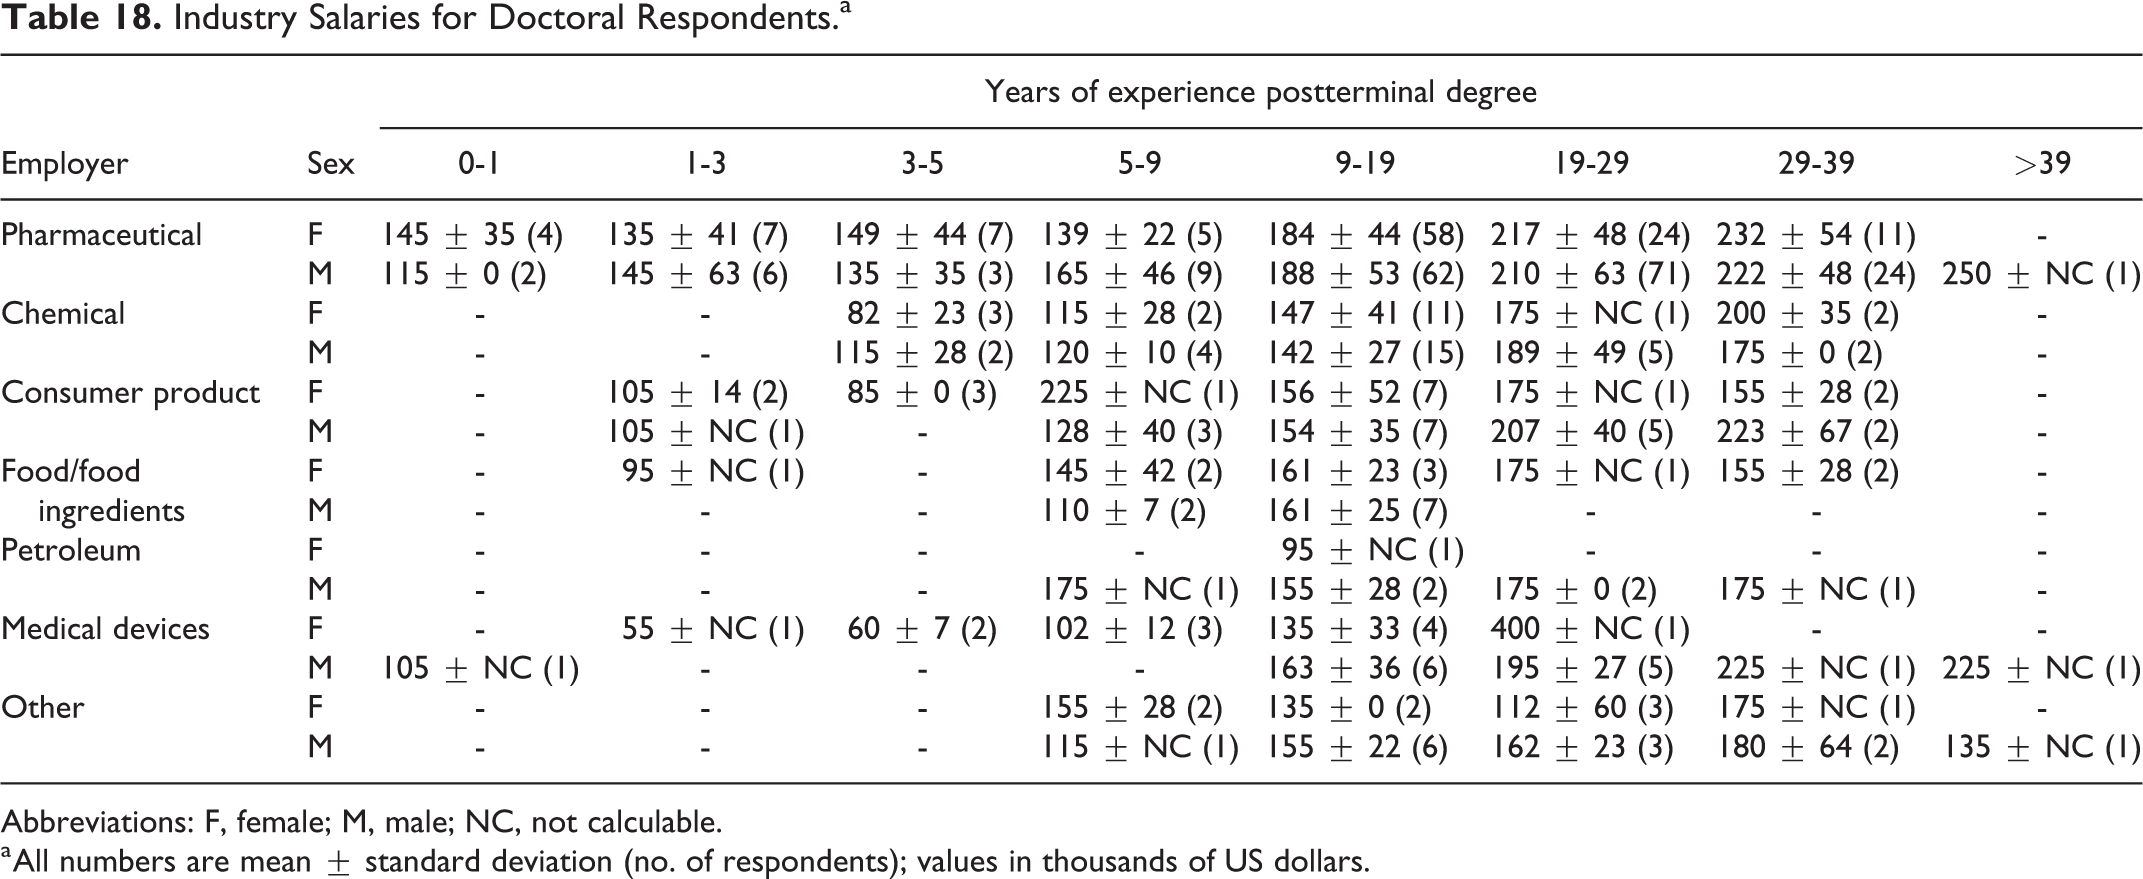
Abbreviations: F, female; M, male; NC, not calculable.
a All numbers are mean ± standard deviation (no. of respondents); values in thousands of US dollars.
Academic Salaries for Doctoral Respondents.a
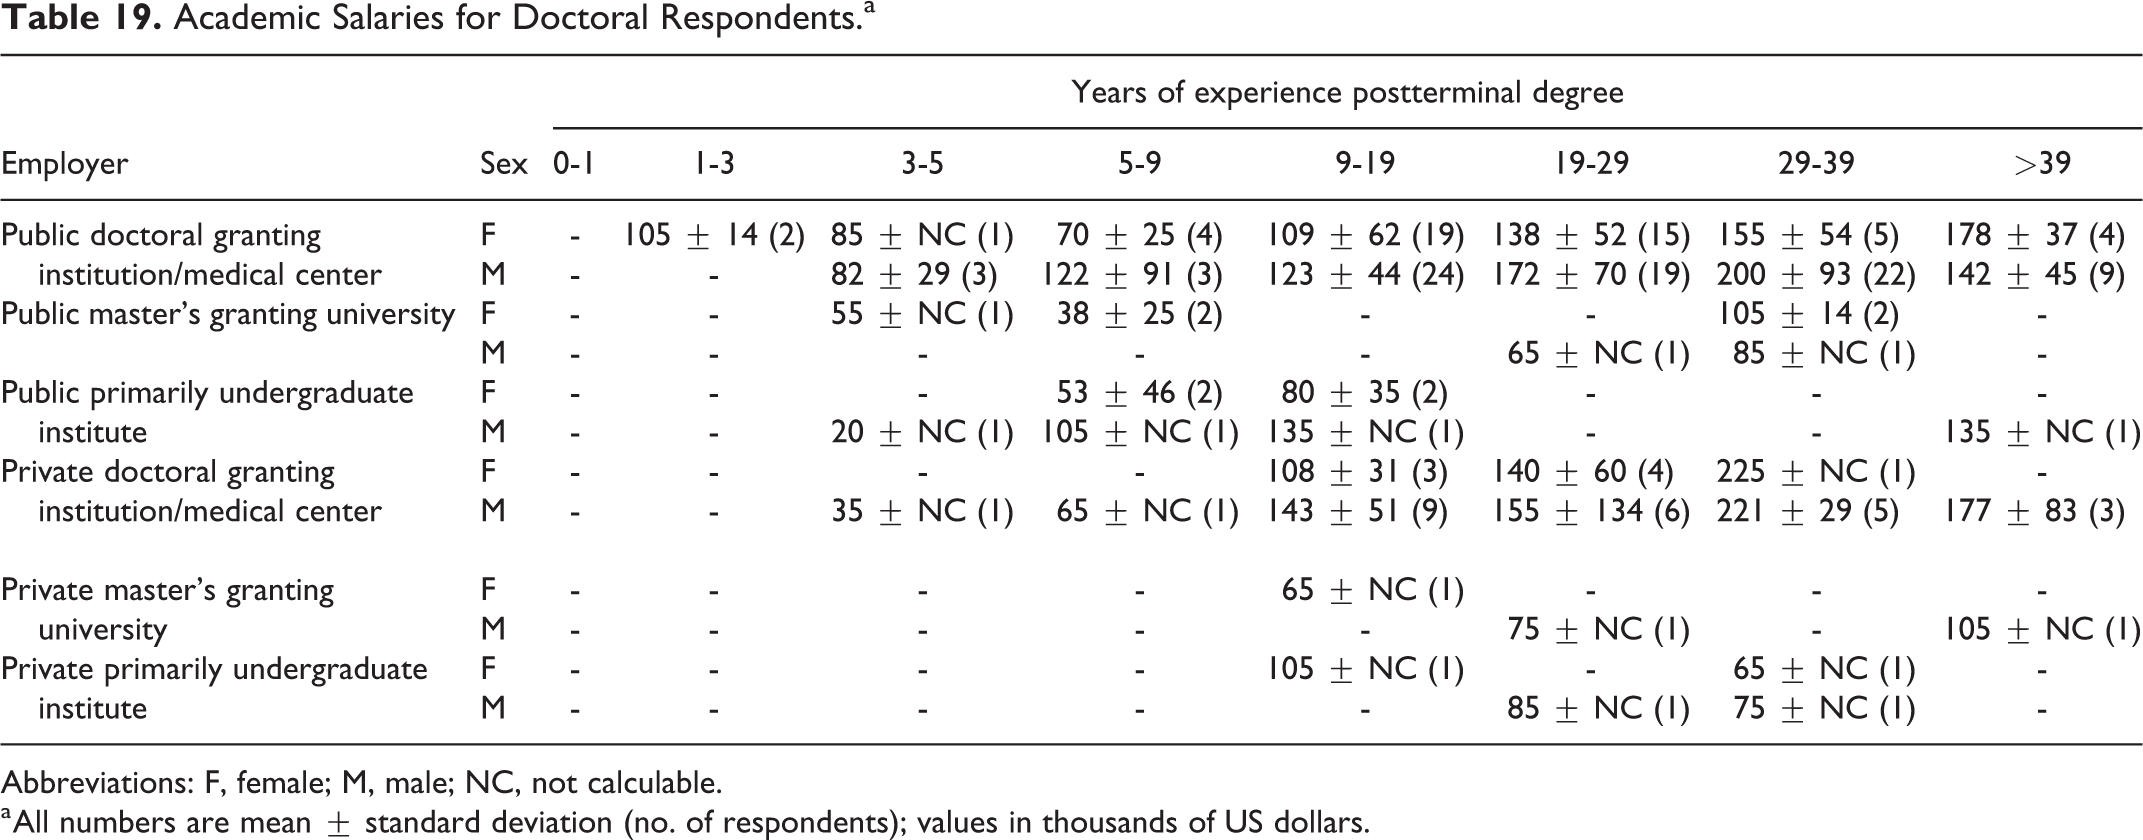
Abbreviations: F, female; M, male; NC, not calculable.
a All numbers are mean ± standard deviation (no. of respondents); values in thousands of US dollars.
Academic Status.
Years Worked for Current Employer.
2017 Unemployment.
Employer-Provided Benefits.
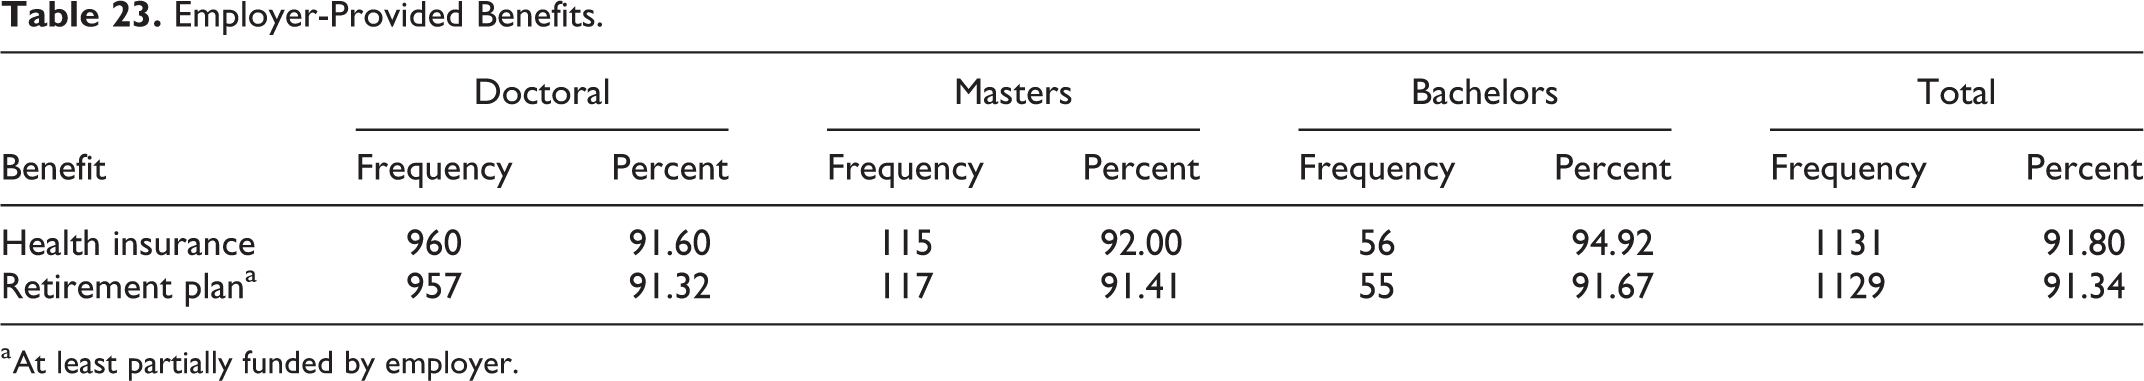
a At least partially funded by employer.
Discussion and Conclusions
The current survey results point to a number of different trends that deserve attention by major professional societies and add some insights into the job market, career path, and the conduct of future toxicology salary surveys. First, although the situation continues to improve for most entry-level and early career positions, women continue to be compensated at a lower level than their male counterparts. Second, salaries as a whole have increased in the field, but the most impressive differences are not by geographic location of place of employment but rather by type of employer. Additionally, certification continues to play a significant positive role in compensation. Periods of unemployment remained low in 2017, with most unemployment lasting 6 months or less. Most employers (over 91%) provided health insurance and retirement plans for employees.
Finally, the lag between survey responses being provided by participants, the availability of data for analysis, and the publication of these data were excessive. Furthermore, the inclusion of those who were not holders of doctorates was insufficient. The data collection for the next survey should be revised to improve the coverage of potential respondents as well as decrease the timing from survey distribution to publication.
Footnotes
Author Contributions
Dexter W. Sullivan and Shayne C. Gad contributed to conception and design; contributed to acquisition, analysis, and interpretation; drafted the manuscript; critically revised the manuscript; gave final approval; and agree to be accountable for all aspects of work ensuring integrity and accuracy.
Declaration of Conflicting Interests
The author(s) declared no potential conflicts of interest with respect to the research, authorship, and/or publication of this article.
Funding
The author(s) received no financial support for the research, authorship, and/or publication of this article.