
Abstract
N9-GP/Rebinyn®/Refixia® is an approved PEGylated (polyethylene glycol-conjugated) recombinant human factor IX intended for prophylactic and/or on-demand treatment in adults and children with haemophilia B. A juvenile neurotoxicity study was conducted in male rats to evaluate effects on neurodevelopment, sexual maturation, and fertility following repeat-dosing of N9-GP. Male rats were dosed twice weekly from Day 21 of age with N9-GP or vehicle for 10 weeks, followed by a dosing-free recovery period for 13 weeks and terminated throughout the dosing and recovery periods. Overall, dosing N9-GP to juvenile rats did not result in any functional or pathological effects, as measured by neurobehavioural/neurocognitive tests, including motor activity, sensory function, learning and memory as well as growth, sexual maturation, and fertility. This was further supported by the extensive histopathologic evaluation of brain tissue. Exposure and distribution of polyethylene glycol was investigated in plasma, choroid plexus, cerebrospinal fluid, and brain sections. PEG did not cross the blood brain barrier and PEG exposure did not result in any effects on neurodevelopment. In conclusion, dosing of N9-GP to juvenile rats did not identify any effects on growth, sexual maturation and fertility, clinical and histological pathology, or neurodevelopment related to PEG exposure and supports the prophylactic use of N9-GP in children.
Introduction
Haemophilia B is a rare congenital X-linked bleeding disorder mainly affecting the male population and is caused by mutations in the gene encoding coagulation factor IX, resulting in abnormal coagulation and bleeding events, depending on the residual factor activity in plasma. 1 The gold standard treatment of severe haemophilia B is based on prophylaxis replacement of coagulation factor IX. 2 Nonacog beta pegol (N9-GP, Rebinyn®, Refixia®) is a recombinant human coagulation factor IX approved for use in adults and children with haemophilia B for prophylaxis, on-demand treatment and control of bleeding episodes as well as for perioperative management of bleeding (at present, age and indication in label vary between countries).
N9-GP is conjugated with a 40 kDa branched polyethylene glycol (PEG) to enable high and sustained FIX plasma concentrations following a once-weekly treatment regimen. PEG is widely used in pharmaceuticals as a conjugate to the active drug, and PEGylation is a well-established technique commonly used to prolong the circulating half-life of drugs. 3 A large number of PEGylated products are currently on the market or in development, including therapeutic proteins for haemophilia A and B, growth hormone deficiency, Crohn’s disease, and rheumatoid arthritis, e.g. Adynovate®, Esperoct®, Skytrofa® and Cimzia®. The nonclinical toxicity profile of PEG has been extensively characterised,3,4 and at clinically approved doses of PEG-conjugated compounds, no functional or toxicologically relevant effects related to PEG exposure have been observed.3,5-8 In some nonclinical toxicology studies dosing of PEG (alone or conjugated to a drug), including approved PEGylated biopharmaceuticals (e.g. Somavert®, Cimzia®, Krystexxa®, Omontys®, Skytrofa®, and Aspaveli®/Empaveli®), cellular vacuolation, primarily in macrophages and epithelial cells in various tissues and excretory organs such as the kidney, liver, and choroid plexus, has been observed.3,7,9-13 The presence of these PEG-related vacuoles has not been reported to result in any cellular reaction (e.g. inflammation, degeneration or necrosis) and were not associated with adversity or in vivo functional changes in the animals, and in general PEG-associated cytoplasmic vacuolation has been considered an adaptive nonadverse finding associated with physiologic autophagy.3,4,7,9
Nevertheless, the increasing number of PEGylated drugs currently in development has led drug regulatory agencies to pay close attention to the biodistribution, disposition, and long-term impact of exposure to PEG. 4 Based on the morphologic findings observed in routine histopathologic evaluation during nonclinical safety assessment of multiple approved PEGylated drugs, regulators and others have expressed concerns regarding the long-term effects of PEG exposure in vital tissues/structures such as the choroid plexus.3,4,14,15 It has been emphasised that during safety assessment of PEGylated drugs, location, severity, and reversibility of any potential morphologic changes (e.g. vacuolation, tissue degeneration, cellular distortion, inflammation, necrosis), should be carefully evaluated. 3
To further address potential effects of exposure to N9-GP on juvenile development following repeat-dosing, a juvenile neurotoxicity study was conducted in male rats. The study included extensive in-life testing for effects on neurological and neurocognitive development including a series of different methods evaluating behaviour, motor activity, sensory function, and learning and memory. Assessment of sexual maturation and fertility was also performed. Animals were evaluated during twice weekly dosing with N9-GP from Day 21 of age (i.e. after weaning) for up to 10 weeks, as well as during a dosing-free recovery period of up to 13 weeks to assess for reversibility of potential changes and late/delayed-onset effects. Furthermore, extended histopathological assessment of the CNS, evaluation of PEG distribution in CNS and choroid plexus, as well as PEG exposure in plasma, CSF and choroid plexus was performed. As human coagulation factor IX is not pharmacologically active in rats, pharmacodynamic effects of dosing rats with N9-GP are not expected.
Materials & Methods
Animals and Study Design
Animals and housing
Sprague Dawley [Crl:CD(SD)] rats supplied by Charles River Ltd. (UK) were used. 44 parental females with randomized litters comprising eight male offspring were delivered on Day 15 or 16 of age (offspring). To provide non-natural litters, litter randomization was performed on Day 1 of lactation/age: all pups were removed from their natural dam, mixed and then randomly returned to a dam until required litter size and sex was attained to decrease maternal bias.
On Day 21 of age, animals were allocated into groups based on body weight from Day 18 of age. Animals at the extremes of body weight range or litters showing large variation in individual weights were not selected. Up to four juveniles from each randomized litter were assigned to each group (see study design below), such that representatives of each randomized litter were present in at least two dose groups; weight range on Day 21 of age was 41 to 77 g. Animals were housed under controlled environmental conditions (20-24°C, 40-70% humidity, 12-h light-dark cycle) in solid bottom polycarbonate cages with a stainless-steel mesh lid, plastic shelters, paper shavings during lactation, and sawdust litter with wood blocks as environmental enrichment (from weaning, Day 21 of age). During acclimatization (at least five days) and lactation animals were housed one parental female + litter/cage, post-weaning, up to four animals/cage. Animals were offered a standard pelleted diet (adult and weaned) and water ad libitum. During the study, body weight was recorded twice weekly. In addition to the above, untreated female Sprague Dawley rats were included for fertility assessment of the Main[W10] subset males (see below), details on these animals are included separately below.
Study design
i.v. dosing to rats during the preweaning period was not feasible, due to their small size and narrowness/fragility of the blood vessels, thus, it was not possible to dose the rats prior to Day 21 of age. Therefore, animals were dosed twice weekly from Day 21 of age (i.e. after weaning) with an i.v. bolus (tail vein) of either vehicle (controls) or N9-GP (Figure 1). Three N9-GP dose levels were included, 120, 380, and 1200 IU/kg/twice weekly (corresponding to nominal PEG-doses of up to 6.9 mg/kg twice weekly), referred to as low-, mid-, and high-dose, respectively. The doses in the present study were selected based on results from a preliminary study in animals dosed from Day 24 of age (unpublished data). In order to ensure a relevant interpretation of the results for the clinical use of N9-GP, the selected doses aimed to result in rat plasma PEG exposure exceeding the human plasma PEG exposure following N9-GP prophylactic dosing.
16
Study design. The study included up to 10 weeks of dosing with either N9-GP (three dose-levels, low, mid, or high) or vehicle (control group) from Day 21 of age, followed by an up to 13-week long dosing-free recovery (R) period. Animals were terminated after 10 weeks of dosing and 13 weeks of recovery on Day 92 and 182 of age (n = 20/group/time-point); subsets of animals were terminated throughout the dosing period (at Day 24, 34, 48, and 69 of age, n = 8/group/time-point) as well as following 6.5 weeks of recovery (Day 137 of age, n = 8/group). R, recovery. W, week.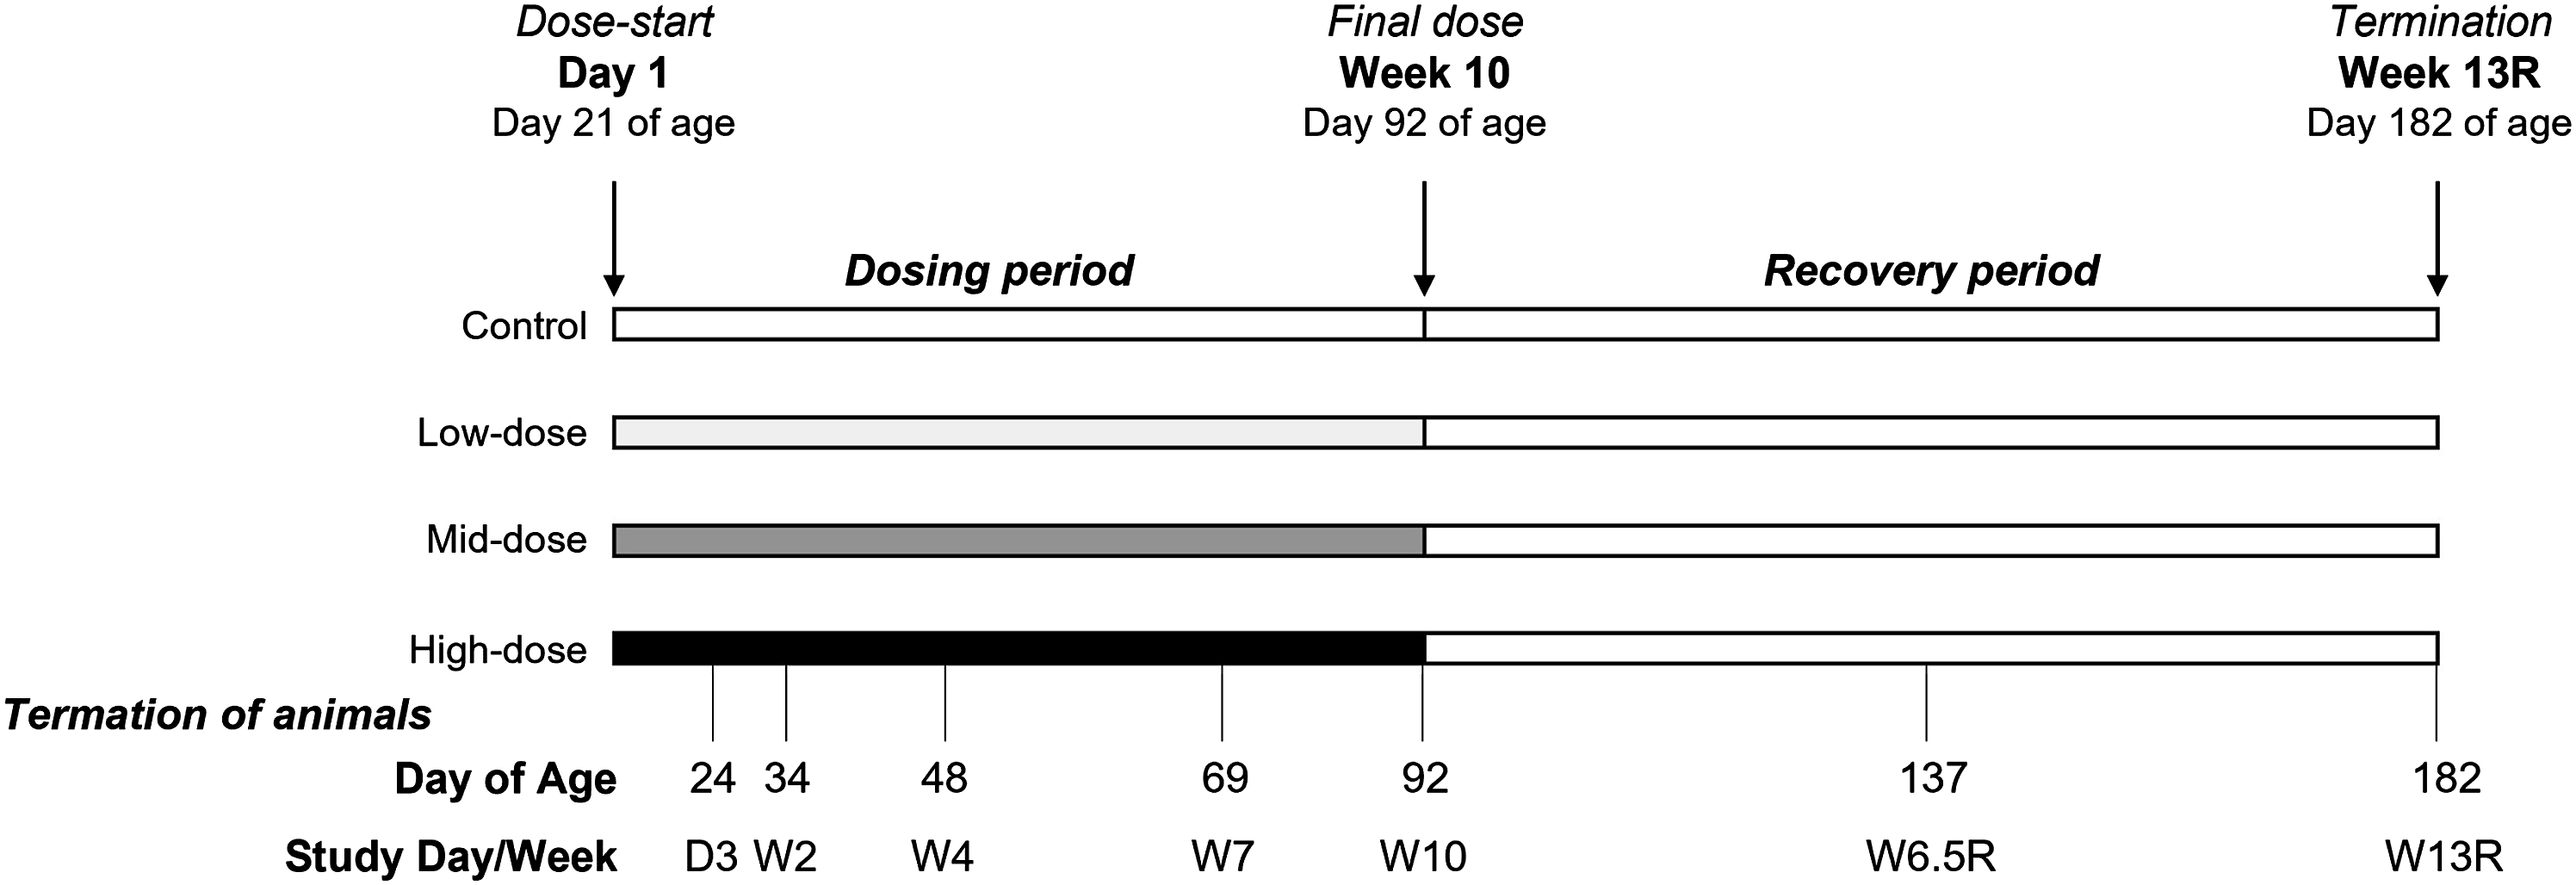
Dosing continued for up to 10 weeks, where a subset of animals was terminated (designated as Main[W10] subset, n = 20/group) (Figure 1). In addition, a subset of animals was allowed a dosing-free recovery (R) period of up to 13 weeks were included (MainRecovery[W13R] subset, n = 20/group). Smaller subsets of animals were terminated (n = 8/group for each subset) intermittently at the following study days/weeks: Day 3, Week 2, Week 4, and Week 7 during the dosing period, and Week 6.5 during the recovery period (subsets Interim[D3], Interim[W2], Interim[W4], Interim[W7], and InterimRecovery[W6.5R]).
The SD rat was chosen as the test species because of availability of historical control data, including behavioural and neurophysiological and neuropathology data. Males only were used to reduce the number of animals and because haemophilia almost exclusively affects the human male population. The i.v. route of administration is the clinical route of administration and was chosen, as it was well-tolerated in the preliminary study in post-weaned SD rats from Day 21 of age (unpublished data).
Termination
Overview of Allocations to Histologic Evaluations and Sampling for N9-GP PEG Quantification. Int, interim. Rec, recovery.
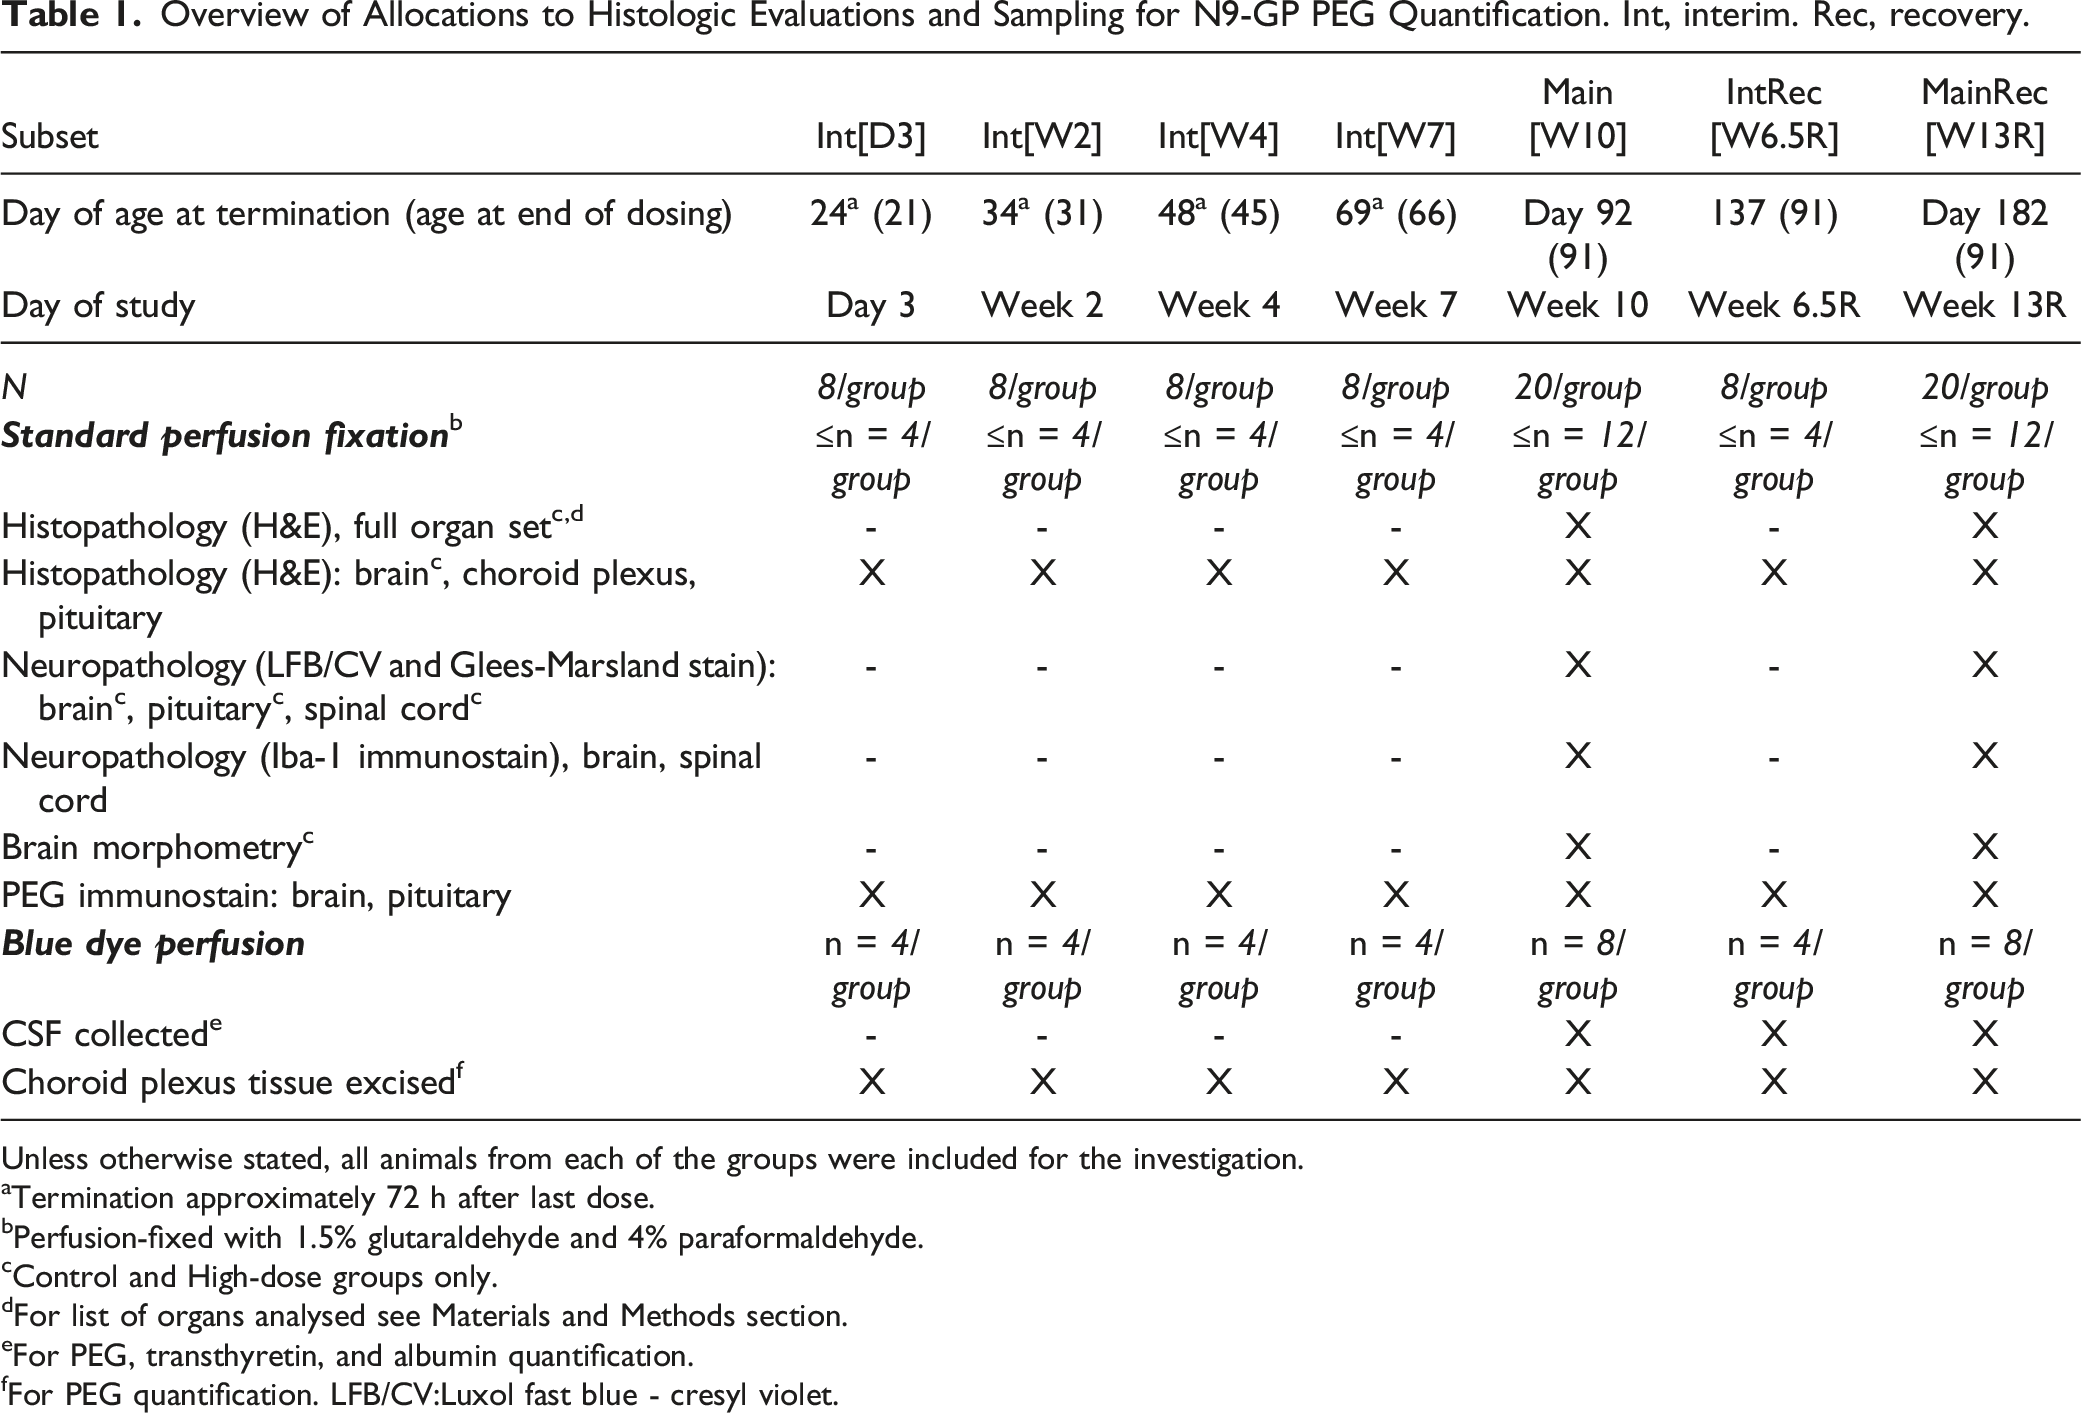
Unless otherwise stated, all animals from each of the groups were included for the investigation.
aTermination approximately 72 h after last dose.
bPerfusion-fixed with 1.5% glutaraldehyde and 4% paraformaldehyde.
cControl and High-dose groups only.
dFor list of organs analysed see Materials and Methods section.
eFor PEG, transthyretin, and albumin quantification.
fFor PEG quantification. LFB/CV:Luxol fast blue - cresyl violet.
All procedures involving live animals were performed under the Project Licence authorized by the United Kingdom Secretary of State and according to EC Commission Directive 2004/10/EC, OECD Principles of Good Laboratory Practice, and The UK Good Laboratory Practice (Statutory Instrument 1999 No. 3106, as amended by Statutory Instrument 2004 No. 994) [9–11] as well as Labcorp Drug Development and Novo Nordisk A/S company policies on the care and use of laboratory animals. The study was conducted at Labcorp including all in-life assessments and terminal procedures, as well as formulation analysis, clinical pathology, PEG IHC and cell-specific staining of tissue slides, as well as histopathologic evaluation. Bioanalysis of PEG in plasma, toxicokinetic data analysis, quantification of anti-drug antibodies in plasma, quantification of CSF transthyretin (TTR) and albumin levels, PEG IHC evaluation on tissue sections (qualitative and semi-quantitative), and peer-review of histopathology were performed at Novo Nordisk A/S. Bioanalysis of PEG in CSF, and choroid plexus tissue was performed at Pharm-Analyt Labor GmbH, Austria (method development in collaboration with Novo Nordisk A/S).
Compound
The test substance used was glycoPEGylated recombinant human coagulation factor IX (nonacog beta pegol, N9-GP, Rebinyn®, Refixia®, Novo Nordisk A/S, Denmark), which is conjugated with a 40 kDa branched PEG. This was supplied as lyophilized powder and reconstituted using histidine solvent prepared on each day of dosing (composition of test substance: N9-GP, NaCl, L-histidine, sucrose, mannitol, Tween 80; composition of the vehicle was the same as for the test substance, except N9-GP was excluded). Concentrations for the three dose levels were 25, 79, and 250 IU/ml for low-, mid- and high-dose, respectively (dose volume 4.8 ml/kg). Achieved N9-GP dose formulation homogeneity and concentration were confirmed by quantification of total protein content (using ultra performance liquid chromatography) in samples taken from formulations prepared for dosing throughout the study (data not shown). N9-GP exposure was not measured as this was done in previous studies ( 17 and unpublished data) and focus in the present study was on PEG exposure.
In Life Assessments
Clinical observations
Following study start, at Day 21 of age, animals were inspected visually at least twice daily for evidence of ill-health or reaction to treatment and cages and inspected daily for evidence of animal ill-health. Additionally, on days of dosing, detailed observations were made pre-dosing, one to two hours after dosing, and as late as possible in the working day. During the acclimatization and recovery periods and on non-dosing days, observations of the animals and their cages were recorded at least once per day. A detailed physical examination was performed on each animal to monitor general health according to the following schedule, stock parental females: Within 24 h of arrival and on Day 21 of lactation, juvenile rats: On Day 21 of age, hereafter weekly to scheduled termination. A viability check was performed twice daily; animals were killed for reasons of animal welfare where necessary.
Limb measurements
The length of the left ulna was recorded every two weeks from Day 21 of age until termination in the main subsets Main[W10] and MainRecovery[W13R] as well as interim subsets Interim[W4], Interim[W7], and InterimRecovery[W6.5R]. The distance from the thumb (digit 1) to the olecranon of the ulna was measured using digital calipers. Animals scheduled to be terminated on Day 3 and Week 2 (Day 24 and 34 of age) were not assessed since scheduled termination occurred prior to the second scheduled limb measurement recording.
Sexual maturation
Sexual maturation was assessed by daily examination from Day 35 of age for onset and completion of balano-preputial separation (subset Interim[W7], Main[W10], InterimRecovery[W6.5R], and MainRecovery[W13R] only).
Fertility assessment
The fertility of the subset Main[W10] males was assessed in Study Week 9 (12 weeks of age) using untreated females of the same source and strain (n = 20/group). Details are included in the suppl. information (section 1.1). Females were terminated on Day 15 after mating and percentage mating (no. of animals mating/animals paired), conception rate (no. of animals achieving pregnancy/animals mated), as well as fertility index (no. of animals achieving pregnancy/animals paired) was calculated as a measure of mating performance and fertility.
Neurobehavioural assessment
Animals were examined in a series of tests during the dosing and dose-free recovery period to assess effects of N9-GP-dosing on neurodevelopment. The evaluation comprised four different tests: Functional observational battery testing (behaviour, motor deficits, sensory function), automated motor activity monitoring, auditory startle pre-pulse inhibition (sensory function), and Morris water maze (learning and memory) (see below). To limit handling of and carry-over effects in individual animals, tests were distributed across animals from subset Main[W10], InterimRecovery[W6.5R], and MainRecovery[W13R]. An overview of the timing of the different tests is included in Figure 2. All tests were performed by staff experienced in each procedure, and who were aware of the importance of carefully controlling all aspects of the testing environment to limit the influence of external factors on the results. Details on parameters and recording/grading systems for the different tests are included in suppl. information (section 1.2). Timing (Day of age) of the different tests as part of the neurobehavioral assessment. The functional observational battery and motor activity monitoring were performed in all animals from the MainRecovery[W13R] subset, the auditory startle pre-pulse inhibition test was performed in the Main[W10] subset, and the Morris water maze in subset MainRecovery[W13R] (10 animals/group) and InterimRecovery[W6.5R] (8 animals/group) during the dosing period and in the MainRecovery[W13R] subset (all animals) during the recovery period. R, recovery.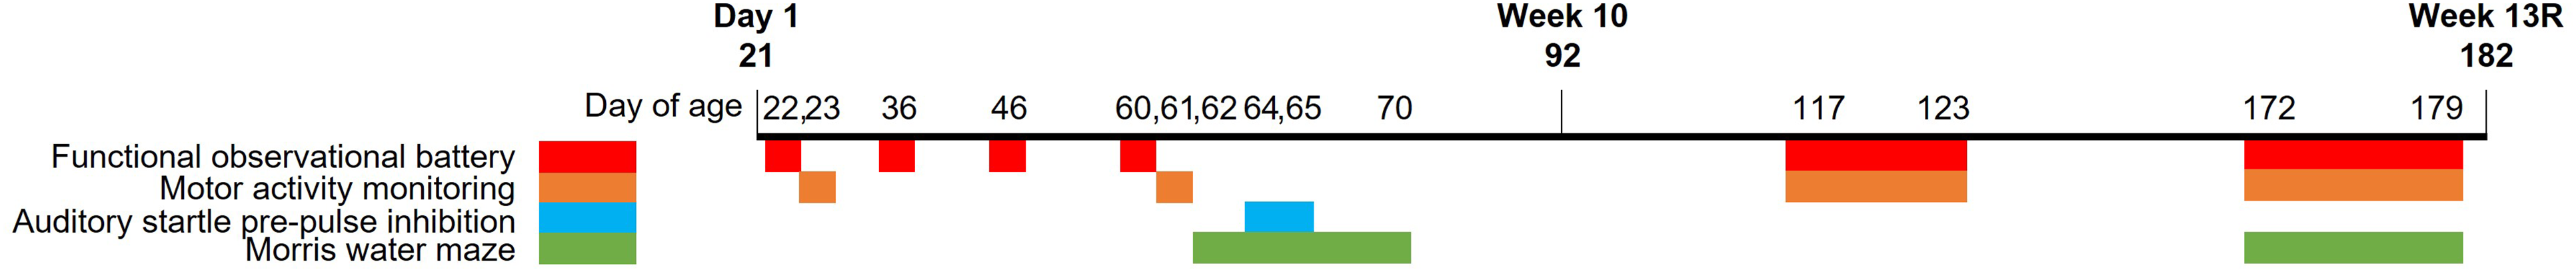
Functional observational battery testing
This was performed in all animals from the MainRecovery[W13R] subset on Days 22, 36, 46, 60 (i.e. during the dosing period), 117-123, and 172-179 (i.e. during the recovery period) of age (Figure 2). Behaviour was monitored as appropriate for the developmental stage being observed. Animals were tested by an observer unaware of the group to which each individual animal was assigned. Within each testing occasion, as far as possible, the same observer was assigned. The functional observation battery comprised a series of measurements, counts and observations performed in an order of increasing complexity, such that the least stressful observations were conducted first. The results of the observations were recorded as present/absent and, where appropriate, graded for severity according to standardized scales. The testing conditions were kept as constant as possible between trials and potential interfering factors were minimized. All assessments were conducted the day following the latest dose administration during the treatment period and at a similar time of day for all assessments. The battery included both in-hand observations, arena observations, and reactivity investigations.
Automated motor activity monitoring
This was performed in all animals in the MainRecovery[W13R] subset on Days 23, 61 (during dosing period) of age, as well as Day 117-123 and 172-179 (during recovery period) of age (Figure 2). Animals were not all tested on the same day, but the numbers of animals and the times of testing were balanced across the groups on each day of testing.
Auditory startle pre-pulse inhibition
This was performed in the Main[W10] subset on Days 64-65 of age (Figure 2); assessment was not included during the recovery period due to upper restrictions on body weight of the recording equipment.
Morris water maze
This was performed in subset MainRecovery[W13R] and InterimRecovery[W6.5R] on Day 62-70 of age (during dosing period) and in the MainRecovery[W13R] subset during Day 172-179 of age (during recovery period) (Figure 2). A series of three trials were conducted on each of four consecutive days. On the fifth day, a single memory probe test was performed. Testing was limited to half of subset MainRecovery[W13R] animals during Day 62-70 of age in order to investigate possible carry over effects in the recovery period in naïve animals.
Blood and CSF Sampling
Clinical pathology
Hematology
During last week of dosing (Week 10) and Week 10 of recovery, blood (0.5 ml) was sampled from the Main[W10] (prior to dosing) and MainRecovery[W13R] subset animals (sublingual vein during light isoflurane anesthesia, EDTA anticoagulant) following overnight withdrawal of food. From the same animals, at the same occasions, blood was sampled (0.7 ml, lithium heparin anticoagulant) for clinical chemistry measurements.
Plasma for quantification of PEG
For plasma PEG profiles, blood samples were obtained on Day 1 of dosing (Day 21 of age) from subset InterimRecovery[W6.5R] animals at 1 h and 24 h after dosing (n = 4/group/time-point) and following the final dose (Day 91 of age) after 1 h, 24 h, 384 h (Day 107 of age), 744 h (Day 122 of age), and 1104 h (Day 137 of age) (all animals/time-point). A sample was not obtained from one high-dose group animal on Day 1 of dosing. For single time-point measurements, all animal subsets except for InterimRecovery[W6.5R] were sampled. Sampling was performed at termination (approximately 72 h after last dose). Additionally, the subset MainRecovery[W13R] animals were sampled on Day 92 of age (approximately 24 h after final dose).
On Day 21 of age (Day 1 of dosing) 0.3 ml blood was drawn and 0.6 ml on remaining days (3.8% citrate anticoagulant): In-life samples were taken from the jugular vein, terminal samples from the sublingual vein or retro-orbital sinus (under isoflurane anaesthesia). The separated plasma was stored frozen (-10 to -30°C) until analysis.
Anti-drug antibody analysis
On Day 92 of age (Week 10), blood was sampled (0.6 ml, 3.8% citrate anticoagulant) from animals in subset MainRecovery[W13R] and InterimRecovery[W6.5R] groups 24 h after the final dose. Additionally, all animals were sampled at scheduled termination. In-life samples were taken from the jugular vein, terminal samples from the sublingual vein or retro-orbital sinus. The separated plasma was stored frozen (-10 to -30°C) until analysis.
CSF for quantification of PEG, transthyretin (TTR), and albumin
CSF was sampled from the subset Main[10W] (Day 92 of age), InterimRecovery[W6.5R] (Day 137 of age), and MainRecovery[13WR] (Day 182 of age) groups at termination from animals allocated to blue dye perfusion (see Table 1). Following euthanasian, CSF samples were collected (50 µl without blood contaminant) by puncture of the cisterna magna using a syringe. Samples were frozen immediately on dry ice and thereafter held deep frozen (-60 to -90°C) until analysis.
Tissue Sampling
Following termination, all animals were subjected to a thorough macroscopic examination of cranial, thoracic and abdominal cavities and tissues; all external features and orifices were examined visually. Weight of selected organs was obtained for all animals.
Animals for standard perfusion fixation
The brain was severed from the spinal cord above the first cervical spinal nerve (for histology and morphometry, see Table 1). Sampling of organs/tissues for histopathologic evaluation are specified below.
Animals for non-standard blue dye perfusion
Choroid plexus was excised at termination (for PEG analysis) (Table 1). Before sampling, perfusion washing was performed via the aorta with saline solution containing 40 mg/litre Brilliant Blue in PBS to clear the choroid plexus capillaries of blood. Brilliant Blue was included in the perfusion for visualization of the choroid plexus. Lateral ventricle choroid plexus (bilateral) was excised from all animals. Collected choroid plexus samples were stored frozen (-60 to -90°C) until further analysis.
Histology
Histopathologic evaluation
From subsets Main[W10] and MainRecovery[W13R] animals selected for standard perfusion fixation (Table 1), sections from the following organs/tissues were examined for histopathologic changes (control and high-dose only, pituitary and choroid plexus were evaluated in all groups): Abnormalities, adrenals, brain (eight coronal levels to include all major regions, choroid plexus and circumventricular organs, see below), dorsal and ventral root fibers – cervical C3-C6 and lumbar L1-L4, dorsal root ganglia – C3-C6 and L1-L4, epididymides, eyes, injection sites (caudal veins), optic nerves, pituitary gland (- neurohypophysis, pars intermedia and pars distalis), prostate, sciatic nerves, seminal vesicles, skeletal muscle (gastrocnemius), spinal cord (cervical C3-C6, thoracic T5-T9, and lumbar L1-L4 levels), testes, thyroids, tibial nerves. For all other animal subsets, pituitary gland, and brain (eight coronal levels to include all major regions, choroid plexus and circumventricular organs) were evaluated (Table 1). All samples were perfusion fixed with 1.5% glutaraldehyde and 4% paraformaldehyde and further fixed in 10% neutral buffered formalin, embedded in paraffin, and sections of a nominal thickness of 4-5 µm were stained with H&E, except for peripheral nerves (tibial, sciatic), which were embedded in resin, and 2 µm sections were stained with toluidine blue. The fixation was limited to 48-72 h for neuro-related tissues. Thereafter, sections were evaluated by light microscopy by an experienced pathologist. Findings were either reported as “present” or assigned to one of five severity grades (minimal, slight, moderate, marked, severe). A reviewing pathologist undertook a peer review of microscopic findings.
Special procedures for brain sectioning
For all animals assigned to standard perfusion fixation, the brain was sectioned in accordance with the recommendations made by Bolon et al. and Rao et al,18,19 however slightly modified to display all the circumventricular organs as far as possible. An additional level was taken in the region of the optic chiasm in order to facilitate the sampling of the subfornical organ and the vascular organ of lamina terminalis (Level 2a). Sections of the eight brain levels are described in Suppl. Fig. S1. The sections included all major regions (caudate/putamen, cerebellum, cerebral cortex, choroid plexus, hippocampus, hypothalamus, medulla oblongata, midbrain, pons and thalamus). Particular attention was also given to the circumventricular organs (area postrema, median eminence, subfornical organ, vascular organ of lamina terminalis and pineal gland) and additional sections were taken when relevant. Choroid plexus was included at Levels 2a and 3. A minimum of three sections were then cut at approximately 25μm intervals to ensure that the optimal section was available for evaluation and morphometric assessment and stained with H&E.
Neuropathology
Cell specific staining
For standard perfusion fixed subset Main[W10] and MainRecovery[W13R] animals, additional special staining was performed to help assessment for potential neuropathologic changes. 4-5 µm sections of brain, pituitary, and spinal cord (control and high-dose only) were stained with luxol fast blue with cresyl violet (to highlight myelin and demonstrate neurons including subcellular structures) and Glees Marsland silver stain (to demonstrate neurons including dendrites and axons). In addition, 4-5 µm sections of brain levels 3 (taken at the infundibulum and/or median eminence) and 6 (at the mid-cerebellum) and spinal cord (longitudinal and transverse, control and high-dose only) were immunostained with anti-Iba-1 antibody, a microglial and macrophage marker (protocol included in suppl. information section 1.3).
Brain tissue sectioning and immunostaining for PEG
Additional 4-5 µm sections (routine-embedded in paraffin) were taken from the pituitary and eight different levels of the brain (L1, L2, L2a, L3, L4, L5, L6, and L7, see above) from all animal subsets and dose groups (Table 1); these sections were stained for PEG using immunohistochemistry (IHC) (see suppl. information section 1.4) and used for qualitative (microscopical) and semi-quantitative (image analysis) evaluation.
Microscopical evaluation
Sections were evaluated by light microscopy for presence of PEG by a trained toxicopathologist blinded with respect to animal number, group, and age.
Image-based analyses
Slides were scanned as 8-bit RGB colour images (pixel size: 221 nm) using a NanoZoomer S60 digital slide scanner (Hamamatsu Photonics K.K., Hamamatsu City, Japan). The image analyses were performed using Visiopharm Integrator System software (VIS ver. 8.4; Visiopharm, Hørsholm, Denmark). This analysis was used to determine the fraction of area with PEG positive immuno-signal or density of PEG-positive spots in the areas identified at the qualitative evaluation (details included in suppl. information section 1.4). This method is considered semi-quantitative, as it is not calibrated against a standard with a known PEG content, therefore, it is not possible to define a corresponding PEG tissue concentration or a lower limit of detection.
Brain morphometry
In control and high-dose groups from animal subset Main[W10] and MainRecovery[W13R] (Day 92 and Day 182 of age), morphometric measurements were conducted to measure thickness, width, or height of the brain at the following areas: Neocortex, hippocampus, corpus callosum, frontal and parietal cortex, striatum, and cerebellum. Measurements were performed by an examiner blinded to the identity of the groups, see suppl. information for method specifications (section 1.5).
PEG Quantification in Plasma, CSF, and Choroid Plexus Tissue
In plasma, total PEG (conjugated and free) concentrations were quantified using 1H-NMR; LLOQ = 3 µg/ml. In CSF, free PEG concentrations were quantified using HPLC-MS/MS; LLOQ = 50 ng/ml. In choroid plexus tissue, total PEG concentrations were quantified using HPLC-MS/MS; LLOQ = 25 ng/ml (in case the amount of collected choroid plexus tissue is 2 mg, this would correspond to a PEG tissue concentration of 5 µg/g). Methods are described in suppl. information (section 1.6).
Anti-Drug Antibodies in Plasma
As N9-GP antibodies can be directed against either the FIX part of the molecule or the 40 kDa PEG part of the molecule, or in theory also a combination epitope as PEG and FIX are covalently bound, two different internally validated ELISA assays were used; antibodies against the FIX part of the molecule or a potential combination epitope were measured using an anti-N9-GP bridging ELISA, anti-PEG antibodies were measured using a dedicated anti-PEG antibody ELISA, where 40 kDa PEG similar to the PEG attached to FIX was used as the coating layer (suppl. information section 1.7).
Toxicokinetic Analysis
Individual pharmacokinetic profiles of plasma total PEG (conjugated and free) concentration versus time were evaluated by non-compartmental analysis using Phoenix WinNonlin version 8.1. For plasma PEG profiles obtained after final dose in Week 10, at Day 91 of age (animal subset InterimRecovery[W6.5R]), the following toxicokinetic parameters were calculated: C0 (initial plasma concentration for i.v. administration), Ctrough, (pre-dose concentration), AUClast (area under the plasma concentration-time curve from time 0 to the last time of quantifiable concentration), tlast (time of last quantifiable plasma concentration). AUC was calculated using the “Linear Up Log Down” method, while C0 was estimated using log-linear regression of the first two data points. Individual plasma concentration values <LLOQ were excluded from the calculation.
Clinical Pathology
Hematology
The following hematologic parameters were measured using a Bayer ADVIA 120 analyzer: hematocrit, hemoglobin concentration, erythrocyte count, absolute reticulocyte count, mean cell hemoglobin, mean cell hemoglobin concentration, mean cell volume, red cell distribution width, total and differential leucocyte count, platelet count. Additional blood samples (0.5 ml) were taken (citrate anticoagulant) and examined using a Stago STA Compact Max analyzer and appropriate reagent in respect of: prothrombin time (PT) using IL PT Fibrinogen reagent and activated partial thromboplastin time (APTT) using IL APTT reagent.
Clinical chemistry
The following parameters were measured in plasma using a Roche Cobas 6000 Analyzer: alkaline phosphatase, alanine aminotransferase, aspartate aminotransferase, total bilirubin, urea, creatinine, glucose, total cholesterol, triglycerides, sodium, potassium, chloride, calcium, inorganic phosphorus, total protein, albumin.
Transthyretin (TTR) and Albumin Levels in CSF
TTR and albumin were measured in CSF as indicators of choroid plexus epithelial cell function (protein synthesis and transport, respectively). Upon randomization of samples, TTR and albumin levels were quantified using commercially available ELISA kits (cat.no. ABIN6960157 (TTR) and ABIN6964697 (albumin), antibodies-online GmbH, Aachen, Germany) according to manufacturer’s instructions. TTR: LLOQ = 0.31 ng/ml, albumin: LLOQ = 7.813 ng/ml.
Statistics
Details are described in suppl. information (section 1.8). Statistical analyses were performed on the majority of data presented and presented in the relevant tables. For some parameters (functional observational battery parameters [excluding activity scores], reactivity investigations [excluding landing footsplay and grip strength], mating data, early/late/total resorptions) the similarity of the data across groups was such that analyses were considered not to be necessary.
Data relating to food consumption were analysed on a cage basis as g/animal/day. For all other parameters, the analyses were carried out using the individual animal as the basic experimental unit. The following data types were analyzed statistically at each timepoint separately, where relevant, data from all subsets was pooled/combined: Body weight (absolute weight and gain), food consumption, ulna length and growth, using absolute length and growth, sexual maturation, age and body weight at onset and completion, arena observations (activity scores only), reactivity investigations (landing footsplay and grip strength values only), motor activity, Morris maze performance, auditory startle response pre-pulse inhibition, hematology, blood chemistry, organ weights (absolute and adjusted for terminal body weight, except for the choroid plexus weight, which was only recorded as absolute, as this organ is not easily isolated as an intact structure and weight was only recorded to assist in the bioanalysis), brain width/length, brain morphometry, and litter data.
Control group was compared to low-, mid-, and high-dose groups, respectively.
For semi-quantitative image-based analysis of PEG IHC signals, comparison included Day 182 vs 92 of age within each group set only to assess for recovery. For TTR CSF levels, in addition to analysis for effects of dosing with N9-GP for each time-point separately, changes over time were evaluated for each group.
For all tests, a p-value <0.05 was considered statistically significant, specific tests used are stated for data tables/figures when considered relevant.
Results
Animals
Mortality
Four premature deaths occurred during the study; details included in Suppl. Table S1. None of these were considered related to dosing with N9-GP.
Clinical observations
I.v. administration of N9-GP was well tolerated throughout the study. There were no signs observed in relation to dose administration, no test item-related signs observed at the injection site, and no test item-related changes in general clinical condition at any dose level investigated.
Body weight and food consumption
Group mean body weight was identical on Study Day 1 (Day 21 of age) in all groups. There was no effect of dosing with N9-GP on mean body weight gain during the dosing period (ranging between 390-405 g for all groups) or following cessation of dosing (142-146 g) (body weight included in Suppl. Table S2A-B). Mean food consumption was also unaffected by dosing with N9-GP (20 and 27 g/animal/day during the dosing and recovery period, respectively, in all groups, Suppl. Table S2C-D).
Macroscopic observations
At scheduled termination, there were no N9-GP-related macroscopic abnormalities detected at any of the dose levels in any of the animal subsets. All macroscopic observations (listed in Suppl. Table S3) were considered spontaneous and/or incidental because they occurred at low incidence, were randomly distributed across groups (including controls), and/or were as expected for SD rats of this age.
Organ weights
All differences in organ weights, statistically significant (testes, prostate, epididymides, prostate and seminal vesicles, lungs and bronchi, heart, brain and choroid plexus) or not, were inconsistent between time-points, groups, absolute versus adjusted weights, direction of change, consistent with normal variation and considered incidental (summarised in suppl. information section 2.1).
Hematology and clinical chemistry
There were no changes considered related to dosing with N9-GP (see suppl. information section 2.2 for summary of hematology results, data not shown for clinical chemistry except plasma albumin, see below).
Limb Measurements
Group mean ulna length and growth during dosing (Day 21-91 of age) were similar in all groups, the same was seen following cessation of treatment (Day 91-175 of age) (Suppl. Table S4).
Sexual Maturation
Sexual maturation, evaluated by onset and completion of balano-preputial separation, was unaffected by dosing with N9-GP (Suppl. Table S5).
Fertility Assessment
No effects of N9-GP dosing were identified as all mating pairs showed positive evidence of mating within five days of pairing (i.e. at the first estrus opportunity). All untreated females were pregnant with live embryos on Day 15 after mating, except for one female, which mated with a Main[W10] high-dose group male (conception rate and fertility index of 95%). There was no effect of N9-GP dosing on the mean number of implantation sites, resorptions, or live embryos or on the levels of pre- or post-implantation losses (Suppl. Table S6).
Neurobehavioural Examinations
An overview of the timing of all neurobehavioural tests is presented in Figure 2.
Functional observational battery testing
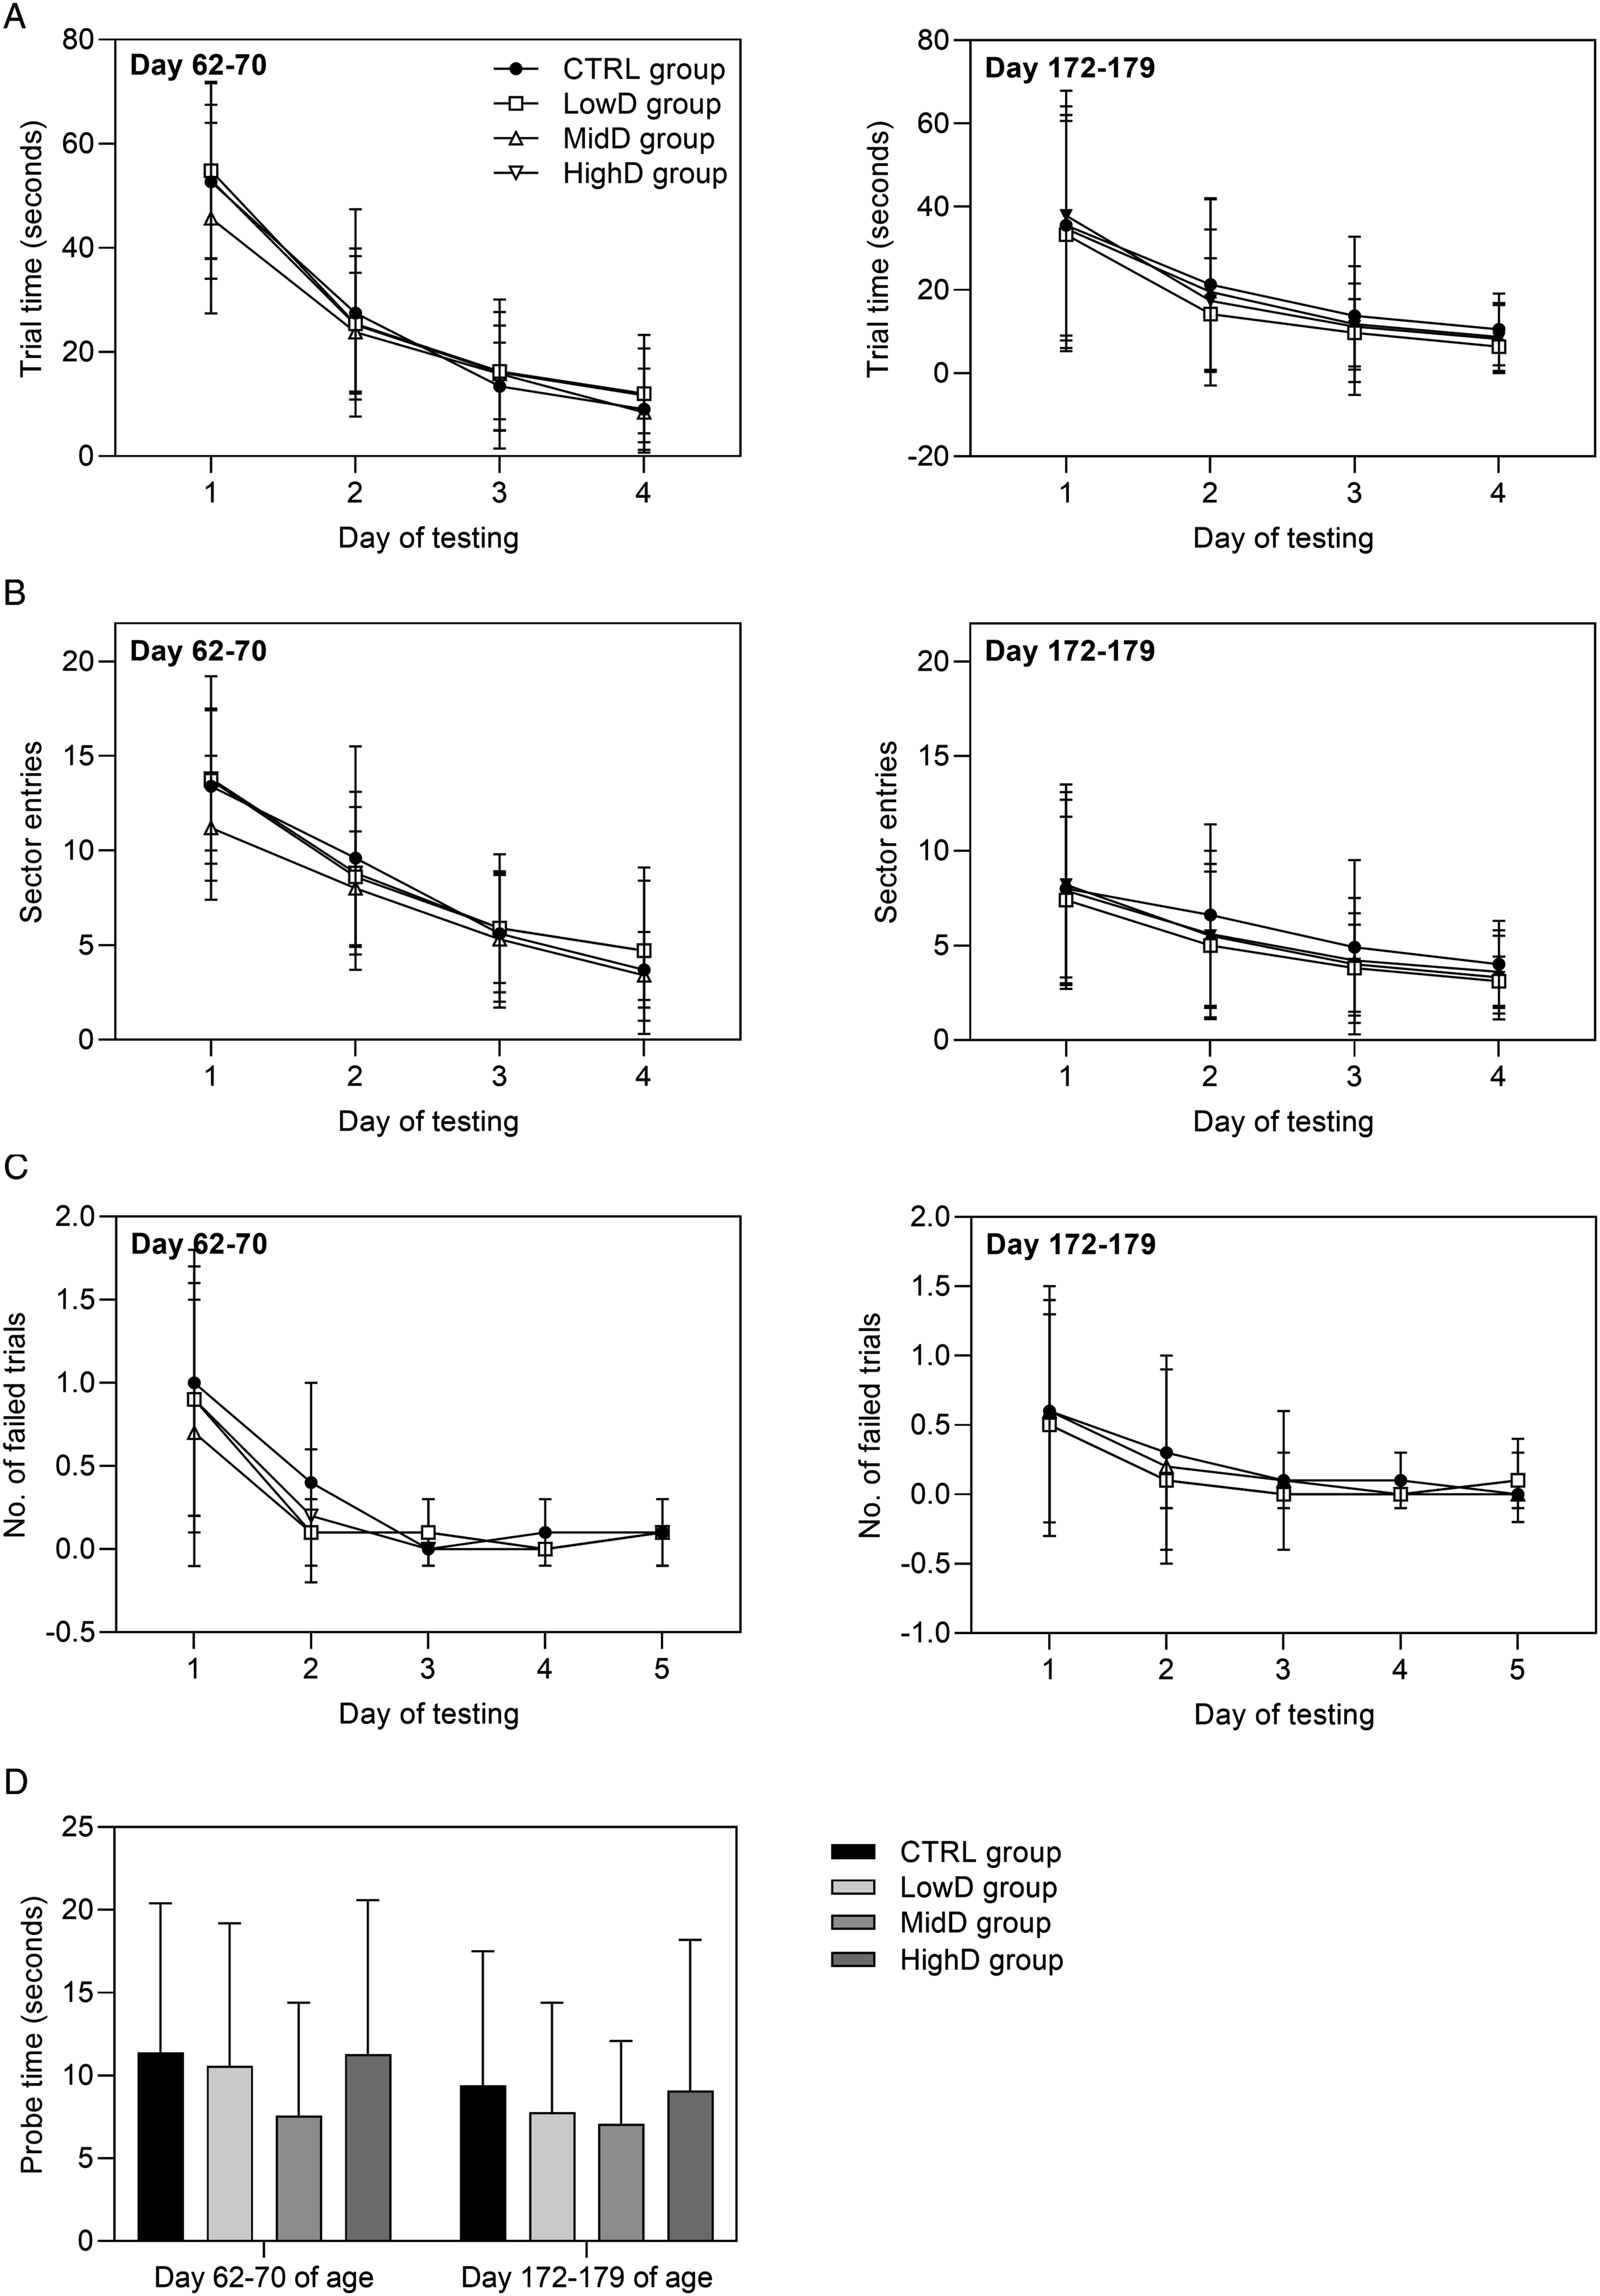
During all assessment occasions, there were no findings apparent in the in-hand, arena, or reactivity investigations that indicated an effect of N9-GP dosing (Suppl. Table S7). Automated motor activity monitoring: On all testing occasions, there were no changes in ambulatory (low beam) or rearing (high beam) activity scores that indicated an effect of N9-GP dosing (Figure 3). Auditory startle pre-pulse inhibition: Pre-pulse inhibition of the auditory startle response was unaffected by dosing with N9-GP. The group mean latency to peak values with and without pre-pulse (group mean ranges: 16-17 and 17-19 ms, respectively, for all groups), peak amplitude values with and without pre-pulse (group mean ranges: 681-725 and 470-489 g, respectively, for all groups) and the percent pre-pulse inhibition (group mean range: 28-30 % for all groups) of dosed animals were similar to controls. Morris water maze: During the dosing and recovery periods, learning and memory were assessed over five consecutive days of testing; the final day comprising a singly memory probe test. Performance in the Morris water maze on both testing occasions was unaffected by N9-GP dosing (Figure 4). All groups showed strong evidence of learning and memory as evidenced by the progressive decreases in trial times, sector entries, and number of failed trials over the first four days of testing (Figure 4A-C), and trial times for the single memory probe test on Day 5 of testing were similar to, or faster than, the trial times on Day 4 of testing, with no difference between groups (Figure 4D). Automated motor activity monitoring, group scores (beam breaks), means ± SD. (A) High beam breaks and (B) low beam breaks during motor activity monitoring. *P < 0.05 versus controls on the following time-points: Day 118 of age, 12 min at high beam level, MidD and HighD groups; Day 173 of age, 54 min at high beam level, HighD group and 30 and 54 min at low beam level, HighD group. For all time-points, groups were compared using a Williams’ test, except for the following: Day 21 of age at 48 min (High), Day 61 of age at 60 min (High), Day 118 of age at 6 min (High and Low), Day 173 of age at 30-60 min (High), where a Shirley’s test was performed. At Day 173 of age, Total data (High) was log-transformed before analysis. Performance in Morris water maze, means ± SD. (A) Trial time (swimming time to reach the platform, mean of three trials for each animal), (B) Sector entries (mean of three trials for each animal), (C) Number of failed trails (Day 1-4: 90 seconds, Day 5: 30 seconds), (D) Probe test (Day 5), time taken to swim to where platform had previously been located. Day 62-70 of age: CTRL group; n = 17, remaining groups; n = 18. Day 172-179: CTRL and HighD groups; n = 19, LowD and MidD groups; n = 20. Statistical tests: Trial time: Williams’ test (data log transformed for Day 3 and Day 4 on Day 62-72 and 174-181 of age, respectively); sector entries: Willams’ test (data log transformed for Day 4 at 62-70 of age); number of failed trials: Fisher’ s exact test, except for Day 1 (Shirley’s test); probe test: Williams’s test.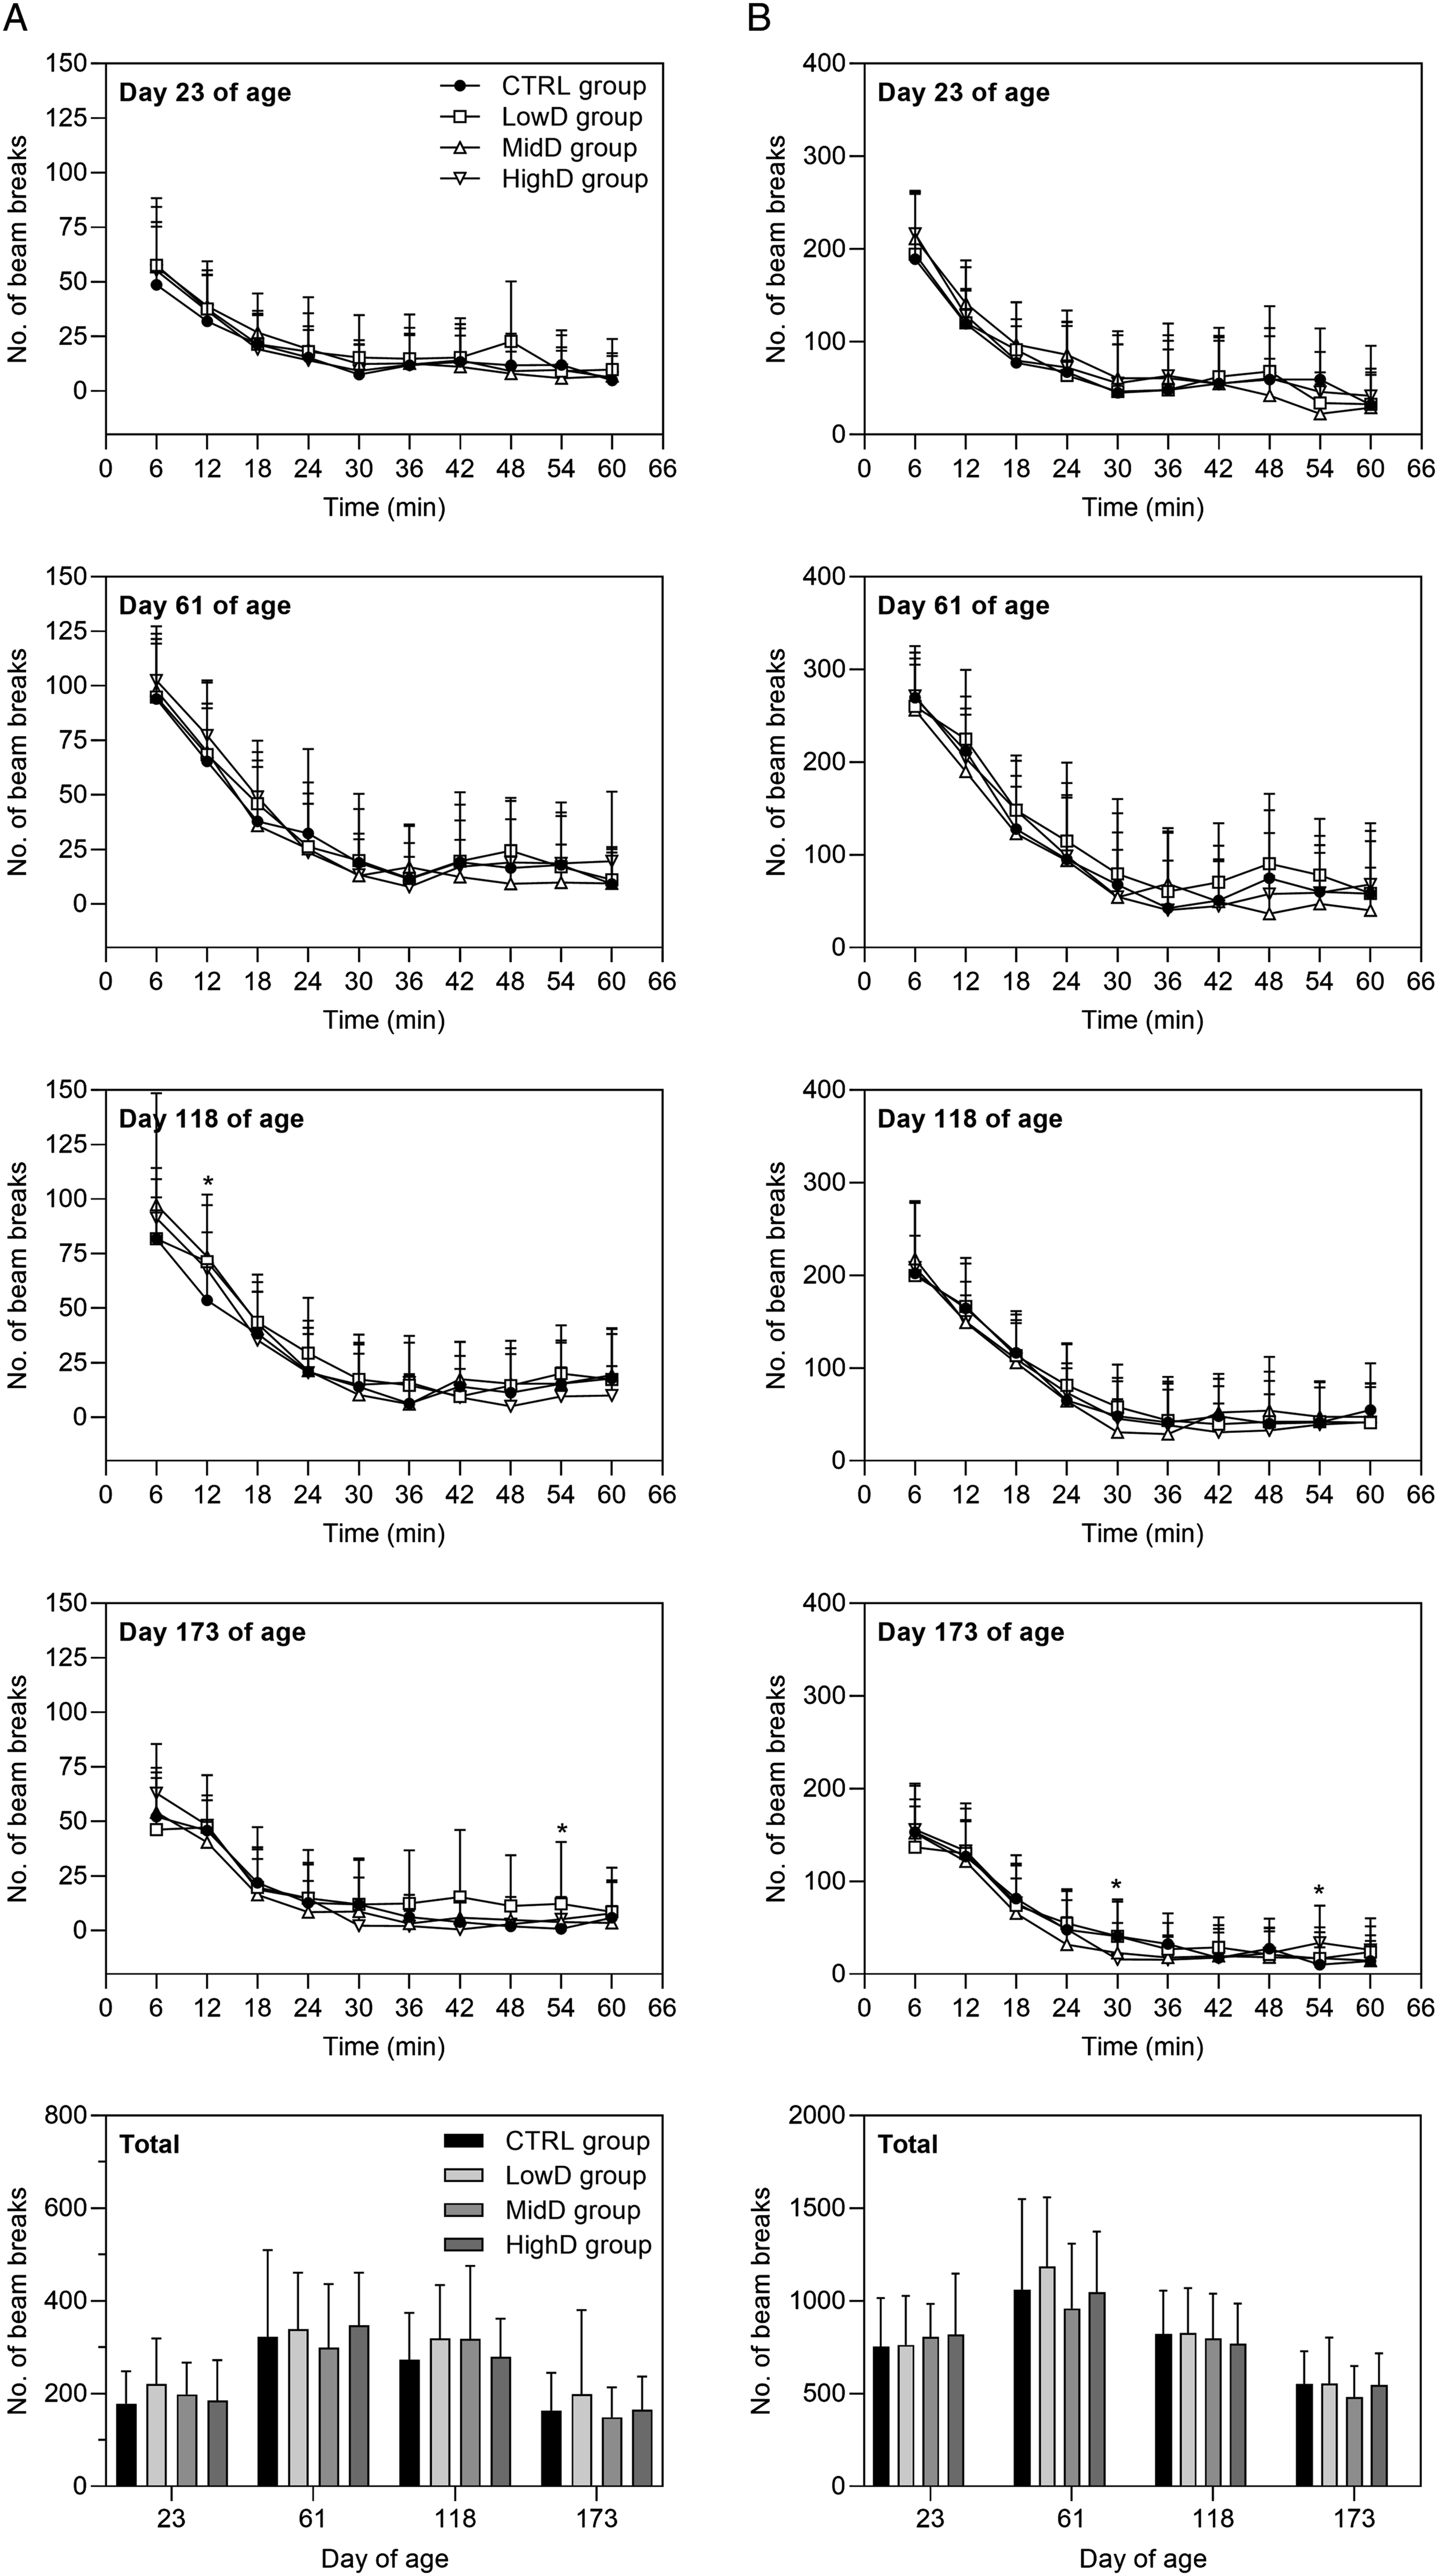
Anti-Drug Antibodies in Plasma
Out of all 424 samples, 6 samples were found positive for anti-N9-GP antibodies (all in the High-dose group, three on Day 92, two on Day 137, and on Day 182), corresponding to a frequency of 1.4%, and 100 samples were found positive for anti-PEG antibodies corresponding to a frequency of 23.6% (Suppl. Table S8). The control group had the highest anti-PEG antibody response (frequency of 60.2% versus 9-14% in N9-GP dosed groups), though in general, at very low levels. There was no clear correlation between presence of antibodies and dose level or duration of dosing (Suppl. Table S8); thus, development of anti-PEG antibodies was not considered to have impacted exposure to PEG. The reason for detection of anti-PEG antibodies in the control groups is unknown. However, the high sensitivity assay is likely to detect anti-PEG antibodies that are the results of PEG exposure from other sources than N9-GP.
PEG in Plasma, CSF, and Choroid Plexus Tissue and Toxicokinetic Analysis
Plasma PEG concentration and toxicokinetic analysis
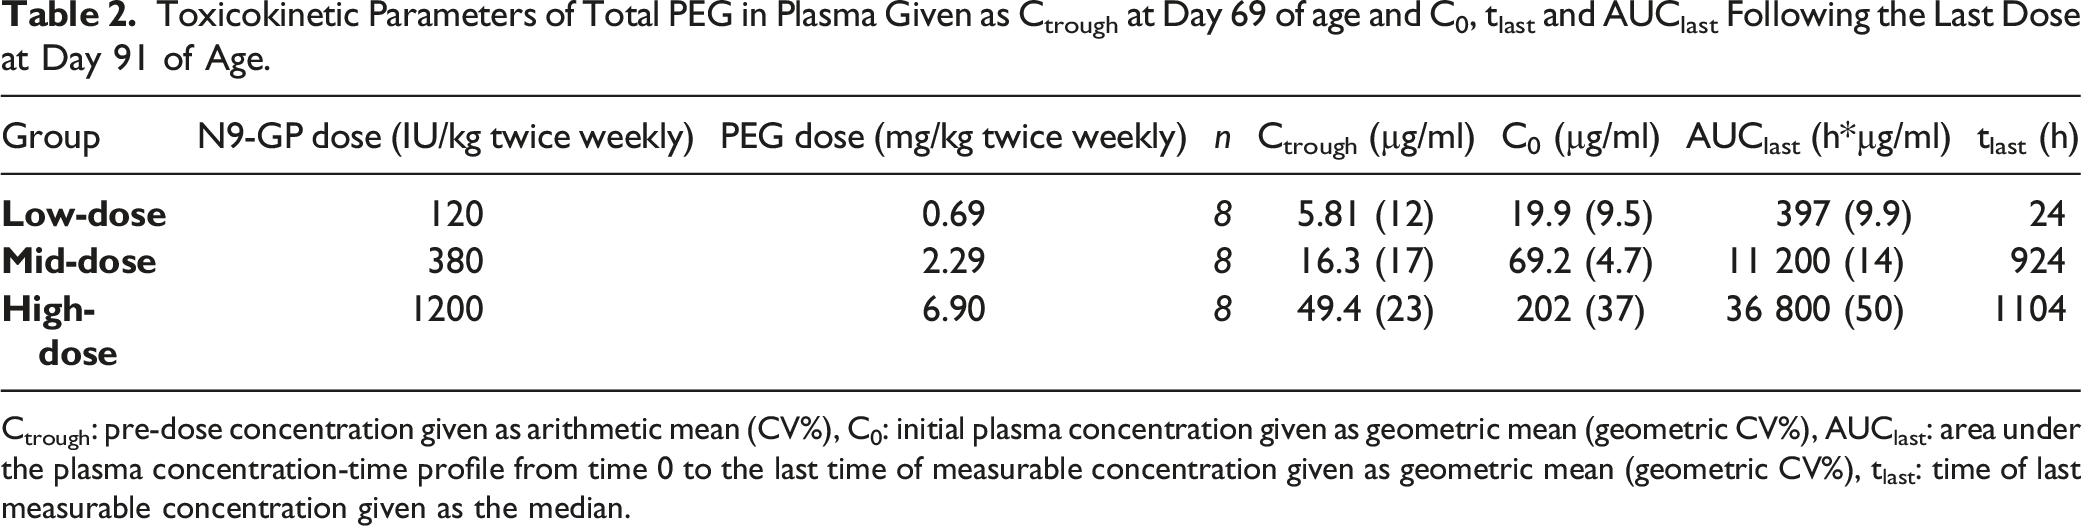
Results are included in Figure 5A. All control group animals had total (free and conjugated) plasma PEG concentrations <LLOQ (3 µg/ml), except one animal (subset MainRecovery[W13R]) at end of study (Day 182 of age) having a concentration slightly above the LLOQ (3.74 µg/ml). Throughout the study, plasma PEG concentration, evaluated as Ctrough on Day 69 of age as well as C0 and AUClast from Day 91 of age (Week 10, last dose) increased with increasing dose and decreased during the recovery phase (Table 2, Figure 5A). PEG concentration in plasma and choroid plexus tissue as a function of animal age. (A) PEG concentration in plasma. Plasma samples were not drawn at the same interval following dosing, high exposure is found just after first dose and just after final dose since those samples were taken close to Cmax (1 and 24 hours post dose) while other samples in the treatment period were pre-dose samples. LowD group: All samples taken on Day 22, 24, 107, 122, 137, and 182 of age had PEG levels <LLOQ. MidD group: one out of 4 on Day 22 of age and 4 samples out of 8 on Day 137 had PEG levels <LLOQ, on Day 182 levels in all samples were <LLOQ. HighD group: One sample out of 4 on Day 22 and one out of 10 on Day 182 of age had PEG levels <LLOQ. (B) PEG concentration in choroid plexus tissue. LowD group: All samples taken on Day 24 and 34 of age had PEG levels <LLOQ. MidD group: All samples taken on Day 24 of age had PEG levels <LLOQ. HighD group: All samples were >LLOQ. Samples with PEG levels <LLOQ are not depicted. LowD, low-dose. MidD, mid-dose. HighD, high-dose. Toxicokinetic Parameters of Total PEG in Plasma Given as Ctrough at Day 69 of age and C0, tlast and AUClast Following the Last Dose at Day 91 of Age. Ctrough: pre-dose concentration given as arithmetic mean (CV%), C0: initial plasma concentration given as geometric mean (geometric CV%), AUClast: area under the plasma concentration-time profile from time 0 to the last time of measurable concentration given as geometric mean (geometric CV%), tlast: time of last measurable concentration given as the median.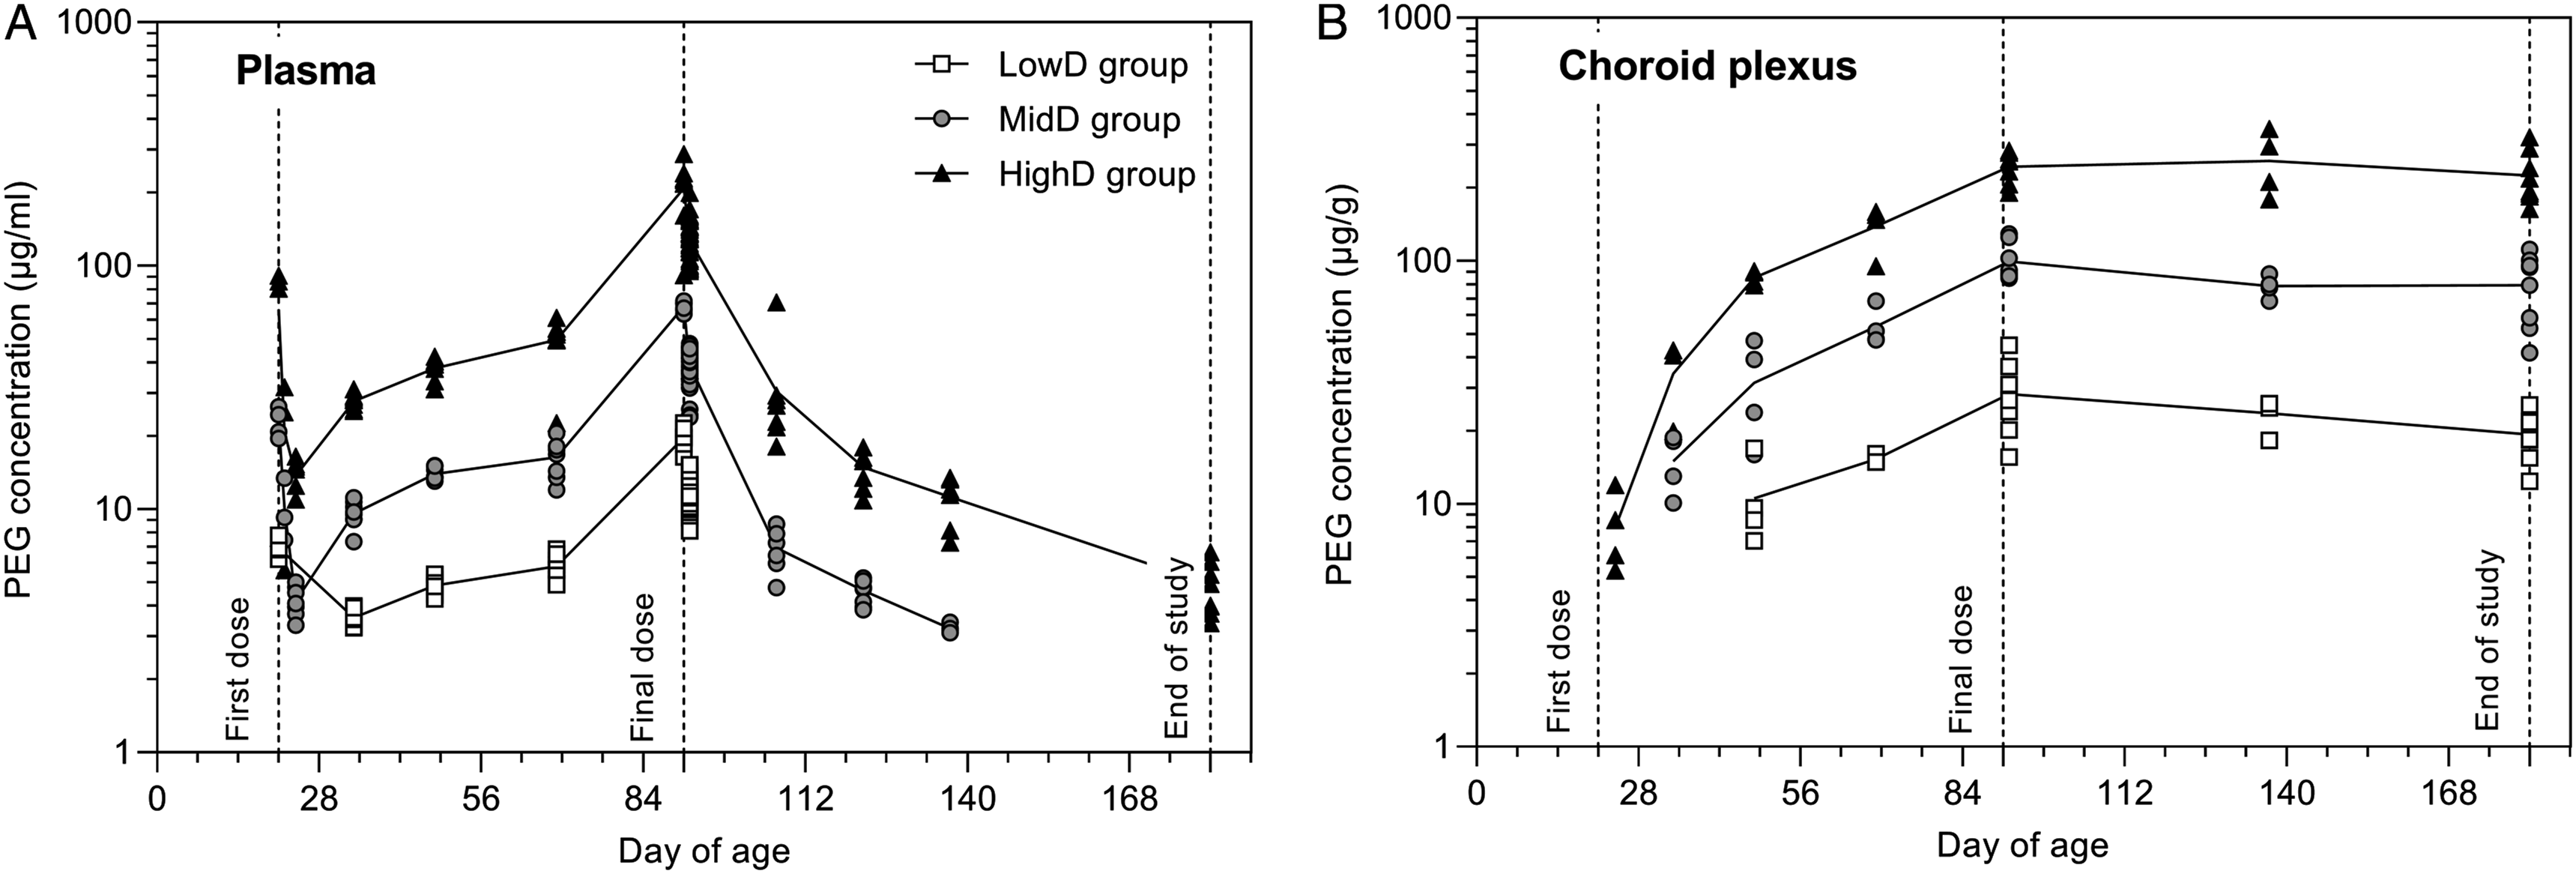
PEG concentration in CSF
All CSF samples had free PEG concentrations <LLOQ (50 ng/ml).
PEG concentration in choroid plexus tissue
Results are included in Figure 5B. All control animals had total PEG concentration <LLOQ. Mean choroid plexus PEG concentrations increased with increasing dose and was detected in the high-dose group following three days of dosing, after two weeks in the mid-dose group, and thereafter at all three dose-levels. PEG was still detectable after 13 weeks of recovery but declined compared to end of dosing levels (19.3±4.1 vs 28.2±9.3 µg/g, 79.1±25.4 vs 99.4±17.9 µg/g, and 224.1±55.6 vs 243.4±35.4 µg/g in the Low-dose, Mid-dose, and High-dose groups, respectively, corresponding to declines of 32%, 20%, and 8%).
TTR and Albumin Levels in CSF
TTR levels in CSF were stable over time in all N9-GP dose groups; in controls, levels decreased over time, generally reaching levels similar to N9-GP dosed animals by the end of study (Week 13 of recovery, see Suppl. Table S9A). Lower TTR levels in CSF were observed compared to controls at end of dosing in all N9-GP-dosed groups and in the high-dose group following 6.5 weeks of recovery. Following 13 weeks of recovery, the mid-dose group had increased levels of TTR compared to controls, whereas low- and high-dose groups were comparable to controls. The apparent difference in TTR levels between dosed and control animals observed at the end of dosing is most likely related to normal variation as TTR concentrations in CSF are at the highest level around birth in rats and gradually declines and reaches stable adult levels already within a few weeks from birth.20,21 There were no effects on albumin CSF and plasma levels (Suppl. Table S9B-C) or CSF:plasma albumin ratios (data not shown).
Histology
Histopathology (H&E)
Choroid plexus
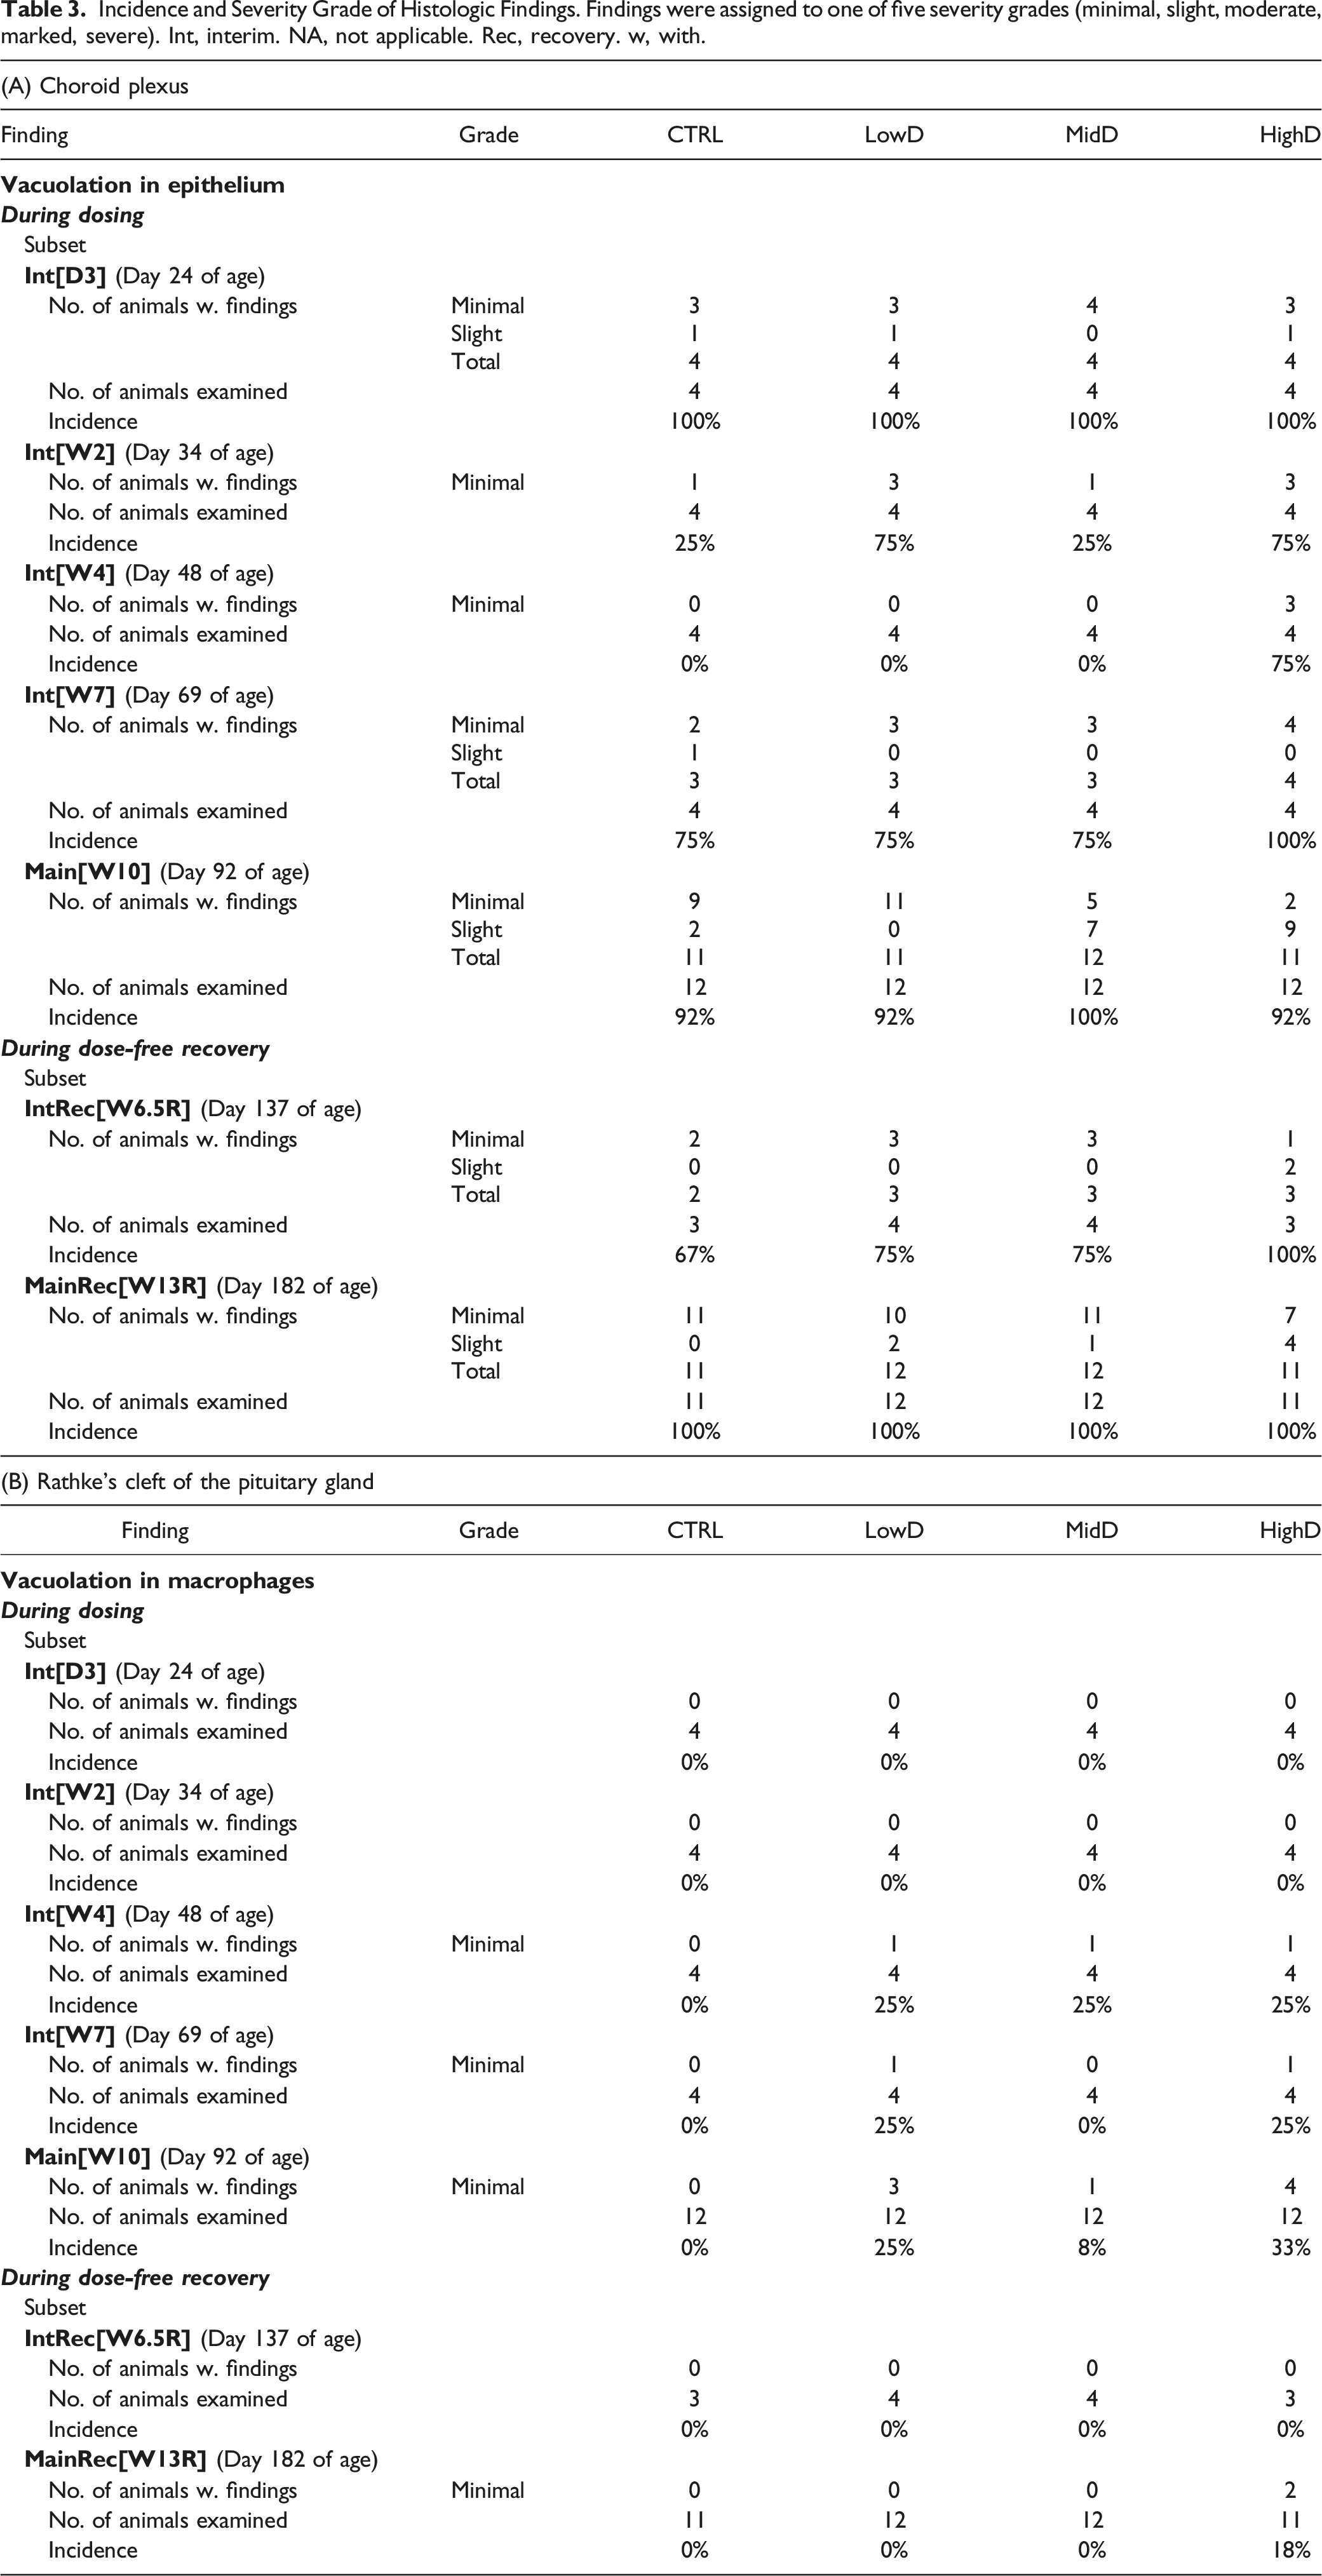
Incidence and Severity Grade of Histologic Findings. Findings were assigned to one of five severity grades (minimal, slight, moderate, marked, severe). Int, interim. NA, not applicable. Rec, recovery. w, with.
The pituitary gland
Findings are listed in Table 3B. In animals from subset Interim[D3] and Interim[W2] (Day 24 and 34 of age), no findings related to dosing with N9-GP were seen. In subset Interim[W4] and Interim [W7] (Day 48 and 69 of age) animals, vacuolated macrophages were seen in Rathke’s cleft of the pituitary gland, at a minimal grade in a maximum of one animal/time-point in N9-GP-dosed groups. After 10 weeks of dosing (subset Main[W10]), at Day 92 of age, vacuolated macrophages were seen in Rathke’s cleft in animals (1-4/group) from all three N9-GP dosed groups, all at a minimal grade and without a clear dose-relationship in incidences. Following 6.5 and 13 weeks of recovery (subsets InterimRecovery[W6.5R] and MainRecovery[W13R]), at Day 137 and 182 of age, no vacuolated macrophages were apparent in Ratke’s cleft in any of the animals except for two high-dose group animals at a minimal grade after 13 weeks.
Additional tissues
No findings considered related to dosing with N9-GP were seen (Suppl. Table S10).
Neuropathology
No differences were observed between N9-GP-dosed animals and controls in stains used to visualise myelin and neurons or microglial cells in the brain, pituitary, or spinal cord (Suppl. Table S11). Representative images of stained brain tissue are included in Suppl. Fig. S2.
Brain morphometry
Morphometric measurements were performed on sections of brain Levels 2 and 3 at end of dosing Main[W10] and at end of recovery [W13R]. Results are presented in Suppl. Table S12. There were no N9-GP-related effects on brain morphometry measurements.
PEG immunostaining in brain tissue
Both qualitative and semi-quantitative evaluations of PEG tissue distribution was performed on sections immuno-stained for PEG from the brain and pituitary. The qualitative evaluation describes the incidence of animals with a PEG positive IHC signal and the localisation of PEG in the tissues; the semi-quantitative evaluation consisted of image analysis used to determine the fraction of PEG-stained area or the density of intracellular PEG-positive spots in the areas identified at the qualitative evaluation. None of the control animals stained positive for PEG.
Microscopical evaluation (qualitative)
Overview of Qualitative Findings from PEG Immunohistochemistry. X Refers to a Positive PEG IHC Signal. The sign “-“ indicates that no PEG was observed or that it is not applicable. Unless otherwise noted, PEG was observed as a diffuse positive IHC signal. Representative pictures are included in Suppl. Fig. S3. VOLT, vascular organ of lamina terminalis.
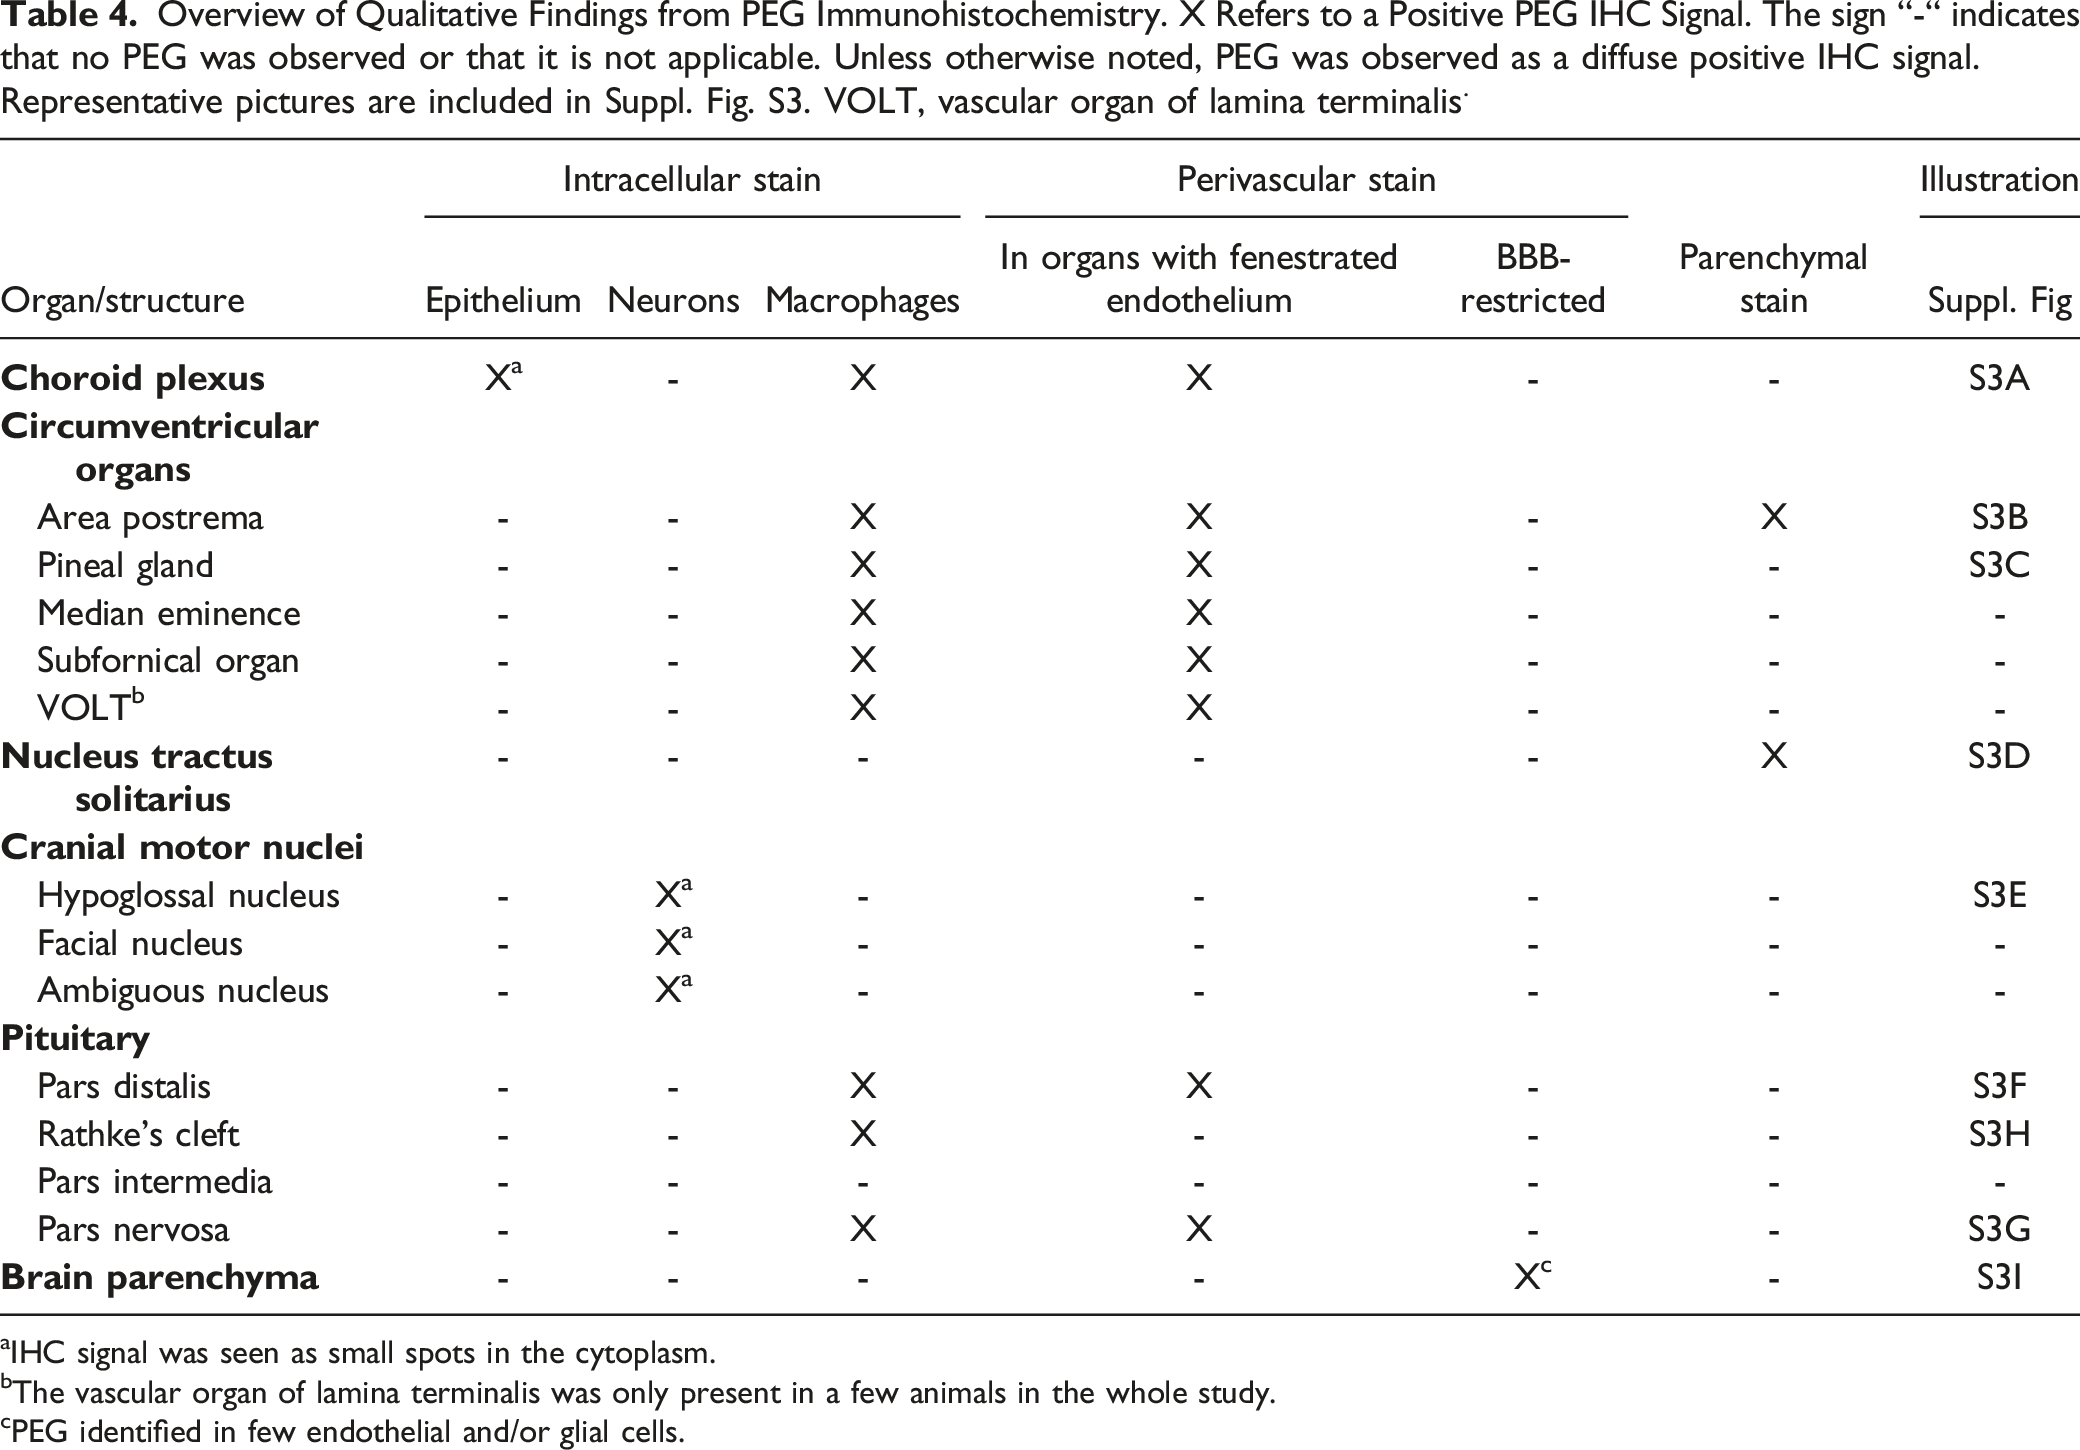
aIHC signal was seen as small spots in the cytoplasm.
bThe vascular organ of lamina terminalis was only present in a few animals in the whole study.
cPEG identified in few endothelial and/or glial cells.
Image analysis (semi-quantitative)
Results are included in Figure 6, to summarise, in all of the six organs or brain structures that were analysed (choroid plexus, area postrema, pineal gland, hypoglossal and facial motor nuclei, and the pituitary pars distalis), there was a dose- and dosing duration-dependent numerical increase in PEG IHC signal during the 10-week dosing period and a numerical reduction during the 13-week recovery period. Quantitative image-based analysis of PEG immunostain, means+SD and individual values. For intraepithelial measurements in choroid plexus and the cranial motor neurons, results represent the number of PEG-positive spots/area of analysed tissue. For the remaining anatomical locations, results represent the area of PEG-positive signal/area of analysed tissue. Note the different y-axes for HighD groups and n-values for intermittently terminated subsets are 1-4 (see Table 1). (A) Choroid plexus, intraepithelial. (B) Choroid plexus, extravascular. (C) Area postrema, (D) Pineal gland, (E) Cranial motor neurons, hypoglossal nucleus, (F) Cranial motor neurons, facial nucleus, (G) Pituitary, pars distalis. Mean values for Day 182 and 92 of age were compared using a Welch’s t-test. *P < 0.05, **P < 0.01. ns, not statistically significant.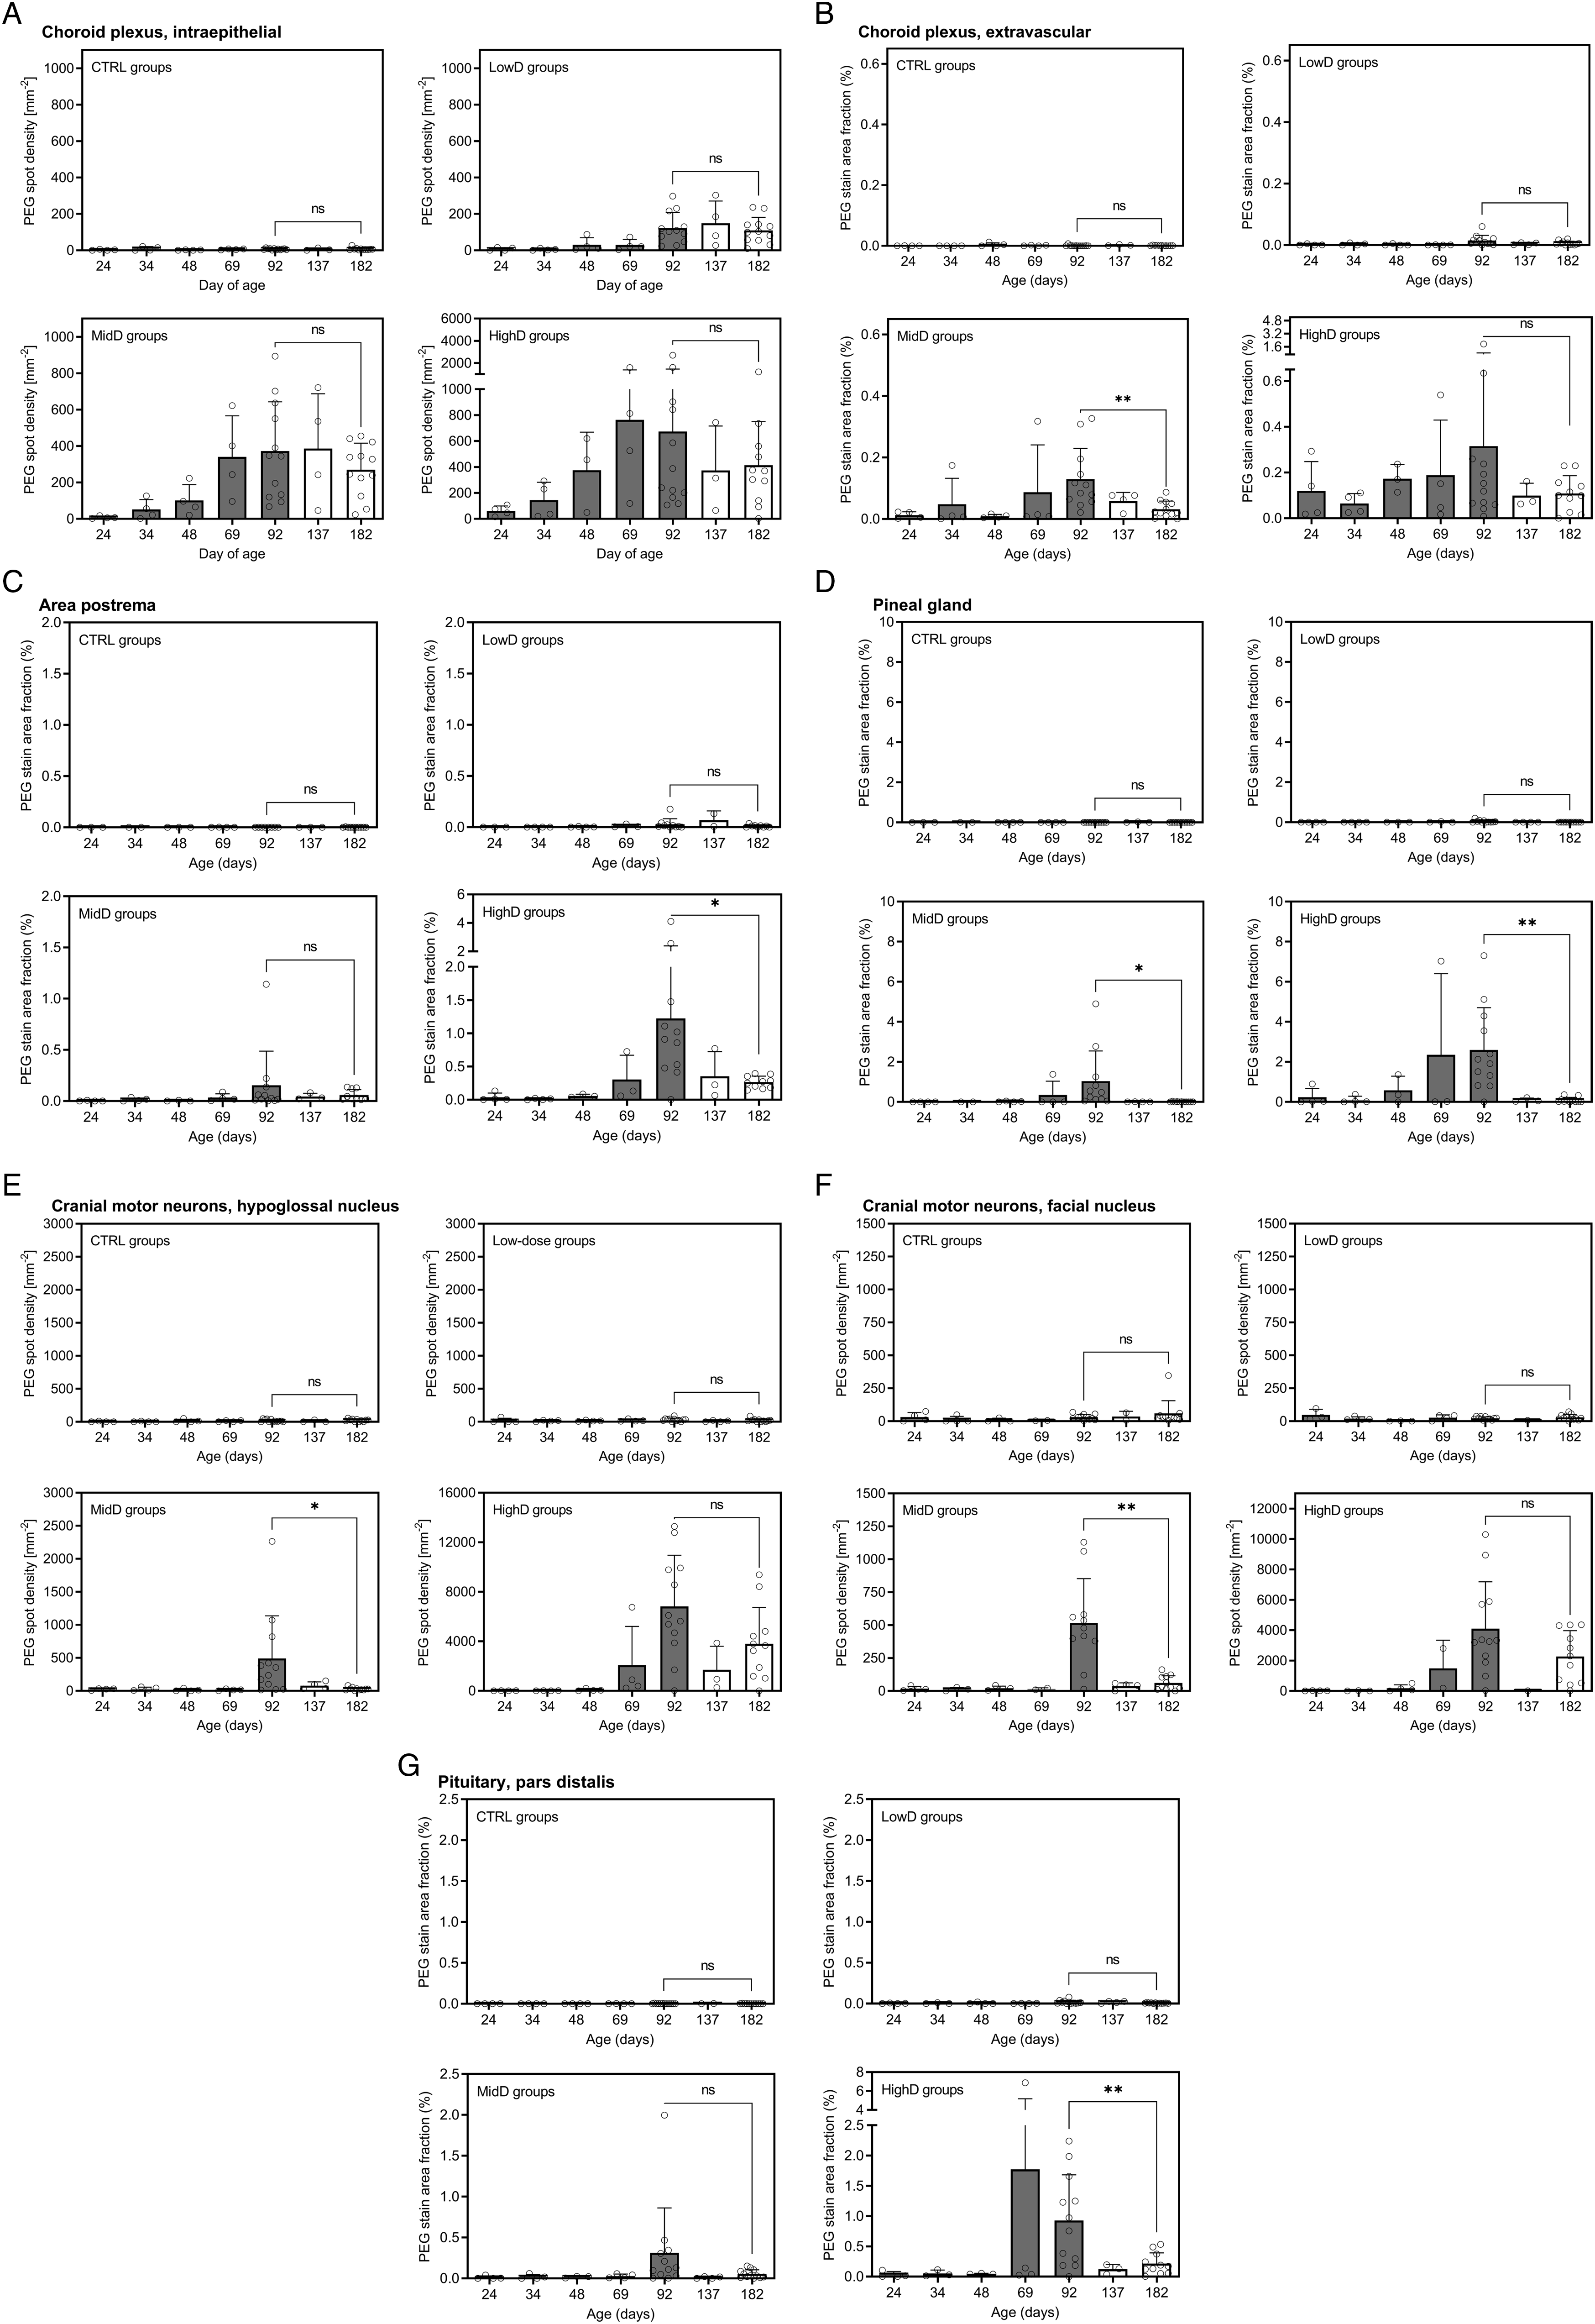
Discussion
In the present study, neurobehavioural and neurocognitive development as well as extended CNS histopathology, sexual maturation and fertility was evaluated in juvenile male rats following twice weekly dosing of N9-GP, a PEGylated recombinant human coagulation factor IX (nonacog beta pegol, Rebinyn®, Refixia®), from Day 21 to 91 of age. To our knowledge, this is the first study extensively investigating neurotoxicity related to PEG exposure in juvenile rats, including quantification of PEG in both plasma and choroid plexus as well as CSF.
In order to make a relevant interpretation of the results from the juvenile neurotoxicity study for the clinical use of N9-GP, it is important to ensure that the doses selected for the animal study result in exposures at and exceeding the expected exposures following clinical treatment of patients. The low, medium and high dose in the present study were therefore selected to result in rat plasma PEG exposure at (low dose) and exceeding (medium and high dose) human PEG exposures following N9-GP prophylactic dosing. The observed trough plasma PEG concentration was 49.4 ± 11.5 µg/ml at the high dose of 1200 IU/kg twice weekly (nominal dose of 13.8 mg/kg/week of PEG) in the present study as compared to the reported human steady-state trough plasma PEG concentrations of 5.6 ± 1.4 μg/mL and 5.3 ± 1.8 μg/mL following prophylactic treatment with once-weekly N9-GP 40 IU/kg (0.23 mg/kg/week of PEG) in children and adolescents/adults, respectively. 16 Thus, the plasma exposure in the juvenile rats at the highest dose level was 9-fold above observed human exposure and thus lends confidence in the validity of the assessment of effects on neurodevelopment.
As expected, PEG was present in the choroid plexus in the epithelium, macrophages, and extravascular space with an increase in PEG tissue concentration and IHC signal with increasing dose and dosing duration; during the recovery period, PEG concentrations and IHC signal in the choroid plexus declined. The presence of PEG in the choroid plexus has previously been described in nonclinical studies both for PEGylated pharmaceuticals as well as following dosing with unconjugated PEG.3,4,22 The distribution of PEG to the choroid plexus and other tissues is dependent on the size of the PEG but does not seem to require attachment to a protein.22-25 PEGs with a molecular weight of 20 kDa or below localises to the renal tubular epithelium, most likely representing fast renal clearance, whereas PEG with a molecular weight of 40 kDa (as for N9-GP) and above are seen in macrophages in various tissues, as well as the choroid plexus epithelial cells. As a result of the long circulating half-life, PEG is thought to enter the extravascular space through the fenestrated endothelium of choroid plexus blood vessels and subsequently be taken up by resident phagocytotic macrophages and choroid epithelial cells via fluid-phase pinocytosis. 26 Although PEG presence was identified in the choroid plexus there was no PEG in CSF and the adjacent brain parenchyma indicating that PEG is not transported across the choroid plexus epithelium and that the tight junctions of the epithelial cells are not permissive to the PEG used in N9-GP.
The main functions of the choroid plexus include acting as a barrier between blood and CSF, production of CSF, transport and synthesis of proteins secreted into the CSF, including a large number of neuropeptides and neuronal growth factors, and maintenance of brain homeostasis, working as a clearance pathway.27,28 Here, no effects on neurodevelopment (histologic or functional) indicative of changes in choroid plexus function, CSF production, or neuronal growth factors were seen. The largest protein fraction in CSF is represented by albumin, primarily originating from plasma, 27 and CSF albumin concentration is used as an indicator of both protein transport over the blood-CSF barrier and epithelial cell function in general. Here, levels of CSF albumin and CSF/plasma albumin ratio were unchanged indicating that PEG presence in the epithelial cells in the choroid plexus does not alter active transport of blood-bound factors across the epithelial membrane. In addition to albumin, CSF TTR level is a marker of choroid plexus epithelial cell protein synthesis, 27 and changes to CSF TTR level may be important for neurodevelopment, as it is a carrier for thyroid hormone, which is indispensable for normal growth and development of the brain, 27 and decreases in TTR may exert significant alterations in motor activity and exploratory behaviour. 29 Here, no effect of PEG exposure on TTR levels was observed supporting that choroid plexus protein synthesis was unaffected.
The present results indicate that there is no seepage of PEG over the BBB into the CNS, as PEG was not detected within the brain parenchyma or in the CSF. A similar distribution of PEG in the brain was seen following dosing with Skytrofa® in rats and juvenile monkeys, where PEG was detected in highly vascularized areas associated with the BBB and blood-CSF barrier, but not within brain parenchyma.12,30 In line with these findings, unconjugated 40 kDa PEG dosed to rats localises in the choroid plexus epithelium and macrophages and within cerebral cortical capillaries, but not in the brain parenchyma. 22 In the present study, PEG was, however, observed in the parenchyma of the nucleus tractus solitarius within the brainstem. The nucleus tractus solitarius has a specialised microvascular structure in which, at least in the rat, some blood vessels lack protein components of the classical BBB. 31 The presence of PEG in cranial motor nerves, such as the facial, hypoglossal, and ambiguous nerves, in the present study is likely due to retrograde transport, thereby circumventing the BBB. 32 Importantly, the function of these neurons, which innervate muscles involved in swallowing, mastication, and phonation, 33 was not affected by presence of PEG in the present study, as reflected by the lack of changes to food intake, no observed feeding/drinking issues, or effect on vocalisation in the in-hand evaluation.
The presence of PEG in the circumventricular organs is in line with previous investigations in organ/tissue distribution of N9-GP in rats, where N9-GP (single dose) was most abundant in highly vascularised tissues, with lowest levels seen in brain and spine. 24 Our previous published data on both N9-GP and 40 kDa PEG show similar distribution to tissues, independent on the FIX protein, and a dose related increase in PEG exposure in both plasma and tissues have been observed;23,24 therefore, it is considered relevant to compare the data in the current study to other drug molecules, particularly proteins attached to a 40 kDa PEG and with a similar PEG dose. Skytrofa® (PEGylated growth hormone) displays PEG also in the circumventricular organs and choroid plexus, with no related adverse effects observed in non-clinical (rats and non-human primates) or clinical studies (including paediatric patients with growth hormone deficiency).12,34 Likewise, in the present study, there were no effects on evaluated parameters related to the localisation of PEG in these structures. The median eminence is a pivotal structure in the release of hypothalamic hormones involved in sexual maturation, reproduction, metabolism, and locomotor effects and plays a part in the rapid transfer of glucose to the brain.35-38 Here, no effects were seen on growth, age at puberty, or fertility indicating that the hypothalamic pituitary hormonal axes were unaltered. The area postrema is involved in regulation of feeding and metabolism, 39 and the subfornical organ and vascular organ of lamina terminalis in osmoregulation, fluid, and energy homeostasis;40,41 again, there were no indications of any changes to neither body weight, growth or clinical pathology parameters. Finally, the pineal gland regulates circadian rhythm; here, no changes in activity and feeding pattern were observed.
Investigations included in the present study show no functional changes in the pituitary gland following dosing with N9-GP and the presence of PEG in the pituitary. The observed vacuolation in macrophages is a known change associated with administration of PEGylated compounds to rodents and monkeys, as it was also seen during non-clinical assessment of Cimzia®, Somavert®, Skytrofa®, and Aspaveli®/Empaveli®,3,12,13 and it likely represents uptake of PEG in these cells, reflecting normal physiological processing of foreign materials.3,4 The extended neurohistological evaluation of the pituitary did not show any evidence of an effect of PEG exposure on neuronal or microglial cell morphology and there were no signs of distortion, degeneration, necrosis, or inflammation. The absence of histological and neuropathological changes in the pituitary was further confirmed by the absence of changes in indirect functional readouts related to pituitary hormonal secretion, such as growth, feeding, body weight regulation, sexual maturation, fertility, fluid regulation and behaviour.
In the current study, dosing was initiated on Day 21 of age (at weaning). Some key developmental processes in the CNS occur/peak prior to weaning in the rat,42-45 however, it was not technically possible to dose before Day 21 of age. In rats, Day 21 of age is generally considered to correspond to a patient population from 2 years of age in relation to CNS and reproductive development, which is supported by guidance on safety evaluation of drugs for paediatric use.46-48 A strength of the present study is the comprehensive evaluation for neuropathologic/neurodevelopmental effects of PEG exposure, including both detailed histopathologic evaluation with additional specialised staining to visualise neurons, myelin, and microglial cells and morphometric measurements, as well as extensive testing for neurobehavioral and neurocognitive developmental effects including assessment of behaviour, motor activity, sensory function, and learning and memory. Furthermore, these assessments were included throughout the study, at regular intervals, permitting identification of potential age or dosing duration-critical effects. Also, a 13-week recovery period was included to allow for assessment of reversibility or delayed onset of any changes. Additional strengths are the thorough evaluation of PEG tissue distribution/concentration in the brain, which not only included qualitative histologic evaluation, but also semi-quantitative image-analysis, as well as the quantitative measurement of PEG exposure in CSF and choroid plexus. To the authors’ knowledge non-clinical quantification of PEG in tissues has not been performed following treatment of other 40 kDa PEGylated compounds than N9-GP. It should be noted that PEGs of different sizes show different distribution to various tissues,22,25 therefore, the results from this study may not be representative for compounds conjugated to PEGs of different size than 40 kDa.
Although a range of other drug products containing a 40 kDa PEG exist, limited non-clinical studies with systemic PEG exposure data are available in the public domain. However, juvenile studies of 52 weeks duration have been conducted in non-human primates for both the Skytrofa® and Cimzia® compounds. Due to the similar PEG size conjugated to these molecules and to N9-GP, toxicity studies conducted across those compounds are relevant to compare. Though PEGylated FVIII, N8-GP (NovoEight®), contain the same 40 kDa PEG reagent as for N9-GP, comparison to this coagulation factor is not included, as the PEG doses are 90 times lower than for N9-GP and based on the literature and the authors own data, the dose level determines the exposure to PEG. In Figure 7 identified systemic PEG exposure data are summarised as a function of weekly PEG dose administered across N9-GP, Cimzia® and Skytrofa® compounds to nonclinical species. Only the exposure at the highest dose is included (no adverse effects were seen at any of the doses). Doses corresponding to up to 9.0 and 44 mg/kg/week of PEG has been investigated in the juvenile non-human primate studies conducted with Skytrofa® 12, 30 and Cimzia® (personal communication from UCB), respectively. To the authors’ knowledge no adverse findings related to PEG exposure have been reported in those juvenile toxicity studies, with observed systemic average PEG exposure over the dosing interval of up to 350 µg/mL
30
and 1000 µg/mL (personal communication from UCB), for the Skytrofa® and Cimzia® compounds, respectively (Figure 7). For comparison, reported human PEG exposures are also added to Figure 7. Systemic average PEG exposure of 11 +/- 3 µg/mL is reported in children following 13 weeks of treatment with the approved dose of Skytrofa® (0.24 mg/kg/week human growth hormone corresponding to 0.45 mg/kg/week of PEG).
30
Systemic exposure to PEG in the range of 10-75 µg/mL in pregnant women is reported following treatment with the approved doses of Cimzia® (200 mg every 2 weeks or 400 mg every 4 weeks corresponding to 0.65 mg/kg/week of PEG in a 70 kg subject).49,50 These reported PEG exposures are above the mentioned clinical PEG exposure following the prophylactic dosing regimen of 40 IU/kg once-weekly N9-GP and the comparison illustrates that systemic human exposure to PEG seems to increase with increasing dose of PEG. In addition, systemic exposures to PEG in the non-clinical studies, where no adverse findings have been identified, are well above the clinical PEG exposures following the prophylactic dosing regimen of 40 IU/kg once-weekly N9-GP and approved dosing regiments of Skytrofa® and Cimzia®. Systemic PEG concentration observed in humans and in nonclinical species as a function of weekly PEG dose administered across different compounds. For the nonclinical species, only the highest dose and exposure is included; no adverse effects were seen at any of the doses. Error bars are included as +/- SD if available. For the Cimzia® compound the human PEG dose is calculated assuming a bodyweight of 70 kg. Exposure of PEG following administration of Cimzia® is given as individual values at a given time span following the last dose. The average concentration is based on calculated AUC across individuals in an assumed dosing interval of 4 weeks. Two samples below LLOQ were excluded from the calculation. For Skytrofa®, the average exposure is calculated based on the reported AUC and dosing interval following 13 weeks of treatment. Ages at study initiation: 22-42 years (human), 10 months (monkey) for Cimzia®, ≤12 years and >12 years (human), 21 days (rat) for N9-GP, and 3-12 years (human), 6-8 weeks (rat), 13-17 months (monkey) for Skytrofa®. References: Cimzia®49: and personal communication from UCB, N9-GP,
16
: Skytrofa®.
30
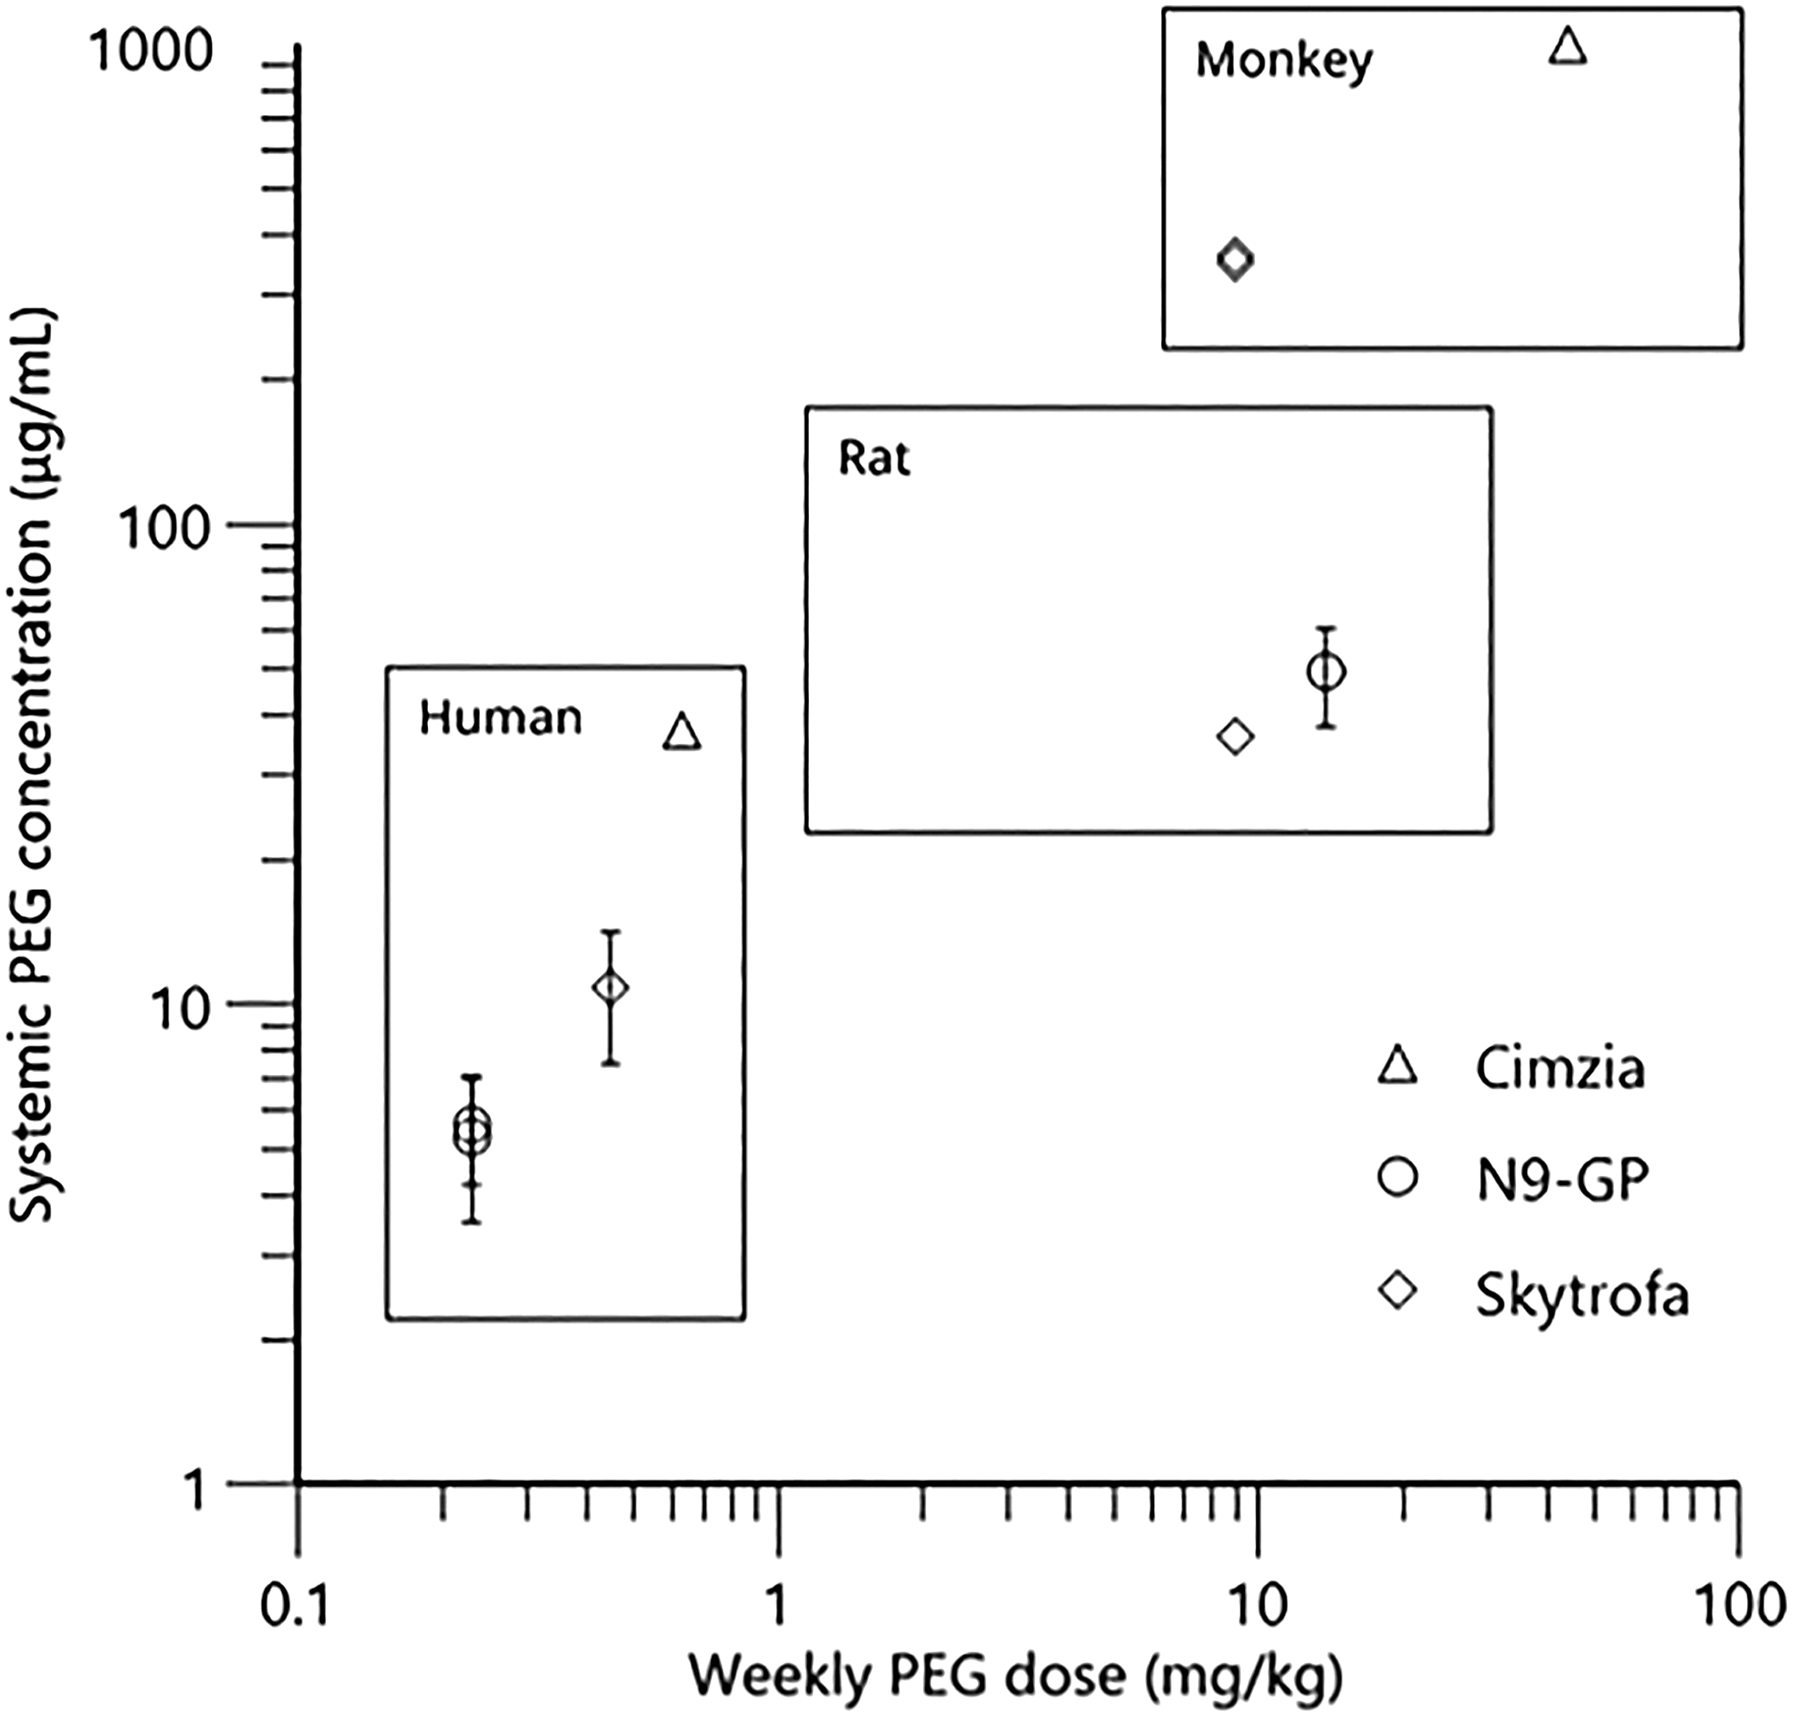
In summary, the present study documents that PEG exposure does not impact neurodevelopment in juvenile rats. Dosing with N9-GP caused a dose dependent increase in PEG exposure in plasma and choroid plexus, and presence in structures outside the BBB, which declined after cessation of dosing. We confirmed that the PEG exposure was not associated with any functional or histological signs of neurotoxicity in juvenile rats. PEG distribution in the CNS indicates that PEG does not cross the BBB or blood-CSF barrier, supported by lack of detectable PEG in the CSF. The lack of functional adverse effects is in alignment with results from repeat-dose toxicity studies on already approved PEGylated compounds (e.g. Skytrofa®, Cimzia®, Adynovate®, Krystexxa®, and Aspaveli®/Empaveli®) as well as the chronic toxicity study conducted with N9-GP in rats,3,7,9-13,17 in addition, no adverse effects related to PEG exposure have been reported with the long-term clinical use in children and adults with various PEGylated compounds.
In conclusion, dosing of N9-GP to juvenile rats did not identify any effects on growth, sexual maturation and fertility, clinical and histological pathology, or neurodevelopment related to PEG exposure and supports the prophylactic use of N9-GP in children with haemophilia B.
Supplemental Material
Supplemental Material - Normal Neurodevelopment and Fertility in Juvenile Male Rats Exposed to Polyethylene Glycol Following Dosing With PEGylated rFIX (Nonacog Beta Pegol, N9-GP): Evidence from a 10-Week Repeat-Dose Toxicity Study
Supplemental Material for Normal Neurodevelopment and Fertility in Juvenile Male Rats Exposed to Polyethylene Glycol Following Dosing With PEGylated rFIX (Nonacog Beta Pegol, N9-GP): Evidence from a 10-Week Repeat-Dose Toxicity Study by Vivi F. H. Jensen, Line H. Schefe, Helene Jacobsen, Anne-Marie Mølck, Kasper Almholt, Ingrid Sjögren, Charlotte M. Dalsgaard, Rikke K Kirk, Andrew J. Benie, Bent O. Petersen, Mette S. Kyhn, Anne J. Overgaard, Inga Bjørnsdottir, Diane R. Stannard, Hanne K. Offenberg, and Emil Egecioglu in International Journal of Toxicology
Footnotes
Acknowledgments
The authors thank Ian Taylor and Brad Bolon (histopathological evaluation), scientist from Labcorp Richard Jenkins (PEG IHC), contributing scientists from Novo Nordisk A/S, Hanne Toftelund (toxicokinetic data analysis), Anders H. Millner (anti-drug antibody analysis), Tobias H. Dovmark (artificial intelligence, image-analysis), and Søren Andersen (statistical analysis: TTR and albumin levels in CSF), as well as the following laboratory technicians from Novo Nordisk A/S: Malik N. Nielsen, Casper M. Poulsen, and Dorte Larsen (image analyses), Helle Wagner (choroid plexus sampling), Helle B. Petersen, Rikke L. Nielsen, and Mathias K. Nielsen (PEG levels in plasma), Jette B. Tvenge and Mia M. B. Nielsen (anti-drug antibody), as well as Rikke L. Nielsen and Mathias K. Nielsen (TTR and albumin levels in CSF). The contributions by Lene Ottesen (Novo Nordisk A/S) and Pharm-Analyt Labor GmbH, Austria (PEG levels in CSF and choroid plexus tissue) are also acknowledged.
Author Contributions
VFHJ: Interpretation of data for the work, drafting of the manuscript. LHS: Analysis and interpretation of data for the work. HJ: Design of the work, interpretation of data for the work. AMM: Design of the work, interpretation of data for the work. KA: Acquisition, analysis, and interpretation of data for the work. IS: Acquisition, analysis, and interpretation of data for the work. CMD: Acquisition, analysis, and interpretation of data for the work. RKK: Acquisition, analysis, and interpretation of data for the work. AJB: Analysis and interpretation of data for the work. BOP: Acquisition of data for the work. MSK: Acquisition and analysis of data for the work. AJO: Acquisition and analysis of data for the work. IB: Design of the work, analysis of data for the work. DRS: Design of the work, acquisition and interpretation of data for the work. HKO: Interpretation of data for the work. EE: Design of the work, interpretation of data for the work. All authors have revised the manuscript critically, approved the final version for publication and agree to be accountable for all aspects of the work in ensuring that questions relating to the accuracy or integrity of any part of the work are appropriately investigated and resolved.
Declaration of Conflicting Interests
The author(s) declared the following potential conflicts of interest with respect to the research, authorship, and/or publication of this article: VFHJ, LHS, HJ, AMM, KA, IS, CMD, RKK, AJB, BOP, MSK, AJO, IB, HKO, and EE are all employees at Novo Nordisk A/S.
Funding
The author(s) received no financial support for the research, authorship, and/or publication of this article.
Supplemental Material
Supplemental material for this article is available online.
References
Supplementary Material
Please find the following supplemental material available below.
For Open Access articles published under a Creative Commons License, all supplemental material carries the same license as the article it is associated with.
For non-Open Access articles published, all supplemental material carries a non-exclusive license, and permission requests for re-use of supplemental material or any part of supplemental material shall be sent directly to the copyright owner as specified in the copyright notice associated with the article.