
Abstract
Macrophage play important role in acute lung injury (ALI). This study aims to explore the possible role of Shp2 in regulating macrophage 1 (M1) in ALI progression. ALI was induced in rats by intravenous injection of lipopolysacharide (LPS). Lentivirus was used to knock down Shp2 expression. Lungs from LPS-induced ALI rats were evaluated by H&E staining and wet/dry lung weight ratio (W/D ratio) measurement. The expression of inflammatory cytokines IL-1β, TNF-α and IL-6 in bronchoalveolar lavage fluid were detected by ELISA. The expressions of M1 biomarker (iNOS) and macrophage 2 (M2) biomarker (Arg-1) in lung tissues and macrophages were measured by immunofluorescence and western blot. The ratio of M2/M1 was detected by flow cytometry. Inflammatory cytokines were highly expressed in ALI rat models, in which elevated expression of iNOS and decreased Arg-1 expression were detected. Shp2 was found to be highly expressed in lung tissues of ALI rat models. LPS treatment in NR8383 cells lead to increased M1 phenotype and elevated expression of Shp2. Suppression on Shp2 expression can counteract the LPS-induced effect and further attenuate ALI progression. Evidence collected from ALI rat and cell models showed that suppression Shp2 expression in macrophages can inhibit M1 phenotype to attenuate ALI progression.
Introduction
Acute lung injury (ALI) is a moderate or mild acute respiratory distress syndrome, accompanied by unacceptable morbidity and mortality in various medial situation, including sepsis, trauma and shock.1,2 This condition can lead to the disruption of lung endothelial and epithelial barriers which consequently increases permeability, pulmonary edema, production of pro-inflammatory cytokines and infiltration of pro-inflammatory cells.3,4 ALI is regarded as the immune system-induced pro-inflammatory response stimulated by pathogen. 5 Despite progress that has been made in current years, ALI is still an incurable inflammatory disease without effective therapy strategy. 6 Therefore, additional studies are needed to better understanding its underlying mechanism.
A role for macrophages in ALI has been proposed for their regulation on inflammatory response under the context of ALI. 7 Alveolar macrophages, a major subset of innate immune system to protect the lung, can initiate the phagocytosis and release cytokines in response to host defenses.8,9 Functionally, macrophages can be polarized into a pro-inflammatory phenotype (M1) and anti-inflammatory phenotype (M2) through phenotypic transformation. 10 In response to inflammation, infection or trauma, the M1/M2 phenotype is altered accordingly. During the early stage, M1 is polarized against pathogens, while macrophages are subsequently polarized into M2 phenotype for tissue repairing. 11 Therefore, regulation of macrophage polarization may improve the local inflammatory condition and is proposed as potential strategy for the treatment of various diseases. 12 The role of macrophage polarization in ALI has been previously reported, 13 but the process by which it was regulated was far from consensus.
Src homology-2-containing protein tyrosine phosphatase 2 (Shp2) is a non-receptor protein tyrosine phosphatase (PTP), encoded by PTPN11, which is mutated in various human diseases. 14 In the tumor microenvironment, Shp2 was shown to regulate immune cell functions.15,16 Shp2 inhibition together with anaplastic lymphoma kinase inhibitors can use applied as therapeutic strategy to restore cell sensitivity. 17 In patients with inflammatory bowel disease, Shp2 was increasingly expressed in colonic macrophages, while knockdown of Shp2 expression in macrophages deceased the risk of colitis and colitis-driven colon cancer in mice. 18 In addition, Shp2 was also identified for its regulation of the activation of alveolar macrophages associated with emphysema. 19 However, less evidence supports the possible effect of Shp2 in regulating macrophages in ALI. In this regards, we aimed to explore the possible regulation of Shp2 on macrophage polarization and its underlying effect on ALI progression in both cell and animal experiments.
Materials and Methods
Establishment of Acute Lung Injury Rat Model
Male Sprague-Dawley (SD) rats (8-10 weeks, weighting 300 ∼ 350 g, n = 40) were purchased from Hunan SJA Laboratory Animal Co., Ltd and housed in separated cages under conditions of 22 ± 2°C, 50% ± 5% humidity, and light/dark cycle of 12 h/12 h. Each rat had free access to food and water. The experimental design was approved by the ethical committee of Beijing Tongren Hospital and the experiment was conducted based on Guide for the Care and Use of Laboratory Animals published by the National Institutes of Health (NIH).
The model establishment was conducted through intravenous injection of 5 mg/kg of lipopolysaccharide (LPS) based on description in a previous study. 20 The rats were grouped into control group (PBS treatment), LPS group (LPS treatment for 6 hr with concentration at 5 mg/kg to induce ALI model, LPS from Escherichia coli 055:B5, Sigma, MO, USA), LPS+sh-NC group (ALI model, followed by transfection of negative control of Shp2 knockdown, injection of negative control of Shp2 knockdown lentivirus for 72 h and then LPS treatment), LPS+sh-Shp2 group (ALI model, followed by transfection of Shp2 knockdown, injection of Shp2 knockdown lentivirus for 72 h and then LPS treatment). sh-NC and sh-Shp2 were given to rats through intraperitoneal injection after model establishment at the dosage of 1 × 10⁷ TU/100 μL. Rats were anesthetized with pentobarbital sodium and euthanized by exsanguination via the aorta abdominalis. The lung tissues were collected for morphological assessment. The wet weight of the lung tissues was recorded. Part of the lung tissue was fixed in 10% formaldehyde and the remaining lung tissue was stored at −80°C.
H&E Staining
The tissues were embedded and sectioned at 4 μm. After being baked for 2 h at 72°C, the sections were deparaffinized in xylene I for 10 min, xylene II for 10 min before being hydration with absolute ethyl alcohol I for 5 min, absolute ethyl alcohol II for 5 min, 90% ethyl alcohol for 2 min, 80% ethyl alcohol II for 5 min and 70% ethyl alcohol II for 5 min. Sections were washed in running water for 5 min and then stained with hematoxylin for 5 ∼ 10 min and then eosin for 2 min. After sections were mounted, the slides were observed under a light microscope. The morphology was assessed by pathologists who were unaware of the animal’s treatment based on following criteria 21 : edema, hyperemia and congestion, neutrophil margination and tissue infiltration, intra-alveolar hemorrhage and debris, and cellular hyperplasia. Each was scored from absent, mild, moderate, or severe, with 0 ∼ 3 scores. The total score was ranged from 0 ∼ 15.
Ratio of Wet/Dry Lung Weight (W/D Ratio)
After rats were euthanized, the left lungs were removed to record the wet lung. Then the lung tissues were baked at 60°C for 72 h before the dry lung was recorded. The W/D ratio was calculated.
ELISA
After rats were euthanized, the bronchoalveolar lavage fluid (BALF) was collected and centrifuged at 200 g for 10 min at 4°C to obtain the supernatant. The expression levels of IL-1β (1210122, IL-1β ELISA kit 96T, Dakewe, Beijing, China), TNF-α (1217202, TNF-α ELISA kit 96T, Dakewe) and IL-6 (PI328, Beyotime) were determined based on the instructions above. Supernatants (100 μL) were incubated with biotinylated antibody solution (1:100, 100 μL/well) for 2 h. The OD value was measured at 450 nm. The OD value for standards and controls was calculated and each experiment was repeated 3 times.
Immunofluorescence
The dewaxed sections made from the right lung were incubated in citrate buffer solution (0.01 M, pH 6.0) and then boiled for 10 min for antigen retrieval. Sections were then washed 3 times with PBS, each for 3 minutes. Then sections were incubated with anti F4/80 (1:200, ab6640, Abcam, Cambridge, UK), inducible nitric oxide synthase (iNOS; 1: 200, ab15323, Abcam, Cambridge, UK) and arginase 1 (Arg- 1; 1:50, #93668, Cell Signaling Technology/CST, MA, USA), followed by 3 washes in PBS and further incubation with secondary goat anti rat IgG H&L (Cy3) (1:100, ab6953, Abcam, Cambridge, UK) or goat anti rabbit IgG H&L (FITC) (1:100, ab6717, Abcam, Cambridge, UK) at room temperature for 1 h. After re-staining with DAPI for 20 min without light exposure, the sections were mounted with anti-fluorescence quenching agent. For cellular experiments, cells were fixed with 4% paraformaldehyde for 30 min and treated with 0.3 Triton X-100 before being blocking with 5% bovine albumin for 30 min. The protein expression level was visualized under a fluorescent microscope (Olympus Corporation, Japan). The positive cell numbers were counted by Image J software (National Institutes of Health) in 5 random selected fields (× 200).
Western Blot
The collected tissues were digested with trypsin and treated with RIPA lysis buffer (Boster, Wuhan) in which protease inhibitor was supplemented. The concentration of the protein was determined with a BCA measuring kit (Boster, Wuhan). The proteins were separated under 10% SDS-PAGE and transferred onto PVDF membranes for blocking for 2 h with 5% BSA. Membranes were incubated with diluted primary antibody of Shp2 (ab32083, 1: 1000, abcam, Cambridge, UK) or GAPDH (ab9485, 1: 2500, abcam, Cambridge, UK) for overnight at 4°C. Then the membranes were washed and further incubated with HRP labeled goat anti rabbit secondary antibody (ab6721; 1: 2000; Abcam, Cambridge, UK) for 1 h at room temperature. ECL solution (EMD Millipore, USA) was added for 1 min for color development. Images were obtained using Tanon 5200 chemiluminiscence system (Shanghai, China). The images were analyzed using Image J (National Institutes of Health) and GAPDH was used as the internal control. Experiments were done in triplicate.
Cell Culture and Grouping
The Rattus norvegicus (NR) 8383 alveolar macrophage cell line (NR8383 cells) were purchased from ATCC (Manassas, Va, USA) and cultured in Dulbecco’s Modified Eagle medium (DMEM) which was supplemented with 10% fetal bovine serum in an incubator of 37°C with 5% CO2. Cells were grouped into LPS group (1 μg/mL LPS treatment for 6 h), control group (PBS treatment), LPS+sh-NC group (LPS treatment and sh-NC transfection), LPS+sh-Shp2 group (LPS treatment and sh-Shp2 transfection). The sh-NC and sh-Shp2 plasmid and virus packaging kit were purchased from GeneCopoeia (Rockville, MD, USA). sh-Shp2 vector is achieved with Shp2 knockdown, while sh-NC is the negative control. After cell transfection ofn NR8383cells for 48 h, ELISA kit (Cell Biolabs, Inc., San Diego, USA) was used to measure the viral titer. The viral titer was 5 × 10⁸ TU/mL and that for control group was 8 × 10⁸ TU/mL. The cell transfection of NR8383 cells was performed for 24 h and further cultured for 48 h. Puromycin (P8230, Beijing Solarbio Science & Technology Co., Ltd) was used to select the stably transfected cell lines. The transfection efficiency was detected by qRT-PCR.
Flow Cytometry
Trypsin treated NR8383 cells were first resuspended in PBS (1 × 10⁶ cells) and then 1 × 10⁵ cells were collected for resuspension in 100 μL PBS. After that, cells were incubated with 1 μL APC labelled CD80 antibody (eBioscience, USA) or 1 μL PE labelled CD206 antibody (eBioscience, USA) on ice in a dark room without light exposure. About 30 min later, cells were taken out for washing and resuspended in 300 μL PBS. Flow cytometry was used to detect the expression levels of iNOS and Arg1.
Statistical Analysis
Data were analyzed using SPSS 19.0 (IBM SPSS Statistics, Chicago, IL, USA). Data were tested for normal distribution and homogeneity test of variances. Data with normal distributions were expressed as Mean ± SD. Comparison between groups was analyzed using non-paired t test. P value of less than 0.05 was considered to have significant difference.
Results
Acute Lung Injury Rat Models had Elevated Shp2 Expression and Inflammatory Response
Acute lung injury was induced in rats by LPS treatment, after which the morphology of the lung tissues was assessed by H&E staining. The observations showed that rats in LPS group had higher morphological scores than those in control group (Figures 1A and 1B). Analysis of W/D ratio demonstrated that LPS group had higher W/D ratio than those in control group (Figure 1C), indicating for increased lung water content and lung injury. Further, measurement of inflammatory cytokines showed that the expression levels of IL-6, IL-1β and TNF-α in BALF were elevated in LPS group when compared with those in control group (Figure 1D). Those results supported the ALI rat model was successfully established. Acute lung injury rat model had elevated expression of Shp2. After lipopolysacharide treatment, the lung tissues of rats were collected. A. H&E staining was used to detect the morphology of lung tissues; B. Morphology was scored by 2 pathologist; C. comparison of W/D lung weight ratio; D. ELISA was used to detect the expression of IL-6, IL-1β and TNF-α; E. Immunofluorescence shows the expression of iNOS (biomarker of M1) and Arg-1 (biomarker of M2); F. Shp2 in lung tissue was detected by western blot. Data were expressed as mean ± SD. Comparison between groups was determined using independent sample t test, n = 10. *, compared with Control group, P < 0.05. ALI, acute lung injury; W/D ratio, ratio of wet/dry lung weight.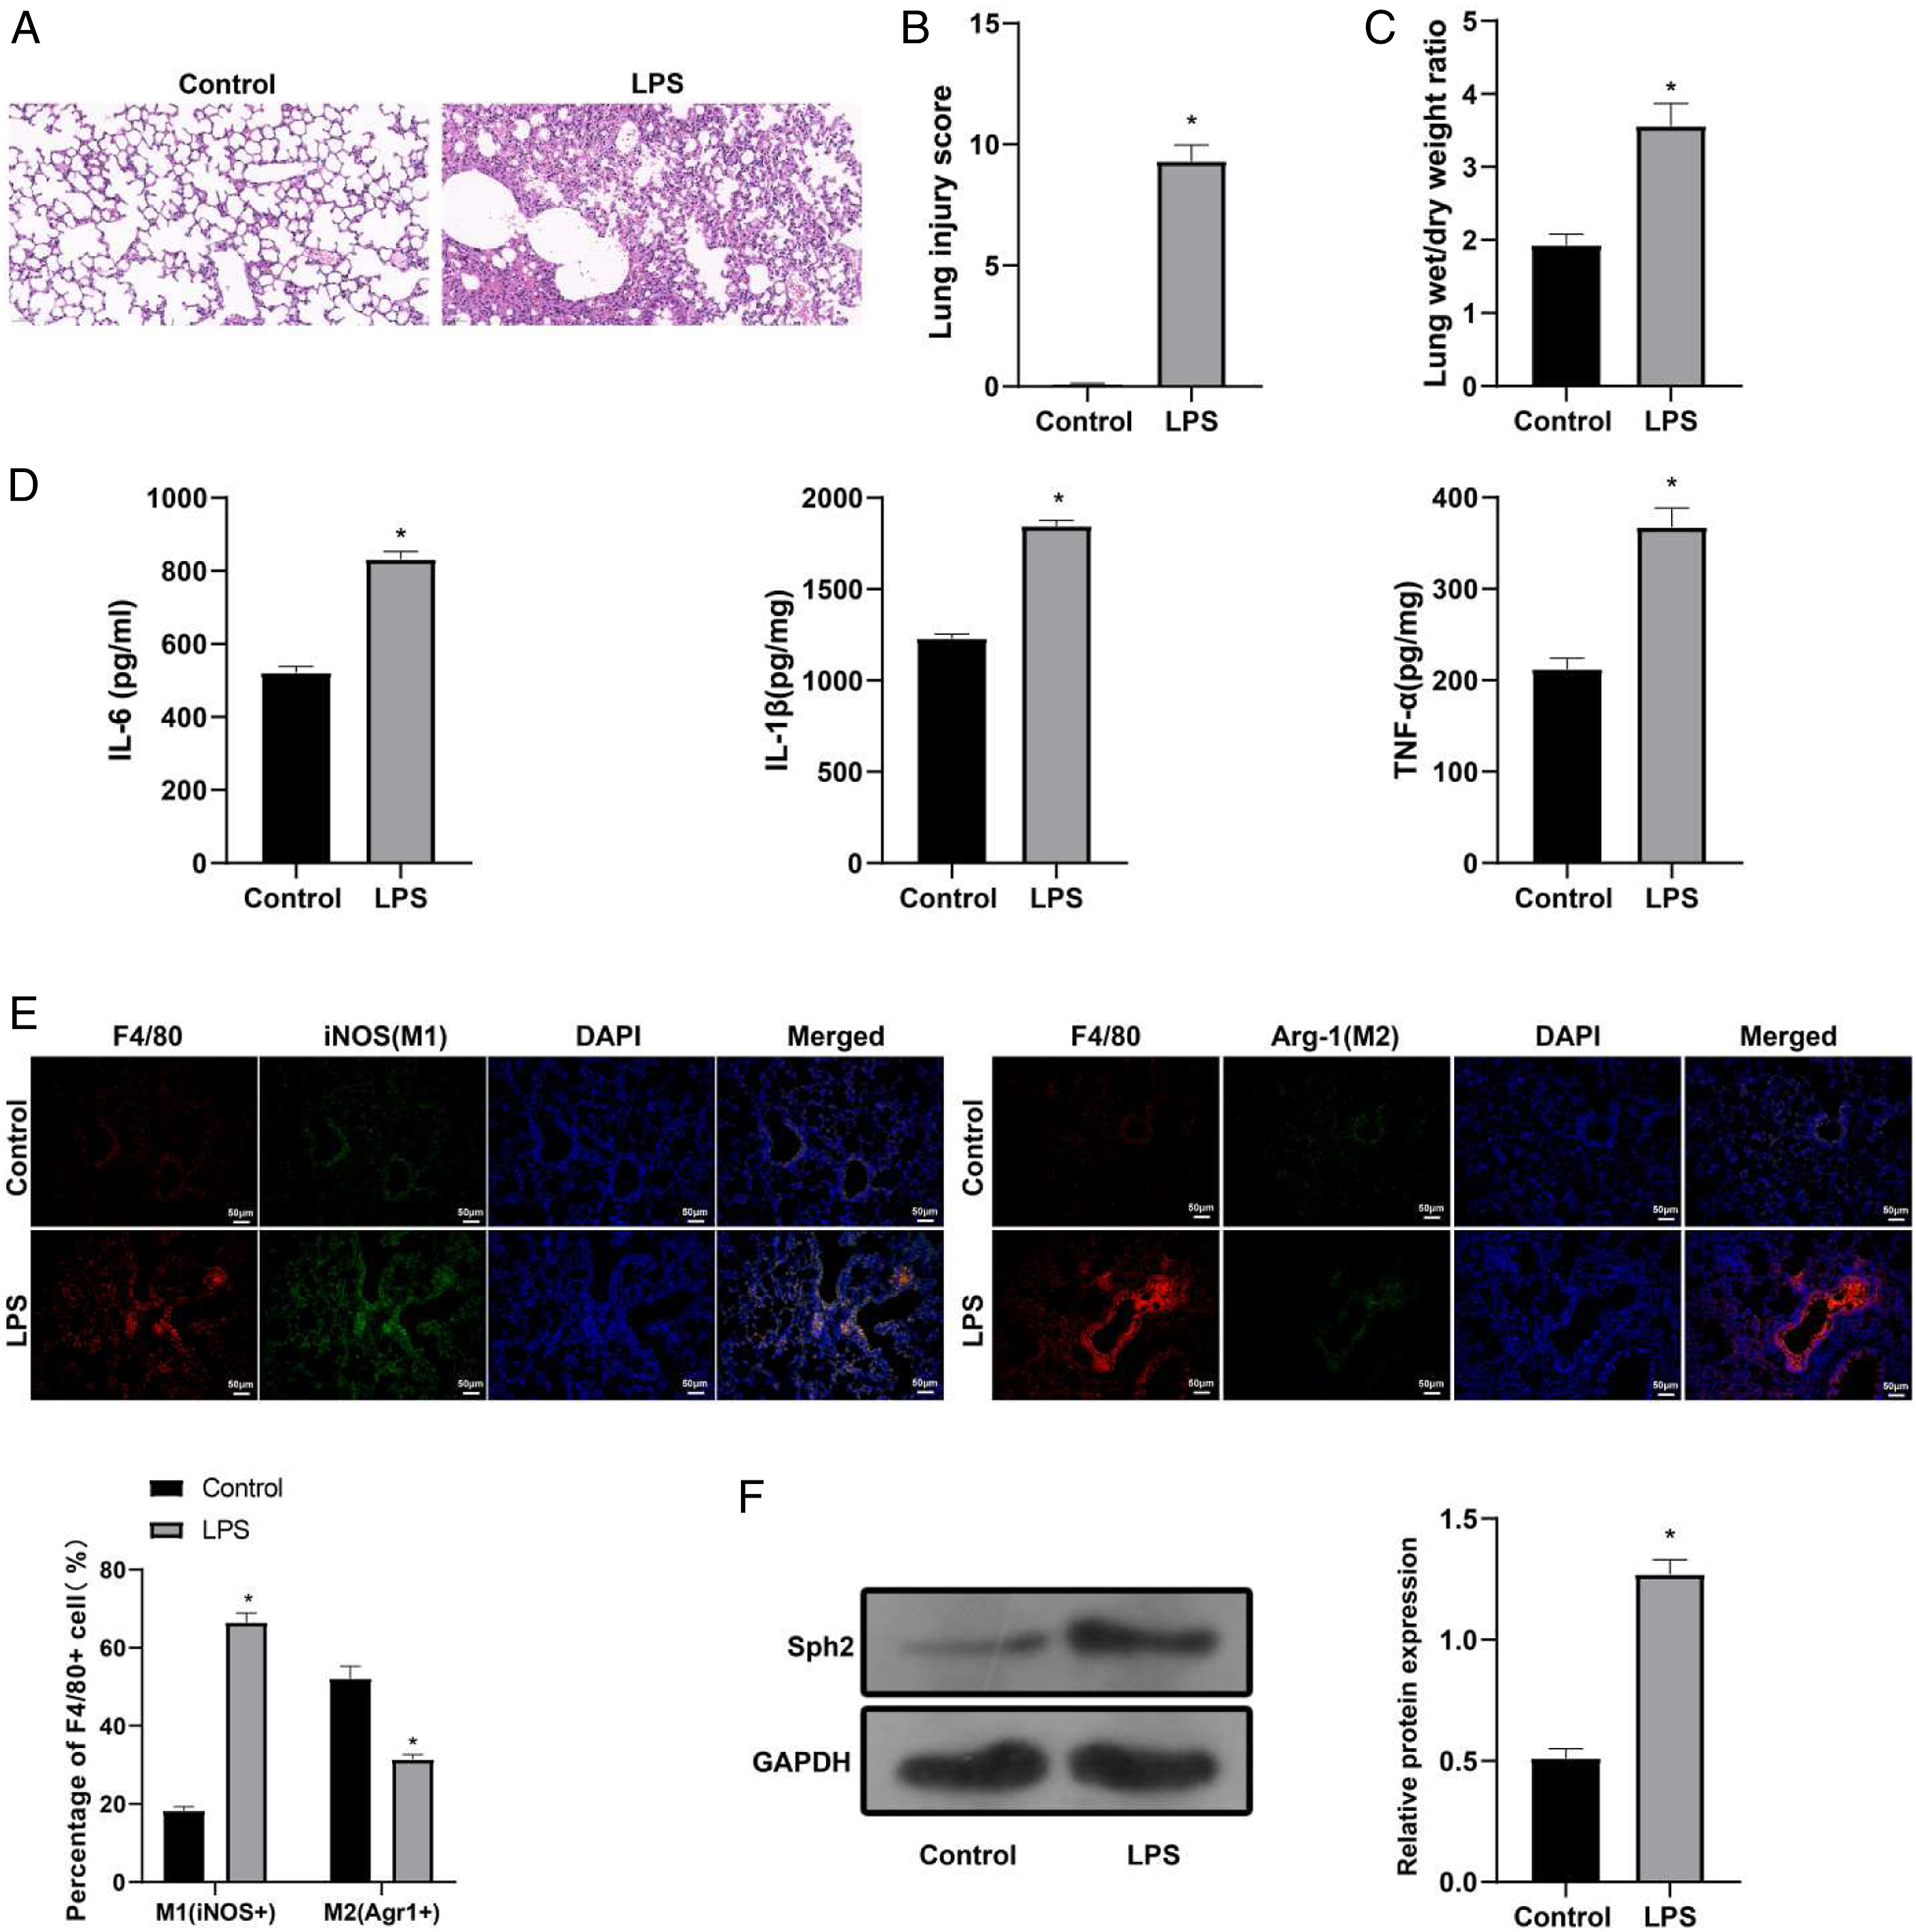
Immunofluorescence detected the iNOS (biomarker of M1) and Arg-1 (biomarker of M2) in macrophages of the lung tissues (macrophage specific surface antigen F4/80). The detection showed that LPS group had elevated expression of iNOS and suppressed expression of Arg-1 when compared with control group (Figure 1E). The expression of Shp2 in lung tissue was also detected and the results showed Shp2 was elevated in LPS group in comparison with that in control group (Figure 1F). Collectively, Shp2 expression was activated in ALI rat models.
Shp2 was Highly Expressed in Lipopolysacharide Treated NR8383 Cells
NR8383 cells were treated by LPS, in which the expressions of iNOS and Arg-1 were measured. Compared with control group, LPS group had increased expression of iNOS and decreased expression of Arg-1 (Figure 2A), which was consistent with observations by immunofluorescence (Figure 2B). Further, measurement of M2/M1 ratio by flow cytometry showed LPS group had decreased M2/M1 ratio when compared with control group (Figure 2C). Those results suggested that LPS treatment in NR8383 cells can result in increased M1 phenotype and decreased M2 phenotype. Detection of Shp2 expression showed that the LPS group had elevated expression of Shp2 compared with control group (Figure 2D), indicating Shp2 was highly expressed in LPS induced NR8383 cells. Shp2 was highly expressed in LPS induced NR8383 cells. A. The expression levels of iNOS and Arg-1 in LPS treated NR8383 cells were detected by Western blot; B. Immunofluorescence shows localization of iNOS and Arg-1 in LPS treated NR8383 cells; C. The ratio of M2/M1 cells was determined by flow cytometry; D. Shp2 expression in LPS treated NR8383 cells was also determined using Western blot. Data were expressed as mean ± SD. Comparison between groups was determined using independent sample t test. Cell experiments were conducted for 3 times. *, compared with Control group, P < 0.05.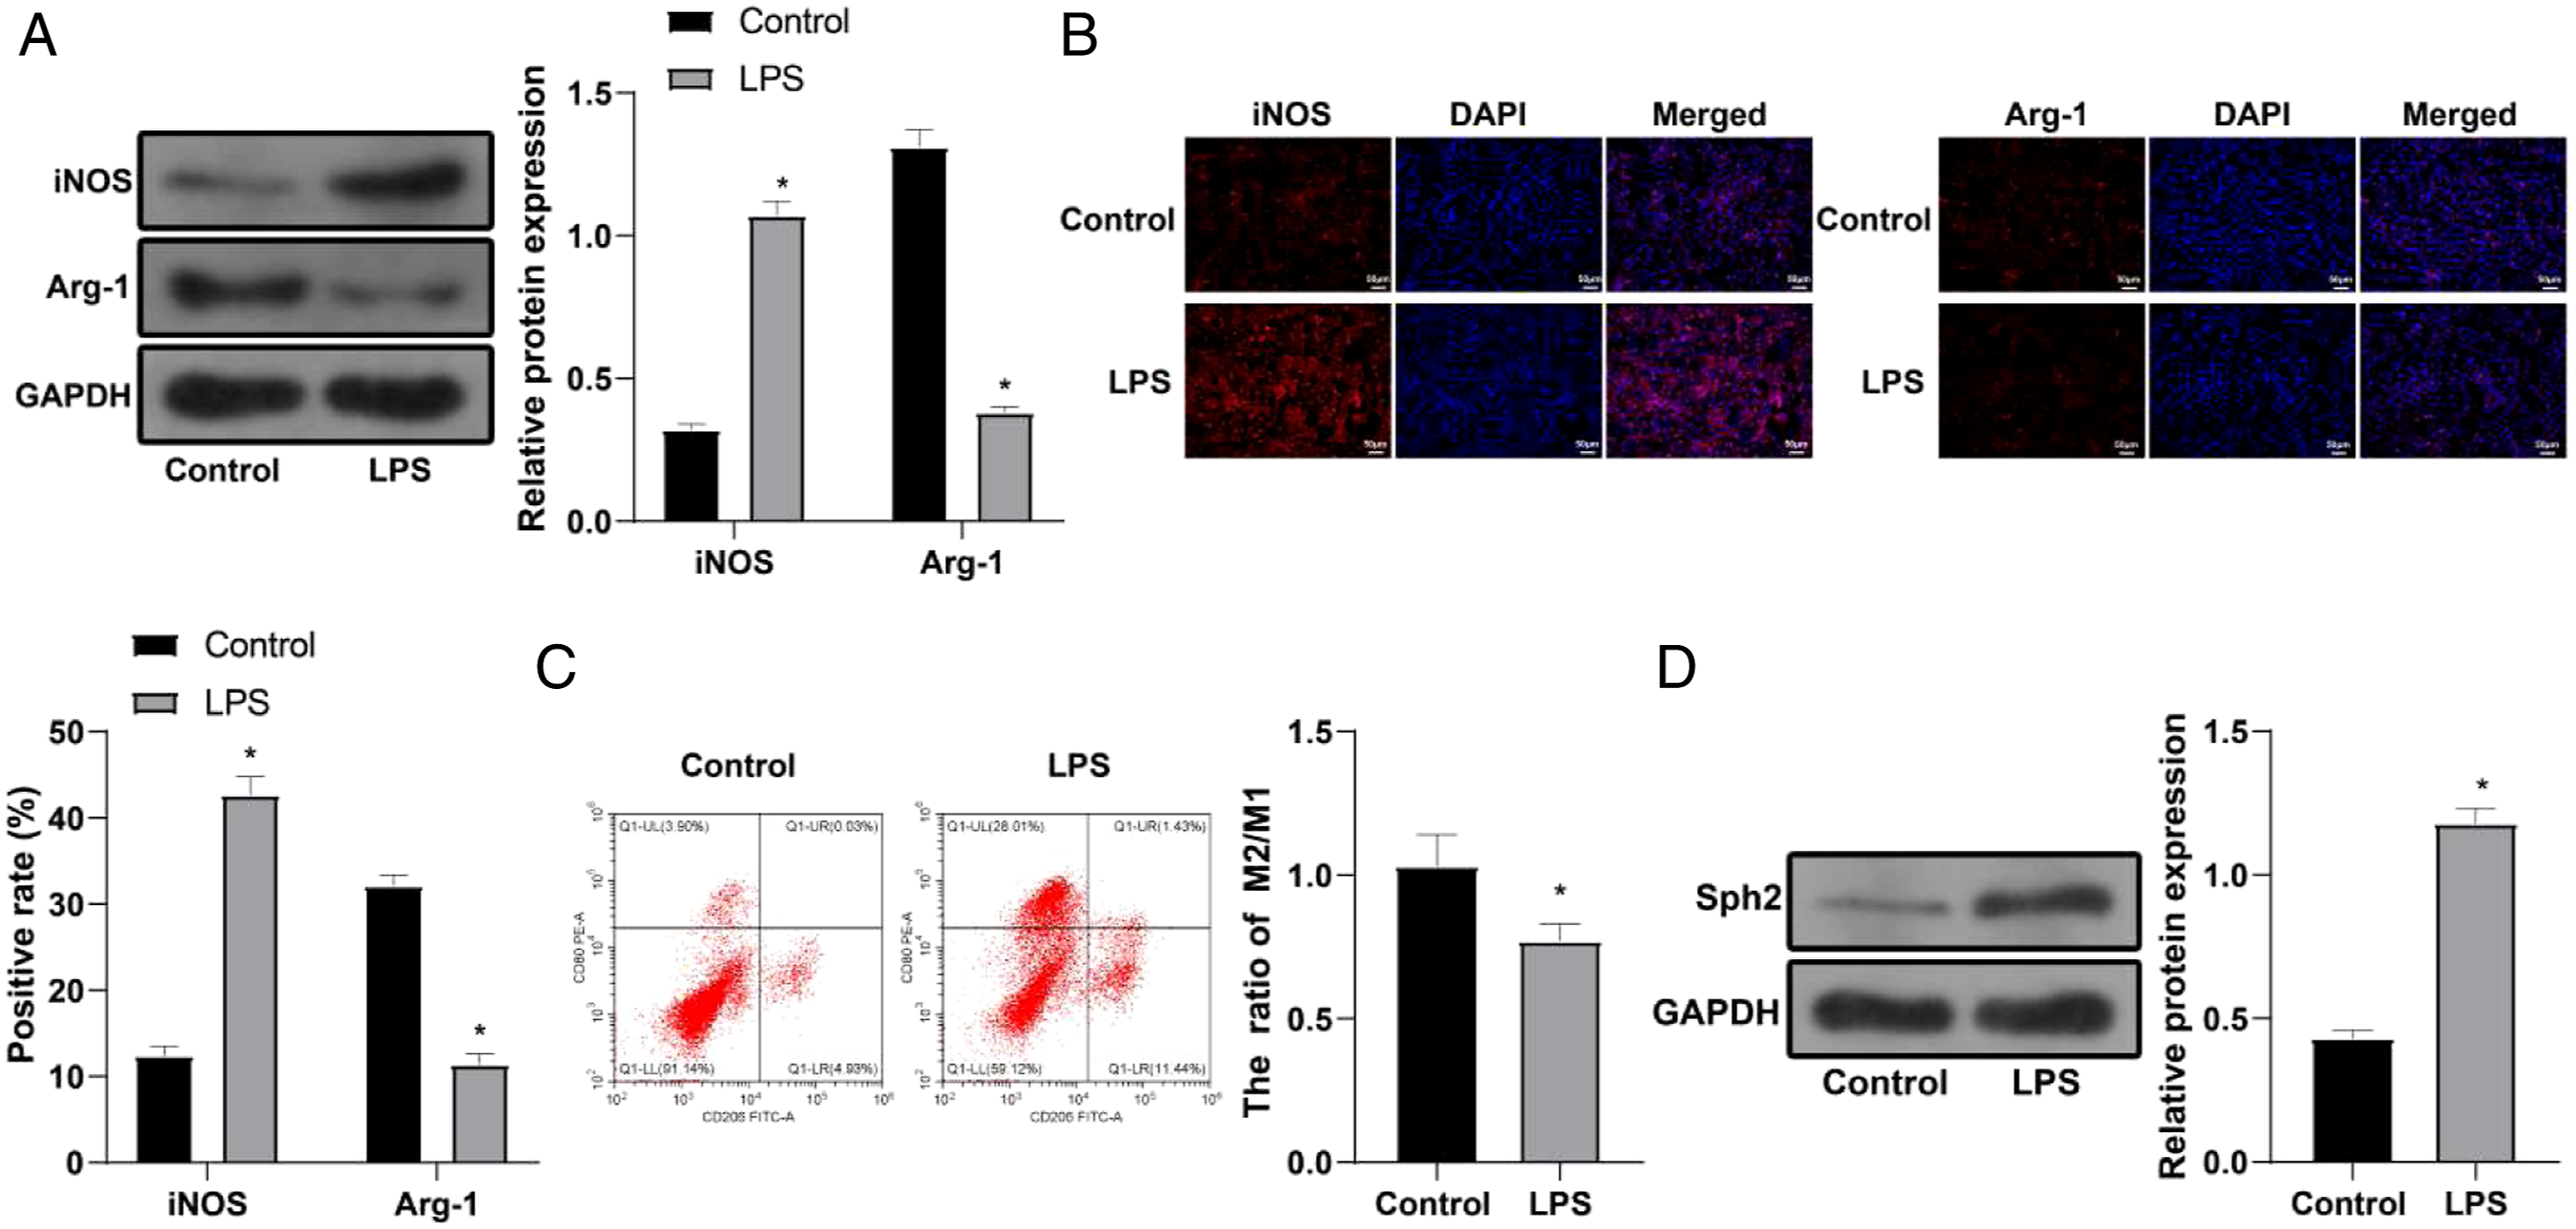
Inhibition on Shp2 Expression also Suppressed MI Phenotype and Inflammatory Cytokine Expression in Lipopolysacharide Induced NR8383 Cells
NR8383 cells were firstly treated with LPS and then transfection with plasmid in which Shp2 expression was suppressed. The transfection efficiency measured by Western blot and showed that compared with LPS+sh-NC group, the expression level of Shp2 was suppressed in LPS+sh-Shp2 group (Figure 3A). In addition, the LPS+sh-Shp2 group had decreased expression level and positive expression of iNOS, and increased expression level and positive expression of Arg-1 when compared with LPS+sh-NC group (Figures 3B and 3C). Meanwhile, the M2/M1 ratio in LPS+sh-Shp2 group was also increased compared with LPS+sh-NC group (Figure 3D). Those results showed that inhibition of Shp2 expression can suppress the M1 phenotype in LPS treated NR8383 cells. Inhibition on Shp2 expression can increase M2 phenotype and suppress M1 phenotype in LPS treated NR8383 cells. A. After NR8383 cells were treated with LPS and transfected with sh-Shp2, the transfection efficiency was verified by western blot; B. The expression levels of iNOS and Arg-1 were determined by western blot; C. Immunofluorescence shows expression pattern of iNOS and Arg-1 expression; D. The M2/M1 cell ratio was detected by flow cytometry. Data were expressed as mean ± SD. Comparison between groups was determined using independent sample t test. Cell experiments were conducted for 3 times. *, compared with LPS+sh-NC group, P < 0.05.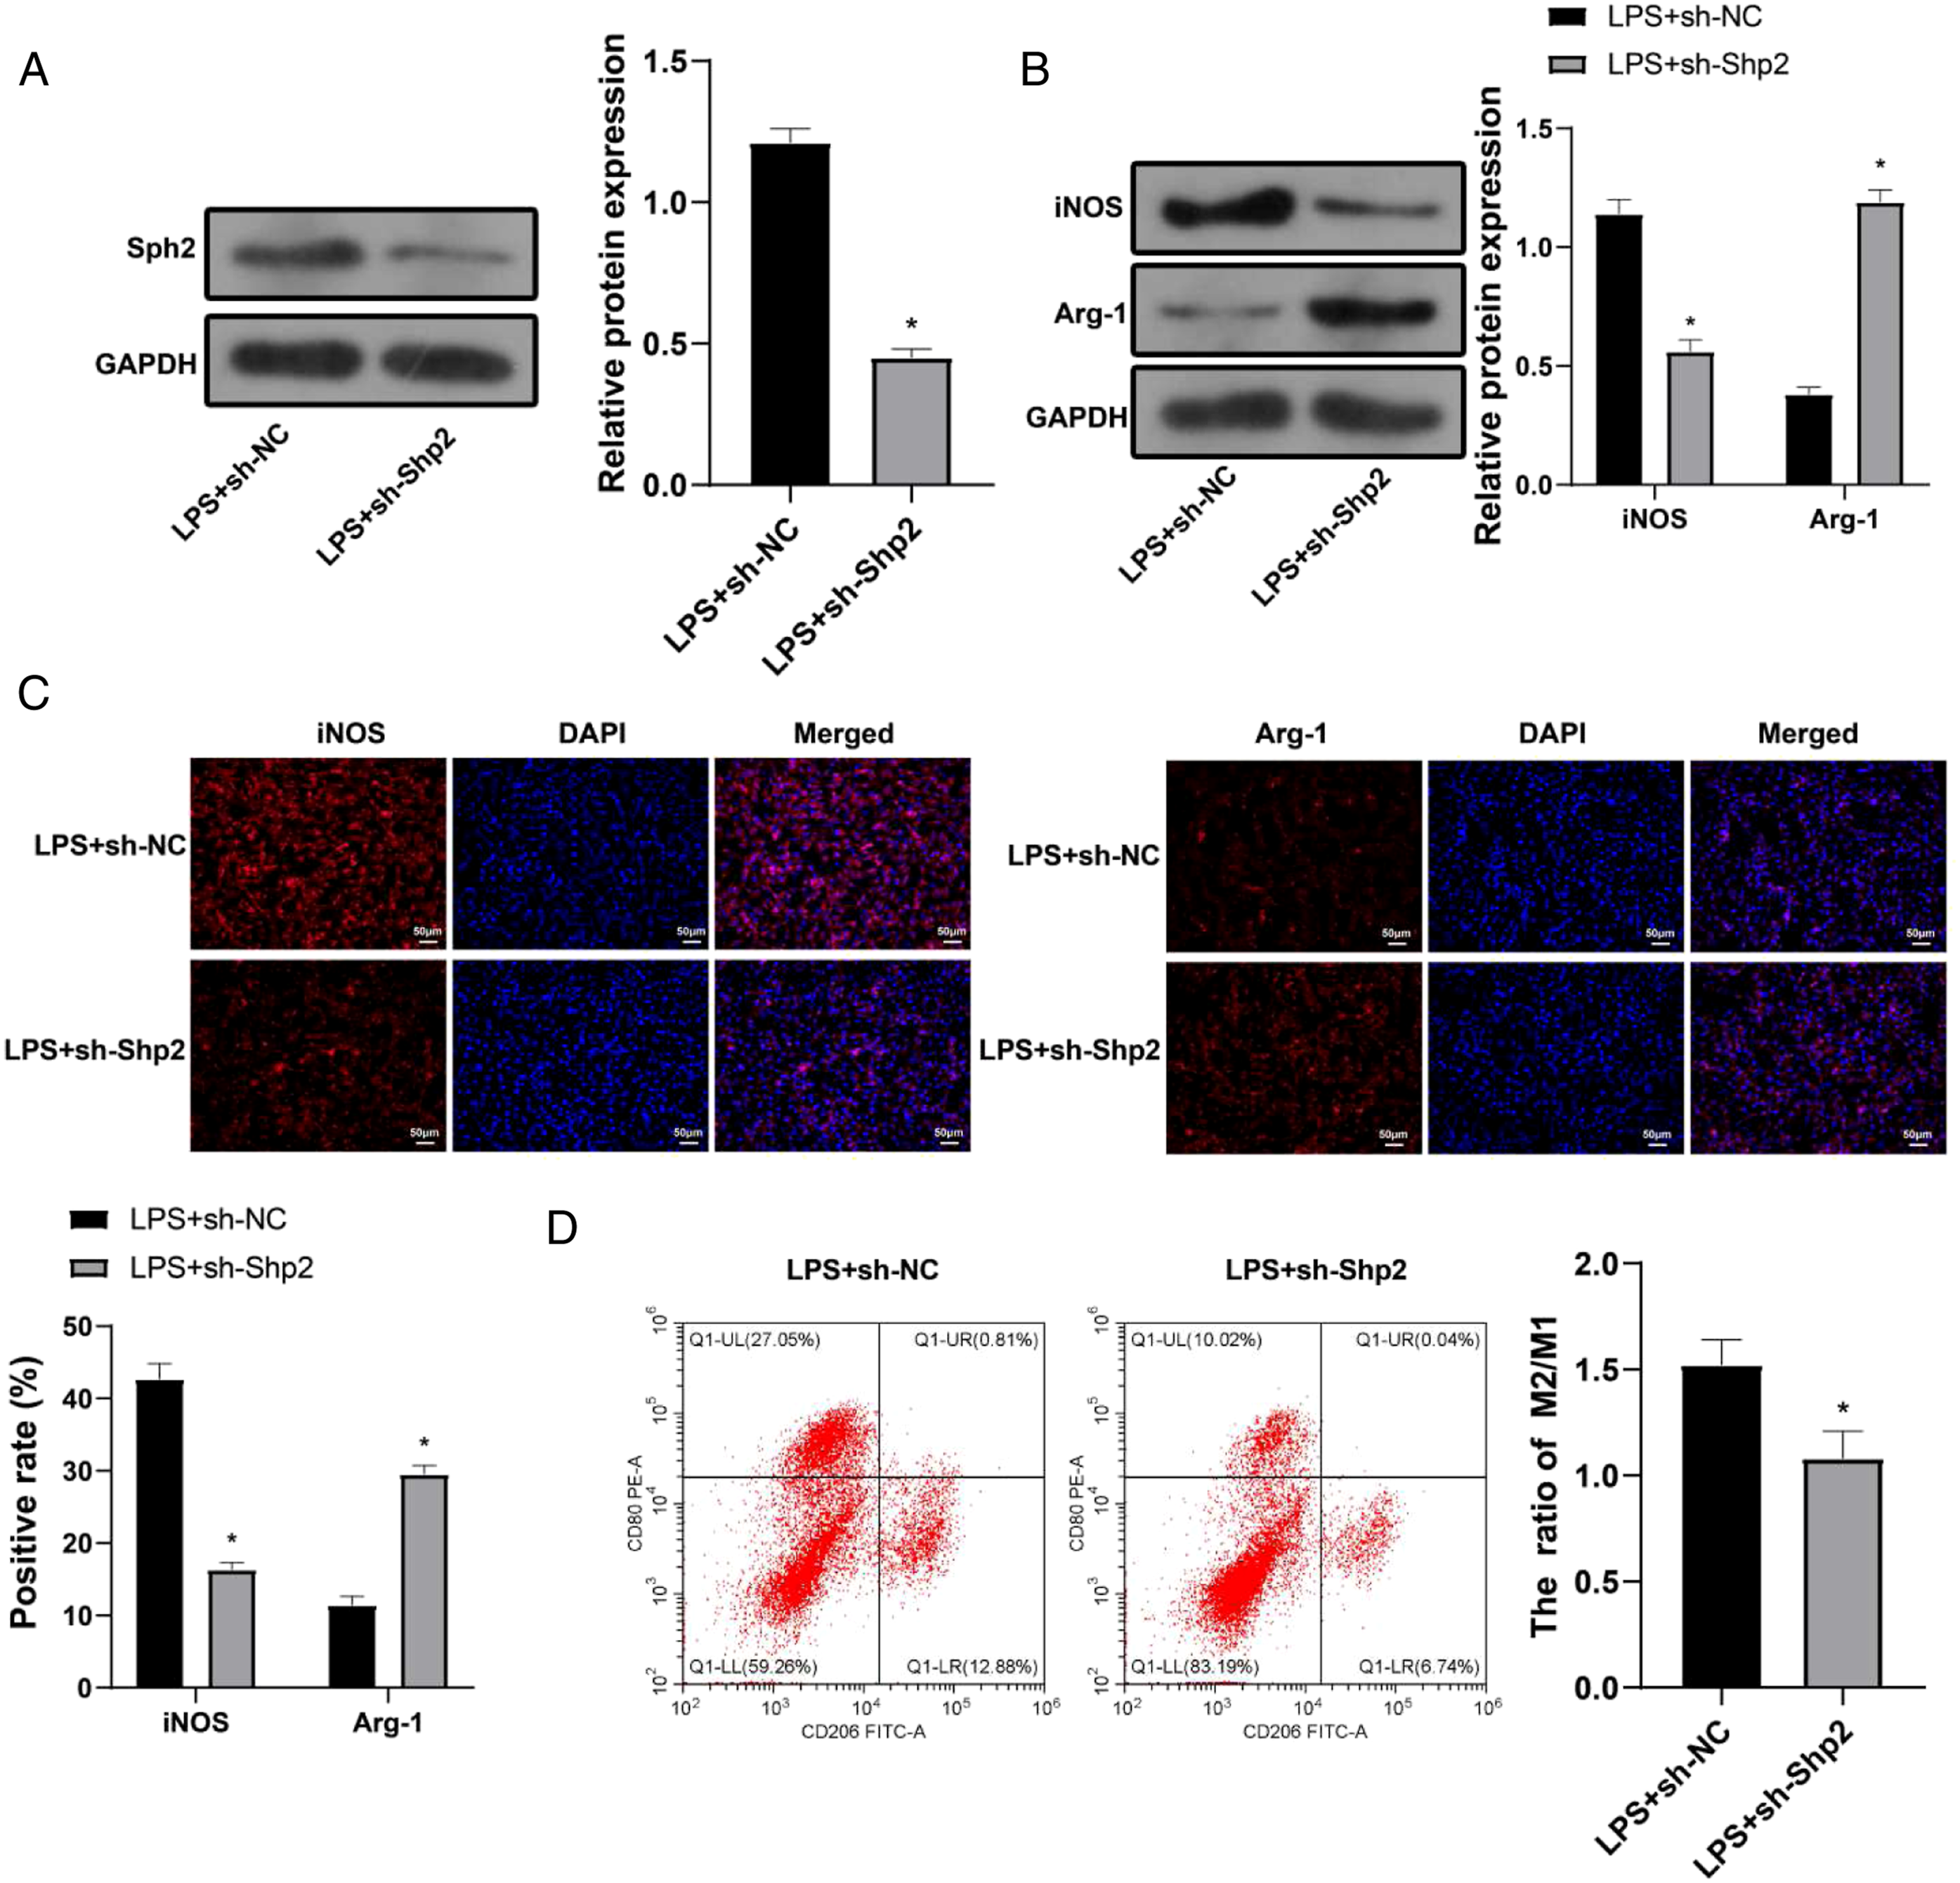
Shp2 Suppression Attenuate Acute Lung Injury in Rats
Acute lung injury rat models were established which were then injected with sh-Shp2. Measurement of the transfection efficiency by western blot showed that, compared with LPS+sh-NC group, the expression of Shp2 in lung tissues was decreased in LPS+sh-Shp2 group (Figure 4A). H&E staining on morphology of lung tissues demonstrated that rats in LPS+sh-Shp2 group had lower pathological scores than that in LPS+sh-NC group (Figure 4B and 4C). LPS+sh-Shp2 group also had decreased W/D ratio in comparison to that in LPS+sh-NC group (Figure 4D). Measurement on IL-6, IL-1β and TNF-α expression levels demonstrated that those expression in LPS+sh-Shp2 group were suppressed when compared with LPS+sh-NC group (Figure 4E). In addition to that, LPS+sh-Shp2 group had decreased iNOS expression and elevated Arg-1 expression when compared with LPS+sh-NC group (Figure 4F). Suppression on Shp2 expression can ameliorate ALI progression in rat models. After ALI rat model was established, rats were injected with sh-Shp2. A. The expression of Shp2 was determined by Western blot; B. Lung morphology was observed after H&E staining; C. Lung morphology was scored after H&E staining; D. Comparison of W/D lung weight ratio; E. ELISA was performed to detect the expression of IL-6, IL-1β and TNF-α; F. Immunofluorescence shows the expression of iNOS (biomarker of M1) and Arg-1 (biomarker of M2); Data were expressed as mean ± SD. Comparison between groups was determined using independent sample t test, n = 10. *, compared with Control group, P < 0.05. ALI, acute lung injury; W/D ratio, ratio of wet/dry lung weight.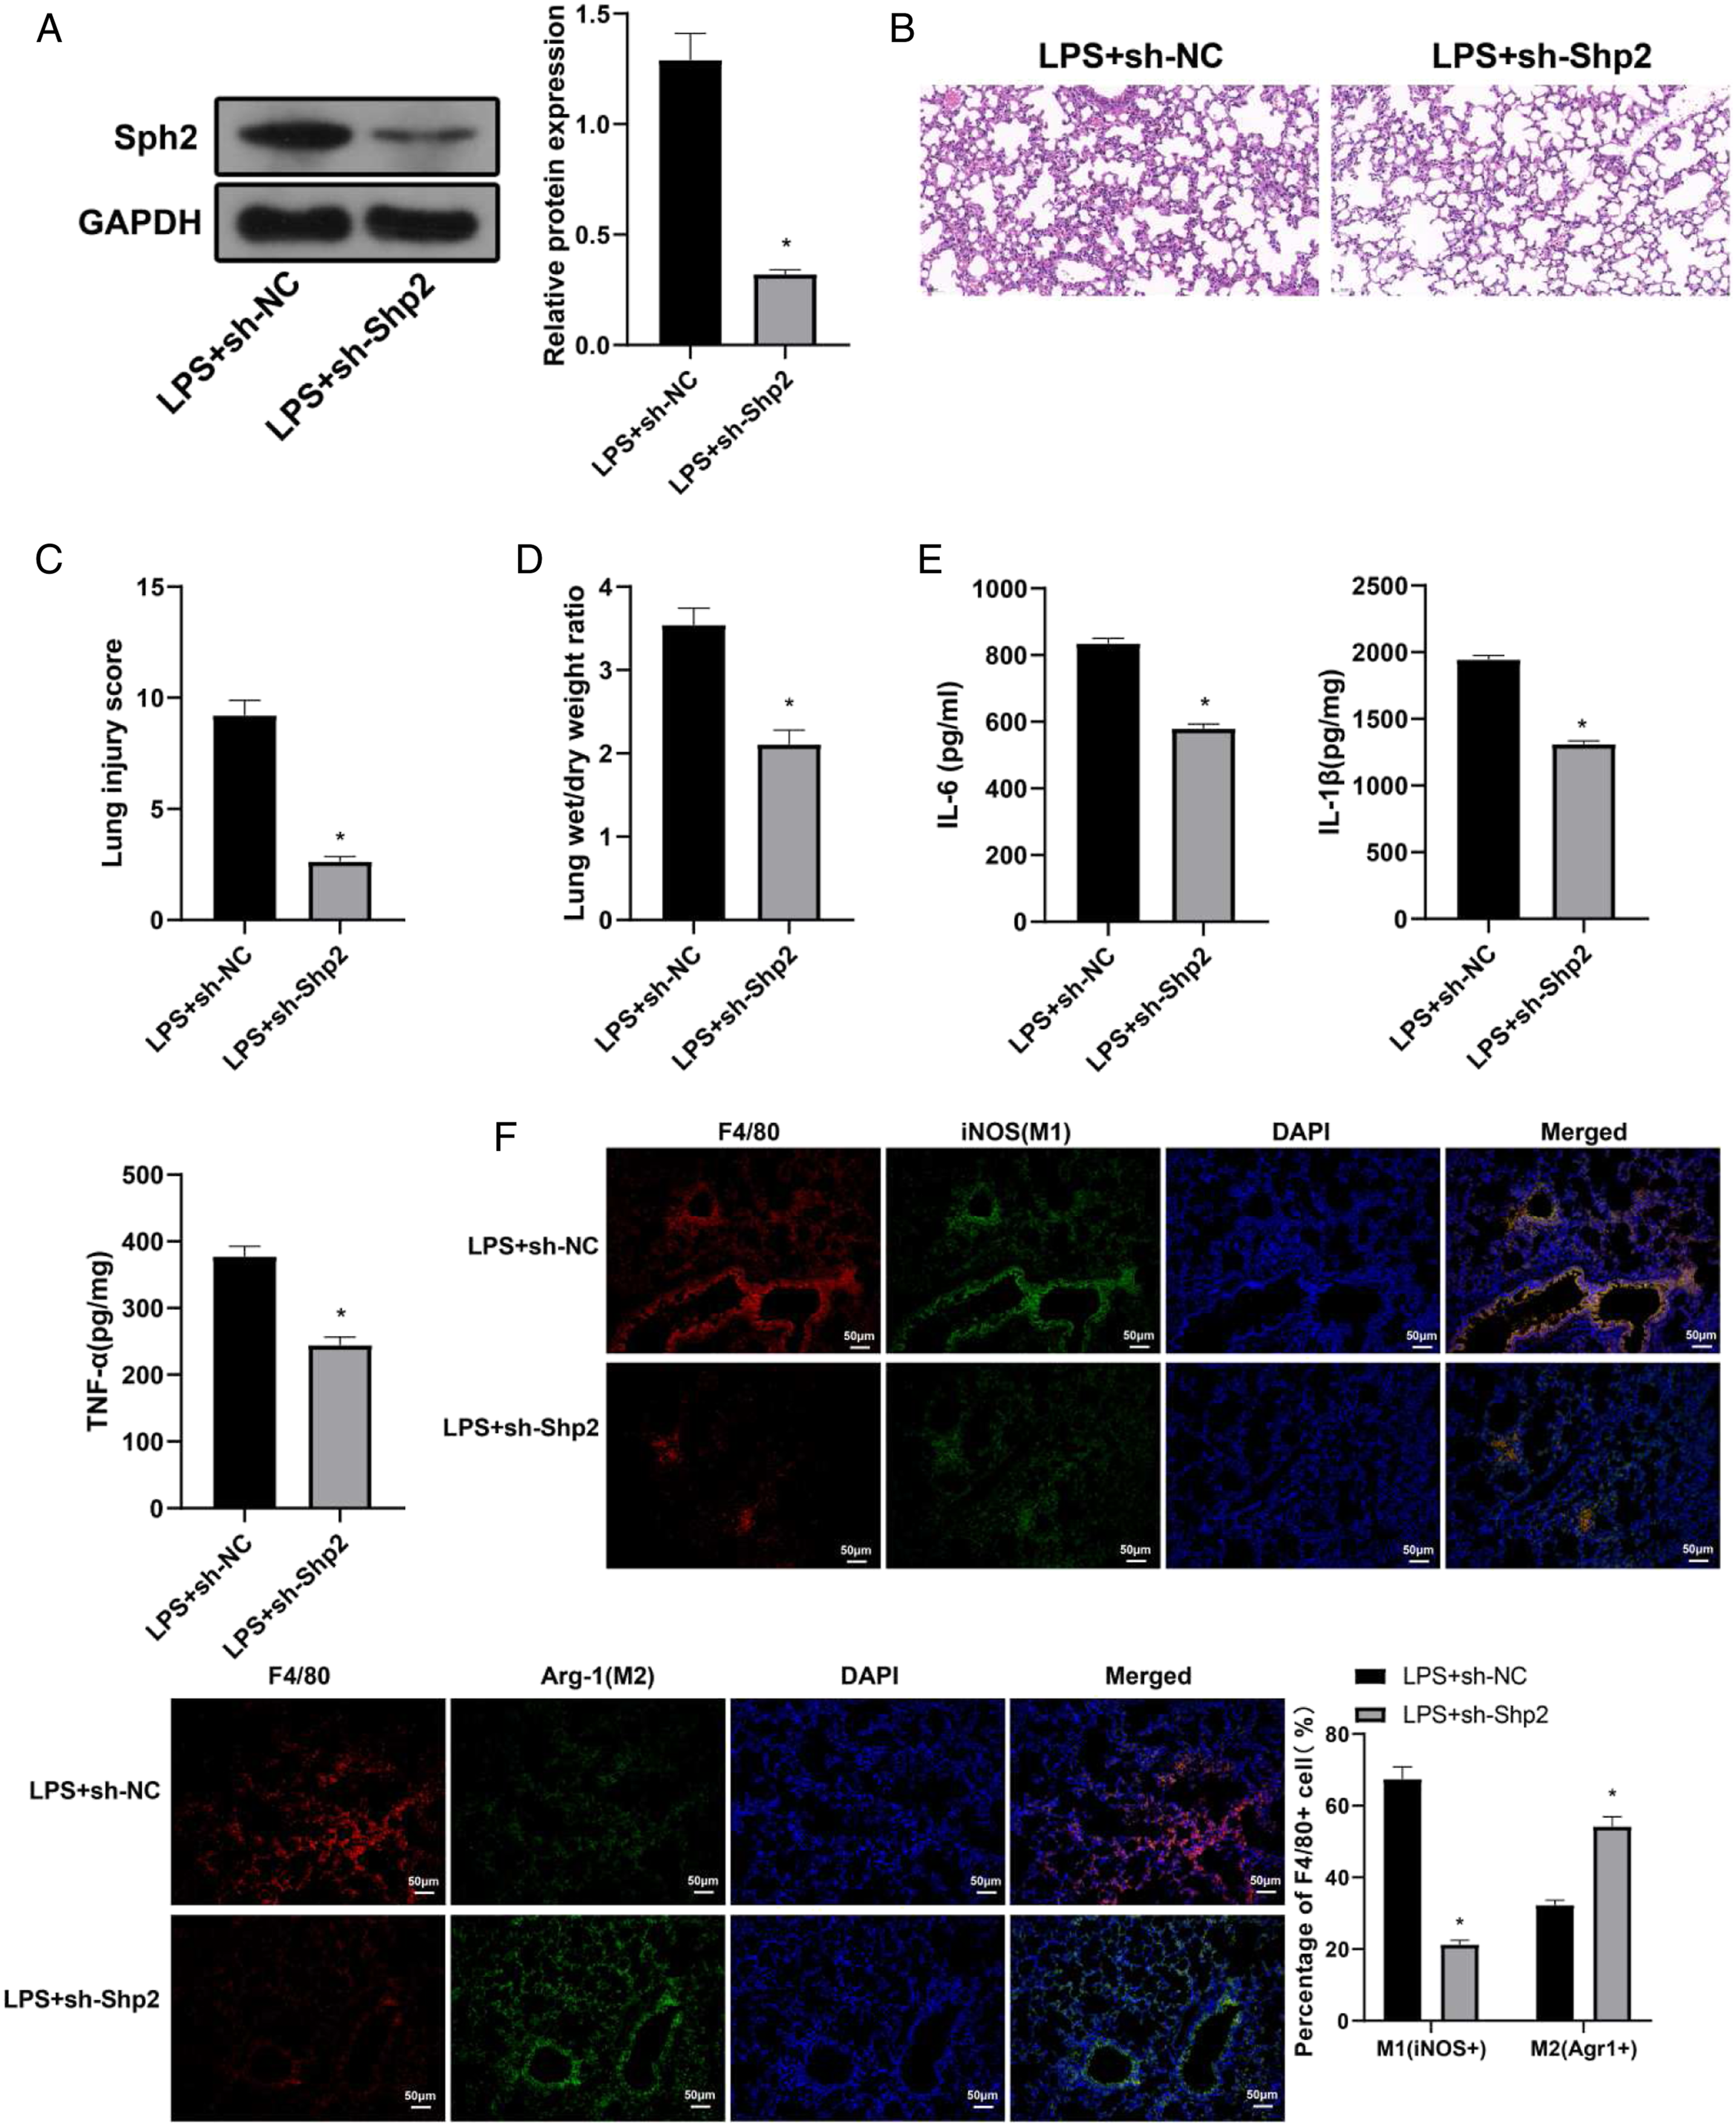
Discussion
The present study explored the macrophage polarization in ALI progression and then revealed the regulation by Shp2 on M2/M1 ratio alternation during this process. The evidence collected in this study showed that M2/M1 ratio was decreased in ALI and the suppression of Shp2 can restore the M2/M1 ratio, which in turn suppresses the release of inflammatory cytokines, such as IL-6, IL-1β and TNF-α.
The major result of this study was to determine the macrophage phenotype in ALI rat models. Macrophages, generally classified into M1 phenotype and M2 phenotype, can be pro-inflammatory or anti-inflammatory depending on disease stages. 12 M1 phenotype can be activated by IFN-γ and/or LPS. 22 Our study showed that both LPS induced rat models and LPS treated NR8383 cells, had increased expression of iNOS, a notable biomarker for M1 phenotype. Inflammation is triggered as a defense mechanism of the body against foreign materials, during which the primary goal is to remove foreign materials. After that, the inflammation subsides, but in case of any dysregulation of the wound healing response, the inflammation can be injurious to normal tissues by impairing their functions and eventually leading to organ failure. 23 A previous study reported that in the acute phase of lung disease, macrophages in the lungs were polarized to M1 phenotype which resulted in the increased production of TNF-α, IL-1, NO, and reactive oxygen species to induce a severe inflammatory response. 11 Similar results were obtained in our study, which identified that ALI rat models had elevated expression of inflammatory cytokines (IL-6, IL-1β and TNF-α), and elevated expression of iNOS, as well as decreased expression of Arg-1. The detection on ratio of M2/M1 in LPS treated NR8383 cells showed that M1 ratio was increased, while the M2/M1 ratio was decreased. A possible explanation could be that the disturbance on the balance of M1 and M2 macrophages can contribute to the initiation and progression of inflammatory diseases as chemokines and cytokines regulated by macrophages are crucial regulator for tissues injury and damages. 24
The primary result was the regulation by Shp2 on the M2/M1 ratio in ALI. NR8383 cells were treated with LPS to establish an in vitro model, in which the elevated expression of Shp2 was identified. Similarly, the altered Shp2 expression was associated with disease progression in several diseases and carcinomas. 25 In pancreatic ductal adenocarcinoma cells, suppression of Shp2 was indispensable for the remodeling of immune microenvironment, but was associated with suppressed tumor angiogenesis. 16 The immunotherapeutic potential of Shp2 in T cells and macrophages was also suggested in various cancer cells. 26 In our study, Shp2 inhibition can increase the M2/M1 ratio and suppress the inflammatory response in LPS treated NR8383 cells, indicating the possible regulation of Shp2 on macrophage polarization in ALI progression, which was further supported by in vivo experiments. In type 2 diabetes, Shp2 suppression improved insulin sensitivity through decreasing inflammation and alleviating macrophage activation. 27 In contrast to the results of our study, in mouse peritonitis models, the suppression of Shp2 in macrophages was proven to increase NLRP3 activation and mitochondrial dysfunction, resulting in the production of proinflammatory cytokines IL-1β and IL-18. 28 This discrepancy may be explained by the different treatment approaches in each study and the difference in cellular context, but both studies support the regulation of Shp2 on macrophage and inflammatory response. Considering the bi-directional effect of Shp2 in cancer immunotherapy as it can promote tumor growth and suppress the activation of T-cell, 29 therefore the regulation of Shp2 in macrophage polarization in ALI progression also need to be further validated and future studies are required.
Conclusions
Taken together, our study proved that macrophages were polarized in to M1 phenotype in ALI, which was associated with elevated inflammatory response. Meanwhile, suppression of Shp2 can attenuate the M1 polarization, which contributed to suppression of cell inflammation and attenuation of ALI progression. The role of Shp2 was dependent on cellular background; therefore, more evidence is required to validate the role of Shp2 in ALI or other inflammatory diseases. In addition, the dose response of Shp2 suppression on ALI progression is also a future directions that worth exploration and can serve as 1 of the potential directions for our future research.
Supplemental Material
Supplemental Material - Shp2 in Alveolar Macrophages Regulates Macrophage I Phenotype in Acute Lung Injury
Supplemental Material for Shp2 in Alveolar Macrophages Regulates Macrophage I Phenotype in Acute Lung Injury by Dawei Wang, and Qiumei Cao in International Journal of Toxicology
Footnotes
Author Contributions
Dawei Wang contributed to conception and design, contributed to acquisition, analysis, and interpretation, drafted manuscript, and critically revised manuscript; Qiumei Cao contributed to design, contributed to analysis and interpretation, drafted manuscript, and critically revised manuscript. The authors gave final approval and agree to be accountable for all aspects of work ensuring integrity and accuracy.
Declaration of Conflicting Interests
The author(s) declared no potential conflicts of interest with respect to the research, authorship, and/or publication of this article.
Funding
The author(s) received no financial support for the research, authorship, and/or publication of this article.
Availability of Data and Materials
The datasets used or analyzed during the current study are available from the corresponding author on reasonable request.
Ethical Statement
The experiment design was approved by the ethical committee of Beijing Tongren Hospital and the experiment was conducted based on Guide for the Care and Use of Laboratory Animals published by the National Institutes of Health (NIH).
Supplemental Material
Supplemental material for this article is available online.
References
Supplementary Material
Please find the following supplemental material available below.
For Open Access articles published under a Creative Commons License, all supplemental material carries the same license as the article it is associated with.
For non-Open Access articles published, all supplemental material carries a non-exclusive license, and permission requests for re-use of supplemental material or any part of supplemental material shall be sent directly to the copyright owner as specified in the copyright notice associated with the article.