
Abstract
The objective of this study was to investigate the effect of liquiritigenin (LQ) on breast cancer (BC) and its mechanism. After BC cell lines and normal mammary epithelial cells were cultured with LQ, CCK-8, and Scratch, Transwell assays and flow cytometry were applied to test the effect of LQ on cell proliferation, migration, invasion, and apoptosis. The effect of LQ on the expression of microRNA-383-5p (miR-383-5p) and connective tissue growth factor (CTGF) was measured by qRT-PCR and Western blotting. Bioinformatics prediction was used to evaluate the binding relationship between miR-383-5p and CTGF, which was verified by dual-luciferase reporter assay. After miR-383-5p and/or CTGF expression was upregulated through cell transfection, the relationship between miR-383-5p and CTGF, as well as their effects on BC, was further assessed. The results showed that LQ can significantly inhibit CTGF expression and the proliferative, migratory, and invasive abilities of BC cells, while facilitating apoptosis of BC cells and miR-383-5p expression. The inhibiting effect of LQ was dose-dependently enhanced in BC cells. Dual-luciferase reporter assay verified that miR-383-5p targeted CTGF. CTGF expression was inversely regulated by miR-383-5p. CTGF upregulation repressed the suppressive effect of miR-385-5p on BC cell development. In conclusion, LQ can inhibit CTGF expression by upregulating miR-383-5p, thereby inhibiting proliferative, migratory, and invasive abilities and promoting apoptosis of BC cells.
Keywords
Introduction
Breast cancer (BC) is one of the most detrimental cancers in women globally, with regard to both incidence and mortality.1,2 At present, available diagnosis and treatment for BC include molecular imaging, genomic expression profiles, newer surgical techniques, radiation therapies, which bring about a collaborative multidisciplinary approach for improving tumor characterization and decreasing cancer recurrence. 3 In spite of the recent advances in early detection and aggressive management, 5 ∼ 10% of patients are diagnosed with de novo metastatic BC and approximately 20-30% develop distant metastasis during follow-up. 4 Therefore, it is rather important to discover novel approaches for BC treatment.
Licorice is regarded as one of the most frequently used herbal drugs in Traditional Chinese Medicine, and licorice flavonoids are able to restrain cancer cell growth through blocking cell cycle and regulating multiple signaling pathways.5,6 Liquiritigenin (LQ), one of the flavonoid compounds, has exhibited antioxidant, anti-inflammatory, and anti-tumor activities.7,8 LQ effectively repressed pituitary adenoma tumor growth and promoted cell apoptotic death. 8 LQ led to suppression on cell invasion and migration, thus decreasing the malignant behaviors of triple-negative breast cancer cells (TNBC). 9 However, its explicit role and related mechanisms in BC development are largely undefined.
Abnormal expression of microRNA (miRNAs) is associated with cell proliferation, apoptotic response, metastasis, and cancer recurrence in BC. 10 More importantly, miRNAs are proven as crucial regulators for the therapeutic effect of LQ,11,12 whereas the interactions between LQ and miRNAs in BC have not been reported. MicroRNA-383-5p (miR-383-5p) was significantly downregulated in BC tissues, and could reduce BC cell viability and inhibit the migration of BC cells. 13 MiR-383-5p was positively associated with the survival of BC patients and its upregulation weakened cell proliferative, migratory, and invasive abilities of BC cells. 14 Connective tissue growth factor (CTGF), a member of the CCN matricellular protein family, promotes cancer initiation, progression, and metastasis by regulating cell proliferation, migration, and invasion.15,16 CTGF was highly expressed in human hepatocellular carcinoma (HCC) tissues and aggravated HCC progression. 17 Also, significant associations have been found between CTGF overexpression and BC development.18,19 Intriguingly, a binding site between miR-383-5p and CTGF was predicted by a bioinformatics tool in the present work, indicating possible interaction between these two genes. Hence, we speculated whether LQ could regulate the miR-383-5p/CTGF axis to affect BC development.
The present study is intended to evaluate the potential role of LQ in BC progression and to elucidate its potential relationship with miR-383-5p/CTGF axis, hoping to present a new therapeutic strategy for BC management.
Materials and Methods
Cell Culture
Estrogen receptor (ER), progesterone receptor (PR), and human epithelial receptor 2 (HER2) are three important receptors commonly used for BC classification, which are closely related to proliferation, invasion, and prognosis of BC. BT483 (ER+, PR+/-, HER2-), AU565 (ER-, PR+, HER2-), and BT20 (ER-, PR-, HER2-) cells (American Type Culture Collection (ATCC), Manassas, VA, USA) were cultured in Roswell Park Memorial Institute (RPMI) 1640 medium (Thermo Fisher Scientific, MA, USA) in a constant temperature incubator (37°C, 5% CO2, and 95% humidity). Cells in the logarithmic growth phase were harvested for subsequent experiments. Normal mammary epithelial cells MCF-10A (ATCC) were cultured in maternal expressed breast milk (MEBM, Lonza, Alpharetta, GA, USA) supplemented with 100 ng/mL cholera toxin (Lonza, Alpharetta, GA, USA).
LQ Treatment
A total of 0.0051 g of LQ was dissolved in 50 μL dimethyl sulfoxide (DMSO) to prepare stock solution (400 mmol/L). The liquid was aliquoted, frozen at −20°C, and diluted with RPMI 1640 before use. Preparation of the required solution: 10 μL DMSO and 990 μL RPMI 1640 were mixed to prepare solution A; 10 μL stock solution and 990 μL RPMI 1640 were mixed to prepare solution B (4 mmol/L). Solution A and Solution B were then mixed to prepare media containing 0.05 mol/L, 0.1 mmol/L, 0.2 mmol/L, 0.4 mmol/L, or 0.8 mmol/L LQ for cell culture. Subsequent experiment was conducted after 24 h of cell culture.
Cell Counting Kit-8 Assay (CCK-8 Assay)
Cells (1×10⁶/mL) were seeded into 96-well plates, with three replicates. After cell culture for 24, 48, and 72 h, 10 μL CCK-8 reagent (Tokyo, Dojindo, Japan) was added to each well. After further culture for 2 h, the absorbance at 450 nm wavelength was measured. Each experiment was conducted in triplicate.
Cell Scratch Test
The cells that reached 80% confluence in the culture flask were digested, centrifuged, and resuspended to prepare 1×10⁵/mL single-cell suspension which was seeded into 24-well plates (1 mL/well). The cells in each group were vertically scratched using a 100 μL micropipette tip, washed twice with phosphate buffer saline (PBS), and supplemented with corresponding culture medium. Cell scratches in each group were photographed so as to calculate the initial scratch width. Cells were further cultured in a 5% CO2 incubator at 37°C. After 24 h of cell culture, the cell scratches in each group were photographed again to evaluate the migration ability and 6 random fields were selected to calculate the mobility. Mobility = (T0h distance−T24h distance)/T0h distance × 100%. Each experiment was conducted in triplicate.
Transwell Assay
The groups of cells in good condition were digested by trypsin and resuspended into single-cell suspension with serum-free culture solution for later use. Transwell culture chambers (Becton, Dickinson and Company, pore size of 8 μm) coated with matrigel was placed onto 24-well plates. Then 800 μL cell culture medium containing 10% FBS was added into the basolateral chamber and 300 μL cell suspension containing 4×10⁴ cells was added into the apical chamber. After 16-24 h of conventional culture, the apical chamber was taken out to discard the supernatant. Noninvasive cells were wiped off with cotton swabs, and the remaining cells were stained with crystal violet for 5 min. The cells below the microporous membrane were observed by a microscope and photographed. Five visual fields taken from each well were used to count cells by IPP6.0 software. Each experiment was conducted in triplicate.
Flow Cytometry
The cells were centrifuged at 1,000 rpm for 10 min and washed 3 times with PBS. The cell suspension was fixed with 70% ethanol (pre-cooled at −20°C) for 1 h and then centrifuged to remove the solution. The cells were rinsed with PBS and prepared to 1×10⁷/mL single-cell suspension. Annexin V-FITC apoptosis detection kit (Beyotime, Shanghai, China) was carried out for measurement of apoptosis. FACSCANTO II FCM system was applied to measure the percentage of apoptosis. Fowjo 7.6.1 software (LLC., USA) was utilized to analyze flow cytometry results. Each experiment was conducted in triplicate.
Quantitative Real-Time Polymerase Chain Reaction (qRT-PCR)
Primer Sequence Used for Quantitative Real-Time Polymerase Chain Reaction.
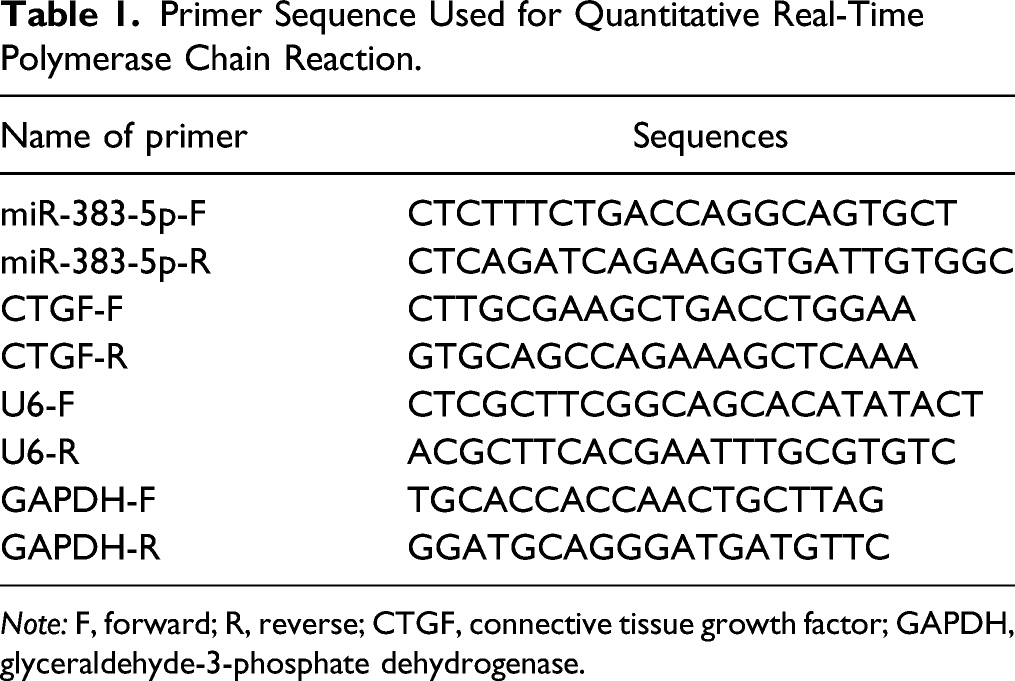
Note: F, forward; R, reverse; CTGF, connective tissue growth factor; GAPDH, glyceraldehyde-3-phosphate dehydrogenase.
Western Blotting
Cells were washed 3 times with pre-cooled PBS and lysed with the protein extraction lysis buffer (100 μL/50 mL, Beyotime, Shanghai, China). The cells were placed on ice for 30 min and then centrifuged at 12,000 rpm and 4°C for 10 min. The supernatant was aliquoted into 0.5 mL centrifuge tubes and stored at −20°C. BCA kit (Beyotime, Shanghai, China) was used to measure protein concentrations of the samples. Electrophoresis was initiated at 60 V, and then switched to 120 V in a 4°C chamber for 1-2 h after bromophenol blue entered into the separation gel. After electrophoresis, proteins were transferred into PVDF membranes by wet electrotransfer method. The electrotransfer was carried out in a 4°C chamber for 2 h. PVDF membranes were blocked with 5% skim milk-TBST, and incubated at room temperature for 1-2 h. After blocking, the membranes were placed in the incubator box, incubated with the primary antibody against CTGF (1:1000, ab209780, Abcam, Cambridge, MA, USA) at 4°C overnight and washed 3 times with TBST, each for 10 min. Then the membranes were immersed in secondary antibody goat anti-rabbit IgG (1:1000, #7074, Cell Signaling, Boston, USA) at room temperature for 1 h. Membranes were dripped with developing solution for imaging and data analysis, with GAPDH (1:1000, #5174, Cell Signaling, Boston, USA) as the internal control. Each experiment was conducted in triplicate.
Dual-Luciferase Reporter Assay
A binding site between miR-383-5p and CTGF was predicted by an online software Starbase (http://starbase.sysu.edu.cn/). According to the prediction, the mutated-type (MUT) and wild-type (WT) sequences of the binding site were designed, cloned, and inserted into the pGL3-Promoter vector. The pGL3-Promoter vector was then co-transfected into HEK293T cells with miR-383-5p mimic, with pRL-TK blank vector (Beyotime, Shanghai, China) as the internal control. Transfections were performed using LipoFiterTM transfection reagent (Beyotime, Shanghai, China) according to the manufacturer’s instructions. After 48 h of transfection, the luciferase intensity in each group was measured using luciferase kit (Amyjet Scientific, Wuhan, China). Each experiment was conducted in triplicate.
Cell Transfection
PcDNA3.1-CTGF, miR-383-5p mimic, miR-383-5p inhibitor, and their negative controls (NC) (GenePharma, Shanghai, China) were transfected into AU565 cells cultured with 0.2 mmol/L LQ using Lipofectamine 2000 (Invitrogen, Carlsbad, CA, USA). Untransfected cells were divided into NC group. Transfected AU565 cells were accordingly separated into miR-383-5p mimic group, mimic NC group, miR-383-5p inhibitor group, inhibitor NC group, pcDNA3.1-CTGF group, pcDNA3.1 group, and miR-383-5p mimic+pcDNA3.1-CTGF group. Forty eight hours after transfection, follow-up experiments were conducted.
Statistical Analysis
T test and one-way analysis of variance (ANOVA) were carried out to assess the significant difference between two groups and among multiple groups, followed by Tukey’ s multiple comparisons test. Data were analyzed by SPSS17.0 and GraphPad Prism 5.0. Significant statistics were represented by P < .05.
Results
LQ Inhibits Proliferation, Migration, and Invasion and Promotes Apoptosis of BC Cells
BT483, AU565, BT20, and MCF-10A cells were cultured with different concentrations of LQ (0.05, 0.1, 0.2, 0.4, and 0.8 mmol/L). Cell proliferation was identified by CCK-8 assay. The results uncovered that 0.2 mmol/L LQ significantly inhibited the activity of BT483, AU565, and BT20 cells while showed no remarkable effect on MCF-10A cell activity (Figure 1A). Subsequent experiments were conducted with 0.2 mmol/L LQ. To measure the effect of 0.2 mmol/L LQ on BC cells, cell migration was detected by scratch test, cell invasion by Transwell assay, and cell apoptosis by flow cytometry. The results uncovered that BT20 cells, a TNBC cell line, had the strongest proliferative and migratory abilities among BT483, AU565, and BT20 cells (Figure 1B and 1C). Moreover, LQ could markedly repress the proliferative, migratory, and invasive activities and strengthen the apoptosis of BT483, AU565, and BT20 cells (Figure 1B-1D). LQ inhibits the proliferation, migration, and invasion and promotes the apoptosis of BC cells. Note: (A) CCK8 assay was used to measure cell activity. (B) Cell scratch test was applied to test cell migration. (C) Transwell assay was conducted to detect cell invasion. (D) Flow cytometry was performed to assess cell apoptosis. Data were presented as mean ± standard deviation. Each experiment was conducted in triplicate. *P < .05, &P < .01, #P < .001. LQ, liquiritigenin.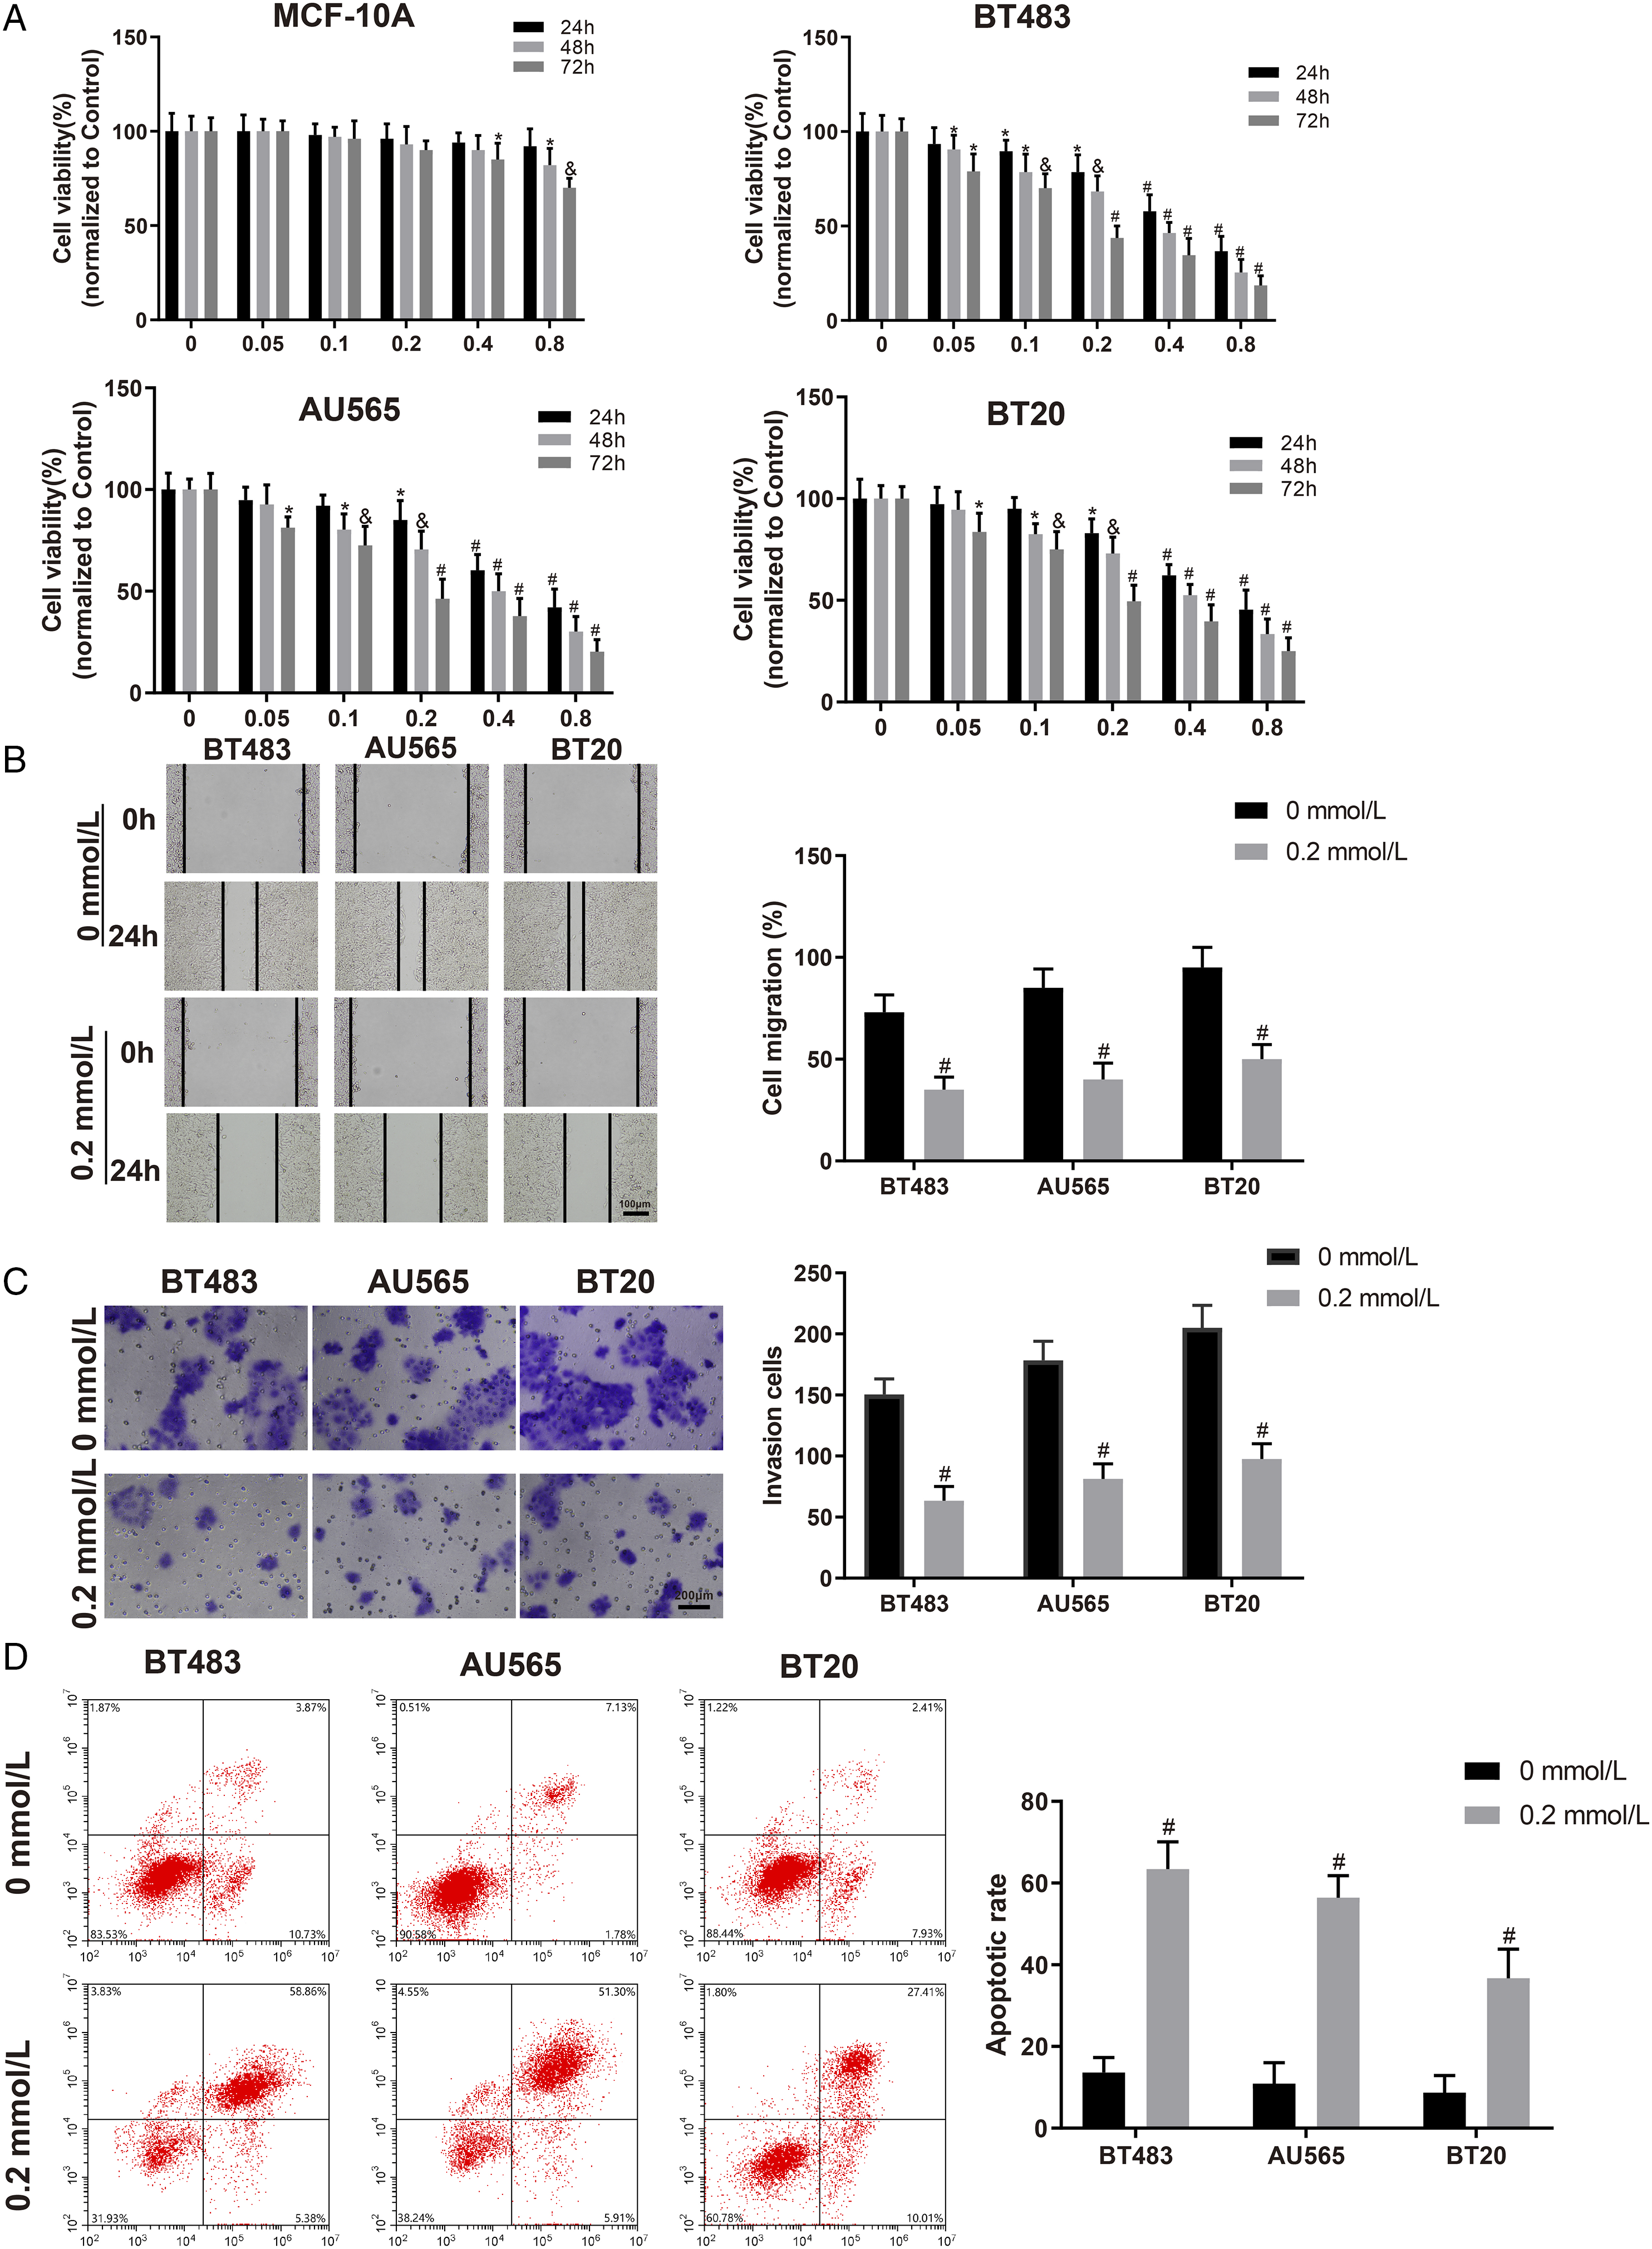
LQ Upregulates miR-383-5p Expression and Downregulates CTGF Expression in BC Cells
qRT-PCR was used to determine miR-383-5p expression and CTGF mRNA expression in MCF-10A, BT483, AU565, and BT20 cells. Western Blotting was applied to measure protein expression of CTGF. According to the results, compared to MCF-10A cells, miR-383-5p expression was lower in BC cells and BT20 cells showed the lowest miR-383-5p expression (Figure 2A), while CTGF expression was higher in BC cells, especially in BT20 cells (Figure 2B and 2C). In BT483, AU565, and BT20 cells treated with LQ, miR-383-5p expression was increased in a dose-dependent manner (Figure 2D), whereas CTGF expression was decreased with the increase in LQ concentration (Figure 2E and 2F). LQ elevates miR-383-5p expression and reduces CTGF expression in BC cells. Note: (A) qRT-PCR was used to measure miR-383-5p expression. (B) qRT-PCR was used to assess CTGF mRNA expression. (C) Western blotting was performed to test CTGF protein expression. (D) qRT-PCR was performed to measure miR-383-5p expression after treatment with LQ. (E) qRT-PCR was performed to measure CTGF mRNA expression after treatment with LQ. (F) Western blotting was performed to measure CTGF protein expression after treatment with LQ. Data were presented as mean ± standard deviation. Each experiment was conducted in triplicate. *P < .05, &P < .01, #P < .001. LQ, liquiritigenin; CTGF, connective tissue growth factor.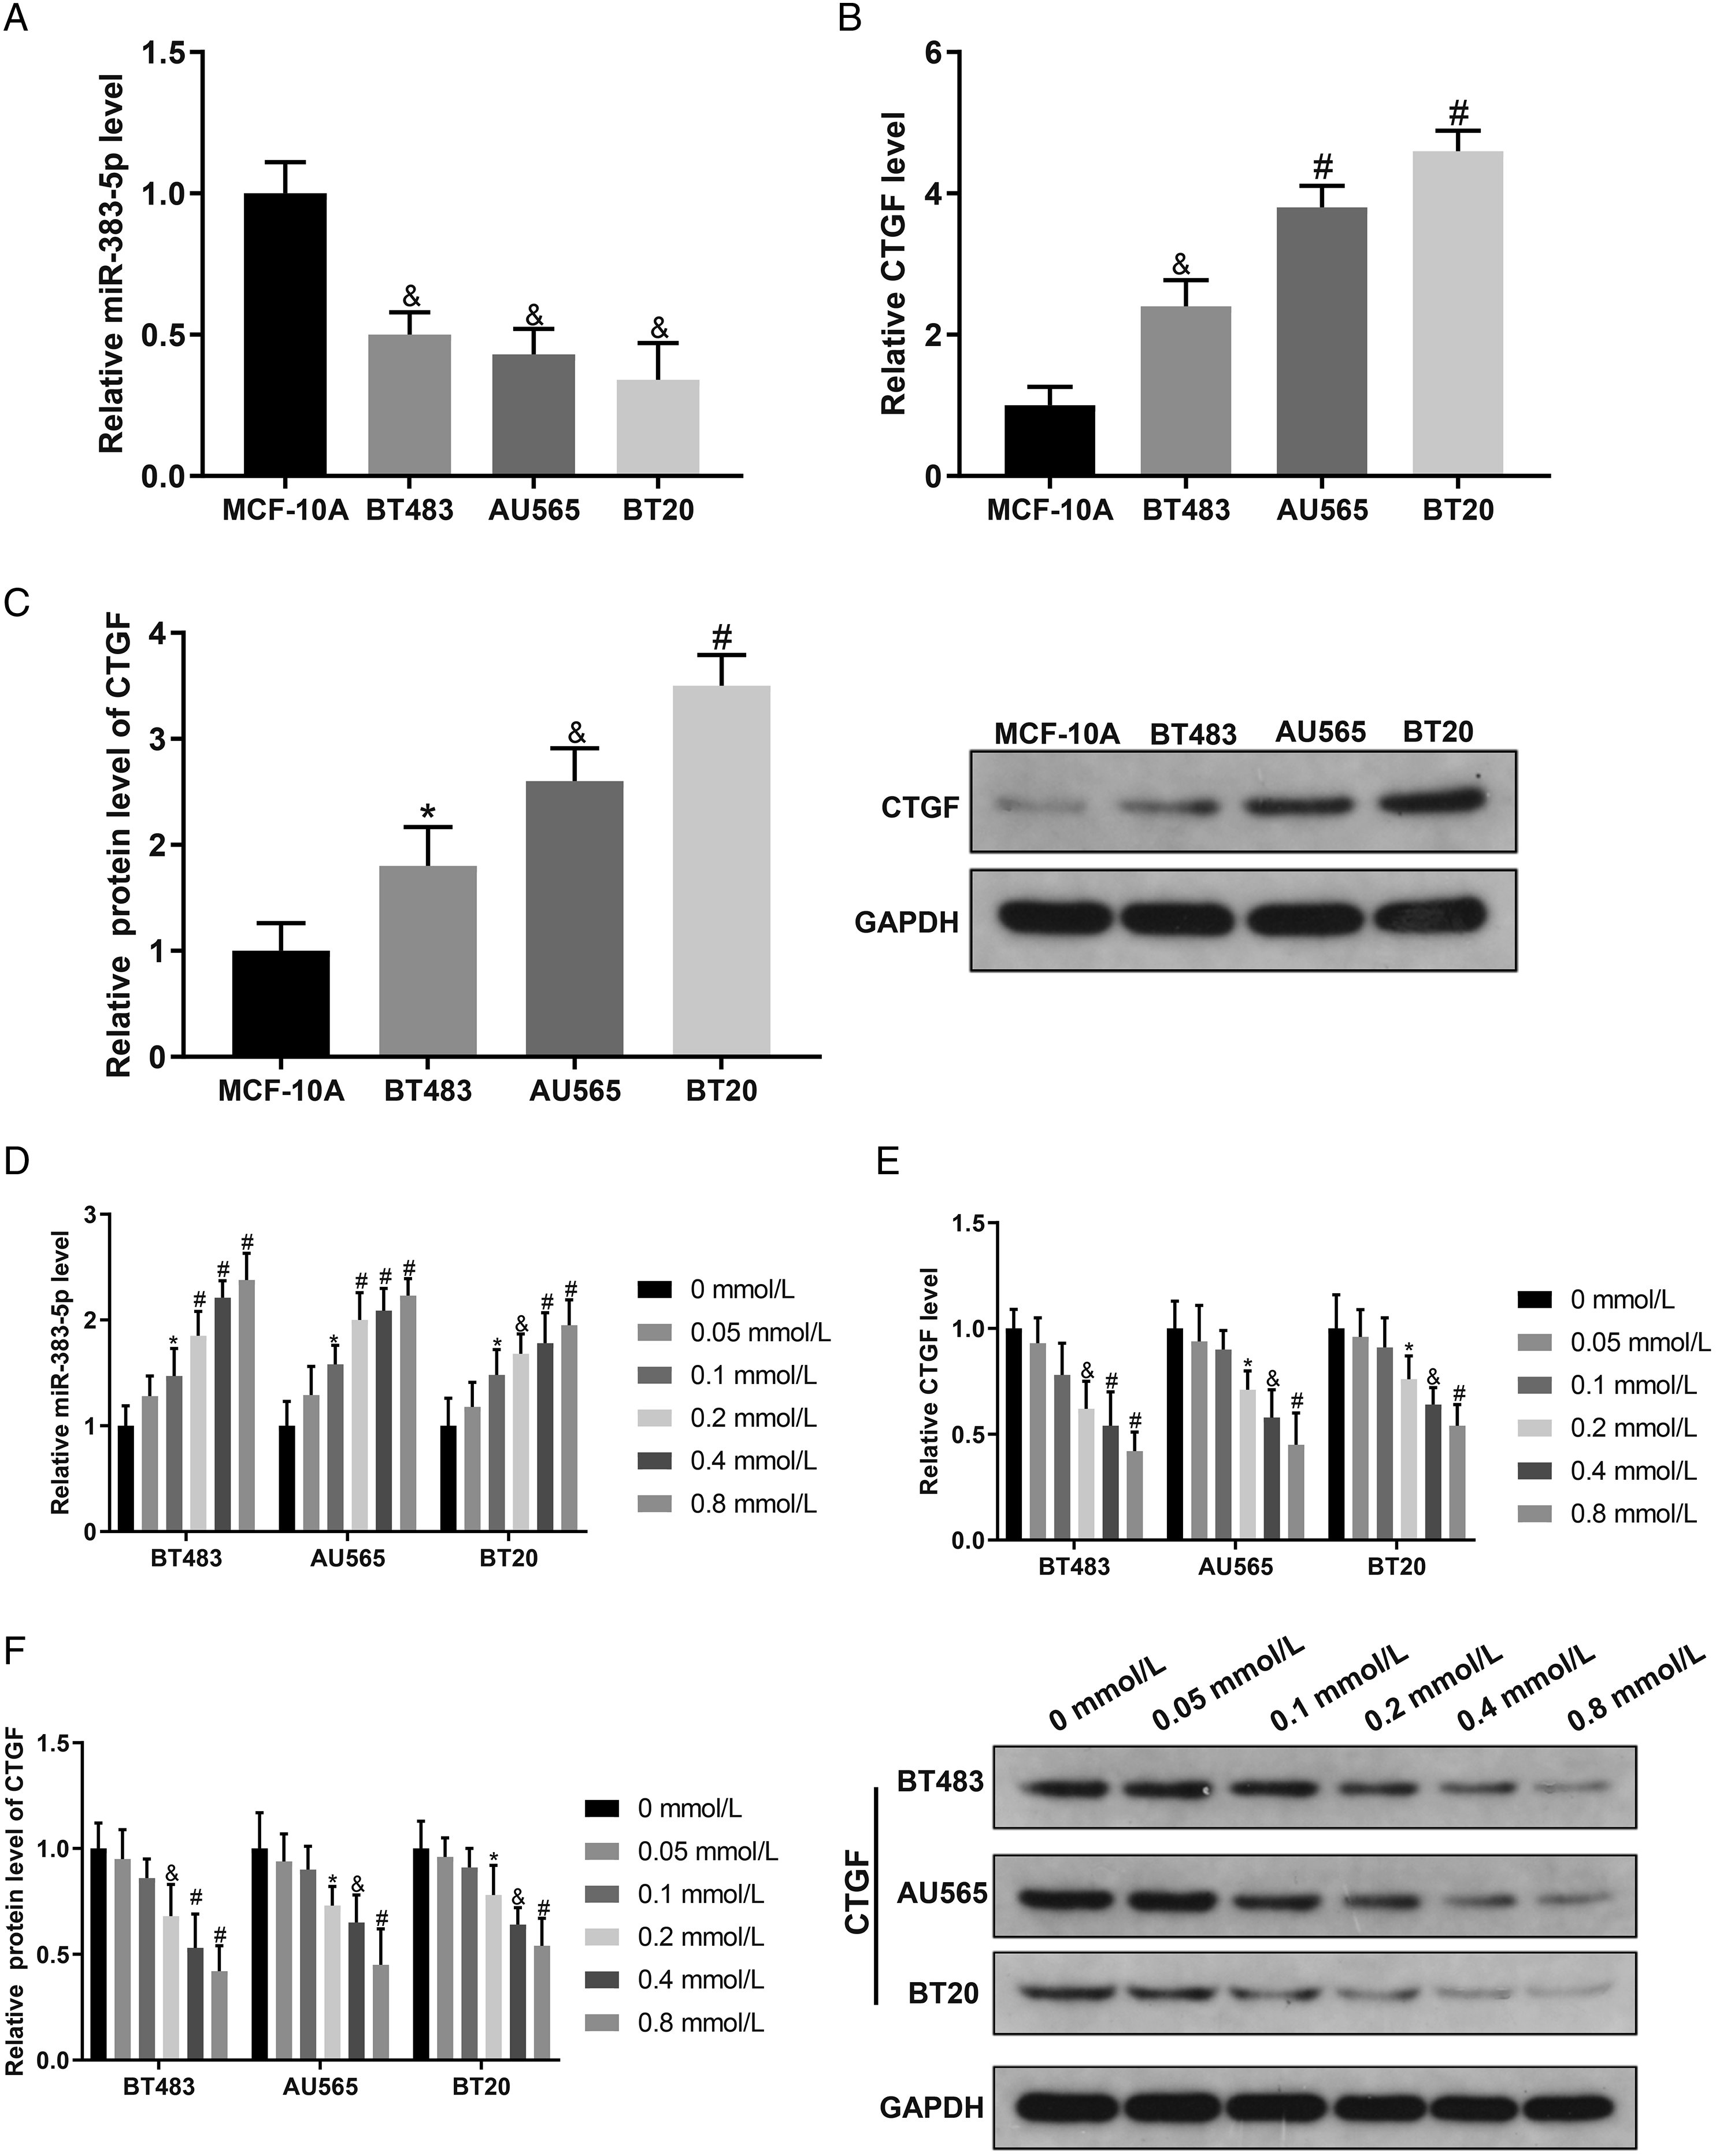
MiR-383-5p Negatively Regulates CTGF Expression
An online software Starbase (http://starbase.sysu.edu.cn/starbase2/index.php) indicated that there was a binding site between miR-383-5p and CTGF (Figure 3A). To further investigate the relationship between miR-383-5p and CTGF, AU565 cells were cultured with 0.2 mmol/L LQ (NC group) and then were transfected with miR-383-5p mimic/inhibitor to up-regulate or inhibit miR-383-5p expression, and the transfection was identified by qRT-PCR. Then, the mRNA and protein expression of CTGF was measured using qRT-PCR and Western blotting. Based on the results, miR-383-5p expression in miR-383-5p mimic group was markedly higher than that in mimic NC group (Figure 3B). miR-383-5p inhibitor group showed lower miR-383-5p expression than that in inhibitor NC group (Figure 3B). However, mRNA and protein expression of CTGF was notably lower in miR-383-5p mimic group and significantly higher in miR-383-5p inhibitor group (Figure 3C and 3D). Dual-luciferase reporter assay was conducted to explore the interaction between miR-383-5p and CTGF. The results uncovered no significant difference in luciferase activity between CTGF-MUT+miR-383-5p mimic and CTGF-MUT+NC mimic groups. However, luciferase activity in CTGF-WT+miR-383-5p mimic group was remarkably lower than that in CTGF-WT+NC mimic group (Figure 3E). These results showed that miR-383-5p negatively regulated CTGF expression. MiR-383-5p negatively regulates CTGF expression. Note: (A) Starbase was used to predict the binding sites between miR-383-5p and CTGF, and the design of mutated binding sites. (B) qRT-PCR was applied to measure miR-383-5p expression. (C) qRT-PCR was performed to assess CTGF mRNA expression. (D) Western blotting was conducted to test CTGF protein expression. (E) Dual-luciferase reporter assay was used to detect the interaction between miR-383-5p and CTGF. Data were presented as mean ± standard deviation. Each experiment was conducted in triplicate. *P < .05, &P < .01, #P < .001. CTGF, connective tissue growth factor.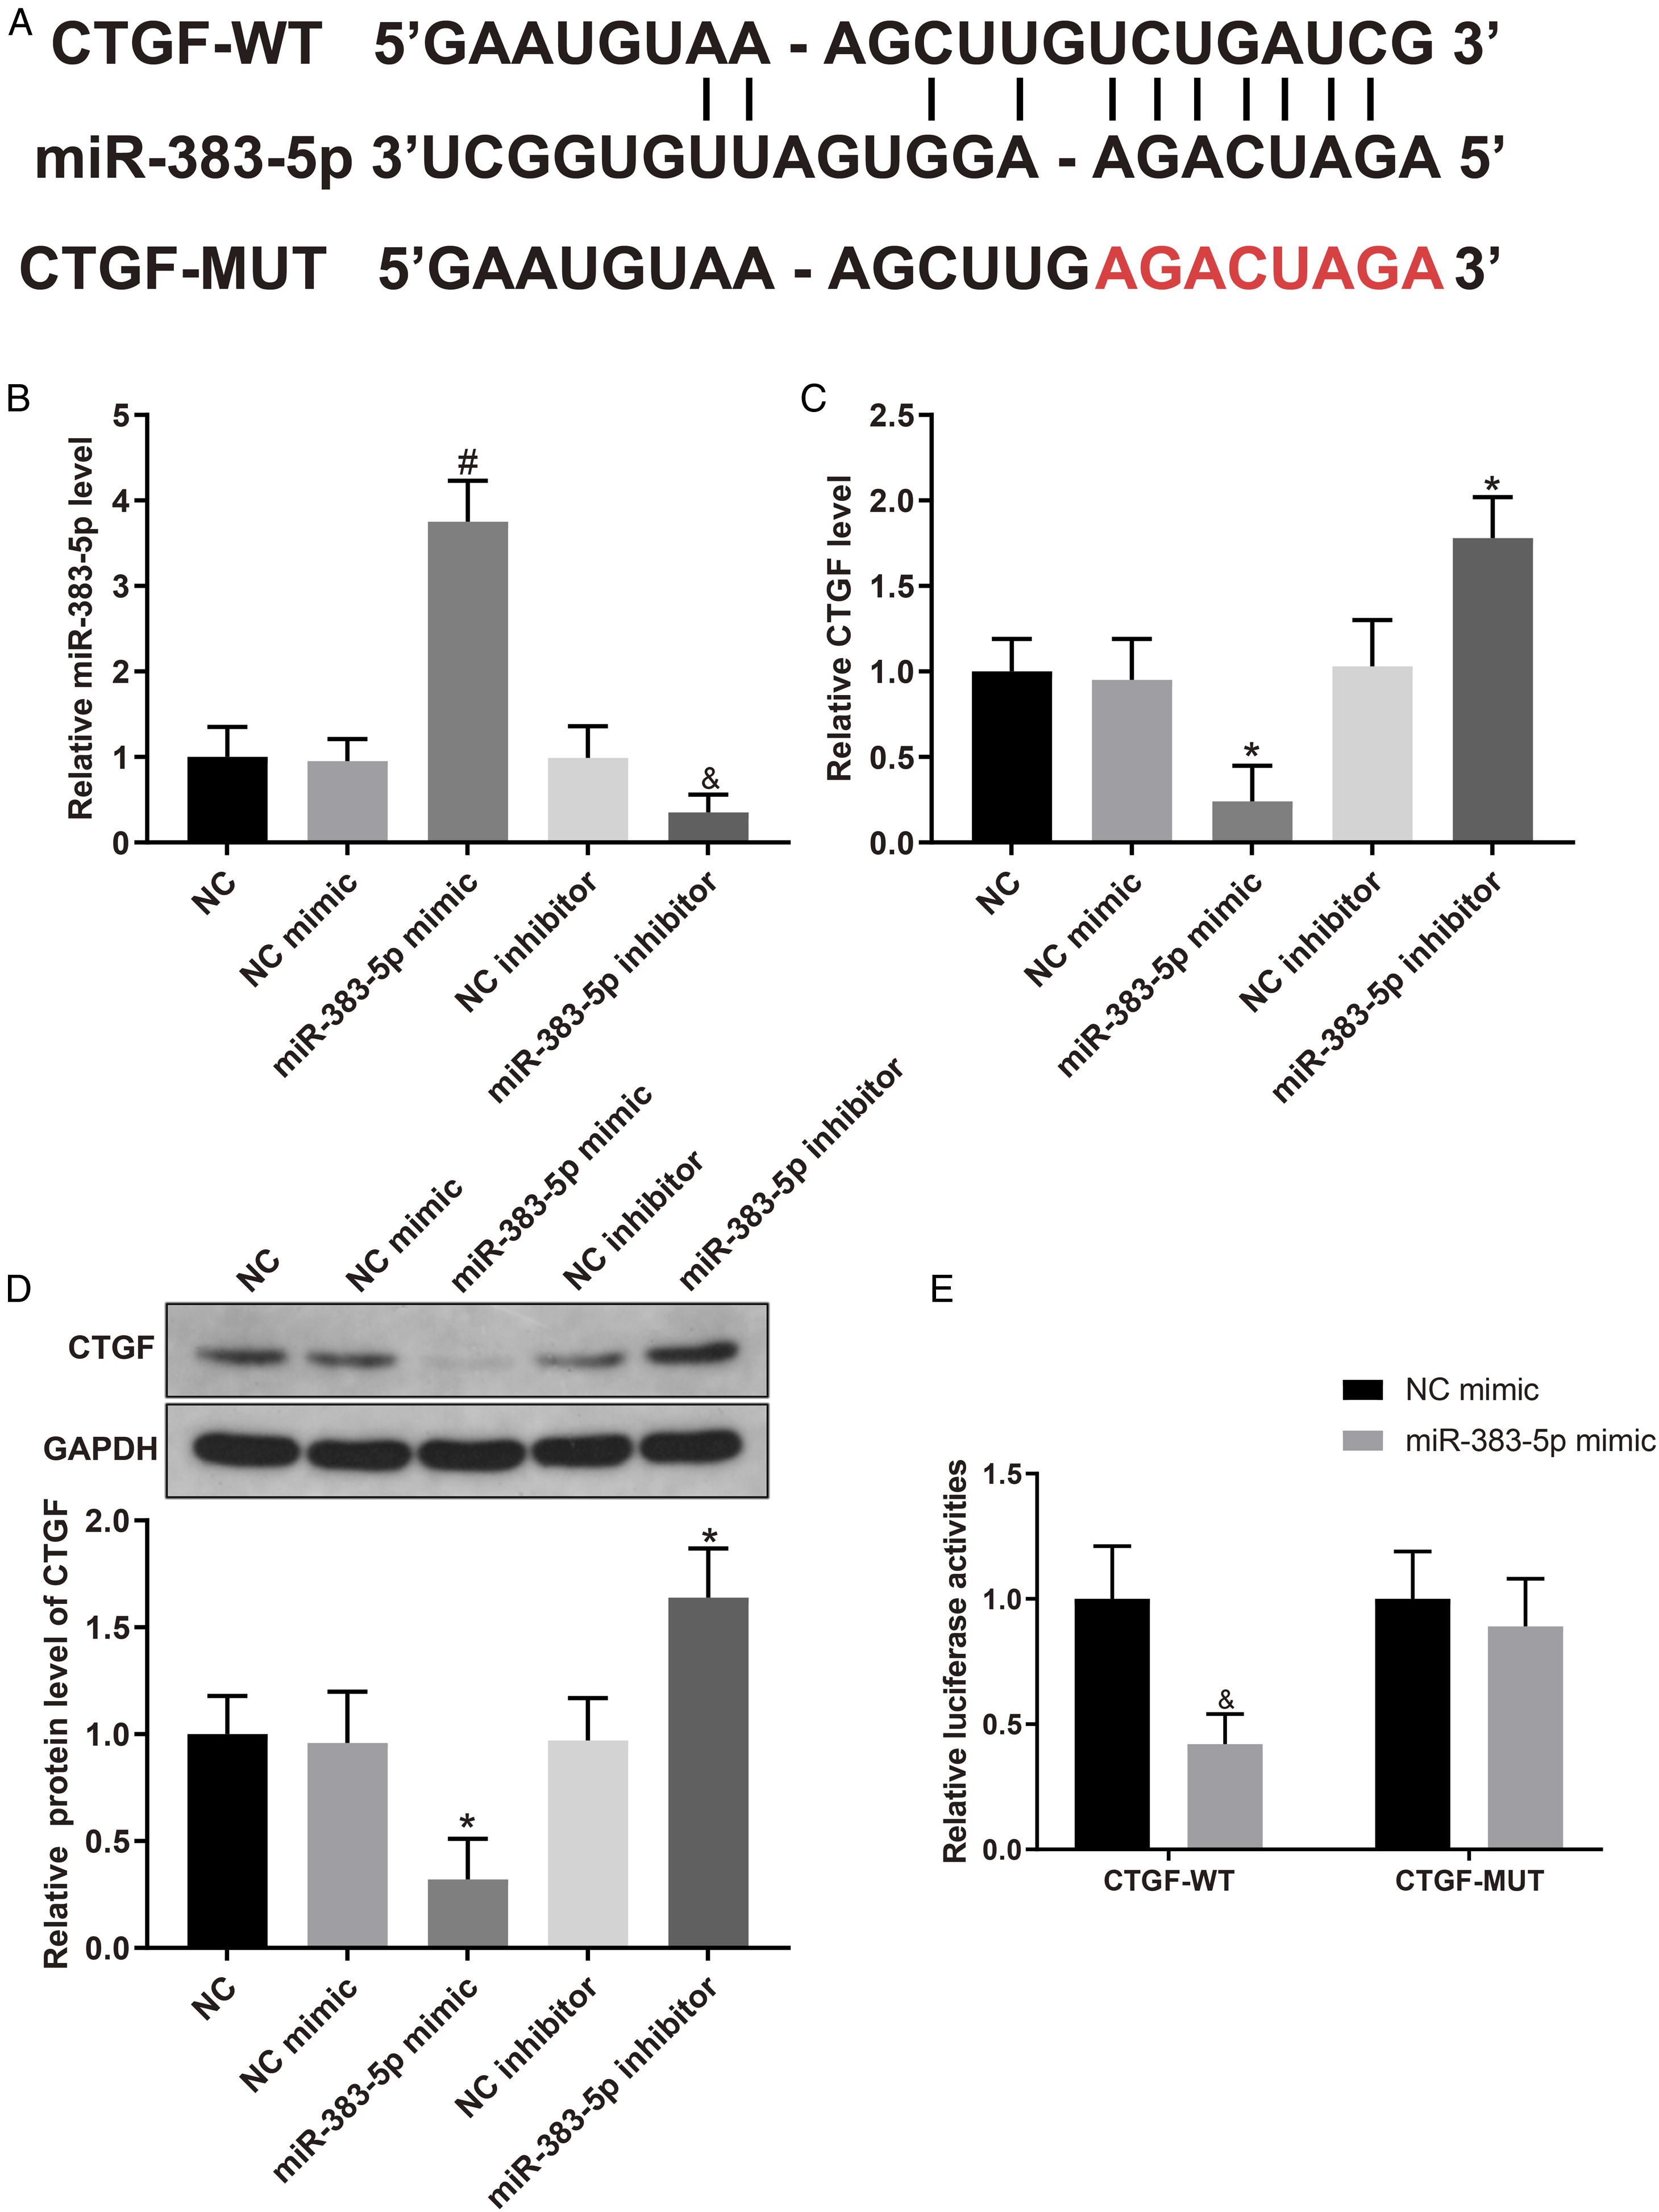
LQ Hinders BC Development Through Inhibiting CTGF by Enhancing miR-383-5p Expression
MiR-383-5p mimic, pcDNA3.1-CTGF, and their NC were transfected into AU565 and BT20 cells (both cultured with 0.2 mmol/L LQ). In AU565 and BT20 cells, miR-383-5p and CTGF expression was measured by qRT-PCR. The malignant properties of AU656 and BT20 cells were evaluated in terms of propagation invasion, migration, and apoptosis to determine the interaction between miR-383-5p and CTGF and their effect on AU565 and BT20 cells. Compared to AU565 and BT20 cells in NC mimic group, miR-383-5p expression was remarkably elevated (Figure 4A) and CTGF expression was significantly reduced (Figure 4B and 4C) in miR-383-5p mimic group. As expected, cell activity (Figure 4D), migration, and invasion (Figure 4E and 4F) were markedly restrained and the apoptosis of AU565 and BT20 cells were remarkably increased (Figure 4G) in miR-383-5p mimic group than those in NC mimic group. MiR-383-5p expression in pcDNA3.1-CTGF group showed no significant difference with that in pcDNA3.1 group (Figure 4A). At the same time, CTGF expression (Figure 4B and 4C), and cell activity (Figure 4D), migration, and invasion (Figure 4E and 4F) were markedly strengthened, while cell apoptosis (Figure 4G) was reduced in pcDNA3.1-CTGF group, compared with pcDNA3.1 group. No significant difference in miR-383-5p and CTGF expression and the malignant behaviors of BC cells was found among NC mimic, pcDNA3.1, and NC groups (Figure 4A-4G). Compared with AU565 and BT20 cells in miR-383-5p mimic group, CTGF expression (Figure 4B and 4C), and cell activity (Figure 4D), migration, and invasion (Figure 4E and 4F) of AU565 and BT20 cells were markedly strengthened, and cell apoptosis (Figure 4G) was reduced in miR-383-5p mimic+pcDNA3.1-CTGF group. It was indicated that CTGF upregulation suppressed the inhibiting effect of miR-383-5p on BC cell development. Taken together, LQ could upregulate miR-383-5p expression to suppress CTGF expression, thereby inhibiting proliferation, migration, and invasion and promoting apoptosis of BC cells. LQ hinders BC development through inhibiting CTGF by enhancing miR-383-5p expression. Note: (A) qRT-PCR was used to detect miR-383-5p expression (B) qRT-PCR was performed to assess CTGF expression. (C) Western blotting was applied to test CTGF protein expression. (D) CCK8 assay was conducted to measure cell activity. (E) Cell scratch test was performed to detect cell migration (F) Transwell assay was conducted to measure cell invasion (G) Flow cytometry was used to detect cell apoptosis. Data were presented as mean ± standard deviation. Each experiment was conducted in triplicate. *P < .05, &P < .01, #P < .001. LQ, liquiritigenin; CTGF, connective tissue growth factor.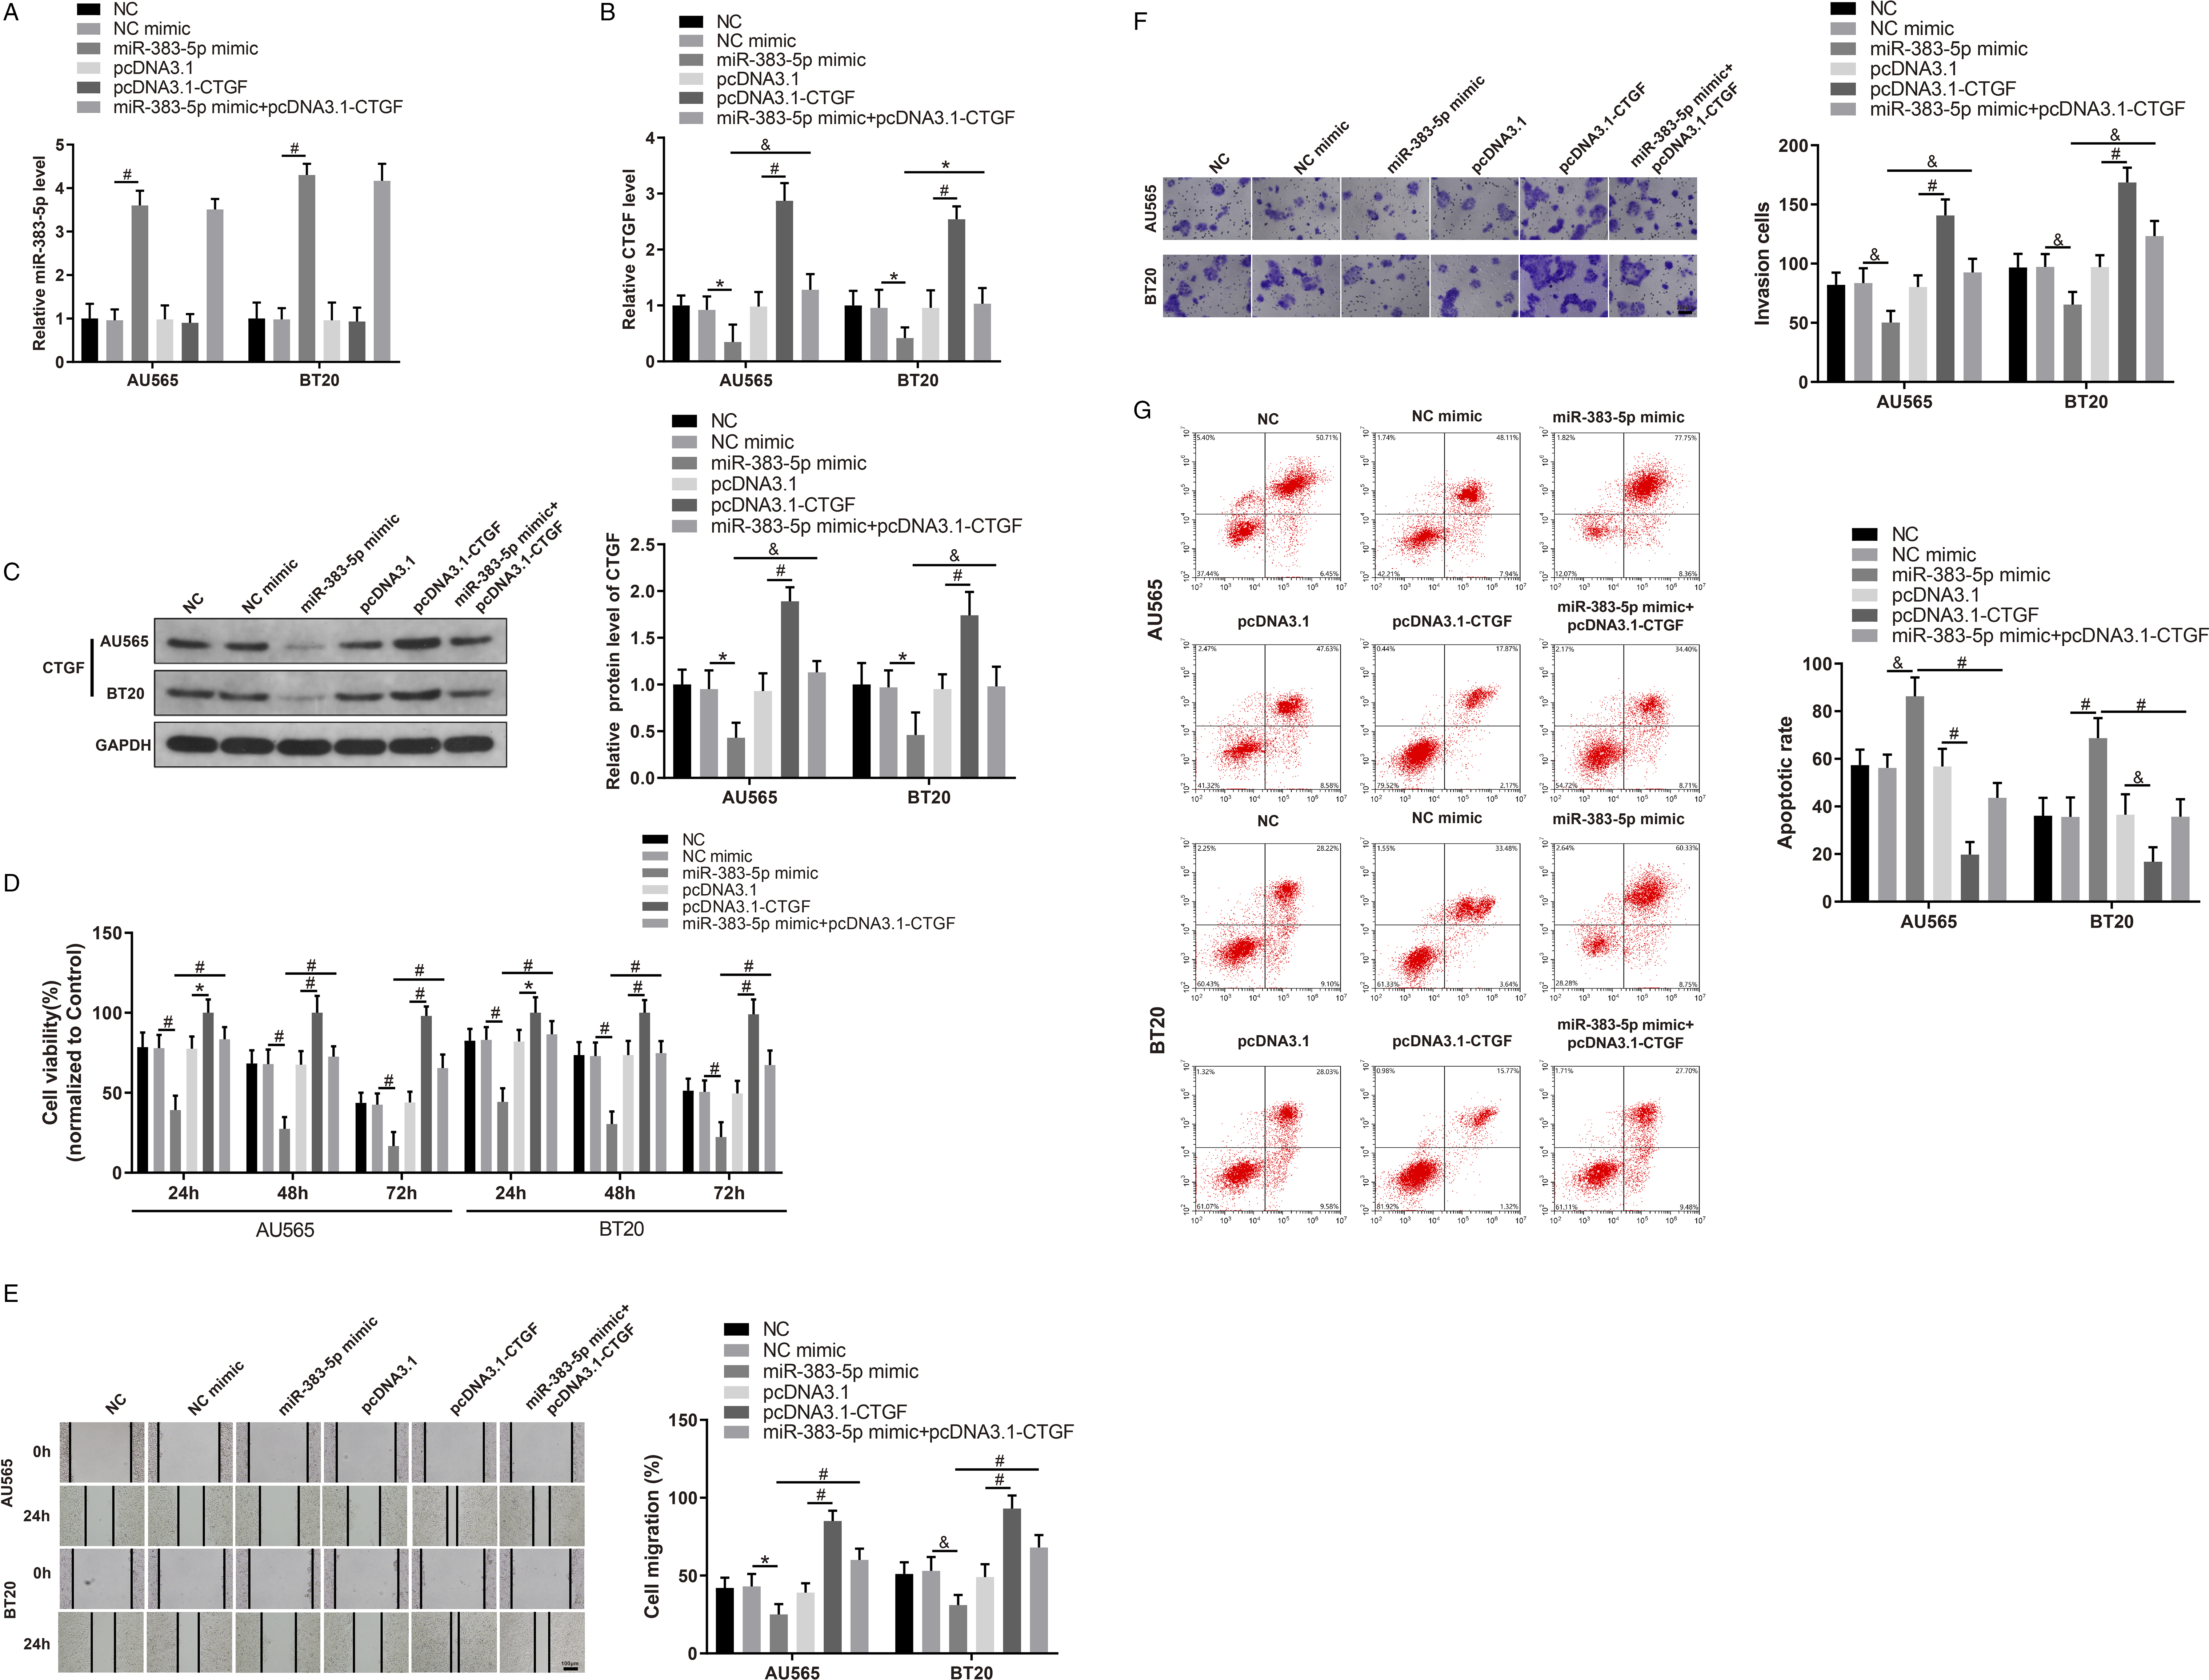
Discussion
Earlier diagnosis and multidisciplinary therapy have improved the prognosis of BC patients, whereas the complete cure of BC is still hindered by the recurrence, metastasis, and drug resistance. 20 In addition, metastasis is regarded as the main reason for the poor prognosis of BC patients. 21 Flavonoids can induce the expression of tumor suppressor genes that may lead to a decline in BC progression and metastasis. 22 As one of the flavonoid compounds, LQ was revealed to inhibit BC cell aggressiveness and enhance cancer cell apoptosis by regulating miR-383-5p and CTGF expression.
LQ significantly suppressed cell proliferation and promoted apoptosis in HeLa cells. 23 LQ exerted remarkable inhibitory effects on colorectal cancer cell proliferation and invasion. 24 Hinsche et al 25 presented that LQ, an ERβ selective estrogen agonist, reduced the invasion of TNBC cell lines. Similarly, this work demonstrated that LQ remarkably inhibited proliferative, migratory, and invasive abilities and increased apoptosis of BC cells. Many investigations thought that LQ acted as an ERβ selective estrogen agonist in BC to suppress cancer development.26,27 For its molecular mechanisms, Liang and colleagues 9 reported that LQ could inhibit tumorigenesis through decreasing DNMT and increasing BRCA1 transcription in TNBC. An increasing body of reports identified that miRNAs could promote or inhibit BC development.28-30 Moreover, considerable evidence suggested that flavonoid compounds, such as xanthomicrol, curcumin, luteolin, glabridin, and baicalein, exerted anti-BC property through regulating miRNA expression.31-35 However, there is a paucity of the miRNAs involved in LQ-induced anti-proliferation, anti-invasion, and anti-migration in BC cells.
Chen et al 36 found miR-383-5p expression was downregulated and miR-383-5p overexpression markedly attenuated the proliferative and invasive properties in human diffuse large B-cell lymphoma cells. MiR-383-5p was significantly downregulated in patients with metastatic BC than those with matched non-metastatic BC. 37 Zhang et al 14 found that miR-383-5p showed significant down-regulation, and overexpression of miR-383-5p suppressed cell proliferative, migratory, and invasive properties in BC cells. Although the interplay between LQ and miRNAs has not been elucidated in BC, Glabridin, component extracted from licorice root, was reported to repress BC development through enhancing miR-148a expression.33,38 Herein, miR-383-5p was found to be decreased in BC cell lines, and it was firstly showed that LQ upregulated miR-383-5p expression in BT483, AU565, and BT20 cells. Moreover, miR-383-5p overexpression in BC cells could enhance the inhibitory effect of LQ on BC cell development.
CTGF was overexpressed in TNBC and neutralization of CTGF decreased the proliferative, migratory, and invasive properties of TNBC cells. 39 In our study, CTGF was highly expressed in BC cells, and LQ downregulated CTGF expression in BC cells. The results of gain-of-function experiment also uncovered that overexpression of CTGF counteracted the suppressive effect of LQ on BC cell progression. In addition, bioinformatics study and dual-luciferase reporter assay showed that CTGF was a target gene of miR-383-5p and inversely regulated by miR-383-5p. Jiang et al found that miR-383-5p up-regulation attenuates proliferative abilities in ovarian cancer cells through targeting TRIM27. 40 Cancerous inhibitor of protein phosphatase 2A was inversely regulated by miR-383-5p, and the restoration of CIP2A expression reversed the suppressive effects on proliferation and the promoting effects on apoptosis of miR-383-5p in lung adenocarcinoma cells. 41 Herein, CTGF downregulation was showed to enhance the inhibitory effect of miR-383-5p on BC progression.
Our study provided evidence that LQ can inhibit CTGF expression by upregulating miR-383-5p, thereby inhibiting proliferation, migration, and invasion and promoting apoptosis of BC cells. This research, however, is subject to limitations. It should be noted that this study has examined only in cellular subjects. Further research works about confirming our findings in animal models of BC are needed. The potential effect of LQ in BC should be further studied to get closer to new therapeutic options for BC treatment in the hope of improvement of survival and quality of life of BC patients.
Footnotes
Author Contributions
Smith, J, Zhang, Z, Liu, L contributed to conception and design, Contributed to acquisition, contributed to analysis and interpretation.
Lin, J contributed to conception, Contributed to acquisitionHu, J contributed to design.
All authors drafted and gave final approval for the manuscript.
Declaration of Conflicting Interests
The author(s) declared no potential conflicts of interest with respect to the research, authorship, and/or publication of this article.
Funding
The author(s) disclosed receipt of the following financial support for the research, authorship, and/or publication of this article: This research was funded by the grants from Key Project of Hunan Province Traditional Chinese Medicine Scientific Research Project (Grant No. 2021009) and Hunan Province Clinical Medical Technology Innovation Guidance Project (Grant No. 2020SK51402).