
Abstract
The aim of this report was to evaluate the morphological and biochemical changes in the liver by the inhalation of vanadium and consumption of sweetened beverages in a subchronic murine model. Forty CD-1 male mice were randomly divided into four groups: control, vanadium (V), sucrose 30% (S), and vanadium–sucrose (V + S). V was inhaled (1.4 mg/m3) for 1h, twice/week; 30% sucrose solution was given orally ad libitum. Blood samples were obtained for AST, ALT, and LDH determination. Liver samples were processed for histological and oxidative stress immunohistochemical evaluation with 4-hydroxynonenal at weeks 4 and 8 of exposure. Regarding liver function tests, a statistically significant increase (P < 0.05) was observed in groups V, S, and V + S at weeks 4 and 8 compared to the control group. A greater number of hepatocytes with meganuclei and binuclei were observed in V and V + S at week 8 compared to the other groups. Steatosis and regenerative changes were more extensive in the eighth week V + S group. 4-Hydroxynonenal immunoreactivity increased in the V + S group at both exposure times compared to the other groups; however, the increment was more evident in the V + S group at week 4 compared to the V + S group at week 8. An increase in De Ritis ratio (>1) was noticed in experimental groups at weeks 4 and 8. Findings demonstrate that in the liver, V, S, and V + S induced oxidative stress and regenerative changes that increased with the length of exposure. Results support possible potentiation of liver damage in areas with high air pollution and high-sweetened beverage consumption.
Introduction
Air pollution is a worldwide health problem. It consist of a mixture of gases, including volatile organic compounds (VOCs) and particulate matter (PM). On the surface of PM a variety of toxic agents are attached, which are capable of crossing the air-blood barrier in the lungs and reaching various organs in the human body including the liver. 1
The liver is involved in glucose homeostasis in response to pancreatic hormones and is also the site of biotransformation and detoxification of drugs and xenobiotics. During the biotransformation of a variety of xenobiotics, the liver produces a great amount of reactive oxygen and nitrogen species which in normal conditions are inactivated by antioxidant defenses. 2
Vanadium is a transition element adhered to PM that increases in the atmosphere as a consequence of fossil fuel combustion. 3 Its inhalation induces liver damage with regenerative changes. 4 Besides the bones, the liver is one of the organs where V accumulates. 5 The production of reactive oxygen species (ROS) is one of the V toxic mechanisms by the activation of the mitogen-activated protein kinase (MAPK) that will result in the downstream ERK1/2 phosphorylation, with the activation of diverse signaling pathways. 6 In addition, V has a hypoglycemic effect because of its insulin-mimetic action as the result of its inhibition of the protein tyrosine phosphatases. 7
The consumption of sweetened beverages has become a public concern because of the adverse health consequences, such as obesity, cardiovascular diseases, and tooth decay. Also, it has been associated with non-alcoholic fatty liver disease (NAFLD). 8
The liver damage resulting from the consumption of sweetened beverages and V inhalation has been reported separately; however, the effect in the liver if both V and sweetened beverages administered together has not been explored. Therefore, the objective of this study is to report the morphological and biochemical changes in the liver of the co-administration of inhaled V and sweetened beverage ingestion.
Materials and Methods
Animals
Forty CD-1 male mice weighing 35 ± 2 g obtained from the vivarium of the Faculty of Medicine of the National Autonomous University of Mexico (UNAM). All mice were kept in plastic boxes under controlled light/dark conditions (12:12 h) and had access to Purina® rodent laboratory chow and water ad libitum. Mice were randomly distributed into four groups of 10 mice each. Half of each group (five mice) was sacrificed on the fourth week and the other half (five mice) on the eighth week after the exposure.
The experimental protocol was carried out in accordance with the Guidelines for the Care and Use of Laboratory Animals (Resource Commission on Life Sciences National Research Council, 2010) and the official Mexican standard NOM 06-200-1999 for the production, care and use of laboratory animals. This project was approved by the Ethics and Research Commissions of the Faculty of Medicine, UNAM (#100/2014).
Experimental Groups and Treatments
Group I, the control group, inhaled only the vehicle: saline (sodium chloride [NaCl] 0.9%) for 1 h twice a week. Group II, sucrose group (S), inhaled the vehicle with free access to water with 30% sucrose. Group III, vanadium (V2O5), inhaled AQ5 (0.02M) (Sigma, St Louis, Missouri) for 1 hour twice a week during 4 and 8 weeks, and group IV, vanadium plus sucrose (V+S), inhaled vanadium and had free access to sweetened water with 30% sucrose during the same period of time. Inhalation was performed according to the parameters described by Fortoul et al. (2011). 6 Measurements were made in all groups on the fourth and eighth weeks.
The sucrose solution was prepared daily with tap water. Water consumption per day was measured in all mice of each group. This protocol was selected knowing that the half-life of V is approximately 48 hours (Cooper, 2007). 9 The vehicle or the vanadium solution was introduced into the box through a Yuehua WH 2000® nebulizer which, according to the manufacturer’s information manual, indicates that 80% of the nebulized particles have an aerodynamic diameter that ranges from 1 to 5.0 µm.
Vanadium Concentration in the Chamber
A filter was placed at the outlet of the ultra-nebulizer during inhalation, with a constant flow rate of 10 L/min. The filters were then removed and weighed after each inhalation; vanadium was quantified by evaluating eight filters for each inhalation using a graphite furnace Atomic Absorption Spectrometer (Perkin Elmer Mod. 2380, Shelton, Connecticut). The light source was provided with a hollow cathode lamp. The accuracy of the measurements was confirmed through three random determinations of seven different standard solutions, prepared with the same chemical reagent used during the metal analysis. For V, the wavelength was 318.4 nm, the detection limit was 0.37 ppm, and the pore was 0.7 nm. Each sample was analyzed in triplicate.
Histological Tissue Procurement and Evaluation
At weeks 4 and 8 after the initiation of exposures, mice (n = 10/group) were anesthetized by intraperitoneal injection with an aqueous solution of sodium phenobarbital at 0.3 mg/mL (Pisa, Agropecuaria, SA de CV, Mexico, 35 mg/kg body weight), perfused through the aorta with saline solution, followed by 4% (pH 7.4) paraformaldehyde buffered with phosphate. The liver was obtained and processed for light microscopy. Tissue sections were embedded in paraffin and stained with hematoxylin and eosin (H&E). In the histological evaluation, the presence or absence of edema, inflammatory infiltrate, size, and the number of nuclei were evaluated. One slide per mouse was prepared, and three mice from each group were selected for being analyzed. Five random fields per slide were reviewed at 40X, counting 75 nuclei per group. Two blinded observers evaluated the tissue slides.
The analysis was performed in an Olympus BX51 microscope (Olympus America, Mexico City) attached to a digital camera (Evolution MP Color, Media Cybernetics, Rockville, Maryland, USA). The photomicrographs were taken at 40X. Measurements were made with Image J software (NIH, Bethesda, Maryland, USA).
Determination of Liver Function Tests (ALT, AST, and LDH)
After anesthesia but before perfusion, blood samples were obtained by cardiac puncture and processed in a clinical centrifuge at 3000 rpm for 8 minutes at room temperature. The serum was separated, and each enzyme was analyzed in an automated LX20 Mark system (Automate Sample Processing Systems, Beckman Coulter Inc., Fullerton, CA, USA). Concentrations of alanine aminotransferase (ALT) IU/L, aspartate aminotransferase (AST) IU/L, and lactic dehydrogenase LDH IU/L were determined. De Ritis ratio (AST/ALT) was also calculated. 10
Immunohistochemical Determination of 4-Hydroxynonenal (4-HNE)
Tissue sections were dewaxed and washed in distilled water. Antigenic retrieval was obtained by incubation in Declere 10% (Cell Marque; Sigma, Rocklin, California, USA) at 15 psi for 3 min. Then, the slides were washed in phosphate-buffered saline (PBS) with Triton-albumin (10%) in a humidified chamber. Endogenous peroxidase was inhibited with 3% hydrogen peroxide (JT Baker, Phillipsburg, New Jersey, USA) for 40 minutes and washed with PBS Triton (Sigma) for 5 min and then with 10% Triton PBS-albumin for 10 min. The slides were incubated at 37°C for 1 h in the presence of anti-4-HNE monoclonal antibody in a 1:1000 dilution (R&D Systems, Minneapolis, Minnesota). Afterward, the slides were washed for 5 more minutes in PBS and Triton; the fourth wash was performed with Triton PBS-albumin. Then, the samples were incubated with the secondary antibody (Santa Cruz Biotechnology, Santa Cruz, California, USA) at a 1:400 dilution at 37°C for 30 min. Afterward, three five-minute washes were performed with Triton-PBS. The samples were incubated at 37°C for 30 min with Triton-PBS. The samples were incubated with 50 µL of hydrogen peroxide for 30 min with streptavidin-HRP complex (Dako). Three more washes were performed with Triton-PBS for 5 min each. The samples were treated with 50 µL of hydrogen peroxide and 3,3-diaminobenzidine (DAB, Santa Cruz Biotechnology) to reveal the reaction. Then, the sections were counter stained with hematoxylin and mounted in resin for its further analysis with a bright-field microscope. Slides lacking the primary antibody were included as negative controls.
Image Processing and Densitometric Analysis
The Olympus microscope (model BH2-RFCA) and a digital camera of the same brand were used. The images were processed with Adobe Photoshop CC software. The processing involved adjusting the brightness and contrast and changing the background to white. The immunohistochemical photomicrographs were processed and separated into three-color channels for the analysis of the density of the mark obtained with the immunohistochemistry technique; only the yellow channel was used to analyze the density with the DensiFe program developed at MathLab. Five fields (0.058 μm2 each) from each sample were randomly chosen with the 40X objective. 11
Statistical Analysis
Data were analyzed with GraphPad Prism® (V 6.0) (GraphPad Software Inc., La Jolla, CA, USA). Differences between groups were identified by one-way analysis of variance (ANOVA) followed by Tukey’s post hoc test. Data were expressed as mean ± standard deviation. Statistical significance was set at P < 0.05.
Results
Concentration of Vanadium in the Chamber
The concentration of vanadium in the chamber was 1436 μg/m3 during the entire exposure. This concentration is higher than those reported by the International Agency for Research on Cancer (IARC) in workplaces (0.2 to 0.5 mg/m3) but is in the range of those mentioned by the World Health Organization (WHO) (0.01–60 mg/m3).12,13
Water Consumption
The average water consumption per mouse/day per cage in the experimental groups was as follows: control group 4.1 mL per mouse/day, V group 10 mL per mouse/day, sucrose group 5.4 mL per mouse/day, and the group of both sucrose and vanadium consumed 6.4 mL per mouse/day. Control and V groups did not have sucrose in their water supply. 11
Liver Function Tests
LFT in Serum of Mice Exposed to V, S, and V + S.
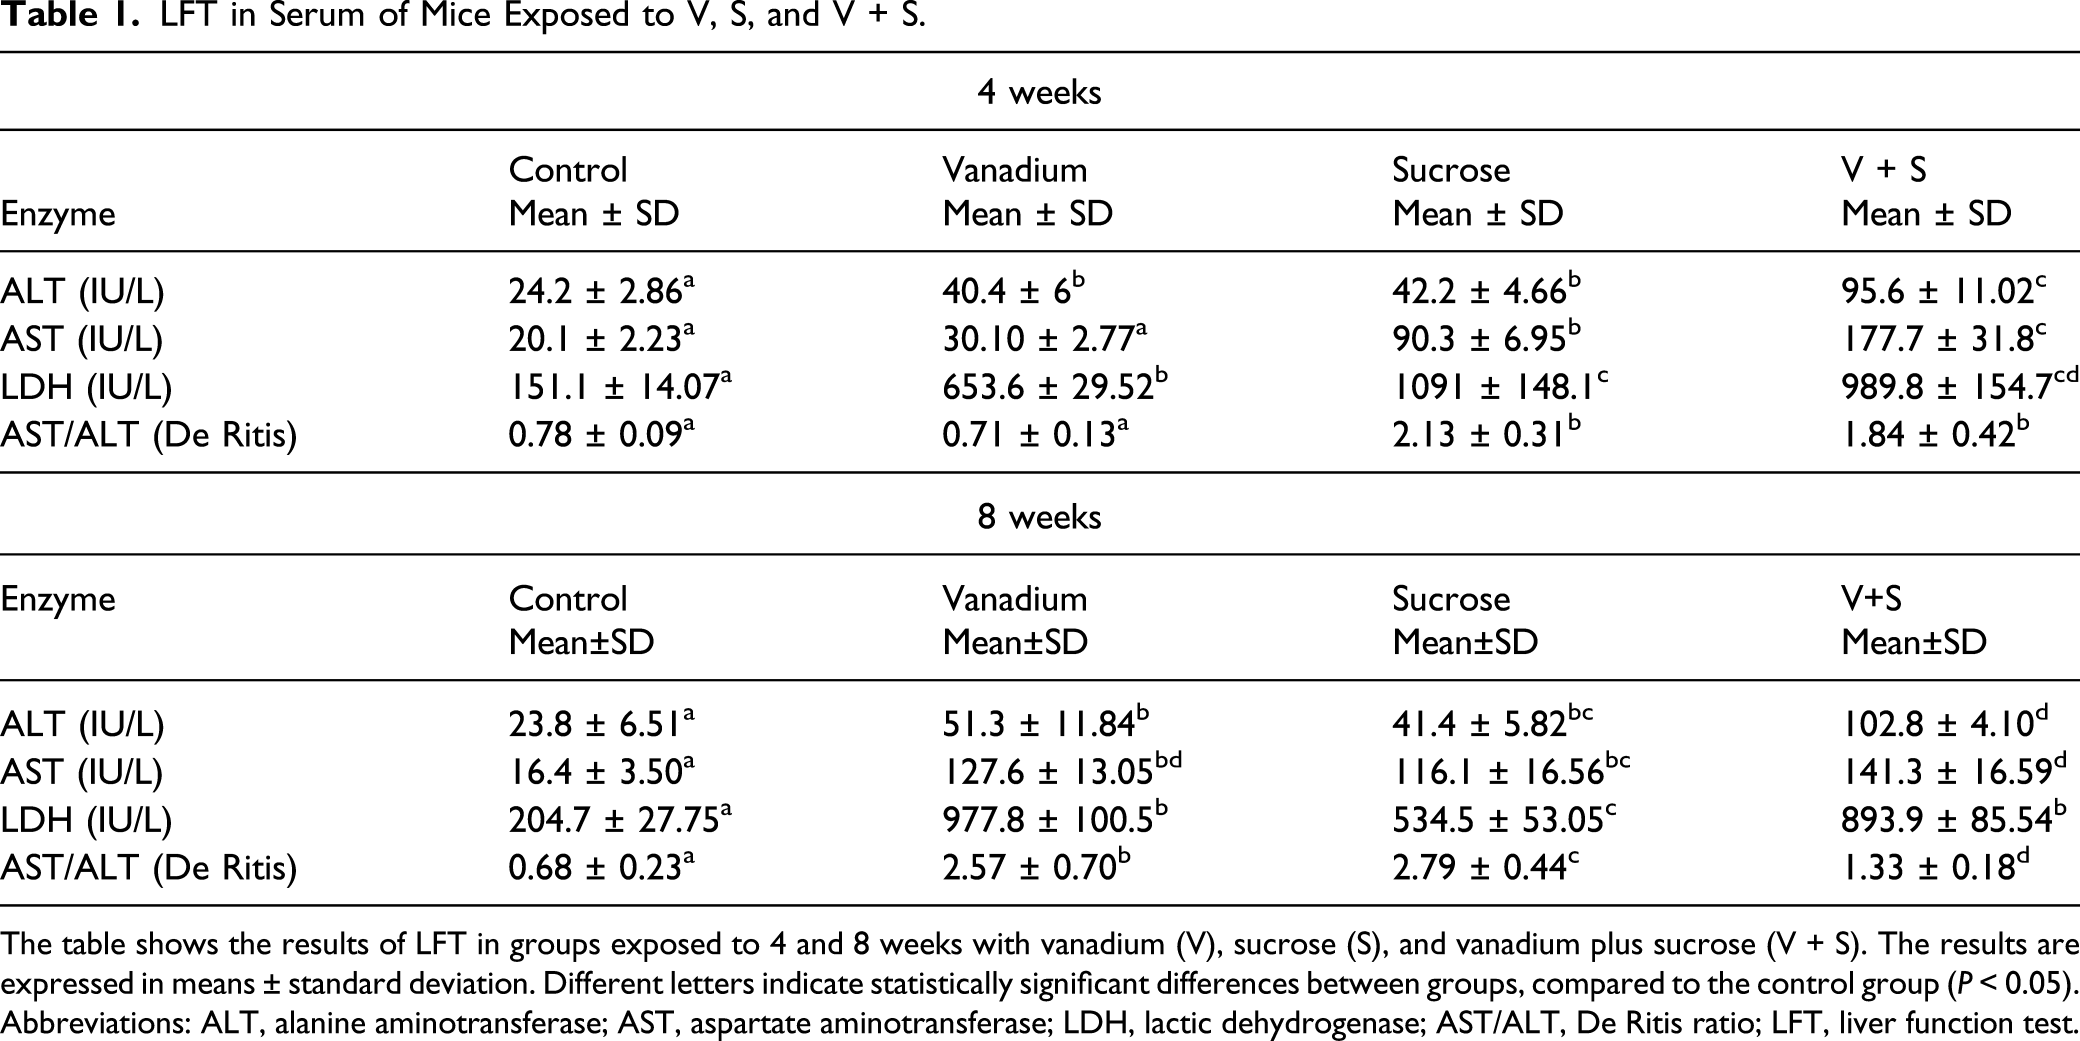
The table shows the results of LFT in groups exposed to 4 and 8 weeks with vanadium (V), sucrose (S), and vanadium plus sucrose (V + S). The results are expressed in means ± standard deviation. Different letters indicate statistically significant differences between groups, compared to the control group (P < 0.05).
Abbreviations: ALT, alanine aminotransferase; AST, aspartate aminotransferase; LDH, lactic dehydrogenase; AST/ALT, De Ritis ratio; LFT, liver function test.
Histopathological Results
Histological changes observed in the liver of mice in groups C, V, S, and V + S are shown in Figure 1. Steatosis was observed mainly in group V + S at weeks 4 and 8. No inflammation or fibrosis was observed. The normal range for the hepatocyte nucleus was 5 to 10 µm.
14
Histological changes in the liver at weeks 4 and 8 in the control and experimental groups. (a) 4-week control; (b) 8-week control; (c) 4-week V; (d) 8-week V; (e) 4-week sucrose; (f) 8-week sucrose; (g) 4-week V+S; (h) 8-week V + S. In the V + S group (4 and 8 weeks), a more severe steatosis was observed. (Bar 20 μm).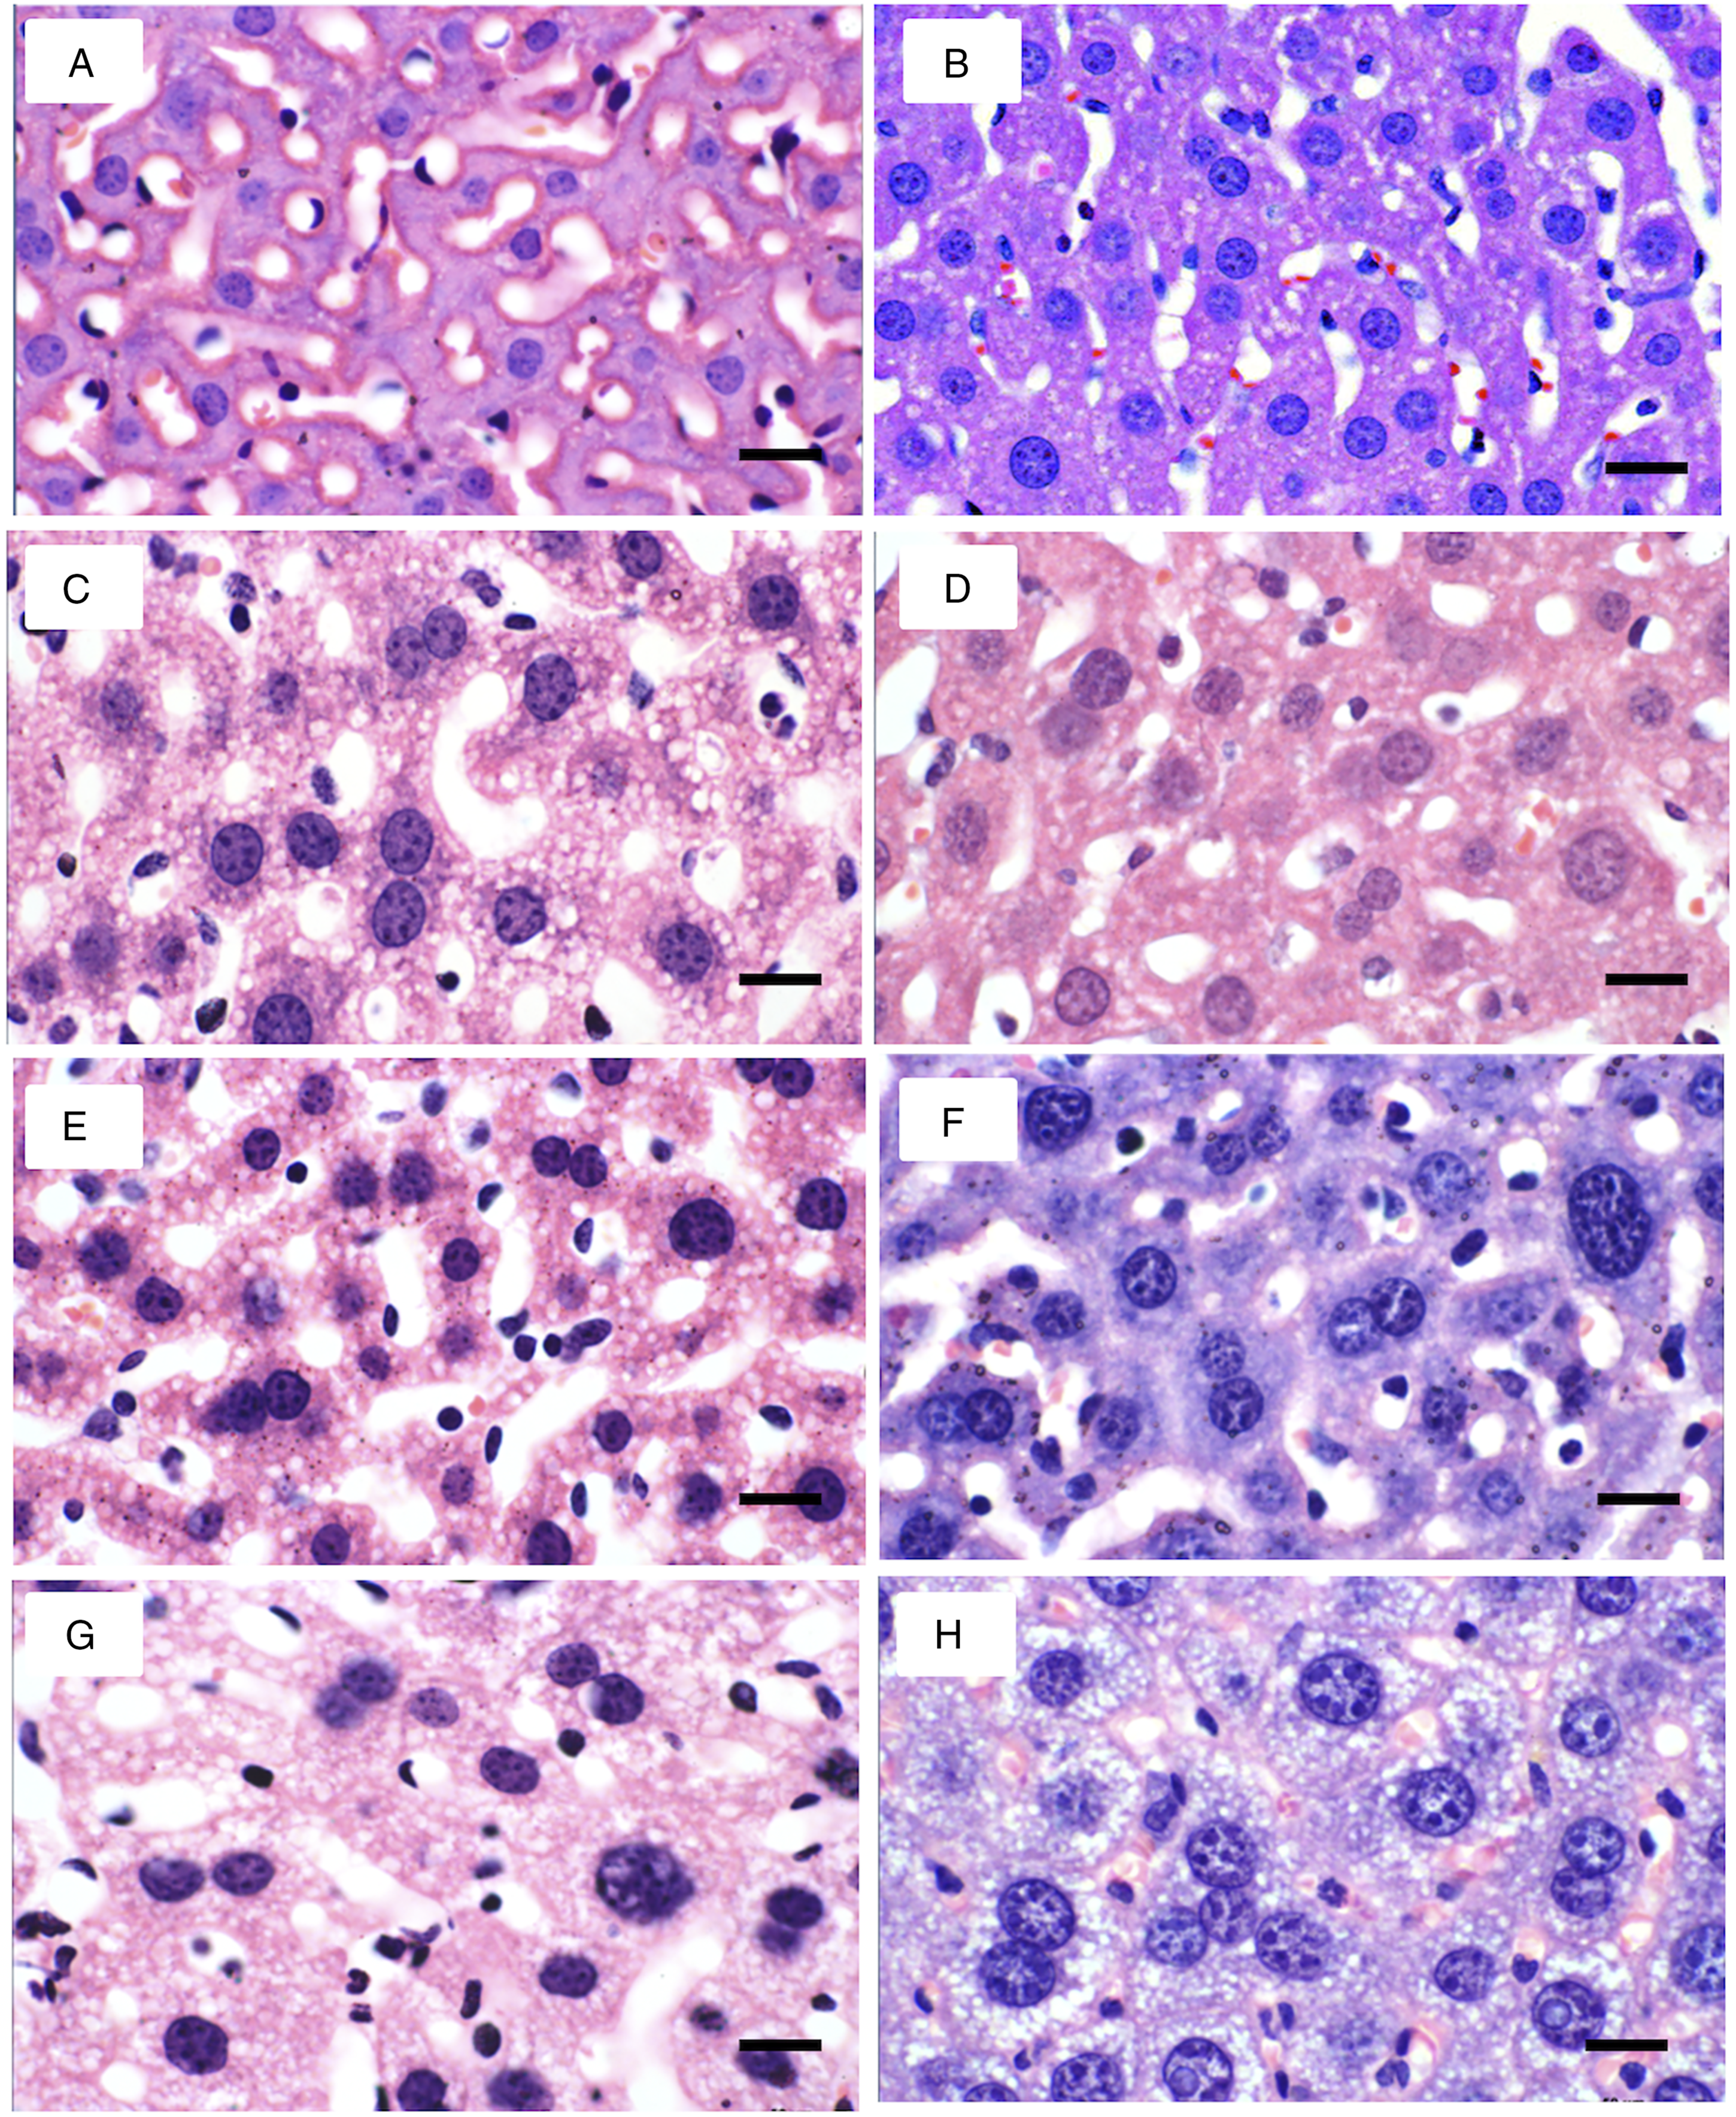
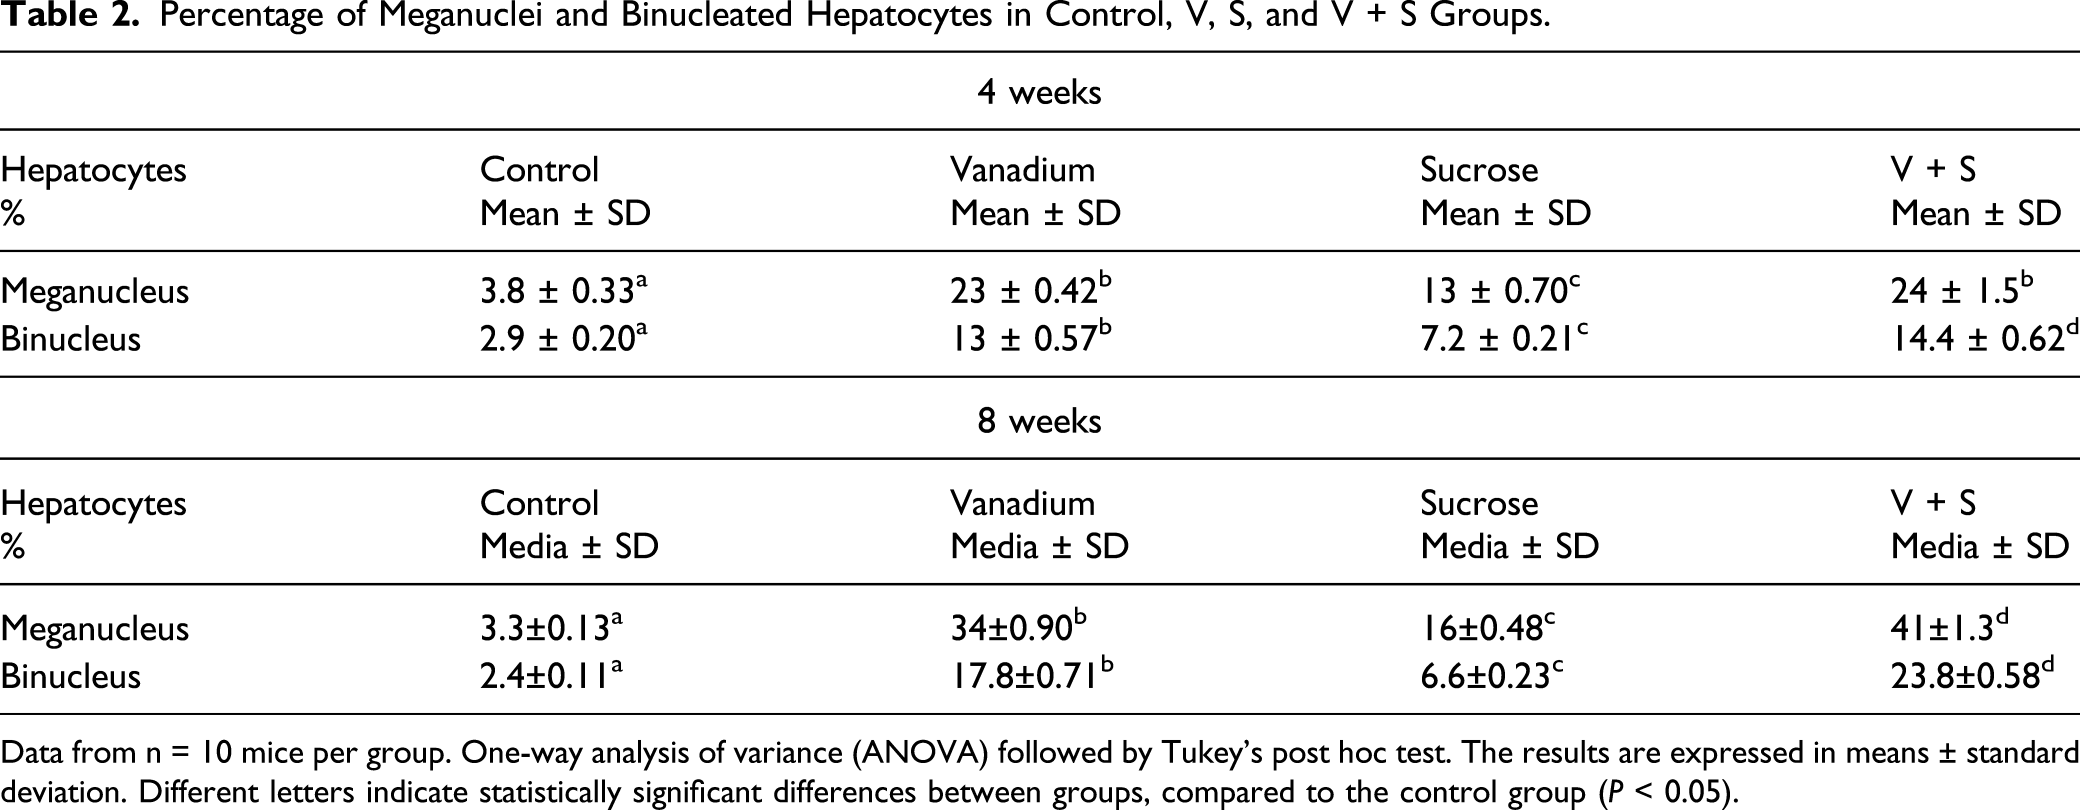
In the exposed groups (V, S, and V + S), regenerative changes were found, evidenced by the presence of binucleated, trinucleated, and meganucleated cells (Figure 2). Nuclei were considered meganuclei when the diameter ranged between 15 and 20 μm. Statistically significant differences (P < 0.05) were found between groups at weeks 4 and 8, both in binucleated hepatocytes and in meganucleated hepatocytes; values are shown in Table 2. An increase in the number of binucleated and meganucleated cells was also observed between exposure times (weeks 4 and 8) in treated groups (V, S, and V + S), but not in controls. Differences in the hepatocytes nuclear size and number. (a) 8-week control, (b) 8-week V+S group where hepatocytes with meganuclei and binuclei are observed Thick arrows point to hepatocytes with meganuclei, and thin arrows point to binucleates hepatocytes. (Bar 20 μm). Percentage of Meganuclei and Binucleated Hepatocytes in Control, V, S, and V + S Groups. Data from n = 10 mice per group. One-way analysis of variance (ANOVA) followed by Tukey’s post hoc test. The results are expressed in means ± standard deviation. Different letters indicate statistically significant differences between groups, compared to the control group (P < 0.05).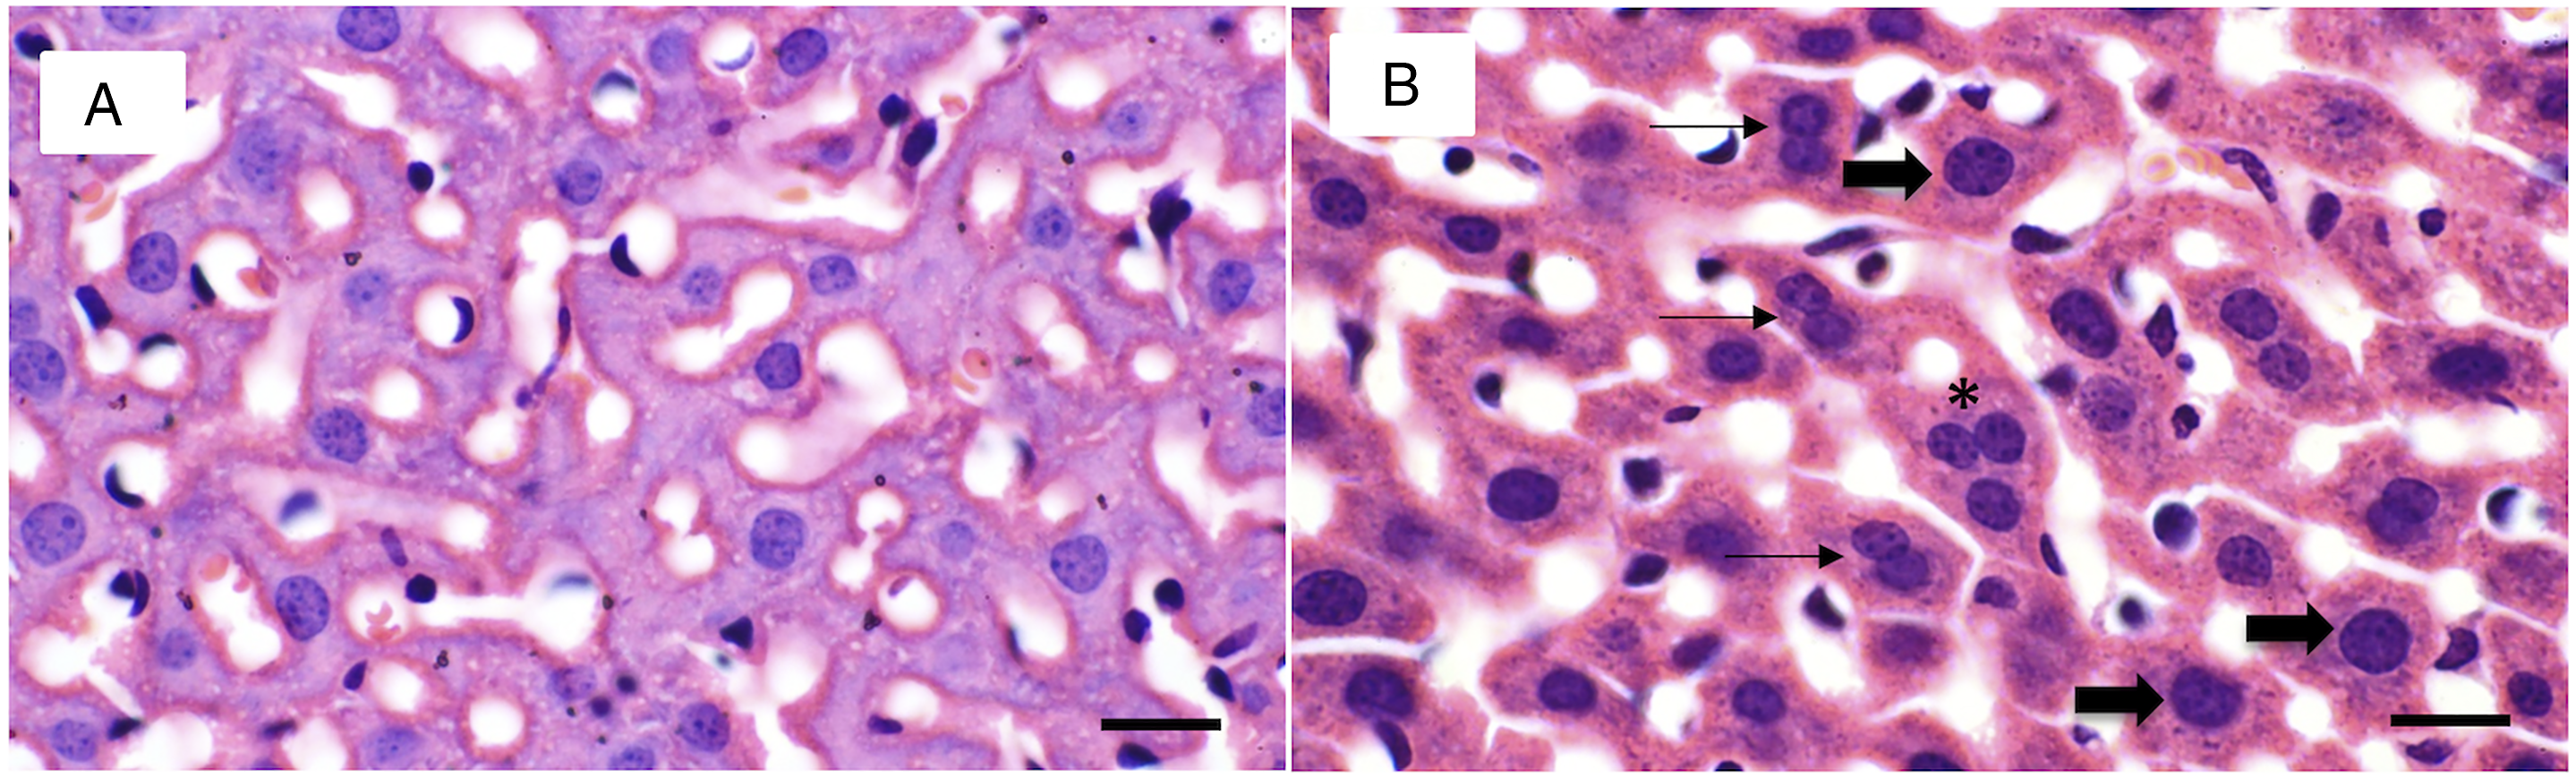
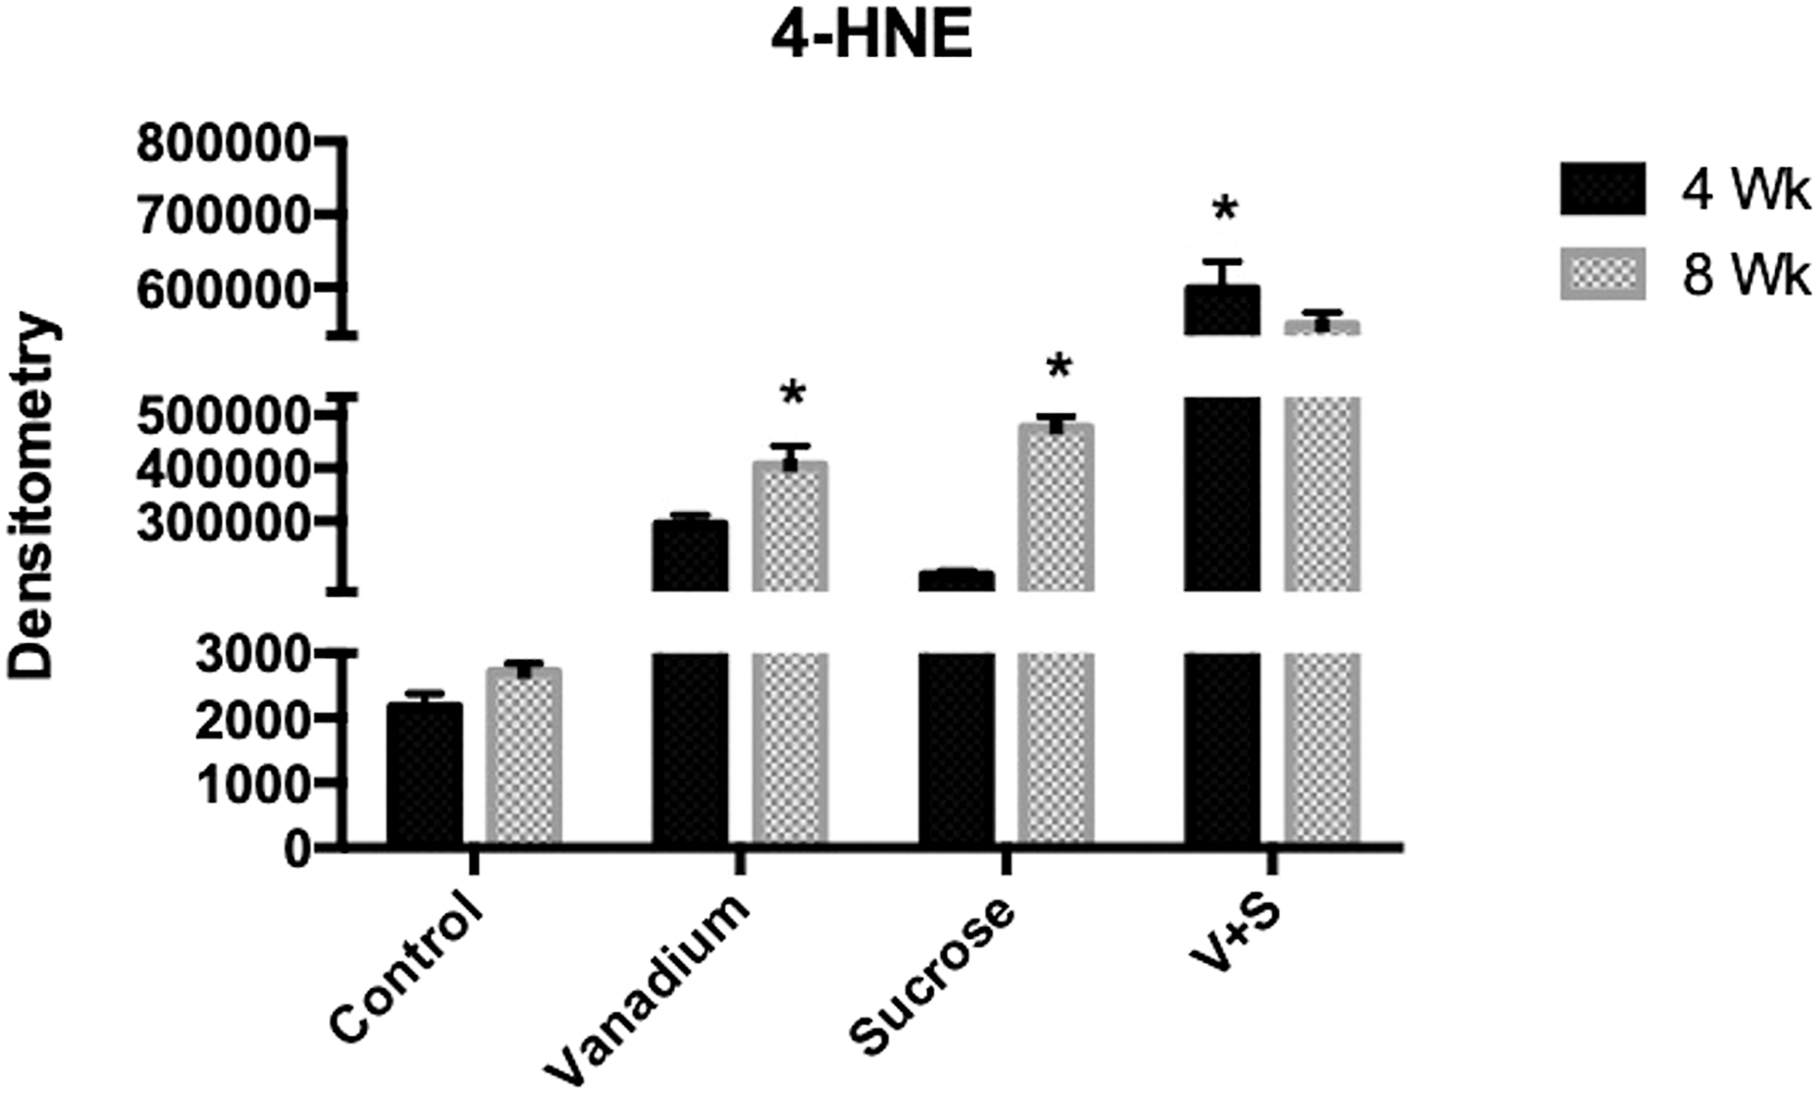
Immunohistochemistry for 4-HNE
Using the immunohistochemistry technique for 4-HNE, the mark (an ochre color due to diaminobenzidine reaction) was observed in groups V, S, and V + S at 4 and 8 weeks suggesting that oxidative stress was greater in exposed groups (Figure 3). At 4 weeks of exposure, the V and V+S groups were statistically different between them and the control group, while the S group only differed from the control group. On the eighth week of exposure, groups V, S, and V + S were different from control, and the group V+S was statistically different (P < 0.05) from groups C, V, and S. As for statistically significant differences (P < 0.05) between times of exposure, the V+S group at week 4 showed an increase in color density compared to week 8, while the V and S groups at week 8 showed an increase (P < 0.05) compared to week 4 (Figure 4). Immunohistochemistry for 4-hydroxynonenal in the control and experimental groups. (a) 4-week control; (b) 8-week control; (c) 4-week V; (d) 8-week V; (e) 4-week sucrose; (f) 8-week sucrose; (g) 4-week V+S; (h) 8-week V+S. In the V+S group (4 and 8 weeks), a more severe steatosis was observed. (Bar 20 μm). Mean density values for 4-HNE in control, V, S, and V + S groups at weeks 4 and 8. Statistically significant differences were observed between exposure times (*) P < 0.05 Data from n = 10 mice per group. One-way analysis of variance (ANOVA) followed by Tukey’s post hoc test. The results are expressed in means ± standard deviation.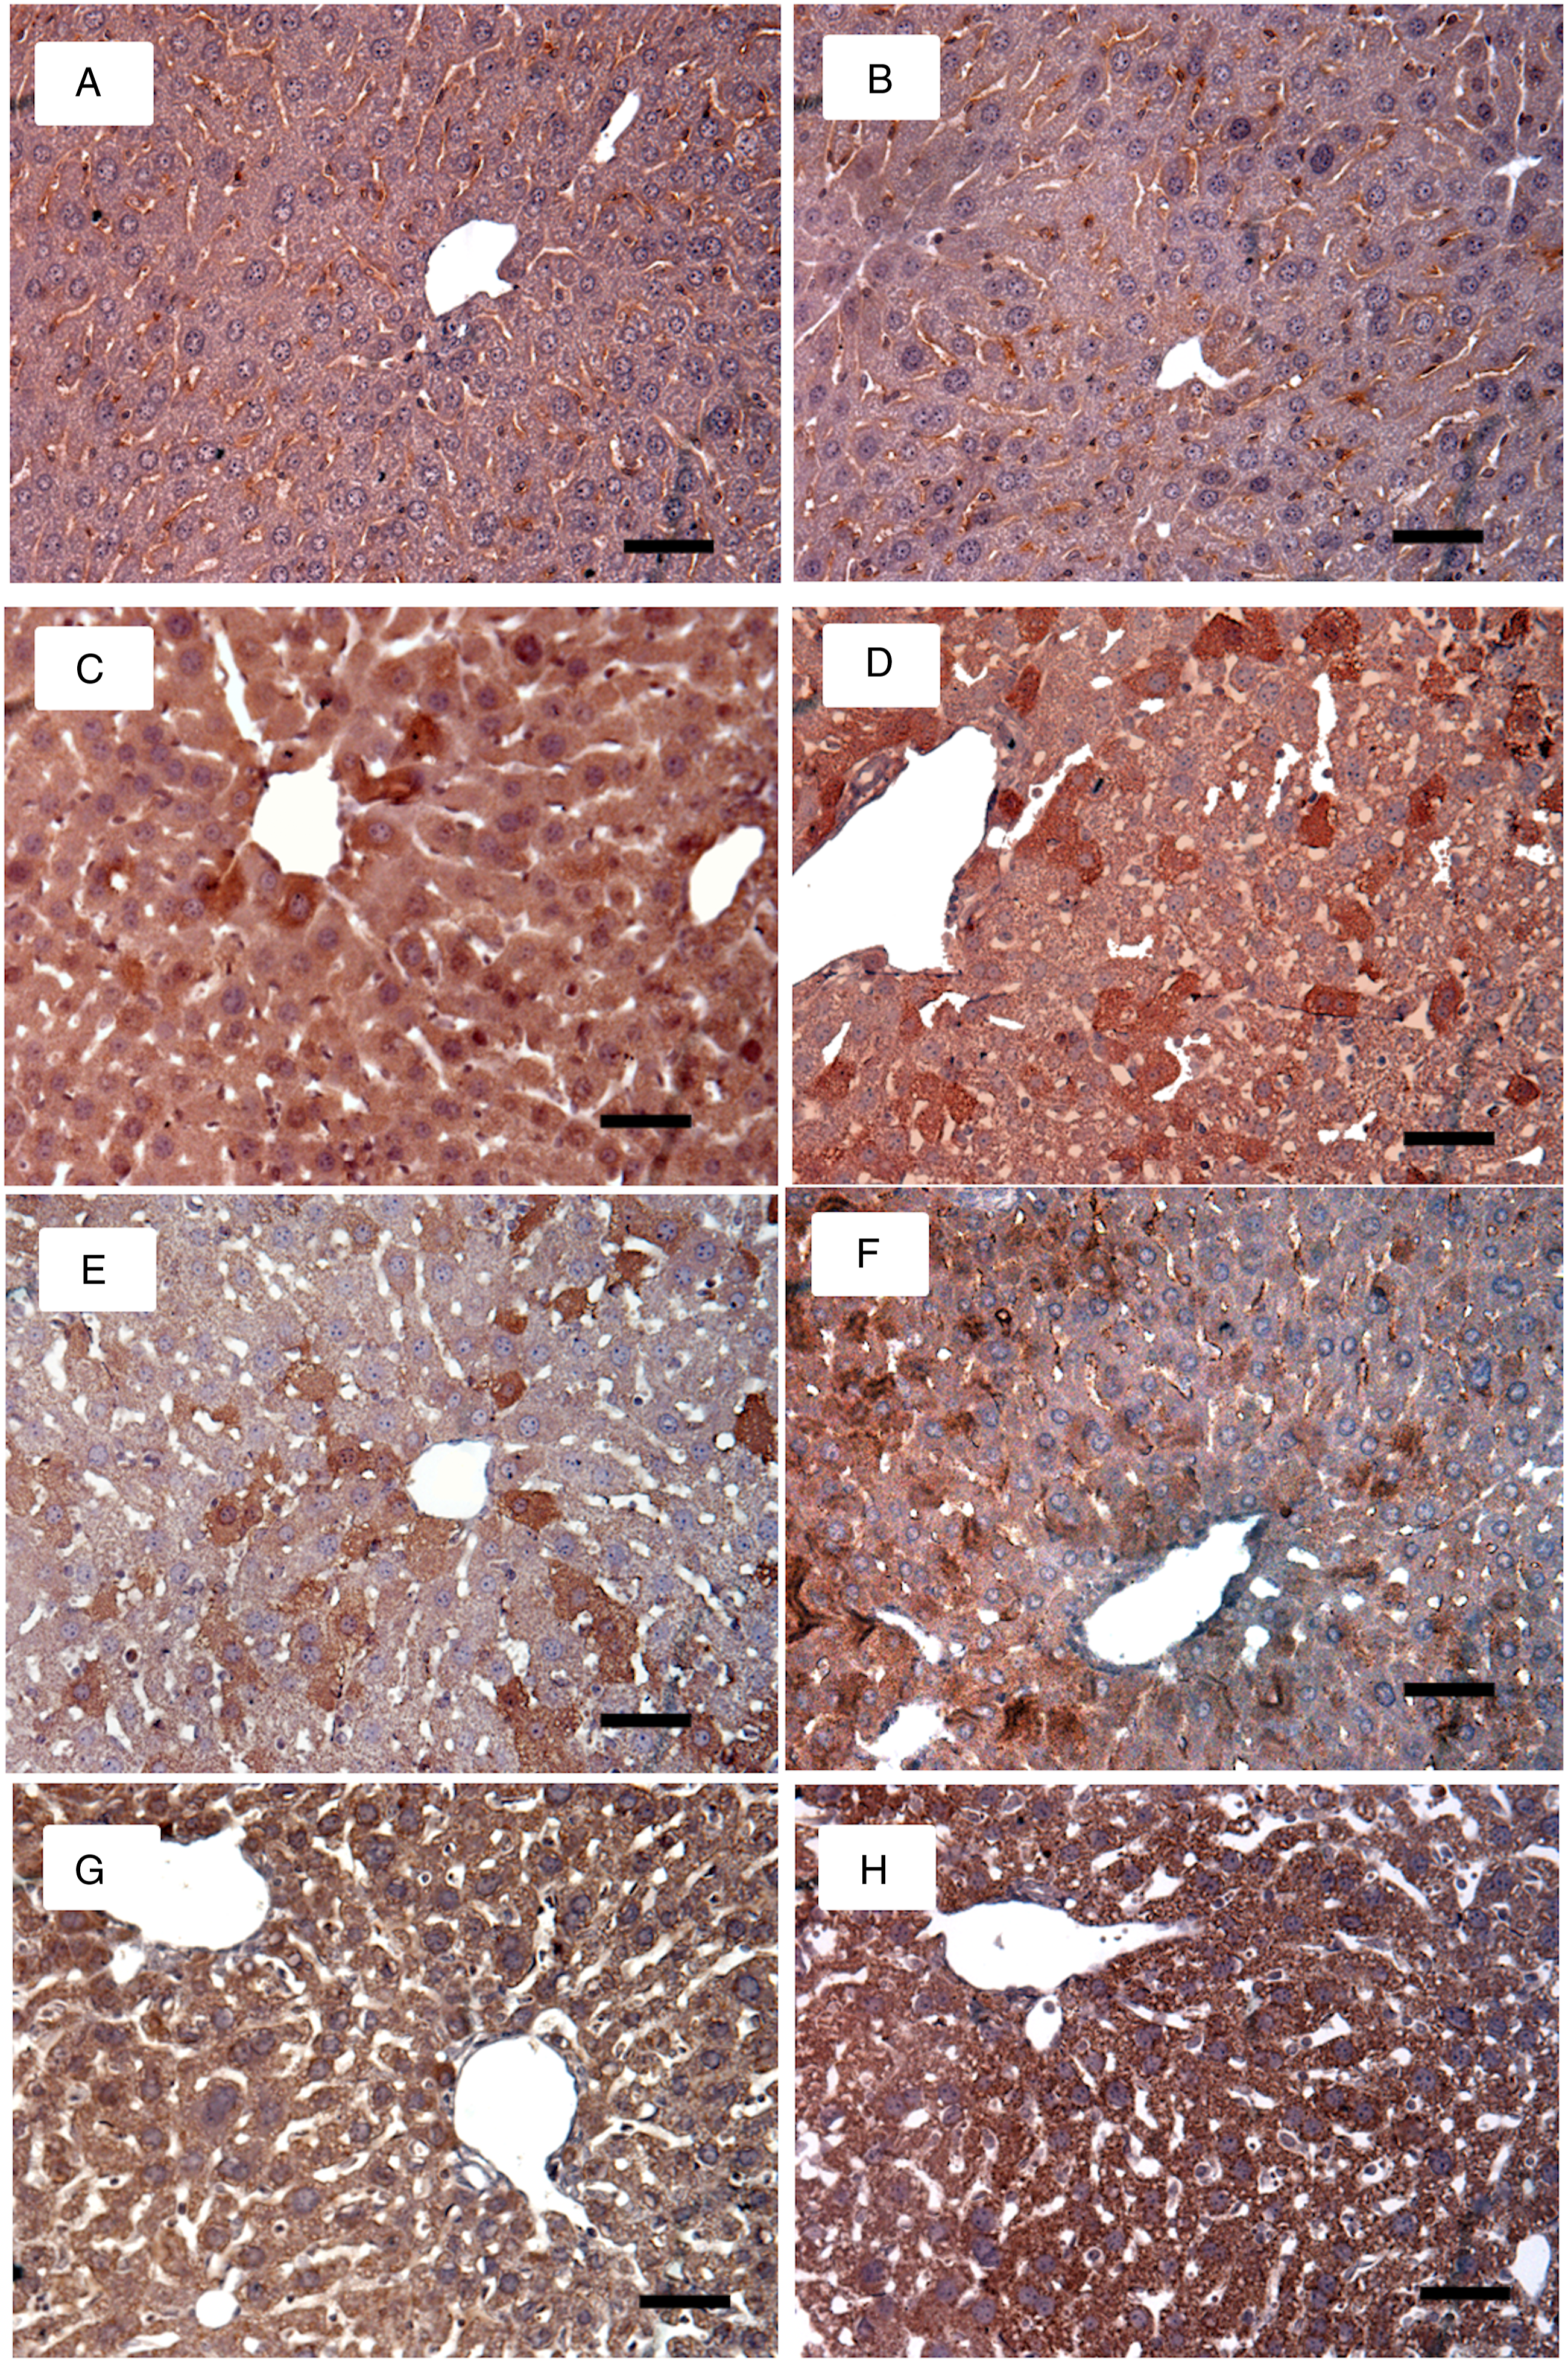
Discussion
In this study, we observed that the co-administration of inhaled V and sweetened water induced liver damage, as demonstrated by the increase in hepatic enzymes, De Ritis ratio, and steatosis in the exposed groups. Liver damage for V exposure and for sucrose consumption has been described separately and the mechanism is, at least in part, due to the increase in oxidative stress in the exposed groups, which was augmented with exposure mainly in the V + S group. We also observed binucleated cells and meganuclei as a consequence of the damage and because of the regenerative potential of the liver.
Liver damage, specifically NAFLD, is a problem with multifactorial etiology: some environmental factors have been reviewed by VoPham (2019) 15 that include some metals like arsenic, cadmium, chromium, copper, lead, mercury, nickel, and zinc. Now, we are reporting the effect of inhaled V and sucrose consumption. This damage is associated with changes in the blood levels of hepatic enzymes: ALT, AST, and LDH transaminases. The AST/ALT ratio known as De Ritis is an indicator of the severity of liver damage, which in our exposure groups notably increased, mainly at week 8. 10 Previous work has shown that the inhalation of V causes an increase in the levels of these transaminases.4,16 Similarly, the consumption of sucrose has been reported to cause increased levels of transaminases, 17 which is consistent with the results obtained in this report. 18
One of the mechanisms associated to liver damage is oxidative stress. Our results indicate that exposure to V and consumption of sucrose cause increased levels of 4-HNE expression in all exposed groups, mainly V + S at week 8, as it was reported before but in the kidney with this same animal model. 11 The generation of reactive oxygen species (ROS) is a normal process in the cellular life cycle; however, when an increase in the production of ROS is observed it can alter the cellular metabolism and its regulation, as well as damage of the cellular structures that leads to oxidative stress. This imbalance is often due to a deficiency in antioxidant defenses through deregulation of antioxidant enzyme systems. 19 Vanadium toxicity has been widely studied, showing that besides being hepatotoxic, it damages different organs such as: kidney, heart, nervous tissue, lung, among others, and it is suggested that the damage is due to its pro-oxidant effect.4,6,20 V is a transition metal that may induce the generation of ROS through Fenton reaction. One of the mechanisms by which vanadium exerts its toxicity is its ability, once inside the cell, to damage the internal membrane of the mitochondria, thus affecting the transfer of electrons between respiratory complexes and causing the generation of ROS.21,22 Sucrose may induce oxidative stress because of glucose autoxidation or the production of advanced glycation products (AGE) that interact with its receptors (RAGE) inducing signaling cascades that enhances ROS generation, 23 reason why the combination worsened the oxidative stress in the V+S group.
Besides oxidative stress, the accumulation of AGES in hepatocytes induces necrosis and inflammation that affects the function of hepatic stellate cells predisposing to liver fibrosis. Serum levels of AGEs have been postulated as a biomarker of NALD and other lifestyle-related diseases, 24 so this mechanism may be studied in a further research with this model.
The presence of 4-HNE as a consequence of oxidative stress causes the depletion of intracellular glutathione (GSH), which is involved in the regulation of the cell cycle and can lead the cell to apoptosis or necrosis.25,26 An increase in the number of binucleated and meganucleated cells is related to the production of ROS/RNS. The nuclear and cellular changes increase with the simultaneous administration of V + S possibly as a result of the potentiating effect of V + S on oxidative stress as it was reported for the kidney. 11 It is also possible that the potentiated ROS/RNS production by the co-administration of sucrose and V has a major effect on cytoskeleton disruption favoring the presence of meganucleated and bi or three-nucleated cells, 27 assumptions that need further study. On the other hand, changes in nuclear ploidy (meganuclei) and in the number of nuclei (multinucleated) cells might be a regenerative response as it has been observed in mice models of NAFLD, partial hepatectomies, viral infections such as HBV and HCV, and in patients with non-alcoholic steatohepatitis (NASH) and in V inhalation.4,28,29
Furthermore, there are other mechanisms to explain the hepatosteatosis. We observed steatosis in sucrose but mainly in the V + S group, and it may be explained because sucrose stimulates de novo lipogenesis and promotes insulin secretion which are controlled by the transporters GLUT2 and GLUT5. 30 Sucrose has been reported to cause intrahepatic fat accumulation in the early stages of its administration.31-33
Also, in recent years, air pollution and consumption of sweetened beverages have been two of the main factors linked to the increase in obesity and type II diabetes mellitus in large cities.34,35 Obesity leads to the development of a metabolic syndrome, that causes systemic alterations and leads to NAFLD.36,37 V potentiates the insulin effect, as an anabolic element, and it is reported that it may stimulate lipogenesis. 38 Furthermore, we consider that it may contribute to the increase in the steatosis that we observed in the V+S group.
Liver pathology is a worldwide problem and one of the top ten causes of death; 39 therefore, more studies are needed on the joint involvement of air pollution and sweetened beverages consumption and morbidity and mortality from liver diseases.
Conclusions
The co-administration of inhaled V and sweetened beverages induces liver damage demonstrated by the increase in hepatic enzymes, De Ritis ratio, and steatosis in the exposed groups. The increase in oxidative stress in exposed groups might be the result of the sum of the oxidative stress generated by V and glucose.
Regenerative changes such as binucleated cells and meganuclei were also observed in the exposed groups. Because liver pathology is a worldwide problem, more studies about the joint effect of air pollution and sweetened beverages consumption on the liver should be done.
Footnotes
Acknowledgments
María Eugenia Cervantes-Valencia is a DGAPA-UNAM postdoctoral fellow. The authors thank Raquel Guerrero-Alquicira, Departamento de Biología Celular y Tisular, Facultad de Medicina, UNAM, for the histological tissue processing; also Armando Zepeda-Rodríguez and Francisco Pasos-Nájera for artwork with the figures. We also appreciate the technical assistance of Ismael Torres-Saldaña, member of the vivarium staff of the Facultad de Medicina, UNAM. Alejandra Núñez-Fortoul edited the English of the final version of the manuscript.
Declaration of Conflicting Interests
The author(s) declared no potential conflicts of interest with respect to the research, authorship, and/or publication of this article.
Funding
The author(s) received no financial support for the research, authorship, and/or publication of this article.