
Abstract
Predictive indicators of testicular toxicity could improve drug development by allowing early in-life screening for this adverse effect before it becomes severe. We hypothesized that circulating microRNAs (miRNAs) could serve as testicular toxicity biomarkers in dogs. Herein, we describe the results of an exploratory study conducted to discover biomarkers of drug-induced testicular injury. Following a dose-selection study using the testicular toxicant ethylene glycol monomethyl ether (EGME), we chose a dose of 50 mg/kg/d EGME to avoid systemic toxicity and treated 2 groups of dogs (castrated, non-castrated) for 14 to 28 days. Castrated animals were used as negative controls to identify biomarkers specific for testicular toxicity because EGME can cause toxicity to organ systems in addition to the testis. Blood was collected daily during the dosing period, followed by recovery for 29 to 43 days with less frequent sampling. Dosing was well tolerated, resulting in mild-to-moderate degeneration in testes and epididymides. Global profiling of serum miRNAs at selected dosing and recovery time points was completed by small RNA sequencing. Bioinformatics data analysis using linear modeling demonstrated several circulating miRNAs that were differentially abundant during the dosing period compared with baseline and/or castrated control samples. Confirmatory reverse transcription quantitative polymerase chain reaction data in these animals was unable to detect sustained alterations of miRNAs in serum, except for 1 potential candidate cfa-miR-146b. Taken together, we report the results of a comprehensive exploratory study and suggest future directions for follow-up research to address the challenge of developing diagnostic biomarkers of testicular toxicity.
Keywords
Introduction
In pharmaceutical research and development, preclinical safety evaluation is conducted to identify risks of drug candidates that may reflect adverse effects in humans. For small molecules, animal testing is generally performed in rodent and non-rodent species to reveal toxicities and potential safety concerns that may arise in clinical trials. Testicular toxicity discovered during preclinical testing can significantly impede or even halt drug development programs, occurring in pharmaceutical companies in 1 to 3 programs every 5 years. 1 This toxicity is usually detected by histopathologic evaluation from repeat-dose toxicology studies. While histopathology of the testis and reproductive tissues is a standard and sensitive end point to evaluate male reproductive injury in animals, 2 the invasive nature of histopathology and the extended dosing periods often required before toxicity is detected presents a substantial challenge for pharmaceutical development. Early detection of testicular toxicity would be useful to prevent programs with potential safety liabilities from reaching later stages of drug development when more resources are invested (eg, 3-month GLP animal studies). A review of FDA label warnings for male reproductive toxicity found 235 single-ingredient, FDA-approved drugs with effects reported in preclinical species. 3 Although many of these drugs were antineoplastic, endocrine, or nucleoside antiviral compounds which would be expected to have adverse effects on male fertility, the identification of several drugs exhibiting toxicity through uncertain mechanisms underscores the need for preclinical detection of toxicity in the male reproductive system. Furthermore, discovery of a translatable biomarker would greatly improve safety monitoring in the clinic.
Research efforts have aimed to discover reliable biomarkers that can predict and/or monitor drug-induced testicular injury. Generally, characteristics of an ideal biomarker would be that it is sensitive and proportional to changes in histopathology, reports toxicity before the onset of irreversible tissue injury, and is readily accessible and stable in biofluids. 4 Previous investigations on testicular toxicity in rodent studies have focused on biomarker candidates including creatine, 5 testosterone, 6 gonadotropin hormones LH and FSH, 6 androgen-binding protein, 6 and inhibin B. 7 Most of these candidates can be assayed in the blood but have proven insensitive as biomarkers of histopathologic injury. Semen parameters, such as sperm count and motility, have also been used as indicators of seminiferous tubule injury in preclinical testing and clinical trials. However, insensitivity of sperm quality indicators is a challenge because detectable impacts on sperm are delayed by weeks due to the lengthy process of spermatogenesis, semen parameters are highly variable in humans, and severe tissue injury is a requisite for measurable effects. 4 Recently, studies have explored epigenetic and transcriptional profiles of sperm including mRNA levels and epigenetic changes 8,9 as well as circulating anti-Müllerian hormone levels. 10
A class of biomarker being investigated for diagnosis of tissue-specific toxicity and disease is microRNA (miRNA). The dominant, canonical biogenesis of these small noncoding regulatory RNAs involves processing from a primary miRNA transcript to a precursor miRNA, and finally, to an active, mature form averaging 22 nucleotides in length. 11,12 Intracellularly, miRNAs can both inhibit and promote translational activation when incorporated in a complex called miRNA-induced silencing complex, which consists of the guide strand and an Argonaute protein. 12 In extracellular biofluids, miRNAs are stable in vesicles or bound to proteins and can be actively secreted by cells, leading some to describe their functions as operating in a hormone-like fashion. 12 Due to tissue injury or cell death, miRNAs may also leak into biofluids such as blood and urine. Thus, because miRNAs are readily accessible in biofluids, exhibit tissue-specific expression, and are often conserved across species, they are attractive candidates as translatable safety biomarkers for monitoring organ-specific toxicities. 13,14
One of the first demonstrations of using an miRNA as a tissue injury marker was miR-122 in acetaminophen-induced liver injury. 15 Since then, a large body of literature has reported several candidate miRNAs to detect drug-induced tissue injury and/or disease in rodents and humans; for example, miR-216a in pancreatic injury, miR-21 in kidney injury, and miR-499 in acute myocardial infarction. 14,16 The use of miRNAs as biomarkers of drug-induced testicular injury is less well studied than these tissues, but investigations have explored miR-202-5p as a potential testicular biomarker in rats. 4,17 In addition to drug-induced damage, circulating testicular miRNAs, especially miR-371a-3p, has shown encouraging results as diagnostic biomarkers of testicular germ cell tumors and warrant future validation studies before clinical implementation. 18
For miRNA biomarker discovery, RNA sequencing (RNA-seq) is advantageous compared to older technologies because it has increased sensitivity, greater dynamic range, high throughput capabilities, and no need for a priori knowledge of target sequences. 19 Yet, there are technical challenges when conducting and interpreting small RNA-seq experiments. Biases arising during workflow steps, such as adapter ligation, reverse transcription, and polymerase chain reaction (PCR) amplification, can reduce accuracy and consistency of results. In particular, analyses of RNA in biofluid matrices, such as serum and urine, are often difficult due to low starting material. With low input, PCR amplification bias becomes more pronounced than with higher starting amounts, leading to inaccurate quantifications of miRNAs in samples. Unique molecular identifiers (UMIs) have shown utility as a method to overcome RT and/or PCR bias in library preparation comparison studies; 20,21 therefore, we explored the value of UMIs in the present study. Unique molecular identifiers are short, random sequences that are uniquely incorporated into each cDNA molecule prior to PCR amplification. 22 Therefore, UMIs can reduce PCR bias by barcoding each molecule of cDNA in the sample, so biological replicates can be computationally quantified independently of PCR copies.
To identify novel miRNA biomarkers of testicular toxicity, we conducted an exploratory study by profiling total miRNAs in the serum of beagle dogs treated with the testicular toxicant ethylene glycol monomethyl ether (EGME). Dogs are an important species frequently used in preclinical safety testing but have not been utilized in testicular miRNA biomarker research. Since miRNAs released by testicular injury would be absent in castrated dogs, these animals were incorporated into our study design as a negative control for tissue specificity. After confirming the presence of mild-to-moderate testicular toxicity in EGME-treated animals, we applied next-generation small RNA-seq methods (ie, UMI and non-UMI) to exhaustively assess the totality of miRNAs in serum. We found several miRNA candidates that were differentially abundant in non-castrated animals versus castrated animals at various time points. Confirmation of these potential miRNA biomarkers was conducted by reverse transcription quantitative PCR (RT-qPCR) analysis.
Materials and Methods
Animals
Male, beagle dogs (age: 2-3 years old at study initiation) were obtained from Marshall Bio Resources USA, Inc. The study was conducted within a program accredited by the Association for Assessment and Accreditation of Laboratory Animal Care and approved by AbbVie’s Institutional Animal Care and Use Committee.
Dose Selection
We desired to dose EGME at a level that would cause testicular toxicity without systemic effects. Due to limited data in the literature regarding the dose of EGME to induce testicular damage in dogs without causing systemic toxicity, a dose selection study was conducted with EGME at 0, 100, or 300 mg/kg/d for 1 week (n = 3/group). Ethylene glycol monomethyl ether doses at or above 100 mg/kg/d were not well tolerated. Results of the tolerability study, including clinical observations, histopathology of selected tissues, and hematology, are available in Supplemental Materials 1 and 2. Due to systemic toxicity at higher doses, an oral dose of 50 mg/kg/d of EGME was selected for the exploratory RNA profiling study.
Dosing and Sample Collection
In the exploratory RNA profiling study (Figure 1), all animals were dosed with EGME at 50 mg/kg/d (n = 2/group) for the durations indicated in Table 1. Approximately 6 months prior to dosing, the animals in the negative control group were castrated. Ethylene glycol monomethyl ether (liquid) was administered orally in gelatin capsules (Carl Roth), with dosage volumes of 52.1 μL/kg/d for 50 mg/kg/d. Ethylene glycol monomethyl ether is a liquid with density of 0.96 g/mL. Dosing was discontinued earlier if toxicity criteria were reached (ie, impaired physical constitution, reduced food consumption, or lymphocyte decrease of 40% compared to baseline values). Note, dog 1001 was not dosed on days 8 and 9. During the dosing period, blood was collected daily (occasionally, with additional collections at 6 hours post-administration), for monitoring potential hematology changes and profiling miRNAs. Serum was stored at −60 °C or colder until RNA isolation was performed. The dosing period was followed by a recovery period with less frequent blood collection. Dogs were released back into the research colony.
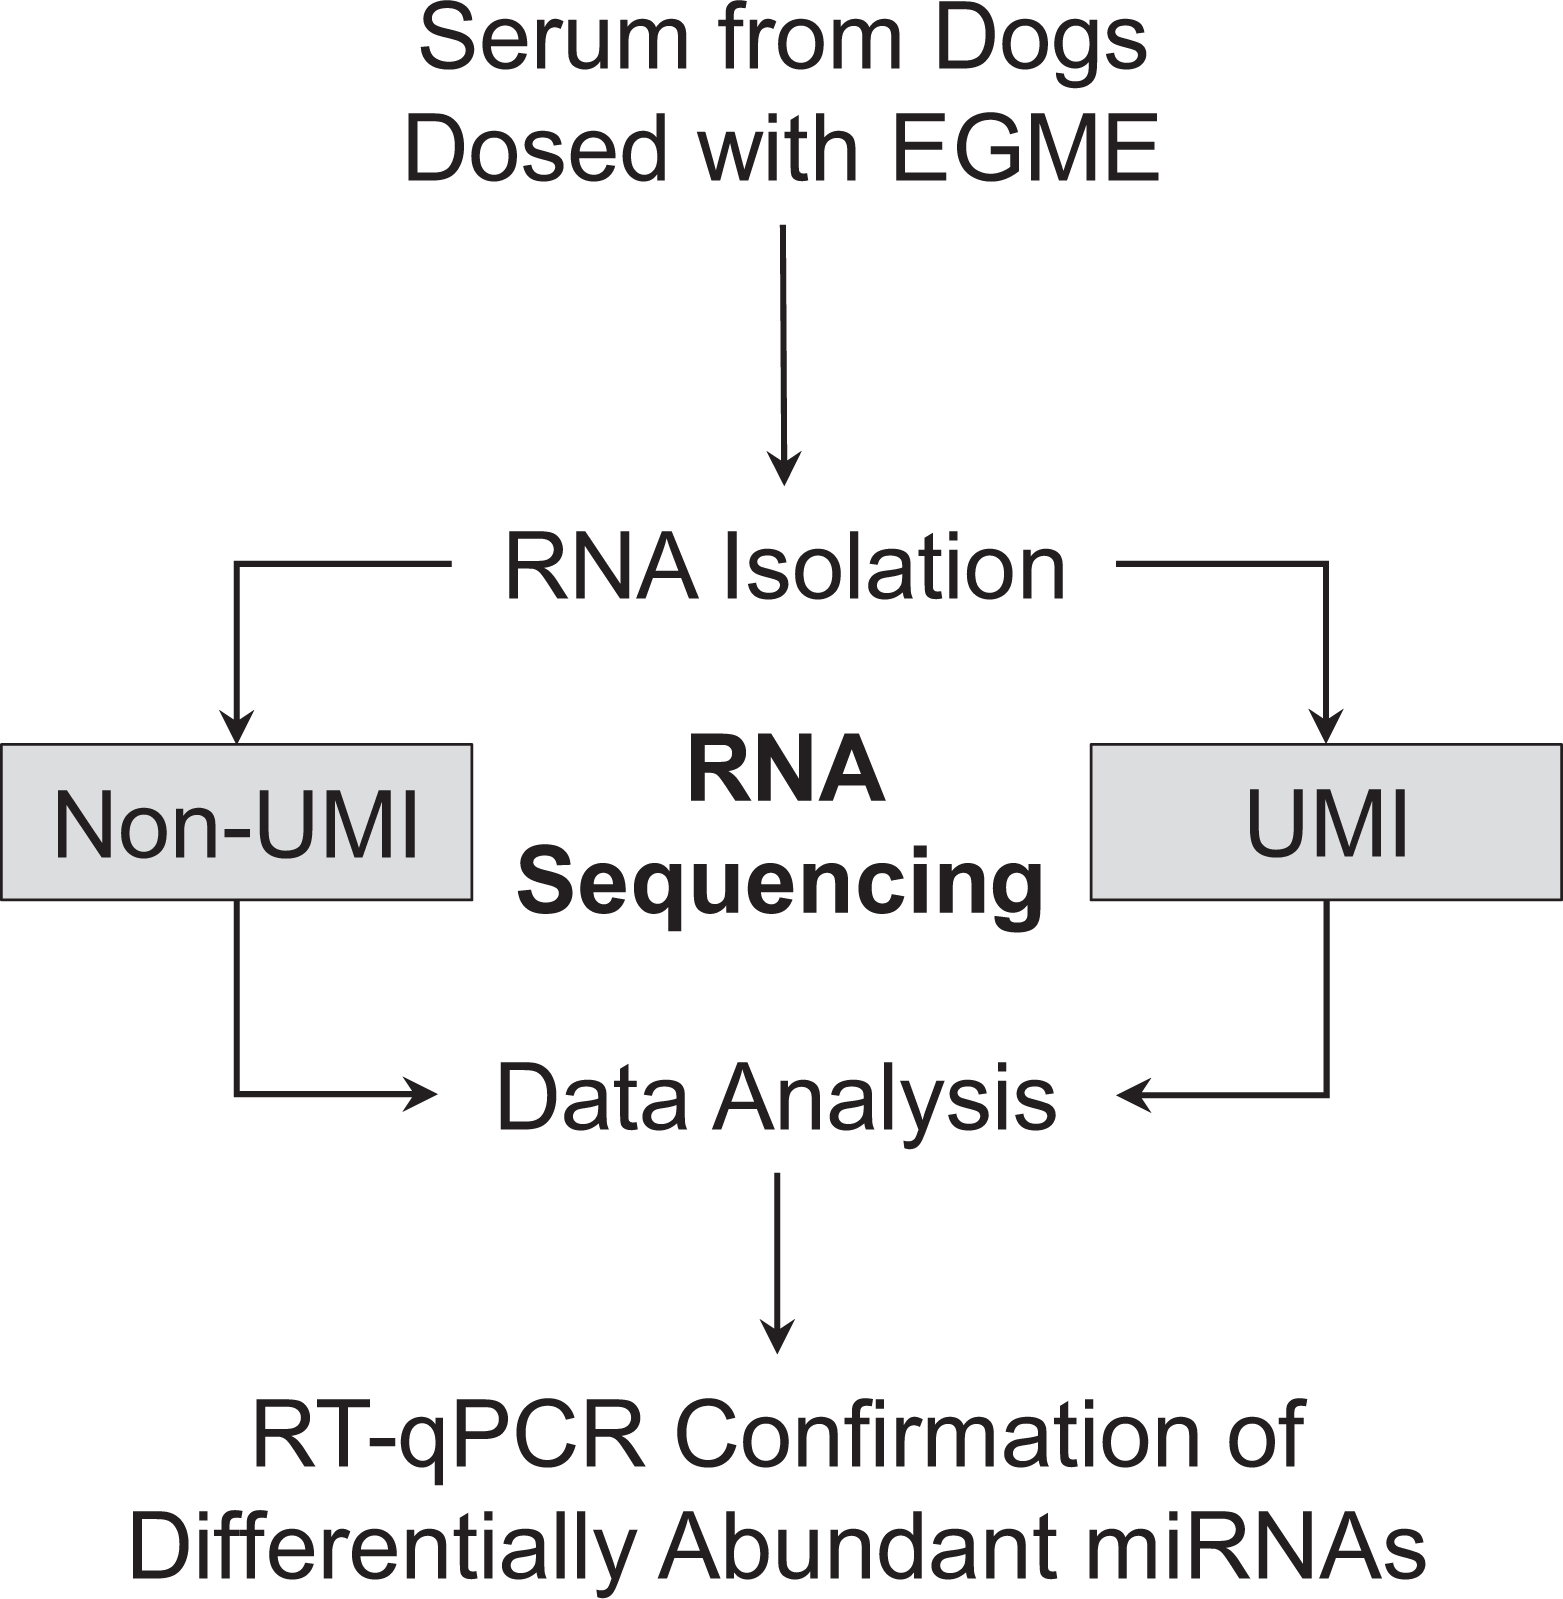
Overview of testicular toxicity miRNA biomarker discovery study. Testicular toxicity was induced in beagle dogs by administration of EGME at 50 mg/kg/d. Serum samples collected during the dosing and recovery periods were profiled by small RNA-seq using 2 library preparation methods (ie, non-UMI and UMI). Subsequent bioinformatics analysis of the RNA-seq data identified differentially abundant miRNAs between various control and test groups. These filtered miRNAs were measured by RT-qPCR confirmation experiments using serum from the dogs dosed with EGME. EGME indicates ethylene glycol monomethyl ether; miRNA, microRNA; RNA-seq, RNA sequencing; UMI, unique molecular identifier; RT-qPCR, reverse transcription quantitative polymerase chain reaction.
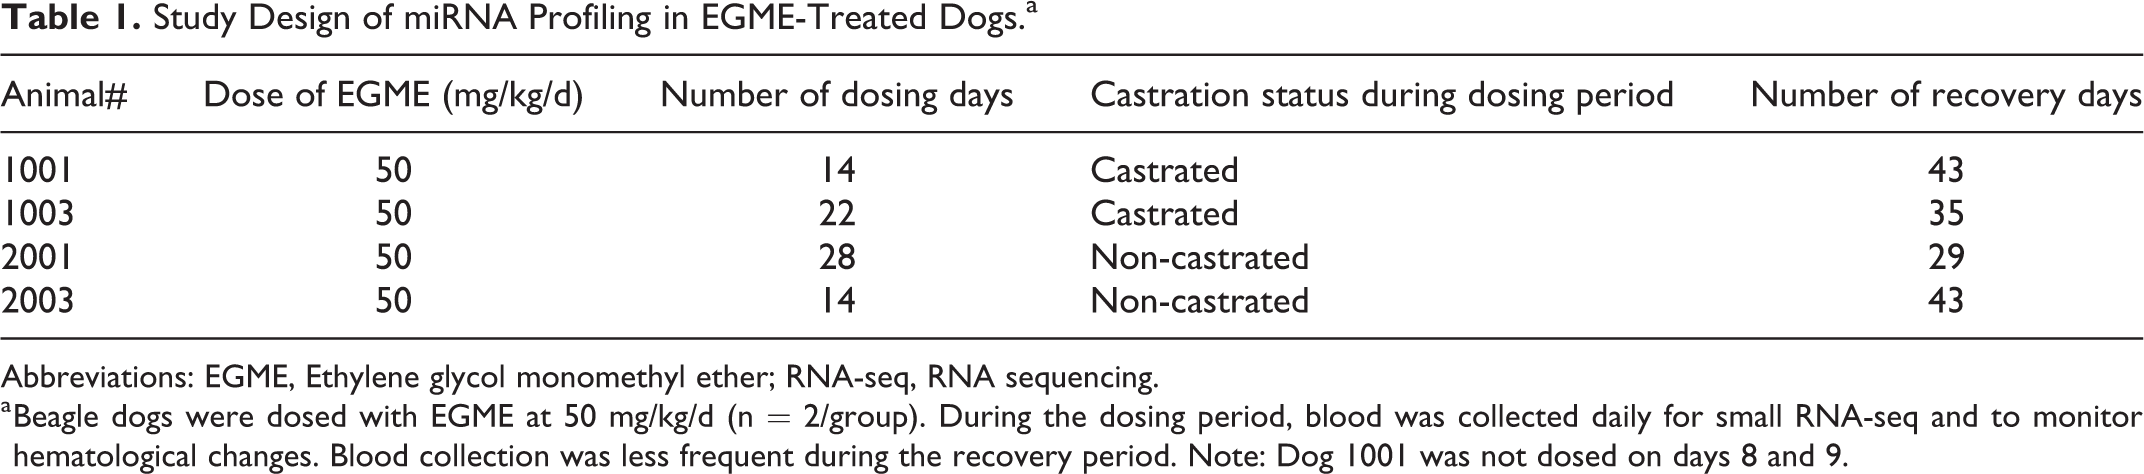
Study Design of miRNA Profiling in EGME-Treated Dogs.a
Abbreviations: EGME, Ethylene glycol monomethyl ether; RNA-seq, RNA sequencing.
a Beagle dogs were dosed with EGME at 50 mg/kg/d (n = 2/group). During the dosing period, blood was collected daily for small RNA-seq and to monitor hematological changes. Blood collection was less frequent during the recovery period. Note: Dog 1001 was not dosed on days 8 and 9.
Histopathology
On the day after the final dose, the non-castrated dogs were castrated to examine the testes for histopathological findings. Sections of testes and epididymides were stained with hematoxylin and eosin for histopathology analysis. The slides were evaluated by board-certified veterinary pathologists (K.B. and T.K.).
RNA Sequencing Methods
This study used 2 small RNA-seq methods, which either did not incorporate or incorporate unique molecular identifiers (UMIs) in the sequencing libraries. For clarity, we will refer to these methods as the non-UMI and UMI methods, respectively. For the non-UMI method, RNA was isolated from serum using the miRNeasy Mini Kit (QIAGEN). RNA was quantified using the NanoDrop spectrophotometer, Bioanalyzer RNA Pico Assay (Agilent), and Qubit RNA HS Assay (ThermoFisher). Samples were concentrated by SpeedVac, and 20 ng of RNA input was used in the Illumina TruSeq Small RNA Library Prep kit before gel purification of the small RNA fraction. Samples were sequenced on the Illumina HiSeq using 50-bp single-end reads with 8 samples multiplexed per lane (∼22.5 million reads per sample).
For the UMI method, RNA was isolated from serum using the miRNeasy Serum/Plasma Advanced Kit (QIAGEN). RNA quality was assessed and quantified using the Bioanalyzer Small RNA Assay (Agilent) and Qubit RNA HS Assay (ThermoFisher). Library preparation was performed using the QIAseq miRNA Library Kit (QIAGEN), and sequencing was performed using the High Output NextSeq 500/550 v2 Kit (Illumina). Samples were sequenced on the NextSeq 500 (Illumina) using 75-bp single-end reads with 23 samples per flow cell (∼17.4 million reads per sample).
RNA Sequencing Data Analysis
For both RNA-seq methods, sequencing quality was evaluated, and pre-processing was performed to trim adapters from reads (cutadapt). 23 For the non-UMI method, all reads were retained for differential expression of miRNAs, but for the UMI method, replicate reads with identical UMIs were discarded. For both methods, trimmed reads were aligned using STAR to Canis familiaris CanFam3.1 dog genome and mature miRNAs in miRBase (v22). 24 Differential presence of mature miRNA was performed with unique read counts from the miRBase mature miRNA read counts after limma voom TMM log2(CPM + 1) normalization using linear modeling in R coding language. 25 -27 In each method, an miRNA was detected if the average normalized TMM log2(CPM+1) expression across all samples was at least 1. For each miRNA, z-scores were calculated from the TMM-normalized expression, indicating each animal’s miRNA abundance, and represented in heatmap rows. The cutoffs for the heatmaps were P value < .05, an average expression across the samples of > 1, and | log2(fold change) | > 1. In this report, expression as log2(normalized counts) represents TMM normalized log2(CPM + 1), and raw P values are described unless specified as false discovery rate (FDR) adjusted P values as provided by limma. 28 Previously published miRNA tissue enrichment from the beagle dog tissue atlas by Koenig et al was used in filtering (accession number: GSE83278). 29
Reverse Transcription Quantitative PCR Confirmation
RNA was isolated from 200 µL of serum using the miRNeasy Serum/Plasma Advanced Kit (QIAGEN). Synthetic RNA oligo spike-in Caenorhabditis elegans miR-39-3p (QIAGEN) and MS2 phage RNA (Roche) were added during the RNA isolation procedure according to manufacturer specifications. Dog testis miRNA was used as a positive control (Zyagen). Reverse transcription was conducted using the miRCURY LNA miRNA RT Kit (QIAGEN), followed by qPCR using the miRCURY LNA SYBR Green PCR Kit (QIAGEN) under recommended cycling conditions. Melt curve analysis was also performed for each miRNA. The miRCURY LNA miRNA PCR Assays used in this study are described (Supp. Material 4). Relative miRNA levels were determined by ΔΔCT analysis. 30 For this calculation, each sample was normalized to spiked syn-cel-miR-39-3p which acted as the reference control. The fold change of each sample was computed relative to the averaged baseline samples.
Statistical Analysis
Pearson correlation and the Student t test were performed using GraphPad Prism 8. When needed, P values were corrected for multiple comparisons by FDR.
Results
Study Design and Clinical Observations
To identify circulating miRNAs that could serve as biomarkers of testicular toxicity, EGME was dosed to beagle dogs at 50 mg/kg/d for 14 to 28 days and was overall well tolerated (Table 1). Because EGME can cause toxicity to other organ systems (eg, hematotoxicity), 31 in addition to the testis, 2 castrated animals were used as negative controls to assess the specificity of circulating miRNAs for the testis. Changes in red blood cell parameters including decreased erythrocytes, hematocrit (−17.5%), and reticulocytes (−44.0%) led to discontinuation of dosing after 14 days in dogs 1001 and 2003, and after 22 days in dog 1003. Dog 2001 was dosed for 28 days. Study observations and hematology are available in Supplemental Material 3.
Testicular Histopathology in Beagle Dogs
Dogs treated with EGME at 50 mg/kg/d for 14 and 28 days showed seminiferous tubular degeneration and atrophy. The dog dosed for 28 days had more severe changes (moderate) than the dog dosed for 14 days (mild) (Figure 2). Testicular changes in the dog dosed for 14 days were characterized by degeneration and loss of elongated and round spermatids with exfoliation of germ cells, formation of multinucleated germ cell syncytia, and basal accumulation of phagocytized elongated spermatids (Figure 3). There were occasionally atrophic seminiferous tubules with loss and degeneration of spermatids and spermatocytes, retention of the elongated spermatids, and vacuolation. In the dog dosed for 28 days, seminiferous tubular atrophy was more pronounced, and there was degeneration and loss of germ cells including spermatids, spermatocytes, spermatogonia, and Sertoli cells. In the dose-selection study in dogs at 100 and 300 mg/kg/d for 1 week (Supp. Material 1), similar testicular changes were observed. However, there were greater numbers of multinucleated germ cells which were likely formed by fusion of degenerating round spermatids. In addition, loss and degeneration of pachytene spermatocytes in seminiferous tubules were more apparent in dogs at 100 and 300 mg/kg/d for 1 week as compared to the changes present in dogs dosed at 50 mg/kg/d for 14 and 28 days.
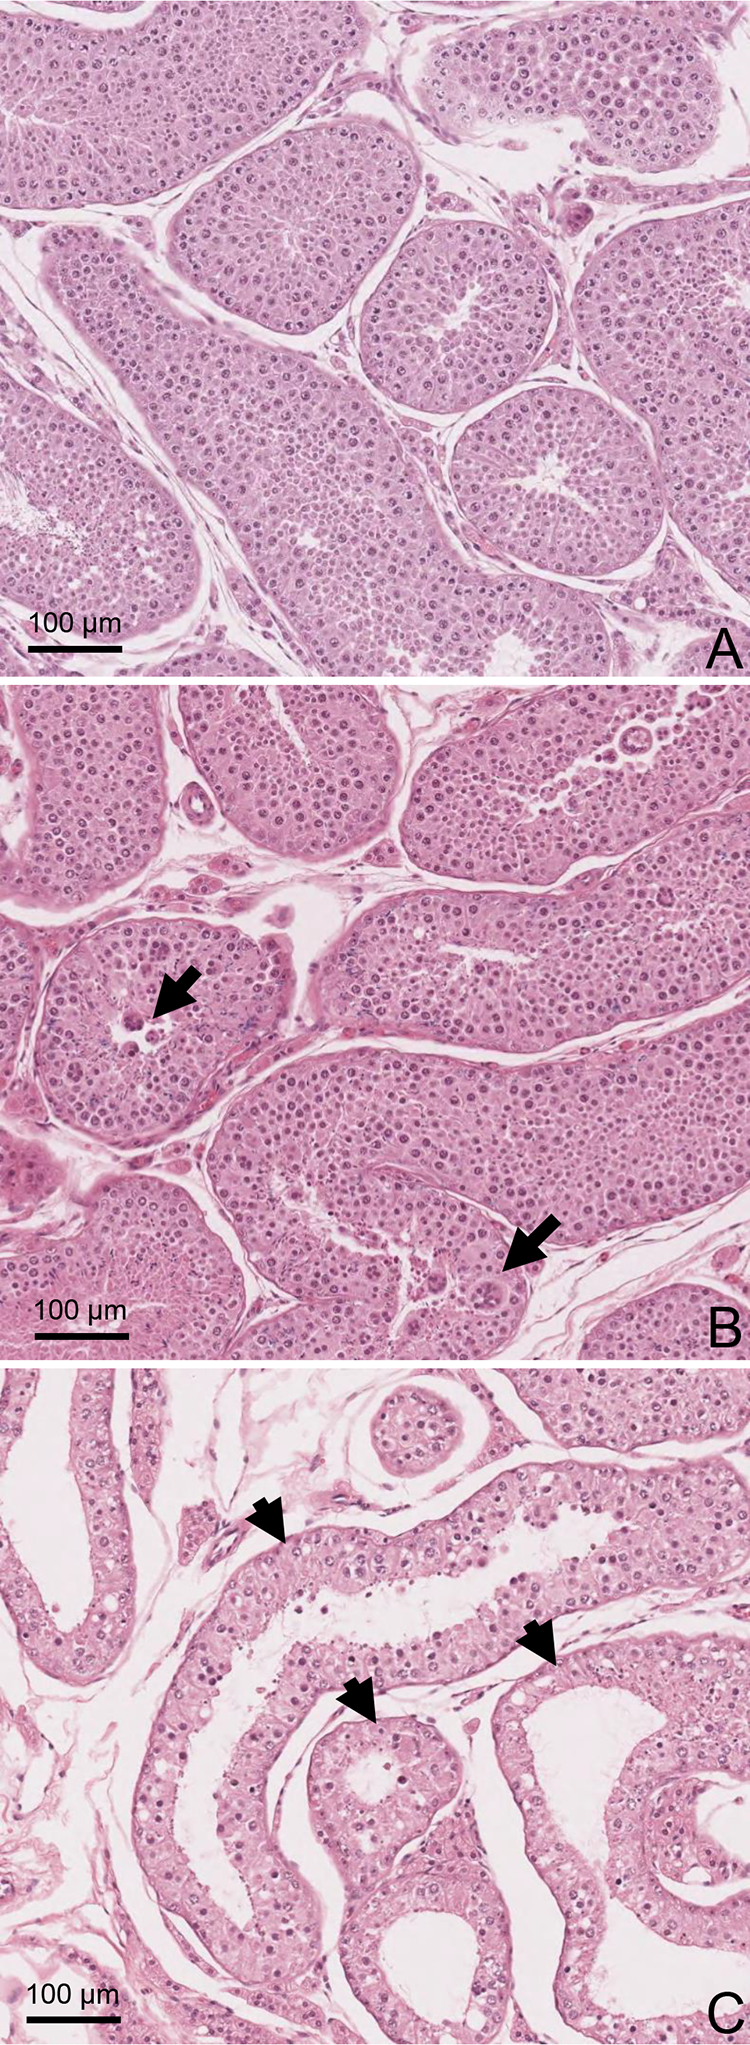
Light microscopic images of seminiferous tubules in the testes of the control (A) and treated dogs with EGME at 50 mg/kg/d for 14 days (B) and 28 days (C). Histology sections were stained with hematoxylin and eosin. B, Multinucleated germ cells (arrows) in seminiferous tubules. C, Atrophic seminiferous tubules (arrows) with loss of germinal cells. EGME indicates ethylene glycol monomethyl ether.
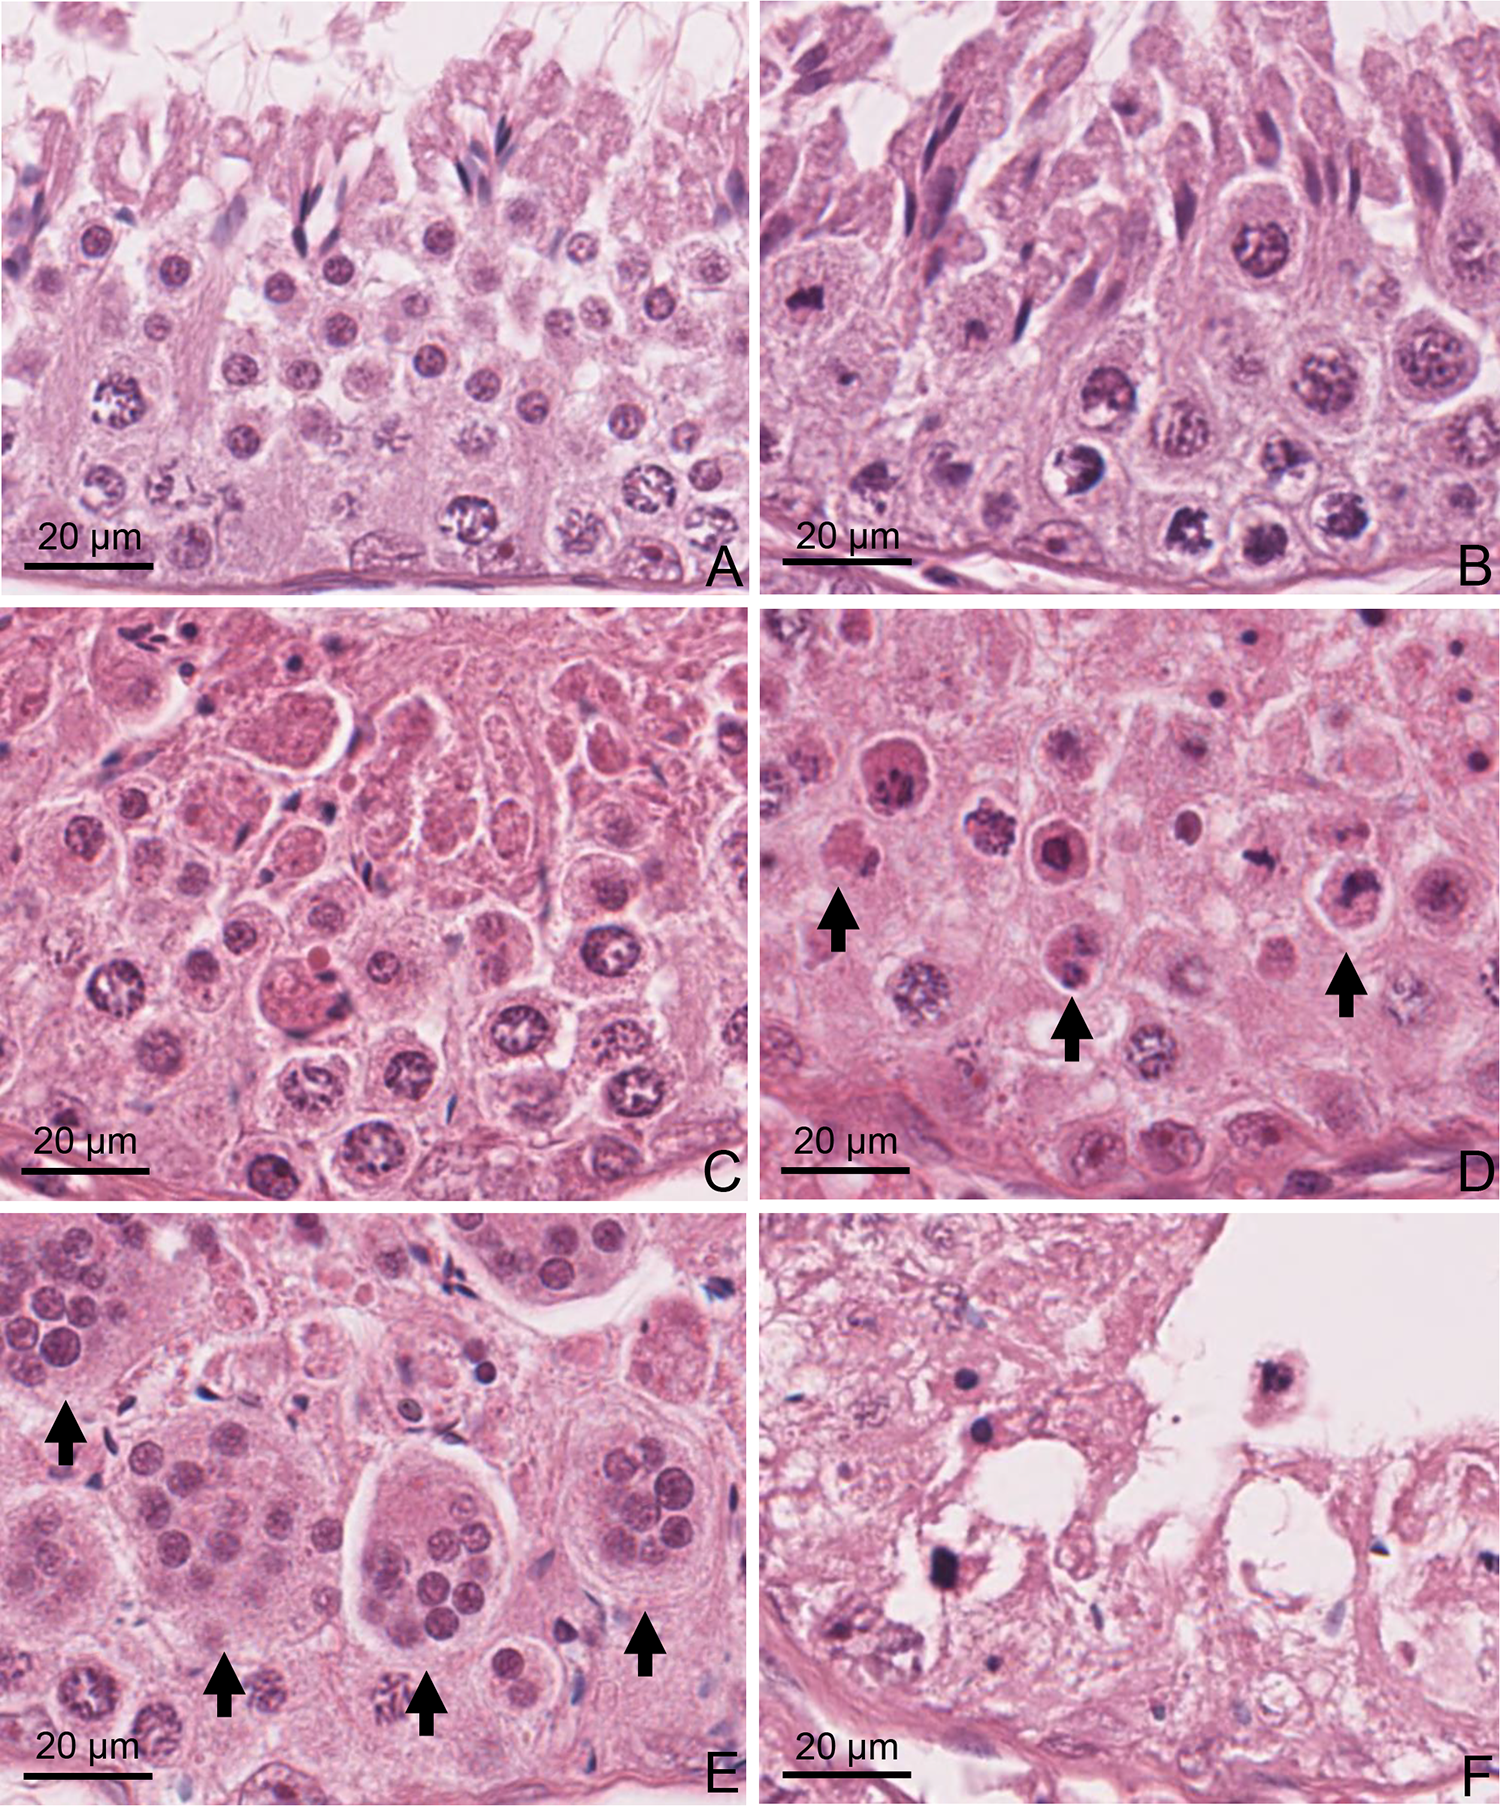
Light microscopic images of seminiferous tubules in the testes of the control (A and B) and treated dogs with EGME at 50 mg/kg/d for 14 days (C and E) and 28 days (D and F). Histology sections were stained with hematoxylin and eosin. A, Seminiferous tubule at stage I of the spermatogenic cycle in the control dog. C, Seminiferous tubule at similar stage showing loss of elongated and round spermatids in the seminiferous tubule. E, Numerous multinucleated germ cells (arrows). B, Seminiferous tubule at stage VIII of the spermatogenic cycle in the control dog. D, Seminiferous tubule at similar stage showing loss and degeneration of spermatocytes (arrows) and loss of elongated spermatids. F, Atrophy of the seminiferous tubule with loss of germ cells and vacuolation. EGME indicates ethylene glycol monomethyl ether.
Method Comparison for miRNA Detection by Small RNA Sequencing
To comprehensively assess all circulating miRNAs in dogs treated with EGME, we conducted small RNA-seq using 2 different library preparation methods. Typical small RNA-seq library preparation involves adapter ligation to RNA molecules, reverse transcription of small RNAs to generate cDNA, and PCR amplification of cDNAs before the library is sequenced. Using this approach, biological copies of RNAs in serum cannot be distinguished from copies generated by PCR, opening the possibility of bias introduced by PCR amplification; therefore, we used UMIs to address this form of library bias.
We first performed small RNA-seq using the non-UMI method. Serum samples from baseline, dosing days 4 and 8, and recovery days 1 and 9 were analyzed for differential presence of miRNA among non-castrated and castrated dogs. We obtained an average number of 22.1 million total sequencing reads per sample (standard deviation: 10.3 million). After filtering the reads, an average of 2.0 million reads (12.1%) mapped uniquely to the canine genome per sample (SD: 1.0 million). In general, high unmapped reads is common for small RNA-seq on serum samples. 32 Reads mapping to multiple loci of the genome and other unmapped reads represented a significant portion of the remaining reads (mean: 85.9%). Of the uniquely mapped reads, ∼10% were assigned to canine miRNAs. Importantly, ∼55% to 70% of the unfiltered reads were overrepresented sequences. Due to the high abundance of a small group of sequences, we integrated UMIs to allow for PCR bias correction in a second RNA-seq experiment. Aiming for consistency, we analyzed serum aliquots collected on the same days as the first RNA-seq experiment. Additionally, we ran biological replicates of baseline and dosing day 13 samples in all the animals. With the UMI method, we obtained an average number of 16.7 million total reads per sample (SD: 1.7 million). After filtering and counting only reads containing unique UMIs, we achieved an average of 0.85 million reads (13.3%) mapping uniquely to the canine genome (SD: 0.37 million). Over-represented sequences were 5% to 32% of the total reads. Compared to the non-UMI method, the percent of unique reads mapping to miRNAs improved to ∼30%.
To evaluate the concordance between the 2 sequencing methods, we performed correlation analysis on the detected miRNAs and found that there was strong correlation between the samples (r > 0.84; Figure 4). Out of 453 total dog miRNAs in miRBase at the time of the analysis, 162 of miRNAs were detected with the non-UMI method compared to 255 miRNAs detected with the UMI method. In the correlation plots of the baseline samples (Figure 4), as well as the days 4 and 8 samples (Supp. Material 4), several miRNAs were only detected using the UMI method. These results suggest that the UMI method was more sensitive in detecting miRNAs than the non-UMI method. Detection sensitivity improvement in the UMI method could be due to differences in the workflow including the library kit and RNA extraction method. Nonetheless, the high degree of correlation suggests that the RNA-seq methods were comparable to each other and raises our confidence in the accuracy of this data.
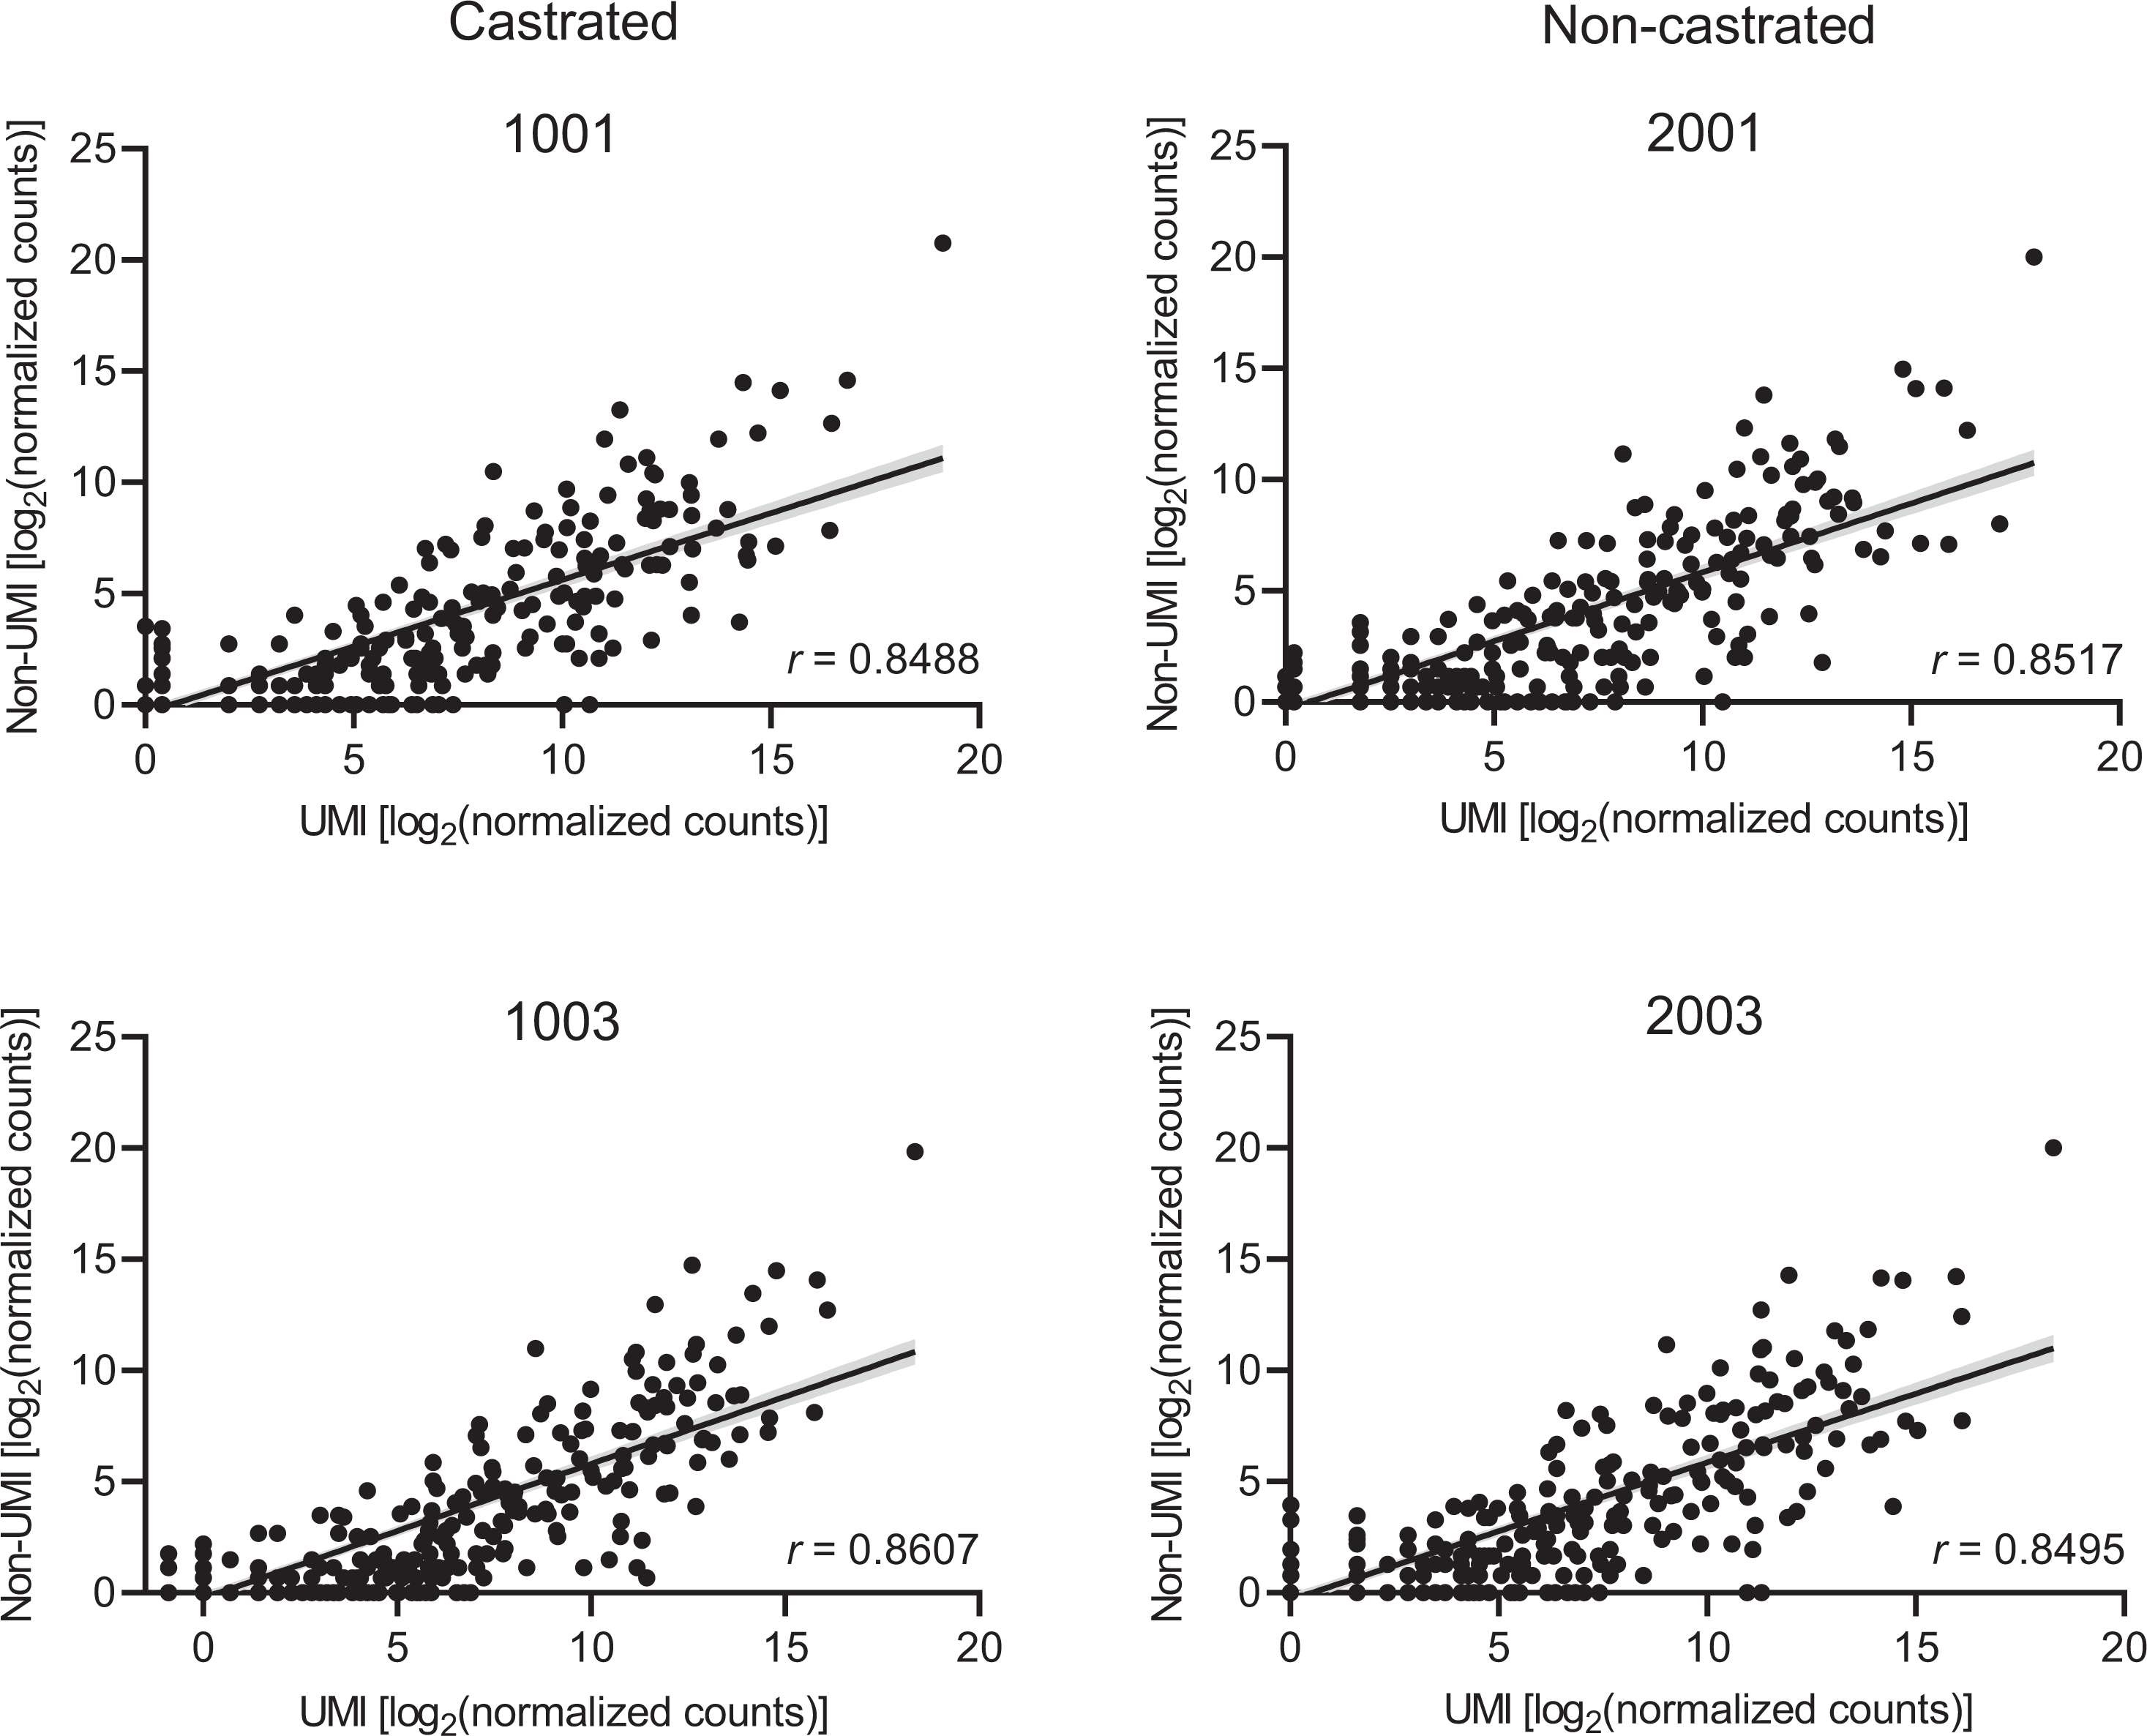
Correlation in circulating miRNA detection between small RNA-seq methods. The normalized count data from the 2 small RNA-seq methods are represented for each mature miRNA. These data were generated from the pooled baseline serum samples of each dog prior to EGME dosing. The Pearson
Differentially Abundant Circulating miRNAs in Dogs Dosed With EGME
Differential expression analysis was used to compare miRNA abundance between multiple control and experimental groups. Enabled by the study design, we focused on non-castrated versus castrated dogs or dosing days versus pooled baseline. Our rationale was that the castrated animals would serve as a tissue specificity control, while comparisons to baseline would indicate sensitivity of a potential miRNA biomarker. Using these contrasts, we determined that the comparison yielding the highest number of differentially abundant miRNAs was the baseline versus dosing day 13 contrast in the non-castrated dogs (Figure 5A-C). We chose dosing day 13 for the UMI method because it was the nearest time point to the first testicular histopathology results. Principal components analysis demonstrated that separation occurred between baseline and day 13 samples with 63.62% of variation explained by PC1 (Figure 5A). Furthermore, differential abundance analysis indicated that 13 miRNAs were elevated, while 14 miRNAs were depleted (Figure 5B). Using the beagle dog miRNA tissue atlas database, 29 we examined the known tissue expression of several miRNAs in our results. Of the 10 most elevated miRNAs in day 13 versus baseline (Figure 5C), 2 are enriched in the testis (miR-507b, miR-146b), 3 miRNAs are enriched in the brain (miR-411, miR-149, miR-146b), and 1 is enriched in the pancreas (miR-216b). Of the 10 most depleted miRNAs in day 13 versus baseline (Figure 5C), 4 miRNAs are enriched in the brain (miR-331, miR-383, miR-184, miR-135a-5p), 1 is enriched in the pancreas (miR-135a-5p), 2 are enriched in plasma (miR-383, miR-331), and 1 is enriched in the bone marrow and jejunum (miR-374b).
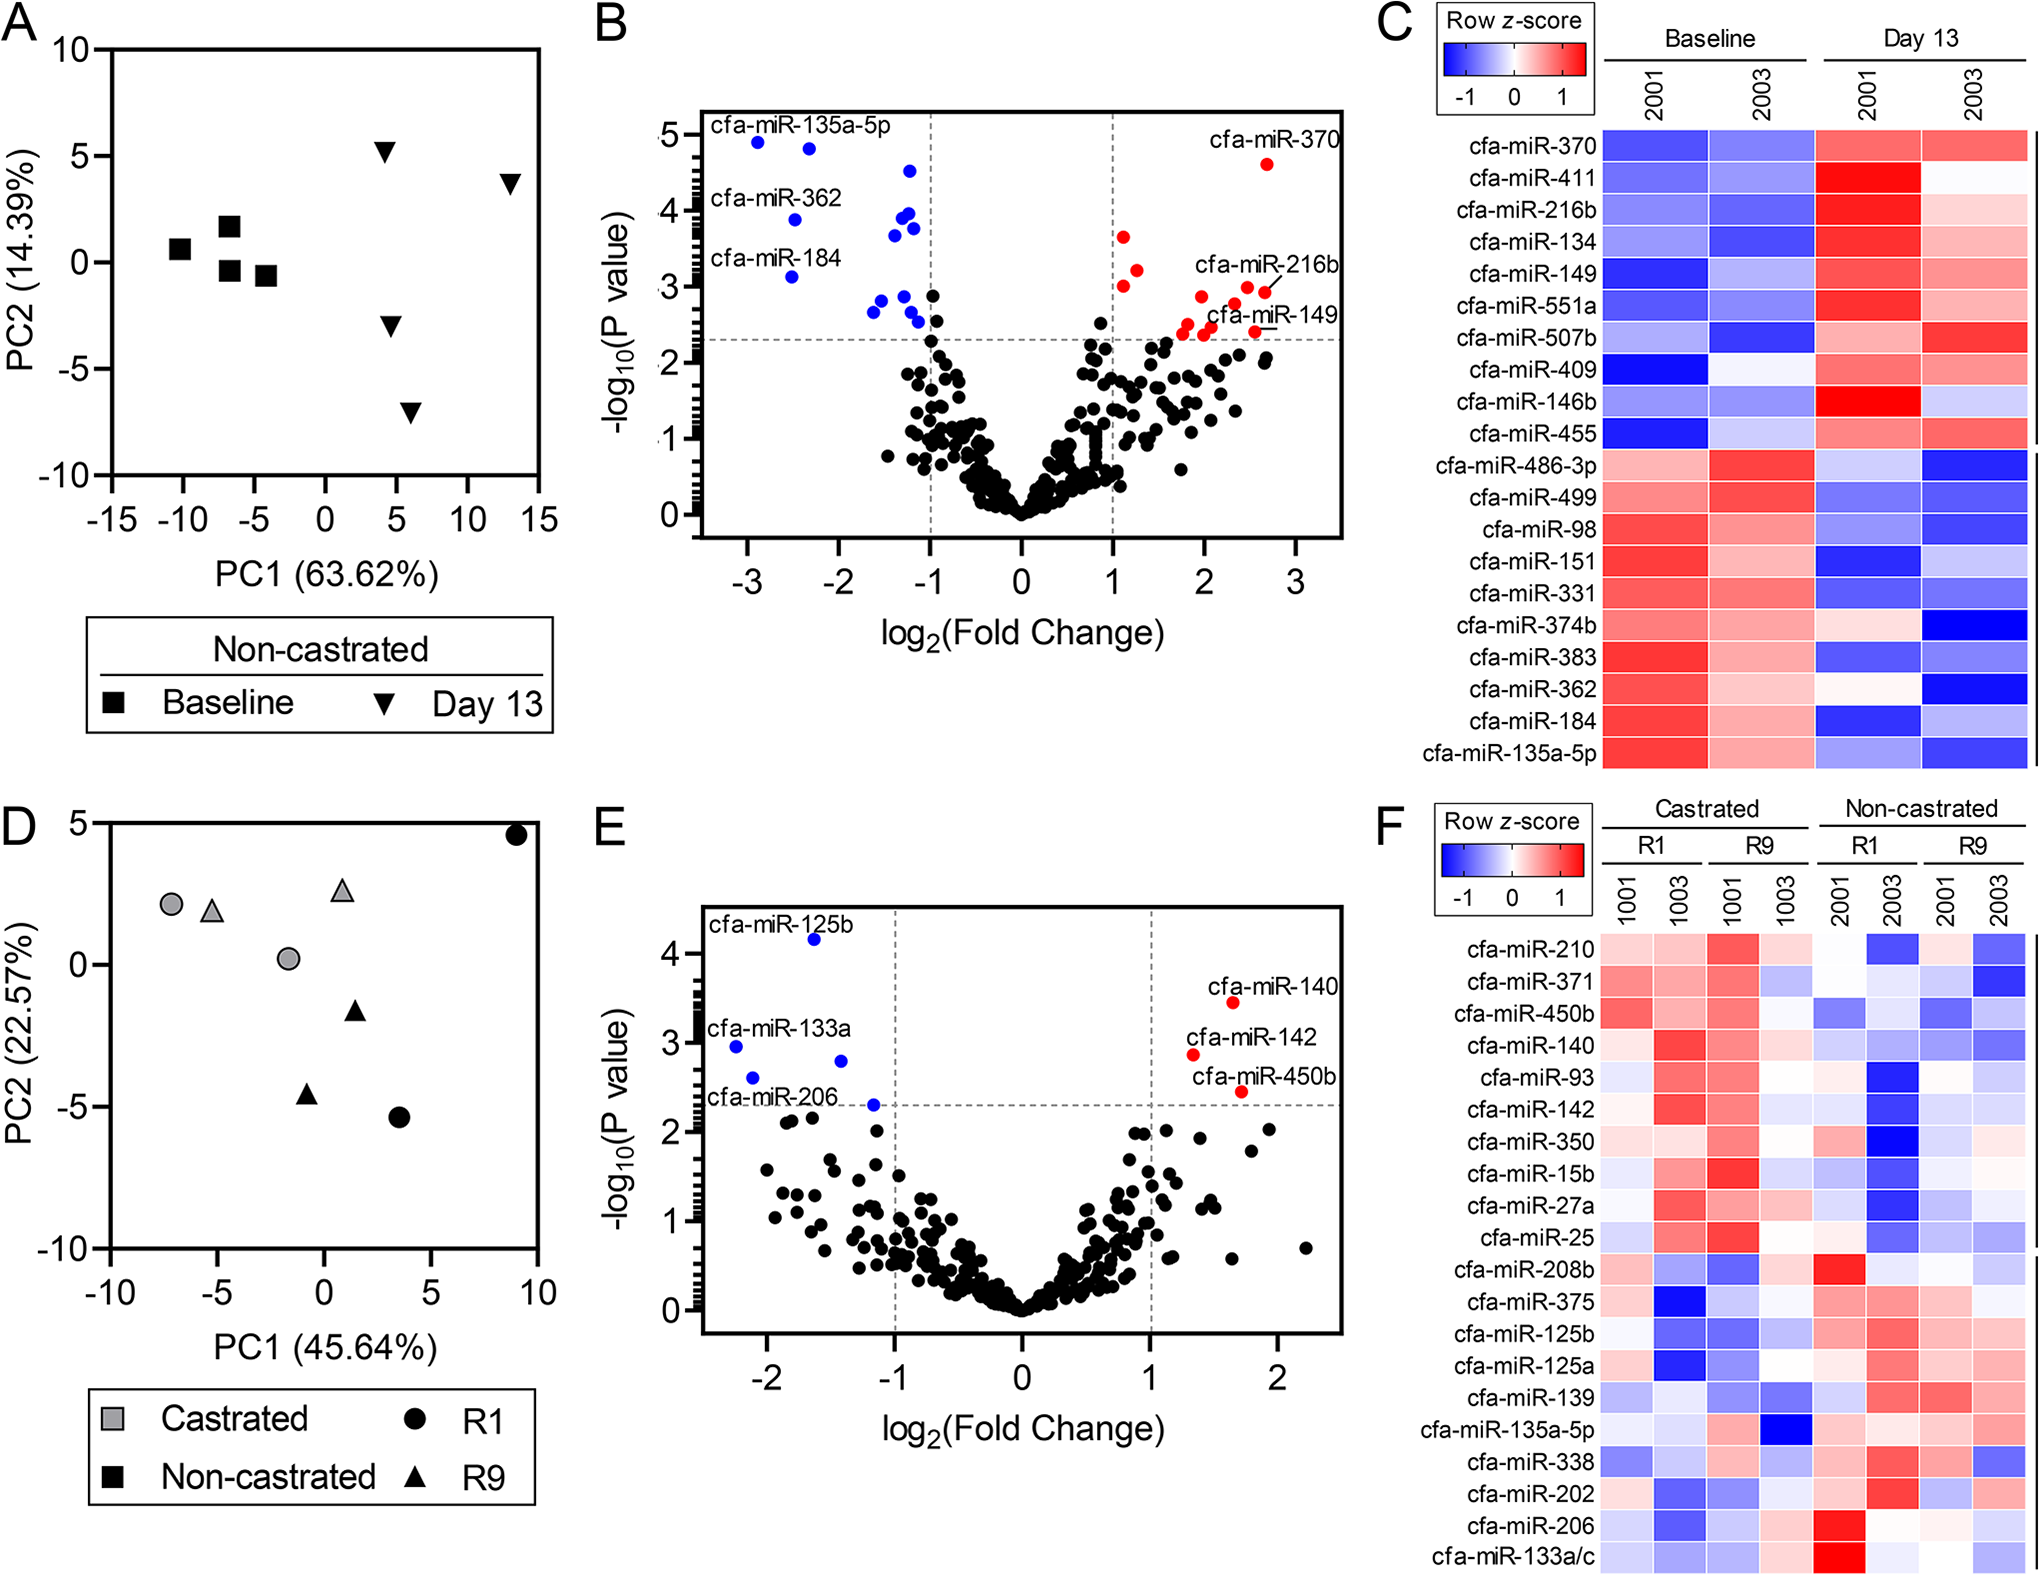
Differentially abundant circulating miRNAs detected by small RNA-seq. Differentially abundant mature miRNAs in the serum of dogs are visualized by principal components analyses, volcano plots, and heatmaps of the small RNA-seq UMI method. The percent variance explained by each principal component is indicated on the PCA plot axes. Each heatmap shows the log2 (normalized counts) of the 10 most increased and 10 most decreased miRNAs. A-C, Baseline compared to day 13 of dosing in the non-castrated dogs. The P value reference line shown in (B) is P = 0.005. The average of 2 biological replicates is depicted in (C). miR-133a indicates miR-133a/c. D-F, Non-castrated compared to castrated dogs during the recovery period. R1 represents recovery day 1 for dogs 1001, 1003, and 2003, and recovery day 2 for dog 2001. R9 represents recovery day 9 for dogs 1001, 2001, and 2003, and recovery day 8 for dog 1003. The P value reference line shown in (E) is P = 0.05. miRNA indicates microRNA; PCA, principal components analysis; RNA-seq, RNA sequencing.
Differentially abundant miRNAs between non-castrated versus castrated animals revealed fewer miRNAs than the baseline versus dosing day 13 comparison. The recovery day comparison between non-castrated and castrated animals (ie, recovery days compared between non-castrated and castrated groups) yielded a total of 26 differentially abundant miRNAs using the UMI method (Figure 5D-F). Of these miRNAs, 10 miRNAs were elevated, while 16 miRNAs were depleted in non-castrated animals compared to the castrated, negative controls (Figure 5E). Principal components analysis showed separation between non-castrated and castrated dogs; however, recovery days 1 and 9 did not separate (Figure 5D). Of the 10 most elevated miRNAs in non-castrated versus castrated animals during the recovery period (Figure 5F), 1 is enriched in the testis (miR-202), 3 miRNAs are enriched in the brain (miR-139, miR-135a-5p, miR-338), 3 are enriched in heart and/or striated muscle (miR-208b, miR-206, miR-133a), and 2 are enriched in the pancreas (miR-375, miR-135a-5p). 29 Of the 10 most depleted miRNAs (Figure 5F), 2 have been shown to be enriched in certain tissues; these are miR-450b in bone marrow and testis, and miR-25 in bone marrow and plasma. In summary, small RNA-seq detected dozens of differentially abundant miRNAs that are potential biomarkers of testicular toxicity in dogs.
Identification of Filtered miRNAs for Confirmation Studies
To select potential miRNA biomarkers of testicular toxicity for confirmation by RT-qPCR, we filtered the UMI and non-UMI data sets while also considering miRNA expression in canine testis tissue from the beagle dog tissue atlas database. 29 To this end, we applied iterative filtering to the differential expression analyses comparing various control and experimental groups. The criteria for these filters were fold change, average expression across samples, statistical significance, and testicular expression (Table 2).
Filters to Select Candidate miRNA Biomarkers From RNA-seq Data.a
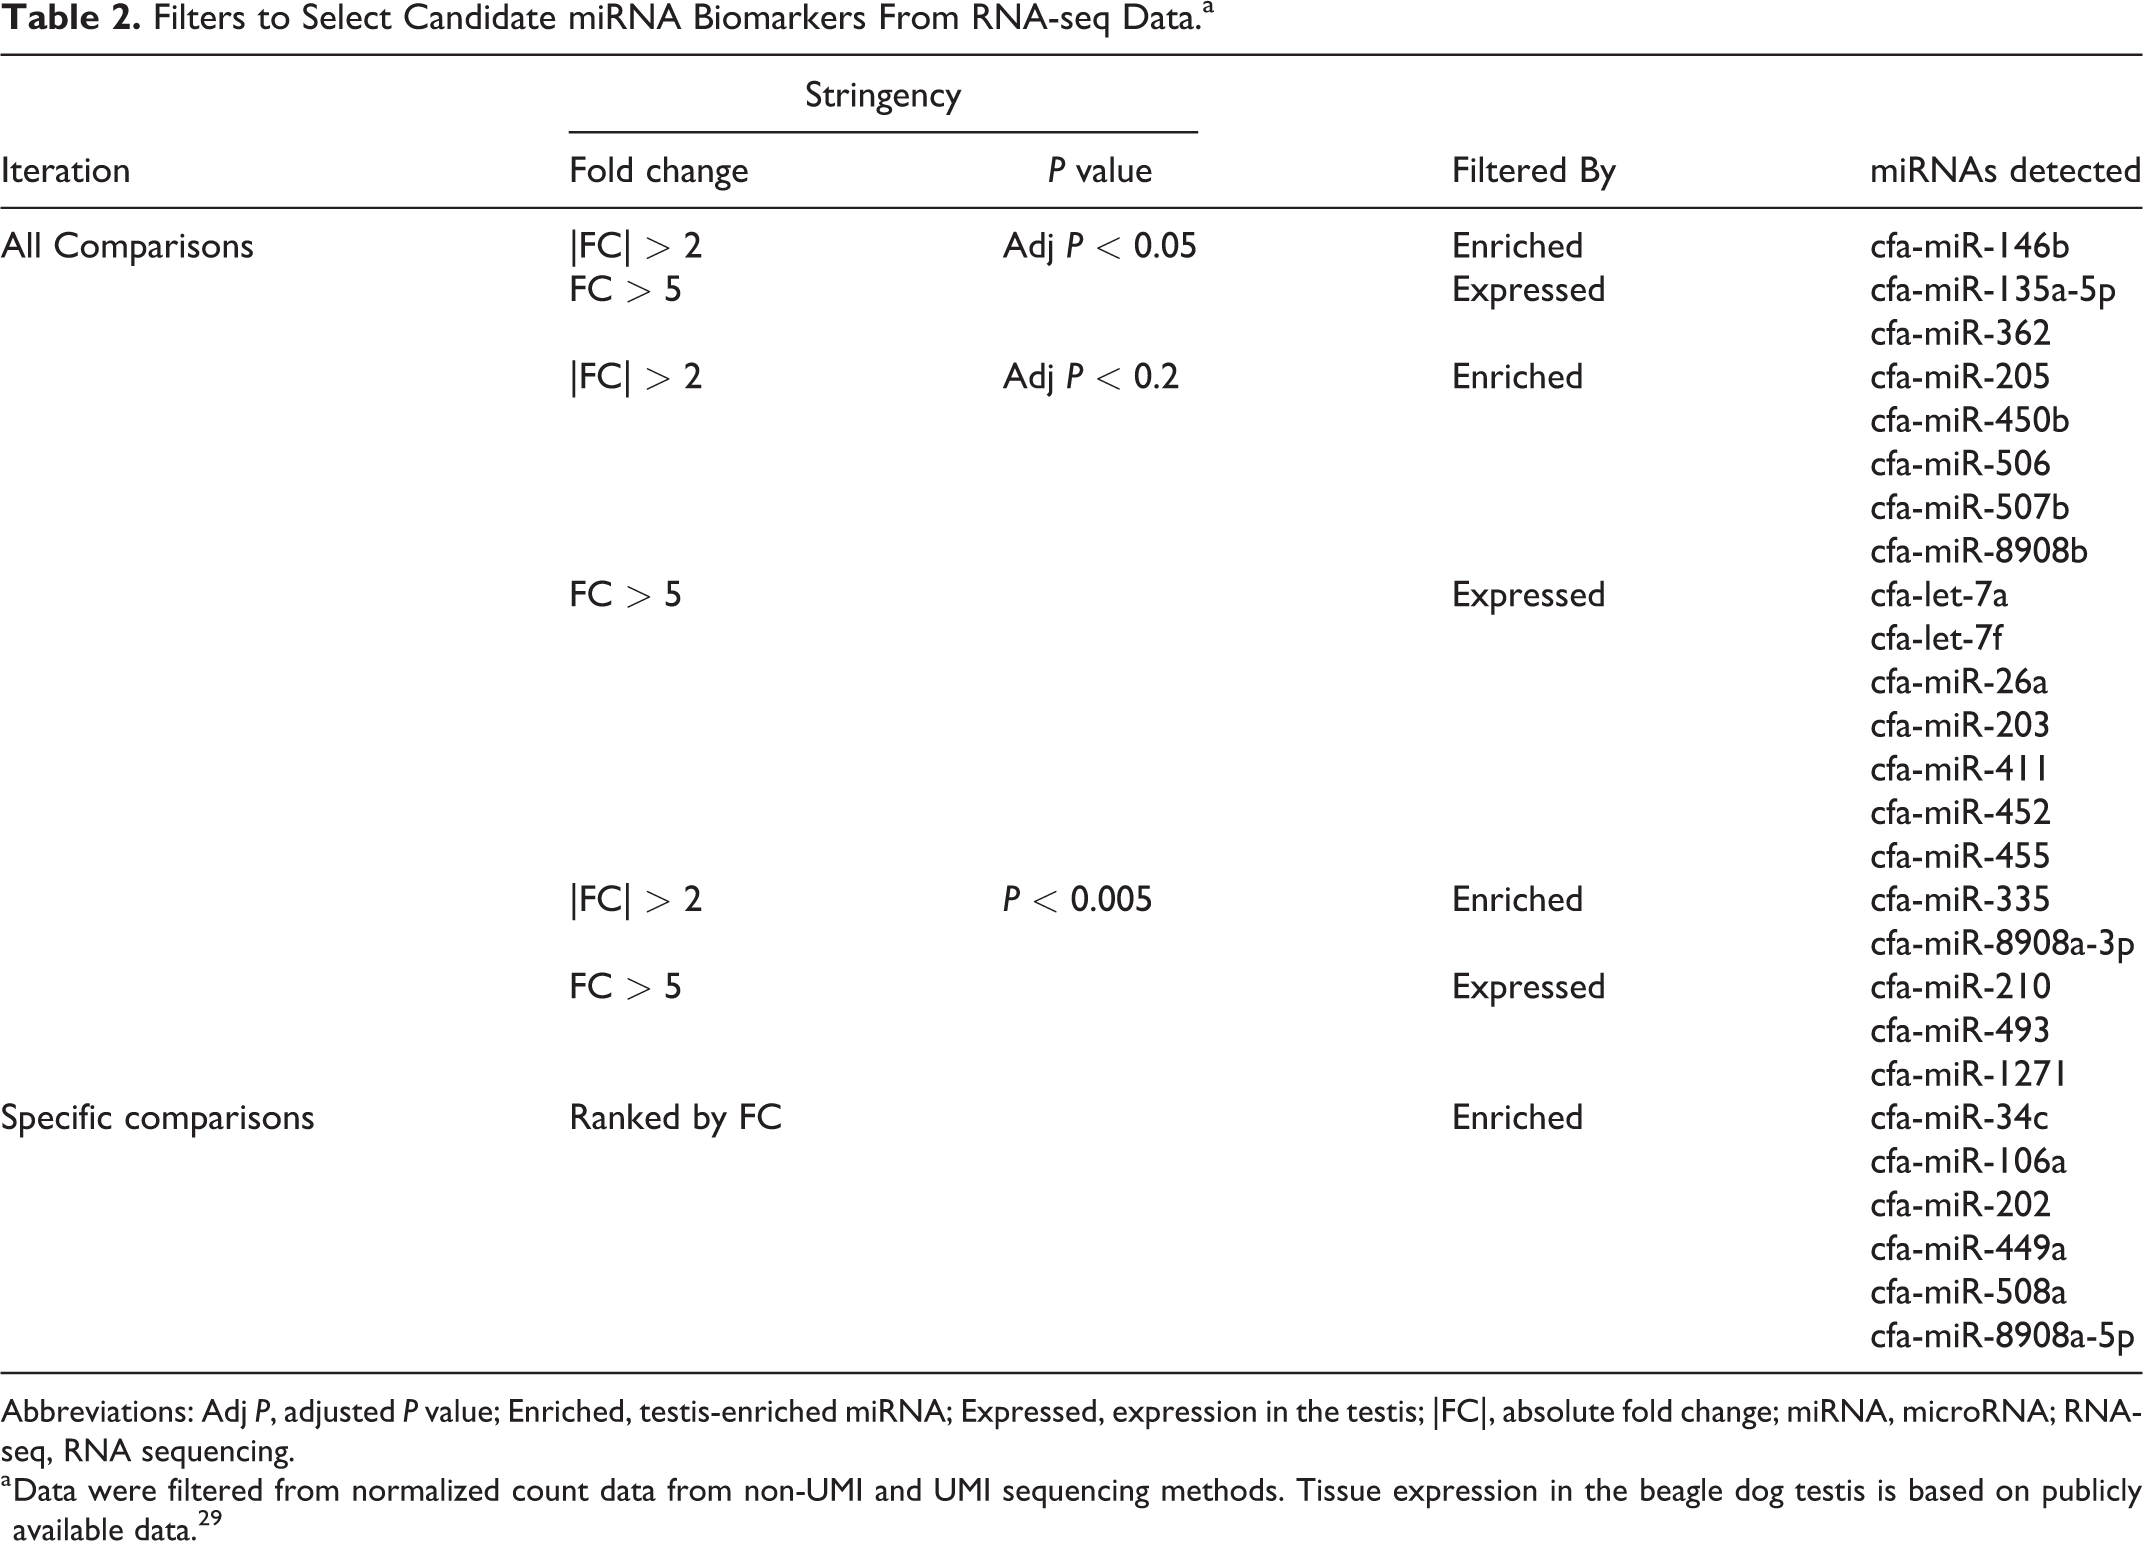
Abbreviations: Adj P, adjusted P value; Enriched, testis-enriched miRNA; Expressed, expression in the testis; |FC|, absolute fold change; miRNA, microRNA; RNA-seq, RNA sequencing.
a Data were filtered from normalized count data from non-UMI and UMI sequencing methods. Tissue expression in the beagle dog testis is based on publicly available data. 29
While filtering the data, we noticed that most of the miRNAs that were removed are not tissue-enriched. Given that upregulated miRNAs were found in testis tissue of EGME-treated monkeys, 33 we aimed to identify miRNAs that are expressed in the testis but not enriched in any tissues. Our rationale is that under normal conditions, a circulating biomarker could be present at basal levels in the blood, but under testicular injury, expression induction could occur thereby causing release of the biomarker into the circulation. Therefore, for non-enriched miRNAs passing the 3 filters in Table 2, we examined the published beagle dog miRNA tissue atlas by Koenig et al. 29 We reasoned that any testis expression of an miRNA should be sufficient relative to other tissues, so we chose a cutoff of ≥15% miRNA expression in the testis versus the tissue having the highest expression of the miRNA. Using this approach, we only considered miRNAs with an absolute fold change > 5 between experimental versus negative controls and added 12 miRNAs to the confirmation list (Table 2). In summary, the iterative filtering process revealed 14 testis-enriched miRNAs and 12 miRNAs expressed in the testis for measurement in follow-up confirmation studies.
Confirmation of Potential miRNA Biomarkers of Testicular Toxicity
To confirm the miRNAs identified by filtering the RNA-seq data, we performed RT-qPCR analysis on serum samples collected from the remaining time points of the EGME-treated dogs. We normalized each animal to its own baseline samples collected during the week prior to dosing. Spike-in C elegans miR-39-3p served as an internal control for normalization, and ΔΔCT analysis was used to calculate fold changes relative to the averaged baselines. We obtained data from 24 of 26 commercially available miRNA RT-qPCR assays.
Using ΔΔCT analysis, we discovered that there was dramatic temporal variability in both testis-enriched miRNAs and miRNAs expressed in testis (Figure 6AB). There was considerable day-to-day variation in miRNA levels in the baseline serum samples, with no detectable difference between non-castrated and castrated animals for each miRNA (Supp. Material 4). Although several time points in the non-castrated dog 2003 showed increased miRNA abundance over baseline ranges (eg, miR-146b, miR-205, miR-335, miR-203), these elevations were not observed in dog 2001 as well. Furthermore, miRNA elevations were generally transient and intermittent. A notable exception was miR-146b which had at least an 8-fold increase from day 9 to 16 in non-castrated dog 2001. Some overall trends were apparent; for example, levels of miR-450b decreased below baseline levels on days 5 to 6 in all treated animals (Figure 6A). A decline below the baseline range was also seen in let-7a as early as day 3 and again on most days until day 18 (Figure 6B). However, all 24 miRNAs we tested did not demonstrate a separation in miRNA abundance between non-castrated and castrated dogs (Figure 6 and Supp. Material 4). No significant differences were detected between non-castrated and castrated groups when averaging the animals together (Supp. Material 4). Collectively, these results underscore the need to evaluate baseline variability of circulating miRNAs in biomarker studies and suggest that EGME-induced testicular toxicity may be undetectable by a testis-specific miRNA biomarker.
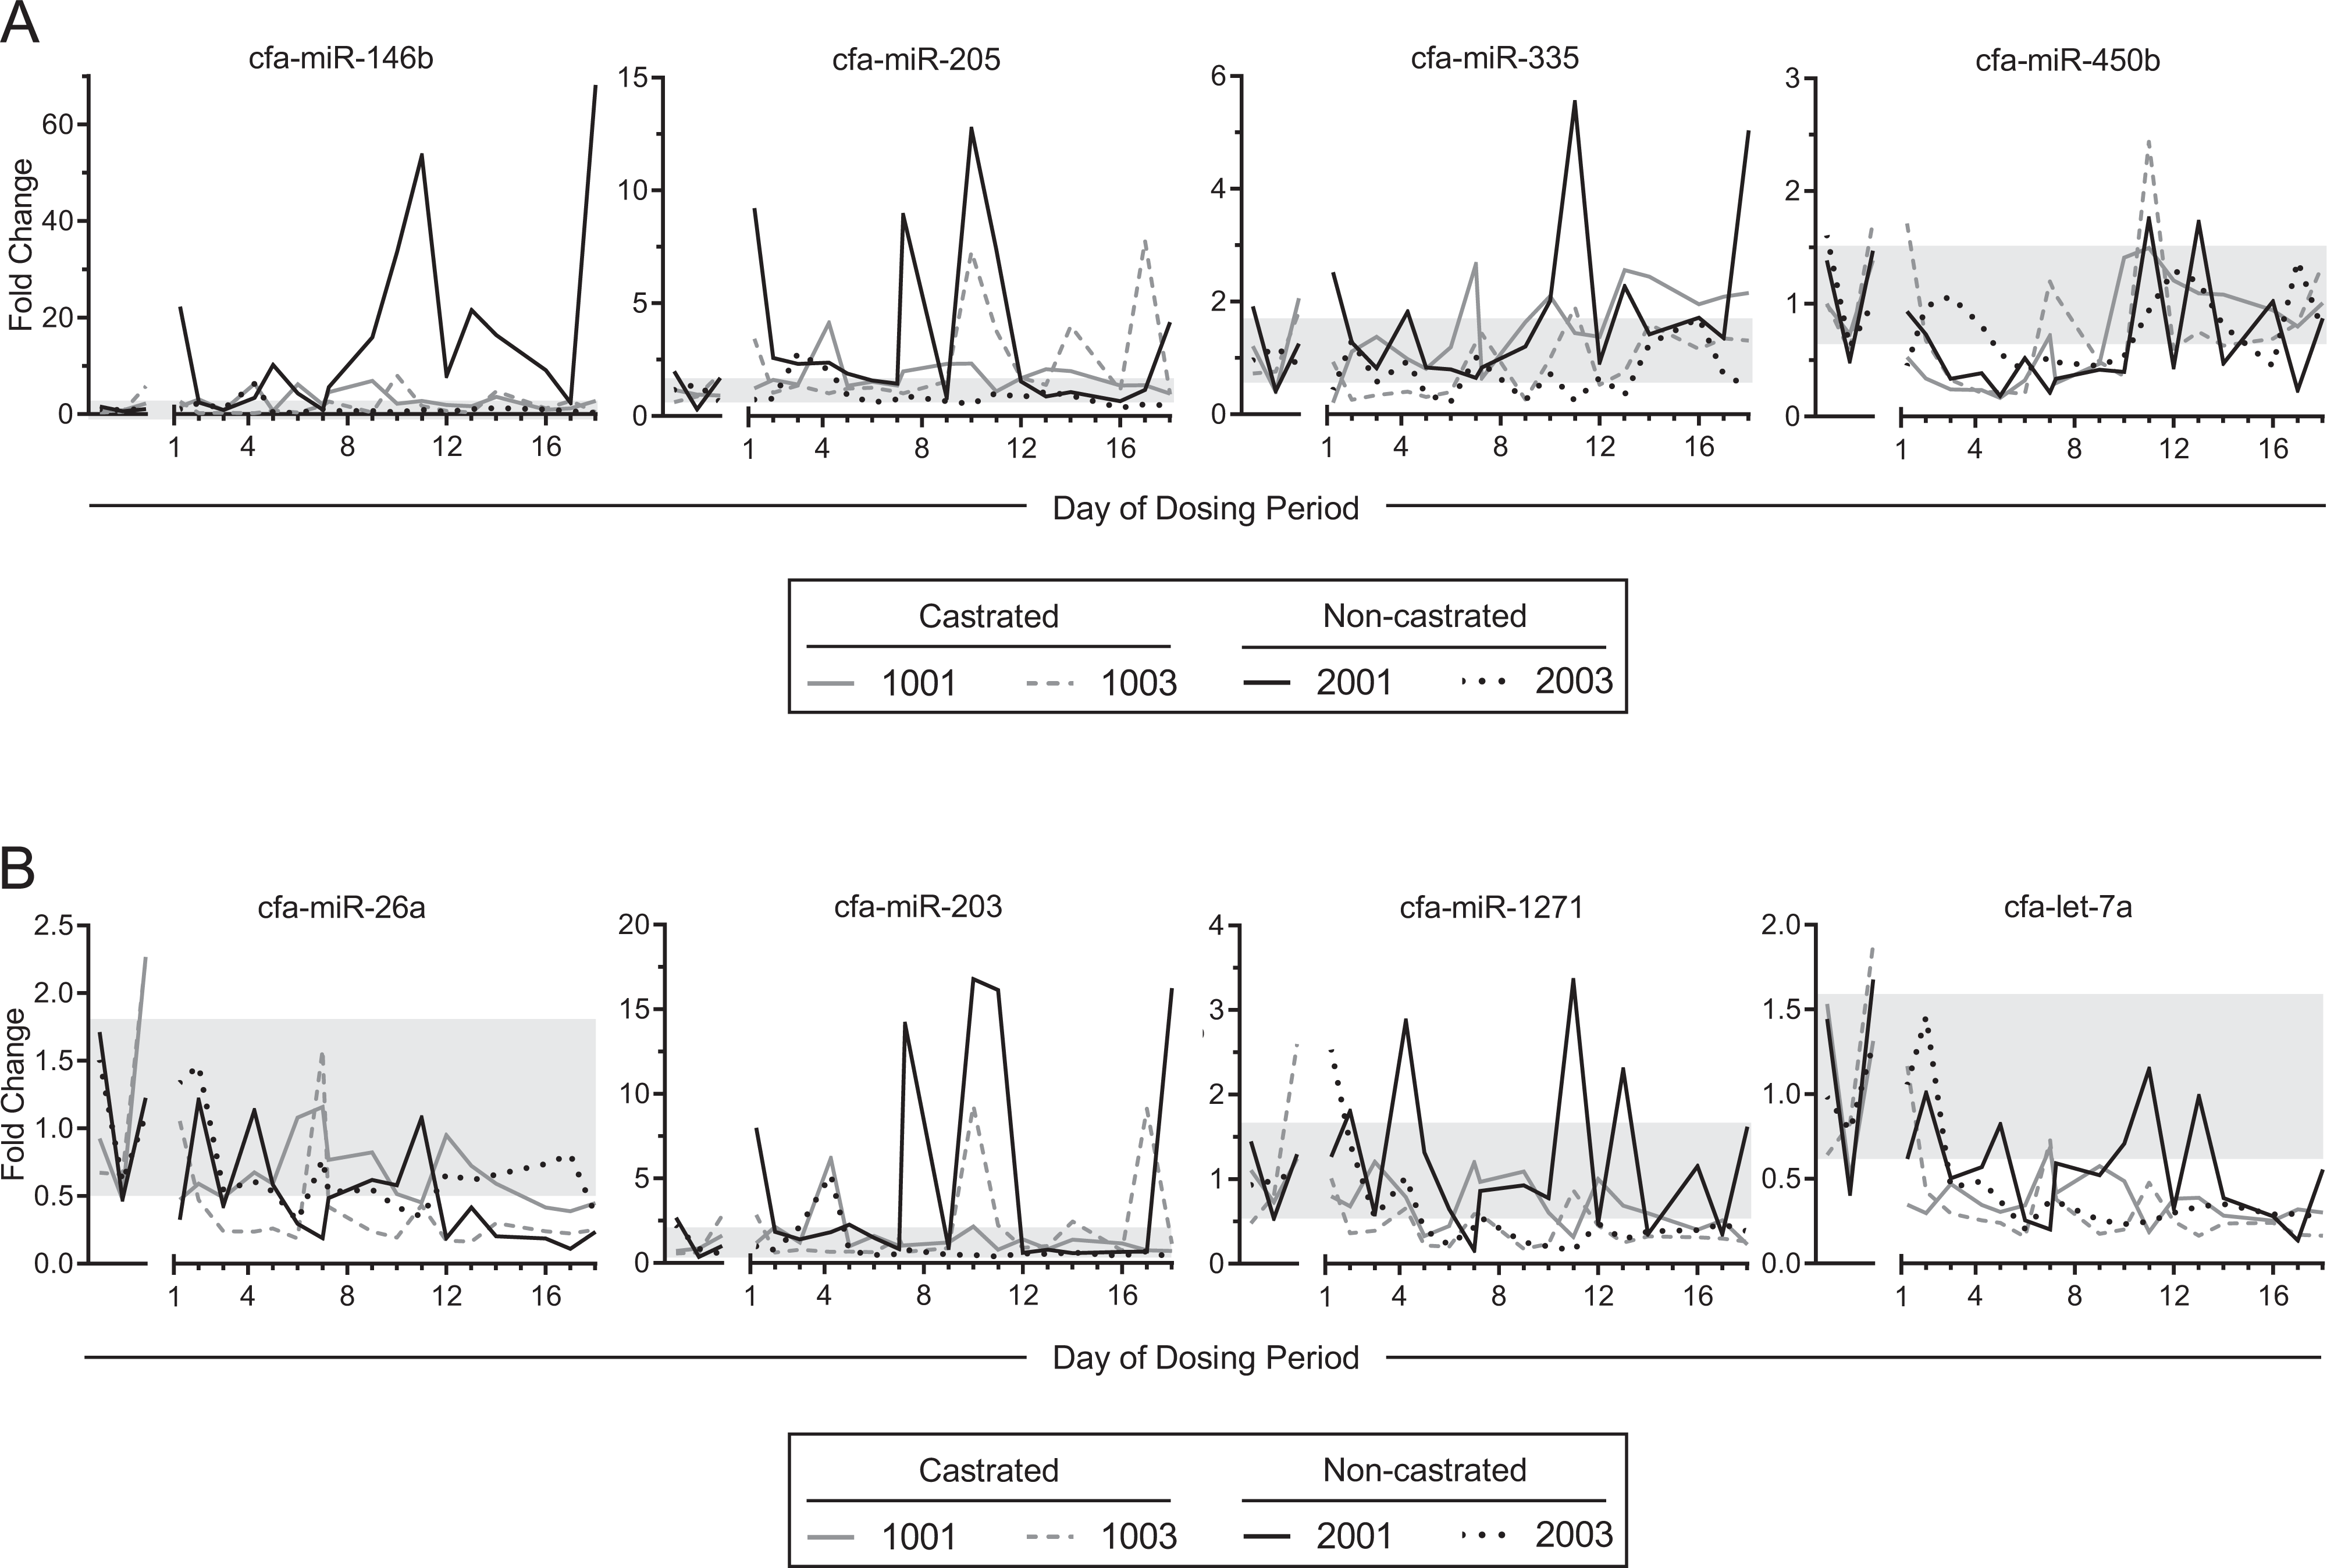
Confirmation of circulating miRNA levels in dogs treated with EGME. RT-qPCR was conducted on serum samples from castrated and non-castrated dogs on the indicated days during the dosing period. Representative data of (A) testis-enriched miRNAs and (B) miRNAs expressed in testis are shown. Fold changes were determined by the ΔΔCt method, where Ct values were normalized to spike-in cel-miR-39-3p and the average of the three baseline samples collected. The shaded region indicates the range of the baselines (ie, mean ± 1 SD of all the baseline samples). Additional miRNAs measured by RT-qPCR are shown in Supplemental Material 4. EGME indicates ethylene glycol monomethyl ether; miRNA, microRNA; RT-qPCR, reverse transcription quantitative polymerase chain reaction.
Discussion
Herein, we report the results of an exploratory study to identify circulating miRNA biomarkers of testicular toxicity in dogs, which is an important non-rodent species in pharmaceutical safety testing. Oral dosing of the testicular toxicant EGME was well tolerated at 50 mg/kg/d for up to 28 days and associated with mild-to-moderate seminiferous tubule degeneration in non-castrated dogs. The serum of these animals was surveyed by 2 small RNA-seq methods, followed by confirmatory RT-qPCR of the differentially abundant miRNAs discovered by RNA-seq. Differential expression analyses of all the RNA-seq data indicated that several miRNAs were differentially present in potentially biomarker-positive, non-castrated dogs compared to negative control, castrated dogs, as well as between day 13 versus baseline samples in the non-castrated dogs. In preliminary confirmation studies, cfa-miR-146b was the most promising biomarker candidate because it was elevated by >8-fold in a non-castrated dog compared to baseline while not showing elevation in the castrated controls. Other miRNAs did not show sustained alterations over multiple days by RT-qPCR. From our perspective, the ideal diagnostic biomarker would increase before irreversible toxic effects and stay elevated for all affected individuals. This study was not able to detect a miRNA with this pattern of longitudinal performance. Although an experiment with more animals would provide additional statistical power, the chief benefit of greater group size would be an increased ability to correlate histopathologic severity with any candidate biomarker performance. The present data indicate that with mild-to-moderate testicular injury, no biomarker cutoff point would have satisfactory performance for the animals in this study.
Our histopathological findings of EGME testicular toxicity in the dog are consistent with previous reports in dogs, rodents, and cynomolgus monkeys. In dogs, Stenger and colleagues reported histopathology of EGME dosed at 100 and 500 µL/kg/d for 22 days intravenously and 50, 100, and 200 µL/kg/d for 13 weeks orally. 34 After 22 days, only injection site reaction and thrombophlebitis were described; internal organs were unremarkable. After 13 weeks at 200 µL/kg/d, loss of late stages of germ cells and flattening of the seminiferous epithelium with retention of spermatogonia were described. In rats treated with 500 mg/kg of EGME for 24 hours, 35 the earliest affected cells in the seminiferous tubule to degenerate were the pachytene spermatocytes in meiosis (stage XIV), early (stages I-III), and late (stages IX-XIII) stages of the spermatogenic cycle, as defined by Leblond and Clermont. 36 In guinea pigs, the pachytene spermatocyte was also described as the primary target cell after 3 oral EGME doses of 200 mg/kg. 37 Our dog study did not have a 24-hour histopathology time point, but we did observe loss and degeneration of pachytene spermatocytes in our dose-selection study as well as after 14 and 28 days of dosing. Larger populations of affected cell types were apparent, including degenerative changes and loss of germ cells in all stages of spermatocytes and spermatids, mainly due to the prolonged dosing period. In addition, we describe loss of round and elongated spermatids after 14 days of dosing consistent with the maturation depletion of stages subsequent to pachytene spermatocytes described with extended dosing in the rat. The histopathologic findings in our dog study are also consistent with decreased pachytene spermatocytes and round spermatids observed in cynomolgus monkeys dosed with 300 mg/kg of EGME for 4 days, 33 although our dose in the RNA profiling study was considerably lower. Overall, our pathology findings in the dog are consistent with EGME testicular histopathology findings previously reported in other species.
To our knowledge, this is the first investigation to use dogs as the preclinical species in a miRNA testicular biomarker study. We used dogs that were over 2 years of age, which eliminated confusion that might arise from sexually immature dogs which have a different testicular miRNA expression profile. 38 Dogs reach sexual maturity at a range of 8 to 12 months of age. 39 -41 Under our current company practices, dogs for 1-month GLP studies are started on study at 9 to 10 months of age and are at least 8 months of age for any toxicology study. Nonetheless, incomplete sexual maturation at microscopic examination of tissue remains an occasional finding that may impact the utility of miRNAs as biomarkers for toxicity. Our most promising biomarker candidate, miR-146b, had >30-fold greater expression in the testis of sexually mature dogs versus prepubertal dogs. 42 Therefore, the performance of miR-146b might be expected to be poor in immature dogs. Previously, a few studies have assessed miRNAs in the testis or circulation following induction of testicular injury in rats or cynomolgus monkeys. 4,33,43,44 In monkeys, EGME was also chosen to model testicular damage at 300 mg/kg/d for 4 consecutive days. Microarray analysis revealed no upregulated miRNAs and 326 downregulated miRNAs in plasma of treated versus vehicle animals. 33 The only testis-enriched miRNAs in common between our selected RNA-seq data and the monkey EGME study reported by Sakurai and colleagues were miR-449a and miR-34c, which were downregulated in monkey testis tissue. However, the lower number of mature miRNAs annotated in the dog (453) compared to human (2654) limits the utility of the comparison (miRBase v22). A second study, also performed in monkeys, used testicular hyperthermia to induce slight-to-moderate spermatocyte and spermatid degeneration, and severe loss of spermatids, without adverse clinical signs or hematology changes. 43 Similar to our results, Sakurai and colleagues reported no increase in plasma abundance of miR-34c-5p or miR-202-5p after the induction of slight-to-moderate injury.
The advantages of miRNA biomarkers include widely available quantitative methods with high sensitivity. PCR amplification sequence bias might result in inaccurate results starting at the library preparation step. Therefore, we performed small RNA-seq using 2 different workflows and found highly concordant normalized miRNA counts between UMI and non-UMI methods, despite differences in RNA isolation and sequencing protocols. The UMI method demonstrated a greater number of significant miRNA alterations by differential expression analysis between testicular injury versus baseline and castrated groups. The use of gel electrophoresis for size selection of amplification products in the non-UMI method may have resulted in the loss of low abundance products. Wong and coworkers compared next-generation sequencing methods and postulated that size selection by gel electrophoresis could result in decreased miRNA diversity due to incomplete recovery of low abundance miRNAs. 45 We conclude that sequencing methods which avoid gel electrophoresis for amplification product size selection may allow improved detection of low abundance miRNAs.
An advantage of our study design was daily blood collection that provided the opportunity to visualize the temporal variability of miRNAs by RT-qPCR over 18 days. Our data showed substantial day-to-day variability in miRNA levels in all animals, consistent with a short-lived serum miRNA half-life and intermittent release into blood. However, the biological mechanism for the highly variable miRNA levels during baseline, EGME treatment, and recovery remains unclear. Our data are not unusual in this regard. While few longitudinal daily measurements of circulating miRNAs have been published, in a qPCR-based study, intra-individual day-to-day variance of 5 miRNAs was 70% to 100% in healthy male volunteers. 46 Moreover, an international collaboration found that miR-122 has high intraindividual variability in healthy volunteers, contributing to deprioritization of this miRNA as a clinical biomarker of drug-induced liver injury by the Predictive Safety Testing Consortium. 47 Although we did not have sufficient sample volumes to correlate RT-qPCR directly with the sequencing data, existing literature finds an 85% to 90% concordance between PCR and sequencing overall. 48 Therefore, the high day-to-day variability in miRNA levels is likely a biological phenomenon. To enable the use of miRNAs as biomarkers of testicular toxicity, it will be necessary to overcome high day-to-day variability in serum miRNA levels either by setting high cutoff values or averaging multiple collection time points. Our data suggest that changes of >5-fold in miRNAs may be necessary to distinguish positive signals from baseline variation. For miR-146b, we did observe increases in dog 2001, which had more severe testicular toxicity, greater than 8-fold over baseline for 1 week after treatment, suggesting this could be a candidate biomarker of testicular injury in the dog. Given the EGME-treated castrated dog miR-146b levels were unchanged from baseline, we postulate that the testis was the source of this miRNA despite its expression in both testis and brain.
To enter the systemic circulation, miRNAs expressed in seminiferous tubules must transit the blood–testis barrier. The severity of testicular injury capable of causing reproducible leakage of miRNAs from the testis is uncertain. Our research suggests that the mild-to-moderate injury caused by EGME is insufficient for significant release of miRNAs into the blood, presumably due to the persistence of the blood–testis barrier. This finding corroborates the lack of elevation in plasma miRNAs from monkeys treated with EGME, 33 and in serum of rats treated with the EGME metabolite methoxyacetic acid (MAA). 17 Notably, the testis is the organ with the second highest number of tissue-enriched miRNAs in dog, yet robust serum changes were not observed. 29 In rats with severe testicular injury induced by cadmium chloride, serum levels of highly testis-enriched miRNAs miR-202-5p, miR-471-5p, and miR-741-3p were markedly elevated. 17 Independently, leakage of proteins from seminiferous tubules was shown in a dose-dependent manner by cadmium chloride but not by MAA in rats, 49 posing the question of whether cadmium chloride is unique among testicular toxicants to induce general leakage due to loss of the blood–testis barrier. The degree of miRNA release may be limited by the total mass of affected tissue. Sakurai et al hypothesized that leakage from small organs would suffer from a lack of sensitivity, which may account for undetectable increases of testicular-origin serum miRNAs following mild-to-moderate testicular injury. 43 In contrast, liver miRNAs originate from a large organ and do not need to cross a tight-junction cellular barrier. Thus, the use of miRNAs to detect testicular injury may have inherently low sensitivity to mild or moderate injury.
In conclusion, the day-to-day variability in circulating miRNA abundance and the need to cross the blood–testis barrier may limit future development of miRNAs as biomarkers of toxic testicular injury. To overcome this variability, high cutoff values of miRNA abundance may be selected to avoid false-positive results, but at a loss of sensitivity, particularly for minimal-to-moderate levels of injury. Alternatively, repeat sampling methods may be used to average out variability, but at significant increased resource demands for both nonclinical and clinical study design. Our approach of using sequencing methods to select candidates favors the use of methods without gel electrophoresis size selection of PCR products for maximizing sensitivity but might also benefit, in the future, from pooled sample analysis to overcome day-to-day variation. Larger group size would allow a better correlation of the range of toxicity severity with biomarker activity, but pooling serial samples seems more likely to identify additional biomarkers that would have been useful for diagnosing the mild-to-moderate testicular toxicity for the dogs in this study. The use of castrated controls in this study allowed us to distinguish between miR-146b release from brain or testis, and it remains our best candidate for a useful and specific biomarker of moderate testicular injury in the dog from these data.
Supplemental Material
Supplemental Material, Supp_1 - Small RNA Sequencing to Discover Circulating MicroRNA Biomarkers of Testicular Toxicity in Dogs
Supplemental Material, Supp_1 for Small RNA Sequencing to Discover Circulating MicroRNA Biomarkers of Testicular Toxicity in Dogs by Jennifer C. Shing, Kai Schaefer, Shaun E. Grosskurth, Andy H. Vo, Tatiana Sharapova, Karen Bodié, Takahito Kambara and Wayne R. Buck in International Journal of Toxicology
Supplemental Material
Supplemental Material, Supp_2 - Small RNA Sequencing to Discover Circulating MicroRNA Biomarkers of Testicular Toxicity in Dogs
Supplemental Material, Supp_2 for Small RNA Sequencing to Discover Circulating MicroRNA Biomarkers of Testicular Toxicity in Dogs by Jennifer C. Shing, Kai Schaefer, Shaun E. Grosskurth, Andy H. Vo, Tatiana Sharapova, Karen Bodié, Takahito Kambara and Wayne R. Buck in International Journal of Toxicology
Supplemental Material
Supplemental Material, Supp_3 - Small RNA Sequencing to Discover Circulating MicroRNA Biomarkers of Testicular Toxicity in Dogs
Supplemental Material, Supp_3 for Small RNA Sequencing to Discover Circulating MicroRNA Biomarkers of Testicular Toxicity in Dogs by Jennifer C. Shing, Kai Schaefer, Shaun E. Grosskurth, Andy H. Vo, Tatiana Sharapova, Karen Bodié, Takahito Kambara and Wayne R. Buck in International Journal of Toxicology
Supplemental Material
Supplemental Material, Supp_4 - Small RNA Sequencing to Discover Circulating MicroRNA Biomarkers of Testicular Toxicity in Dogs
Supplemental Material, Supp_4 for Small RNA Sequencing to Discover Circulating MicroRNA Biomarkers of Testicular Toxicity in Dogs by Jennifer C. Shing, Kai Schaefer, Shaun E. Grosskurth, Andy H. Vo, Tatiana Sharapova, Karen Bodié, Takahito Kambara and Wayne R. Buck in International Journal of Toxicology
Footnotes
Acknowledgments
The authors thank the Genome Technology Access Center in the Department of Genetics at Washington University School of Medicine for help with genomic analysis. The Center is partially supported by NCI Cancer Center Support Grant #P30 CA91842 to the Siteman Cancer Center and by ICTS/CTSA Grant# UL1 TR000448 from the National Center for Research Resources (NCRR), a component of the NIH, and NIH Roadmap for Medical Research. This publication is solely the responsibility of the authors and does not necessarily represent the official view of NCRR or NIH. We are also grateful for the contributions of our AbbVie employees Xin Huang and Xiaoqing Yang for statistical analysis support; Yi Yang, Scott Warder, Mohan Rao, and Eric Blomme for helpful discussions; and Caitlin Krause and Areej Ammar for technical assistance. Lastly, we thank the Testicular Toxicity Working Group of the Critical Path Institute’s Predictive Safety Testing Consortium for helpful discussions and technical assistance.
Author Contributions
Shing, J. contributed to conception and design; acquisition, analysis, and interpretation; drafted manuscript; and critically revised manuscript. Schaefer, K. contributed to conception and design; acquisition, analysis, and interpretation; and critically revised manuscript. Grosskurth, S. contributed to analysis and interpretation and critically revised manuscript. Vo, A. contributed to analysis and interpretation and critically revised manuscript. Sharapova, T. contributed to acquisition and analysis and critically revised manuscript. Bodie, K. contributed to conception and design; acquisition, analysis, and interpretation; and critically revised manuscript. Kambara, T. contributed to analysis and interpretation, drafted manuscript, and critically revised manuscript. Buck, W. contributed to conception and design; acquisition, analysis, and interpretation; drafted manuscript; and critically revised manuscript. All authors gave final approval and agree to be accountable for all aspects of work ensuring integrity and accuracy.
Declaration of Conflicting Interests
The author(s) declared the following potential conflicts of interest with respect to the research, authorship, and/or publication of this article: All authors are employees of AbbVie and may own AbbVie stock.
Funding
The author(s) disclosed receipt of the following financial support for the research, authorship, and/or publication of this article: AbbVie sponsored and funded the study; contributed to the design; participated in the collection, analysis, and interpretation of data.
Supplemental Material
Supplemental material for this article is available online.
References
Supplementary Material
Please find the following supplemental material available below.
For Open Access articles published under a Creative Commons License, all supplemental material carries the same license as the article it is associated with.
For non-Open Access articles published, all supplemental material carries a non-exclusive license, and permission requests for re-use of supplemental material or any part of supplemental material shall be sent directly to the copyright owner as specified in the copyright notice associated with the article.