
Abstract
The objective of this study was to extract low frequency respiratory “artifacts” from a standard arterial blood pressure (ABP) waveform to simultaneously derive reliable breathing rates (BR). Arterial blood pressure derived BR values were characterized against respiratory rates simultaneously obtained from the Respiratory Inductive Plethysmography (RIP) system (EMKA). Reference compounds were introduced to evaluate responsiveness of the derived measures to respiratory depressants and stimulants. Male beagle dogs (n = 3) were instrumented with minimally invasive telemetry devices for measurements of ABP and heart rate. The RIP system was utilized simultaneously to collect respiratory rate, tidal volume, and minute volume of each animal following pharmacological challenges. Early results revealed the derived BR’s from ABP waveforms did not correlate well with those measured from the RIP system. Post study X-ray visualization revealed suboptimal catheter positioning, causing poor concordance of BR tallied from the ABP waveforms. Follow-up evaluations were conducted using additional animals instrumented with the ABP catheter tip placement advanced proximal to the thoracic diaphragm. Preliminary data from this subset of animals significantly improved the correlation of BR derived from ABP and respiratory rates recorded by the RIP. This proof of concept investigation was intended to evaluate an algorithm designed to extract additional data from routine cardiac waveforms. We clearly demonstrated that with optimal blood pressure catheter placement and acquisition algorithm, a reliable breathing rate can also be extracted from safety studies without the need for additional studies/animals to capture those respiratory end points.
Introduction
Respiratory rate is an important parameter typically captured as part of safety pharmacology core battery as described in ICH S7A guidance document. 1 However, the current respiratory functional measurements involve dedicated instruments and equipment such as a plethysmography chambers and associated data capture systems. Therefore, developing an alternative approach to assessing changes in respiratory rate without invoking a separate dedicated study, requiring additional animal use has substantial merit from various vantage points. It has been reported in the literature that respiratory frequency extraction from blood pressure signals was successfully performed and validated in clinical settings. 2,3 However, while the breathing rate derivation feature is available commercially (EMKA), such an evaluation has not been published in animal studies prior to the poster presented at the Safety Pharmacology Society meeting in 2018. 4 The objective of this nonclinical laboratory study was to evaluate the potential extraction of a breathing rate (BR) measurement from a continuous arterial blood pressure (BP) waveform using the EMKA extraction algorithm and compare these values to those simultaneously obtained from the Respiratory Inductive Plethysmography (RIP) system in dogs. To test the potential range of changes that might be seen in studies launched for safety assessment purposes, reference standards (theophylline, a respiratory stimulant and dexmedetomidine, a respiratory depressant) were also incorporated into this proof of concept model.
Methods
This study was conducted in accordance with the Novartis Animal Care and Use Committee-approved protocol in compliance with the guidelines provided by the Guide (8th edition) and with facility Standard Operating Procedures. Three male beagle dogs (24-36 months of age and weighing 9-13 kg) fitted with telemetry jackets and respiratory bands (EMKA RIP system) were also previously implanted with telemetry transmitters (EasyTel +_PT, EMKA). Each dog received theophylline (15, 30, and 50 mg/kg, orally) and dexmedetomidine (0.0028 and 0.0056 mg/kg, intramuscular) with a minimum washout period of 2 days between doses. The doses of theophylline and dexmeditomidine were selected based on a literature review and personal communications. 5 The telemetered arterial blood pressure (ABP) catheter was intended to be advanced approximately 28 to 32 cm via the femoral artery to be secured in place after reaching a level nearing the abdominal/ thoracic aorta. X-ray images were taken early in the investigation subsequently revealing incomplete advancement (Figure 3A), which was corrected with advancement of the catheter to the desired position (approximating the thoracic aorta above the level of the kidneys) for optimal signal collection (Figure 3B). A crossover dosing paradigm was used for both reference compounds. Telemetry recordings were made with the animal in its cage using EMKA IOX data acquisition system. Telemetry data were continuously recorded for 2 hours predose through 6 hours post dose for dexmedetomidine and 2 hours predose through 24 hours post dose in the theophylline cohort. Heart rate, blood pressure, respiratory rate, tidal volume, and minute volume were analyzed from the last 15-minute epoch of every hour to minimize the influence of toxicokinetic blood sampling and dosing procedures. Algorithms built into the EMKA analysis software (ECGAuto selection: “Breathing Rate”) were designed to automatically extract low frequency cycles (thoracic pressure changes induced by breathing) coincident within the ABP waveforms and were used to calculate breathing rate. Breathing rates (BR) were then logged at 15 minute intervals aligned with all the other collected variables in the investigation. Blood samples (approximately 0.5 mL in vacutainer containing EDTA) were collected at 0.5, 1, 3, 6, and 24 hours after theophylline and at 0.5, 1, 3, and 6 hours after dexmedetomidine for drug plasma concentration determinations.
Results
Theophylline
Respiratory Inductive Plethysmography System: Respiratory rate was not increased following 15 mg/kg. However, it was increased following theophylline with maximum vehicle-adjusted mean maximum increases of 15 (44%) and 13 breaths/min (36%) after 30 and 50 mg/kg, respectively (data not shown). The effects on respiratory rate peaked at approximately 3 hours post dose and returned to the baseline levels at approximately 8 hours post dose. Minute volume was also increased following theophylline (data not shown). Theophylline had no effects on tidal volume at any dose level.
Breathing rate derived from ABP waveforms: The extracted signals derived from the ABP waveforms aligned with the RIP data capture, failed to detect changes in derived respiratory rates after 15 and 30 mg/kg. However, derived breathing rate was shown to be increased with a maximum vehicle-adjusted mean increase of 13 breaths/min (+56%) only after 50 mg/kg (data not shown). The effects on derived respiratory rates peaked at approximately 3 hours post dose and returned to the baseline levels at approximately 8 hours post dose.
Dexmedetomidine
Respiratory Inductive Plethysmography System: Respiratory rate was decreased following dexmedetomidine with maximum baseline-adjusted mean decreases of 12 (37%) and 18 breaths/min (56%) after 0.0028 and 0.0056 mg/kg, respectively. The depressant effects on respiratory rate reached a maximum level at approximately 20 to 24 minutes post dose. Meanwhile, respiratory rate following vehicle was increased up to 19 breaths/min (65%) during the same time period. Minute volume was also decreased after dexmedetomidine (data not shown). Dexmedetomidine had no effects on tidal volume measured by the RIP System.
Breathing rate derived from ABP signals: Derived BR were decreased with maximum baseline-adjusted mean decreases of 10 (42%) and 17 bpm (63%) after 0.0028 and 0.0056 mg/kg, respectively (data not shown). The effects on derived respiratory rate achieved trough levels at approximately 24 to 30 minutes post dose. Meanwhile, the respiratory rate following vehicle was increased up to 6 bpm (23%) during the same time period.
Theophylline and Dexmedetomidine Exposure
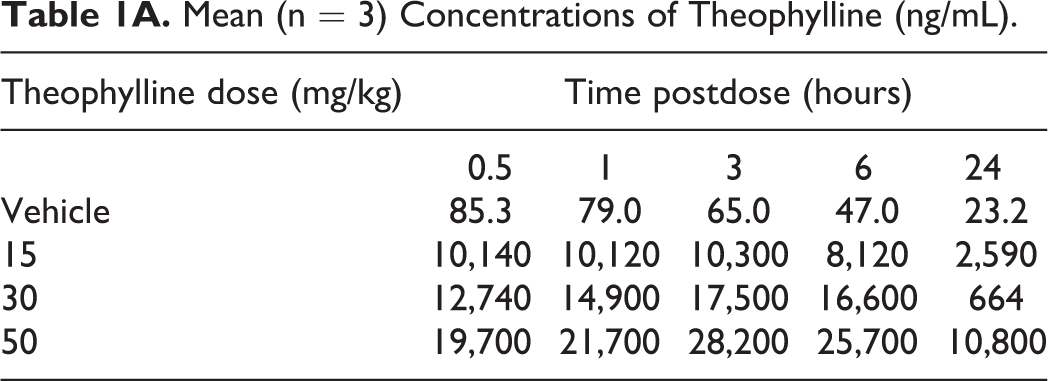
Plasma exposure levels were determined throughout the observation period, peaking for each dose level at approximately 3 hours for theophylline, and 0.5 to 1 hour following dexmedatomidine as expected (Table 1A and 1B).
Mean (n = 3) Concentrations of Theophylline (ng/mL).
Mean (n = 3) Concentrations of Dexmedetomidine (ng/mL).a
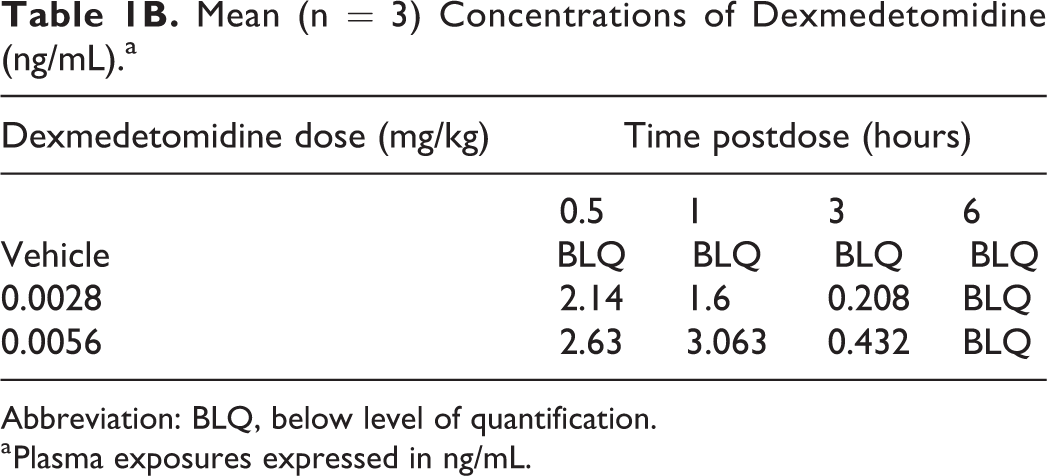
Abbreviation: BLQ, below level of quantification.
a Plasma exposures expressed in ng/mL.
Discussion
The primary objective of the study was to evaluate an indirect method of respiratory parameter capture, deriving those end points from the ABP waveforms, thereby extracting more information from a single investigation. These derived values were compared to simultaneously captured respiratory rates measured directly from a commercially available EMKA sourced RIP system, using standard pharmacological tools known to affect respiratory variables. As expected, oral administration of theophylline increased respiratory rate and minute volume, and intramuscular administration of dexmedetomidine decreased respiratory rate and minute volume in conscious dogs. Neither compound affected tidal volume.
Algorithms, available within the suite of commercially available analysis options (Blood Pressure module-EMKA) extracted low frequency waveforms (thoracic pressure changes induced by breathing) that are routinely observed on ABP waveforms. These waveforms were quantified and used to calculate BR (Figure 1). Respiratory Inductive Plethysmography data sets were also evaluated using EMKA’s commercially available modules for respiratory function assessment. Initially, the general direction of the responses using the two techniques were aligned, the correlations (true accuracy) between the absolute respiratory rates identified by the commercial RIP system and rates derived from the waveforms coincident with the ABP cycles, and were less than satisfactory. The outcome was poor in both pharmacological challenges (theophylline and dexmedetomidine groups) with R2 values of 0.29 to 0.37 (Figure 2). Moreover, the breathing rate values derived from ABP waveforms were typically blunted in timing and magnitude compared to those detected by the RIP system.
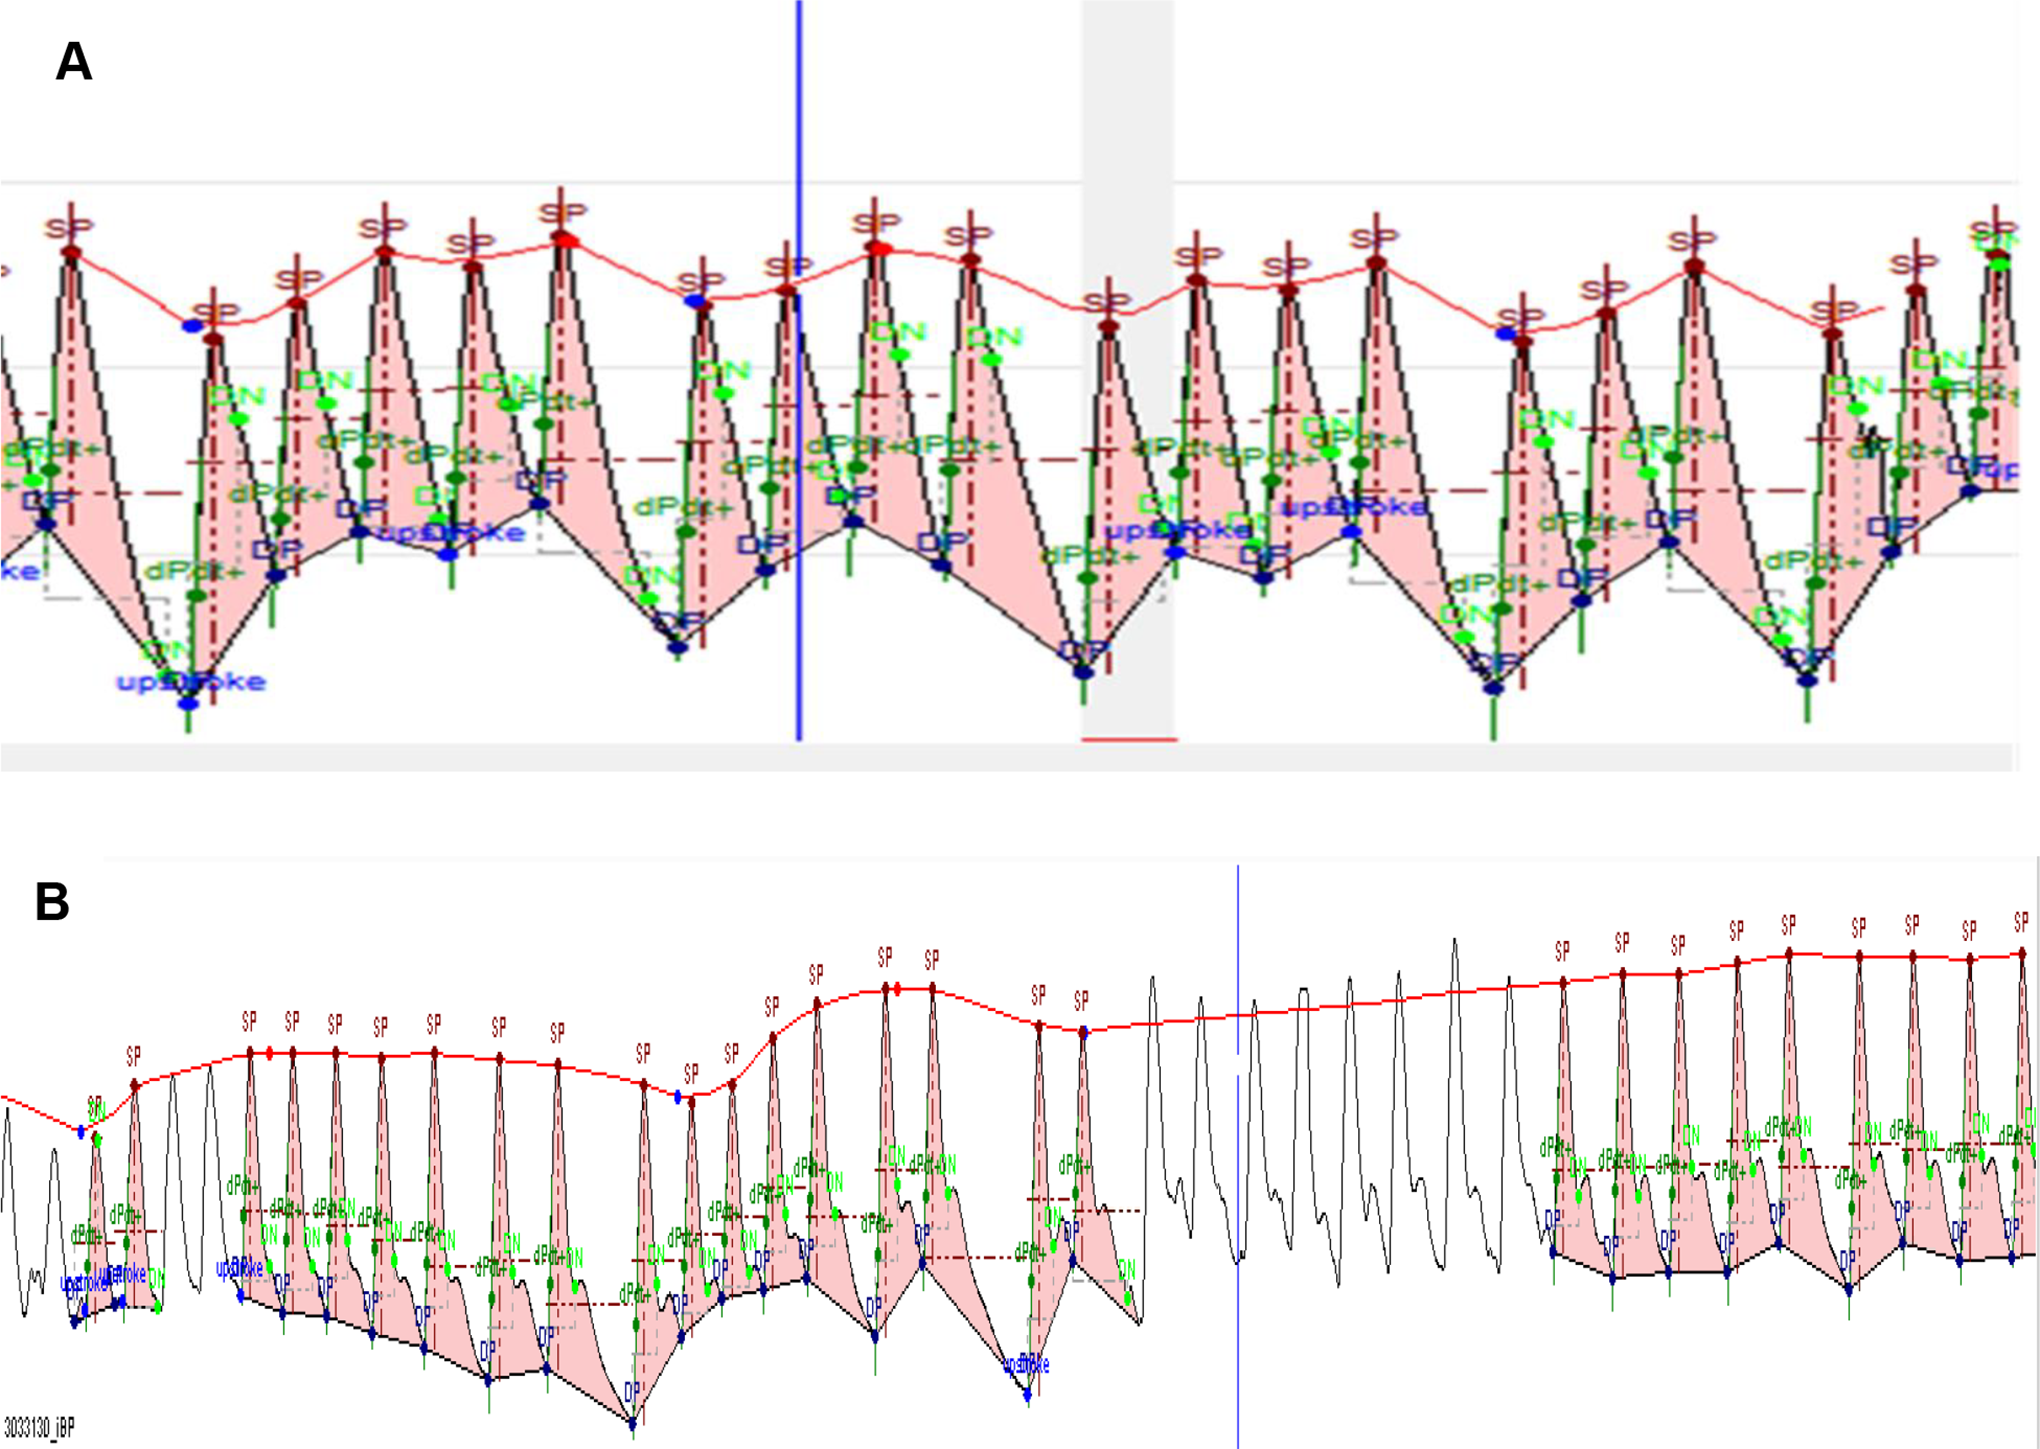
Breathing rate extractions from arterial blood pressure (ABP) waveforms. A, simulated schematic of breathing rate (BR) extraction from arterial blood pressure (ABP) waveforms. The line tracing the movement of the blood pressure waveforms (beat by beat peak of ABP) depicts the thoracic pressure changes induced by respirations which are “counted” by the data acquisition algorithm. B, Typical example of our data capture, unshaded ABP waveforms were not utilized to derive the respiratory rate.
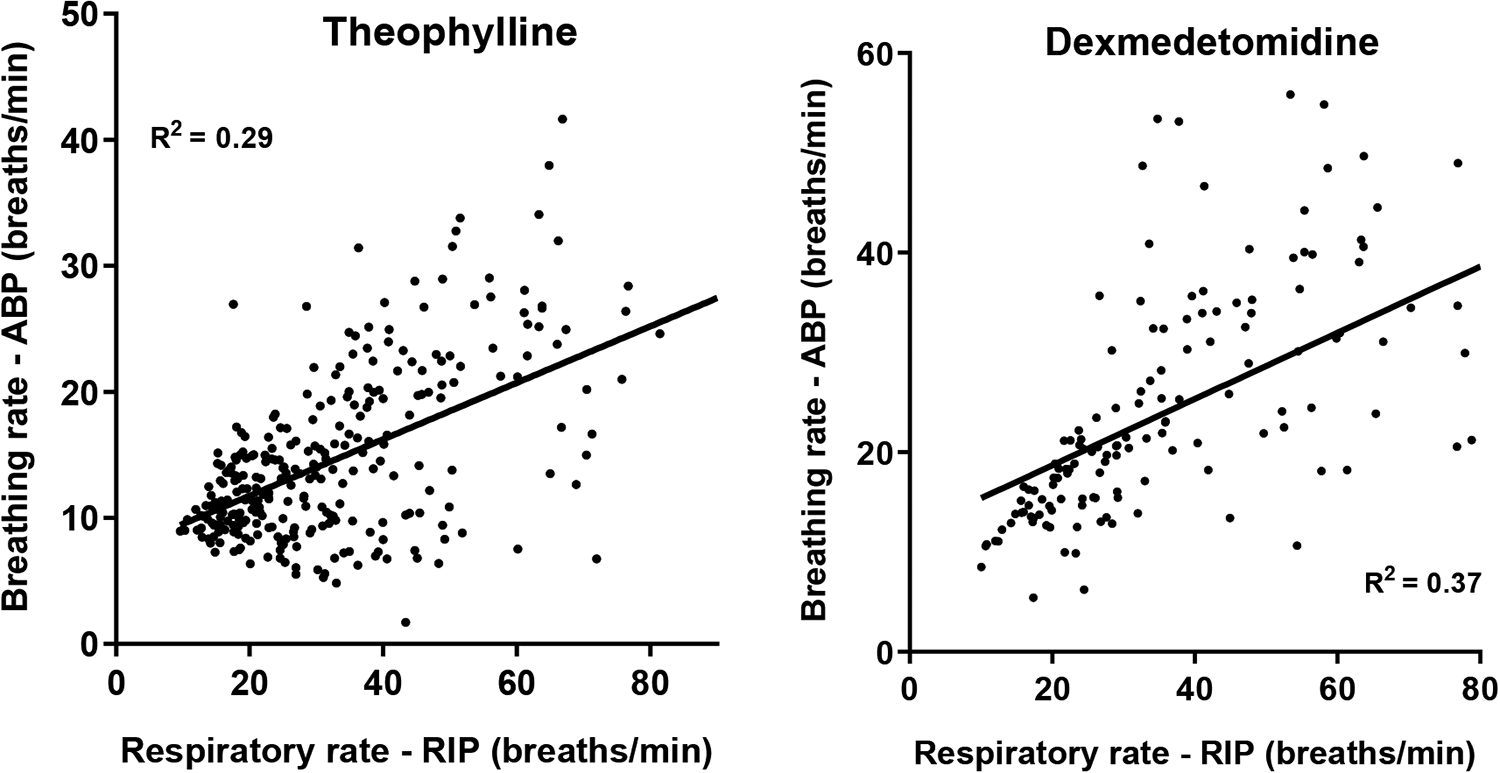
Respiratory rate regression plots (RIP vs ABP). Each data point is the average of the last 15-minute period of each hour in each animal and represents −2 to 24 hours post dose (theophylline) or −2 to 6 hours post dose (dexmedetomidine). The solid lines represent linear regression for theophylline and dexmedetomidine, respectively. The linear regression analysis suggests a poor linear correlation between breathing rate from ABP and respiratory rate from RIP (R 2 = 0.29 and 0.37 for theophylline and dexmedetomidine, respectively) in the original configuration of catheter positioning. ABP indicates arterial blood pressure.
The generally lower BR measured from ABP waveforms suggests the indirect method as configured at the outset in this study was not sensitive enough to identify every thoracic movement that was coincident with the ABP continuous data set. This summarization was further confirmed by poststudy X-ray images (example shown in Figure 3A) of the animals identifying the precise locations of the ABP catheter tips. The catheter tip was clearly located less advanced in the femoral artery and was the most likely contributing factor driving the poor correlations. The blunted sensitivity (missed thoracic movement count) accounted for the lower breathing rate outcomes from the derived waveforms compared to the RIP standard.
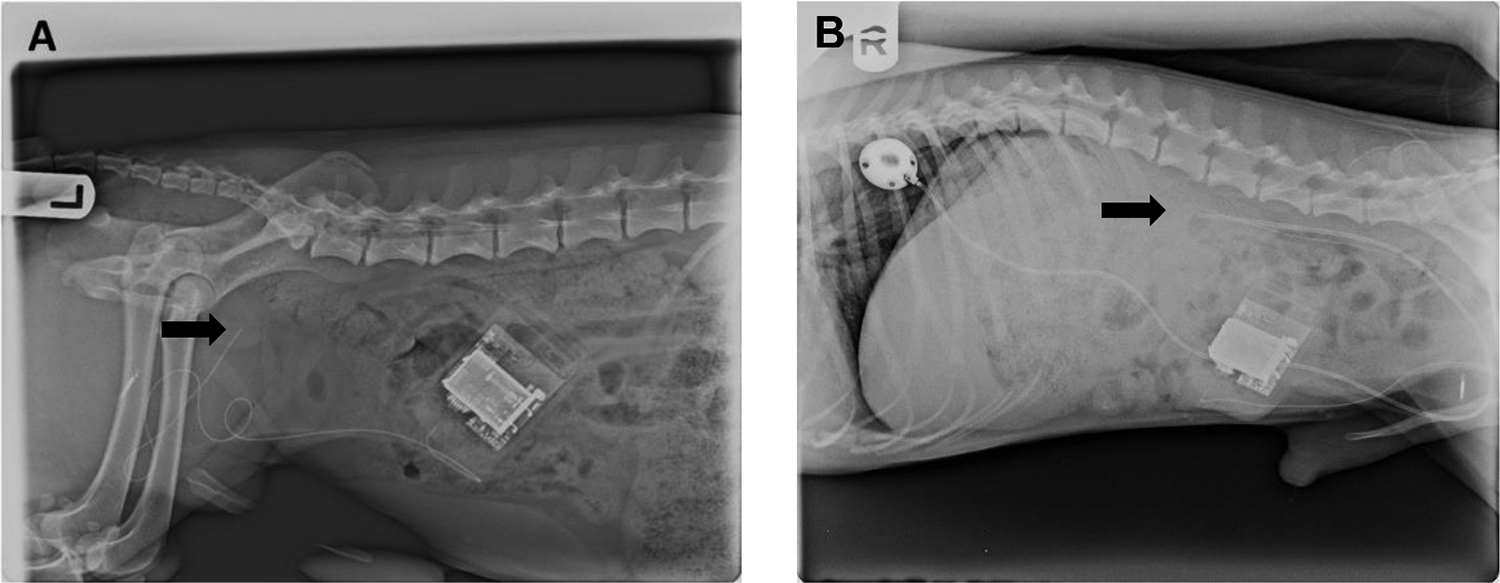
X-ray images of ABP catheter position. Arrows highlight the tip of the ABP catheter. A, Arterial blood pressure catheter tip located near the inguinal area. B, ABP catheter tip located near the thoracic diaphragm. ABP indicates arterial blood pressure.
Additional evaluations comparing respiratory rate derived from ABP versus RIP were conducted using newly instrumented animals with the ABP catheter tip placement advanced closer to the thoracic diaphragm as confirmed by the X-ray images (example shown in Figure 3B). Preliminary data suggest a much improved correlation for respiratory rate derived from ABP versus RIP (Figure 4A) in the same animal over a 24-hour period, yielding mean respiratory rates of 20.7 (range 14-35 breaths/min over the collection period) and 20.2 (range 13-26 breaths/min over the collection period) bpm from RIP and BP, respectively. The improved correlations for the absolute respiratory rate values between RIP and ABP were evident from the regression plot with an R2 value of 0.73 as shown in (Figure 4B).
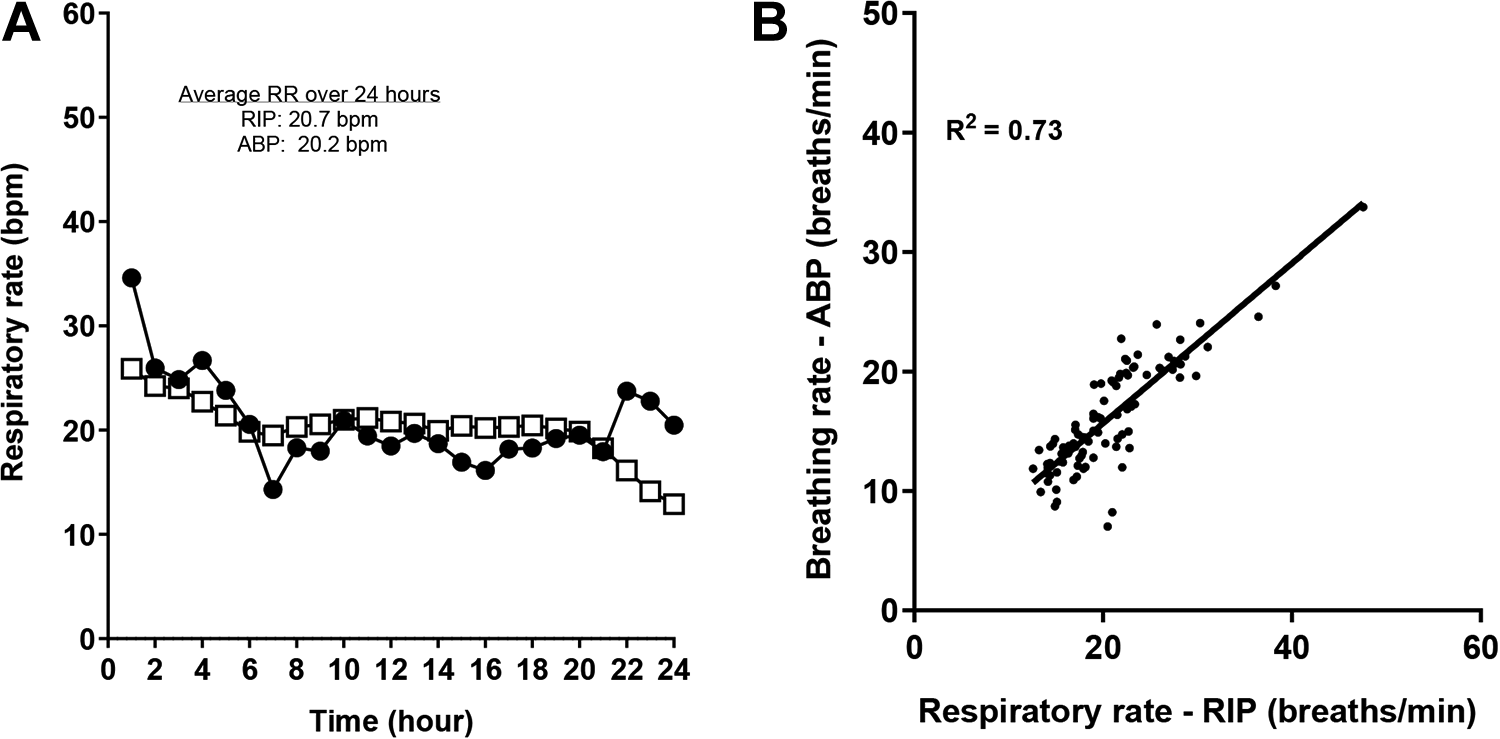
Comparison of respiratory rates. A, Respiratory rate from RIP (λ) and breathing rate extracted from ABP (≤). Respiratory rate derived from ABP versus RIP in the same animal over a 24-hour period, yielding mean respiratory rates of 20.7 (14-35) bpm from RIP and 20.2 (13-26) bpm from ABP. B, Respiratory rate regression plots (RIP vs ABP). The linear regression analysis suggests an improved linear correlation between breathing rate from ABP waveforms and respiratory rate from the RIP systems (R 2 = 0.73). APB indicates arterial blood pressure; RIP, Respiratory Inductive Plethysmography.
Admittedly, the current data set is preliminary suggesting additional studies incorporating ABP catheter tip placement closer to the level of the thoracic/abdominal aorta are needed to fully characterize and leverage this approach to collect continuous BR from ABP waveforms. As well, we did not challenge the algorithm with other cardiovascular maneuvers to include agents that increase or decrease blood pressure, or inotropic agents that might modify the configuration of the ABP waveforms. Clearly, further evaluations would be needed to elucidate the responsiveness of the algorithm under a variety of physiological perturbations.
Overall, the strength of this approach in a safety evaluation setting is clear. If an investigator can extract more data, currently residing within the waveforms that are already being collected, then the need for additional studies is reduced. Collecting respiration rate simultaneous to cardiovascular end points provides an investigator with some insight to the cardiovascular and respiratory systems interplay, perhaps refining follow-up study designs as needed. We have also recounted our own experience in model development identifying proper arterial pressure catheter advancement, without which signal quality and accuracy are significantly reduced. Thus, in this initial proof of concept investigation, we have demonstrated that with optimal blood pressure catheter placement, and a responsive algorithm, a reliable breathing rate can also be extracted from the ABP waveforms without the need for additional studies/animals to capture select respiratory end points.
Footnotes
Author Contributions
Tang, H.-M. contributed to conception, design, acquisition, analysis, interpretation, drafted the manuscript, and critically revised the manuscript; LaDuke, C. contributed to acquisition, analysis, and drafted the manuscript; Reynolds, D. contributed to design, acquisition, and drafted the manuscript; Carey, C. contributed to design, acquisition, and drafted the manuscript; Hahn, S. contributed to design, acquisition, and drafted the manuscript; Friedrichs, G. S. contributed to conception, design, interpretation, drafted the manuscript, and critically revised the manuscript. All authors gave final approval and agree to be accountable for all aspects of work ensuring integrity and accuracy.
Declaration of Conflicting Interests
The author(s) declared no potential conflicts of interest with respect to the research, authorship, and/or publication of this article.
Funding
The author(s) disclosed receipt of the following financial support for the research, authorship, and/or publication of this article: The sources of funding for the conduct of the investigation were only those of Novartis Biomedical Research Institute.