
Abstract
The aim of present study was to assess the impact of decreasing single bolus dose of nadroparin on blood pressure in patients on hemodialysis (HD). Forty HD patients were included in this study. The bolus dose of nadroparin was decreased twice by 25%; this lower dose was maintained for last 4 weeks, during which the dose was adjusted. There were no significant differences between the first and the last predialysis: systolic blood pressure ([pre-SBP]; 131.05 ± 25.58 vs 125.92 ± 25.49 mm Hg; P = .133), diastolic blood pressure ([pre-DBP]; 73.82 ± 11.82 vs 72.89 ± 9.13 mm Hg; P = .653), and pulse pressure ([pre-PP]; 57.24 ± 20.39 vs 53.03 ± 21.20 mm Hg; P = .121). We found correlation between delta nadroparin and pre-DBP in the last HD (rho = 0.310; P = .031) but not between delta nadroparin and pre-SBP and pre-PP values. This is the first report of influence of nadroparin dose lowering on pre-DBP in HD patients.
Keywords
Introduction
Hemodialysis (HD) is a modality of renal replacement therapy for end-stage renal disease (ESRD) and remains the main method in most countries. These patients are prone to arterial hypertension and hypotension (inter- and intradialytic), both are multifactorial and still largely unknown.
Removal of fluid volume, redistribution of plasma volume, baroreceptor disturbances, dysfunction of the autonomic nervous system, depressed responsiveness to alpha-adrenergic stimulation, concomitant drug therapy (eg, antihypertensive agents and nitrates), and left ventricular diastolic dysfunction contribute to the propensity of HD patients to develop hypotension during and between HD sessions. 1
Systemic anticoagulation during HD is targeted to prevent activation of coagulation. The heparinization of the extracorporeal circuit with low-molecular-weight heparin (LMWH) became an anticoagulation of choice with more reliable pharmacokinetics than unfractionated heparin (UFH), allowing single-dose administration, possible less dialyzer clotting and less side effects. 2 The ideal dose and safety of long-term use of LMWH are not known. 3
Heparins are potent vasodilators. The mechanism of heparin's blood pressure lowering effect is not yet fully elucidated. Several mechanisms may be involved in the vasodilator effect on human arteries. Vascular endothelial cells play a fundamental role in the control of vascular tone by releasing various contracting (endothelin and prostaglanidins) and relaxing (prostacyclin and nitric oxide [NO]) factors. 4
It is known that cardiopulmonary bypass (and HD) often causes hypotension by endothelial NO releasing, which in turn is triggered by serotonin from activated platelets within heparin-coated extracorporeal shunt. 5 The clearance of serotonin by the lungs might be impaired in patients with ESRD on HD because their basic level of serotonin is known to be elevated. 6 Nitric oxide is an important mediator of vascular tone and function. It is synthesized in the vascular endothelium utilizing the enzyme nitric oxide synthase (NOS) and diffuses in the adjacent vascular media where it has vasodilatory action. The actions of NO are similar to the endothelium-derived relaxing factor. Lack of NO can result in vasoconstriction (due to various vasoconstrictor agents: endothelin-1, angiotensin II, and others), hypertension, and accelerated atherosclerosis. In HD patients, the retention of inhibitors of NOS tends to decrease NO levels, whereas production of NO will be increased by cytokines generated during blood–dialyzer interaction. 7 The excess of unopposed NO release can cause vasodilation and profound hypotension, with resultant ischemic injury to various organs. 8 Low post-HD NO levels were explained by possible loss of L-arginine in the dialysate (as the levels of L-arginine decreases during HD). 9 Higher post-HD NO levels were explained by relief of hypoxia by ultrafiltration (UF) during HD, 8 heparin use (NO levels were higher with the use of UFH compared to LMWH), 10 and possibly due to removal of NOS inhibitors by HD and increased NO production by constitutively expressed NOS isotypes. Low NO might explain uncontrolled high blood pressure in relatively euvolemic HD patients. 7,11 High NO levels can be responsible for dialysis-induced hypotension. 7
An increased intracellular calcium concentration caused by LMWH administration could be responsible for the activation of endothelial NOS activity and NO-mediated vasorelaxation. 12 Other authors found that UFH, but not LMWH enoxaparin, causes significant dose-dependent relaxation with an average apparent maximal response. 13
Interleukin 1 (IL-1) and tumor necrosis factor α have been incriminated in the production of HD-induced hypotension by production of NO in endothelial and vascular smooth muscle cells. 10,14
As hypotension (intra- and interdialytic) with its serious complications is not well studied in HD patients, the aim of the this study was to investigate the effects of decreasing a single bolus dose of nadroparin on systolic, diastolic, mean, and pulse pressure in HD patients.
Patients and Methods
Patients
Forty patients (18 females and 22 males, aged 64.93 ± 12.34 years) on intermittent HD for 61.63 ± 53.97 months were included in this 12-week long study (1418 HD sessions). The study was performed in Haemodialysis Unit of the Department of Nephrology and Dialysis at University Hospital Center Split, Croatia.
Vascular accesses were via a native arteriovenous fistula/graft ([AVF/AVG]; n = 31 or 77.5%) and central venous catheters (tunneled cuffed or nontunneled; n = 9 or 22.5%). The causes of ESRD in our cohort were (1) chronic pyelonephritis (n = 9); (2) diabetic nephropathy (n = 9); (3) chronic glomerulonephritis (n = 7); (4) hypertensive nephropathy (n = 6); (5) polycystic kidney disease (n = 2); (6) vesicouretheral reflux (n = 2); (7) kidney cancer (n = 1); (8) lupus nephritis (n = 1); (9) cisplatin nephropathy (n = 1); (10) nephrocalcinosis (n = 1); (11) unknown (n = 1).
The inclusion criteria were (1) age of 18 years or more; (2) HD treatment 3 times per week for 4 hours or more; (3) duration of HD treatment more than 60 days; (4) Kt/V ≥ 1.2 and URR ≥ 65%; (5) ability to understand and sign informed consent. The exclusion criteria were (1) acute or chronic infections; (2) terminal malignant or other chronic diseases with life expectancy less than 3 months; (3) inability to understand and sign informed consent.
All 40 patients were informed about the study protocol; all understood it and voluntary signed informed consent in conformity with the Helsinki declaration. The approval of the study protocol was accepted by the Ethic’s Committee of University Hospital Center Split, Croatia.
Methods
All patients were received conventional 4 to 4½ hours HD 3 times per week, with bicarbonate dialysate at a flow rate of 500 mL/min and blood flow rate of 250 to 350 mL/min. The dialyses were performed using low flux polysulfone membrane hollow fiber dialyzers F6 and FX 8 (UF rate < 20 mL/mm Hg per hour; Fresenius Medical Care, Bad Homburg, Germany); monitors were Fresenius 4008 S (Fresenius Medical Care). According to the standard dialysis procedure in our Haemodialysis Unit, the extracorporeal circuit was rinsed with 2000 mL of normal saline with 5000 IU of UFH, and almost all of this solution was discarded before the line was connected to the patient. Dialysate temperature was maintained at 36°C to 37°C and the dialysis bath consisted of bicarbonate: 32 to 35 mmol/L, sodium: 138 to 145 mmol/L, potassium: 2 mmol/L, and calcium: 1.25 to 1.5 mmol/L. No reuse of dialyzers was performed.
The actual starting bolus dose of nadroparin calcium (Fraxiparine; Glaxo Welcome Production, Notre Dame de Bondeville, France; HD1 nadroparin), which was used in our center as a standard LMWH for the last 2 months, was administered into arterial line immediately before the start of HD according to the manufacturer’s recommendation. This starting dose was decreased by 25% after initial 4 weeks (HD2 nadroparin) and again by 25% after further 4 weeks (HD3 nadroparin). This 50% lower dose of nadroparin was maintained for last 4 weeks during which this dose was slightly changed due to clotting in the extracorporeal circuit and vascular access.
We investigated 4 HD sessions: HD1 (the beginning of the study), HD2 (after 4 weeks), HD3 (after 8 weeks), and HD4 (the end of the study). Blood samples were taken from HD patients under fasting conditions on a midweek dialysis session. The levels of urea and creatinine were determined at the beginning (time 0) and at the end of investigated HD sessions (time 4).
Blood pressure was measured with a mercury sphygmomanometer in recumbency before HD session, after each hour and at the end of HD. Phases I and V of the Korotkoff sounds were taken as the systolic blood pressure (SBP) and diastolic blood pressure (DBP), respectively. The mean blood pressure (MAP) and pulse pressure (PP) were calculated as MAP = DBP + (SBP − DBP/3) and PP = SBP − DBP, respectively. The pre- and post-dialysis MAP and PP values were determined.
Clinical clotting of the extracorporeal circuit was evaluated by visual inspection after bloodlines were disconnected at the end of HD and graded for arterial and venous chambers from 0 (no clotting) to 4 (coagulated whole system). The clotting of dialyzer was graded from 0 (clean dialyzer or only few blood strips) to 4 (complete clotting). Thromboses of vascular access for HD were noted.
The following laboratory values were determined predialysis (time 0): number of white blood cells (WBC), platelets, red blood cells (RBC), concentration of hemoglobin (Hgb, g/L), hematocrit (Htc), urea (mmol/L), and creatinine (μmol/L). At the end of HD (time 4), urea and creatinine were measured.
Blood cell count was determined by automatic analyzer (Advia 120 Hematology System Bayer Corporation, Tarrytown, New York). Urea and creatinine were measured by standard laboratory techniques using automatic analyzer (Olympus AU560, Hamburg, Germany). We classified bleeding outcomes as either major or minor.
Statistical Analysis
Results of the study were presented as arithmetic mean ± standard deviation with range. Shapiro-Wilkov W test was used for normality of distribution. The significance of differences in mean between 2 groups was assessed by unpaired Student t test. The correlation between variables was tested using Spearman correlation test with linear regression analysis. Statistical analysis was performed with SPSS 12.0 software for Windows (SPSS Software, Chicago, Illinois). One-tailed P value < .05 was considered statistically significant.
Results
Forty hemodialyzed patients were enrolled in presented 12-week long study. Thirty-eight patients completed study, 2 patients were transplanted, and none died. The baseline characteristics of all patients are listed in Table 1 . Nadroparin doses in all patients measured as International Unit per kilogram per hemodialysis (IU/kg/HD) are presented in Table 2 . The nadroparin dose was significantly higher at the beginning than at the end of the study (HD1 nadroparin 53.19 ± 15.18 vs HD4 nadroparin 33.84 ± 12.64 IU/kg/HD; P < .001). The starting bolus dose of nadroparin was decreased by 36% and this individually optimized bolus dose was generally lower than that previously used in our center and recommended by the manufacturer. Nadroparin administered as a single bolus in this dose was safe and effective for HD session of 4 hours duration in terms of preventing bleeding complications and thrombosis (extracorporeal circuit/vascular access).
Baseline Characteristics of HD Patients (n = 40)
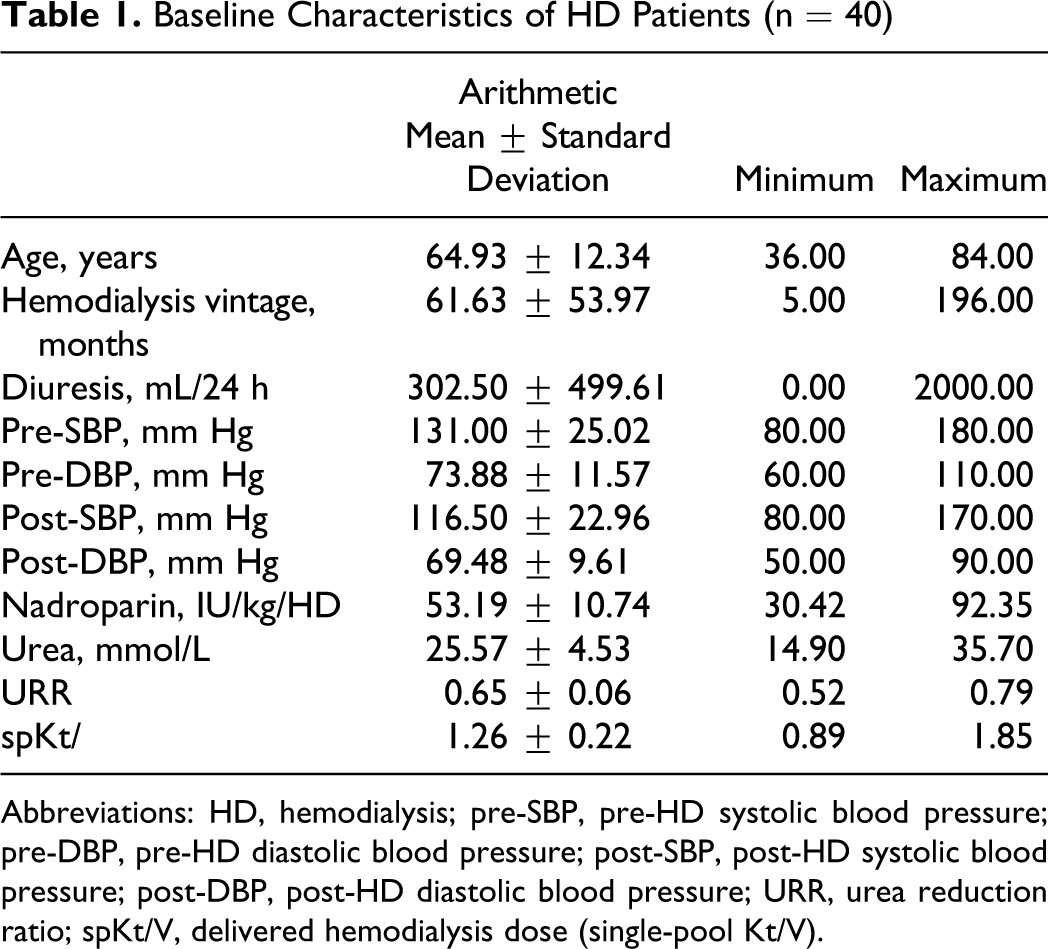
Abbreviations: HD, hemodialysis; pre-SBP, pre-HD systolic blood pressure; pre-DBP, pre-HD diastolic blood pressure; post-SBP, post-HD systolic blood pressure; post-DBP, post-HD diastolic blood pressure; URR, urea reduction ratio; spKt/V, delivered hemodialysis dose (single-pool Kt/V).
Nadroparin Doses in IU/kg/HD During Study
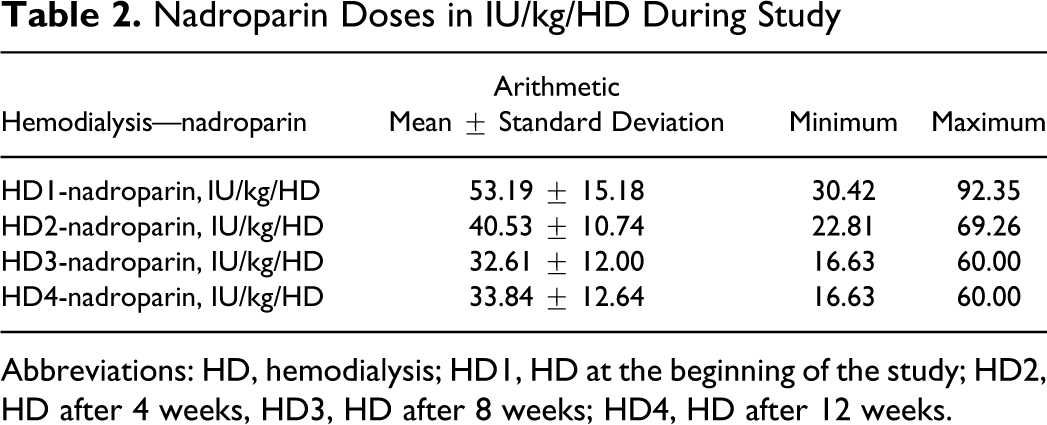
Abbreviations: HD, hemodialysis; HD1, HD at the beginning of the study; HD2, HD after 4 weeks, HD3, HD after 8 weeks; HD4, HD after 12 weeks.
Differences between blood pressure parameters on the beginning and at the end of the study are demonstrated in Table 3 . We demonstrated significant correlation between level of nadroparin dose decreasing and rise in predialysis diastolic blood pressure (pre-DBP) at the end of the study (correlation between delta LMWH and pre-DBP in the last HD session, rho = 0.310; P = .031; Figure 1 ).
Differences Between the First and the Last HD Sessions (Student t test for dependent data).
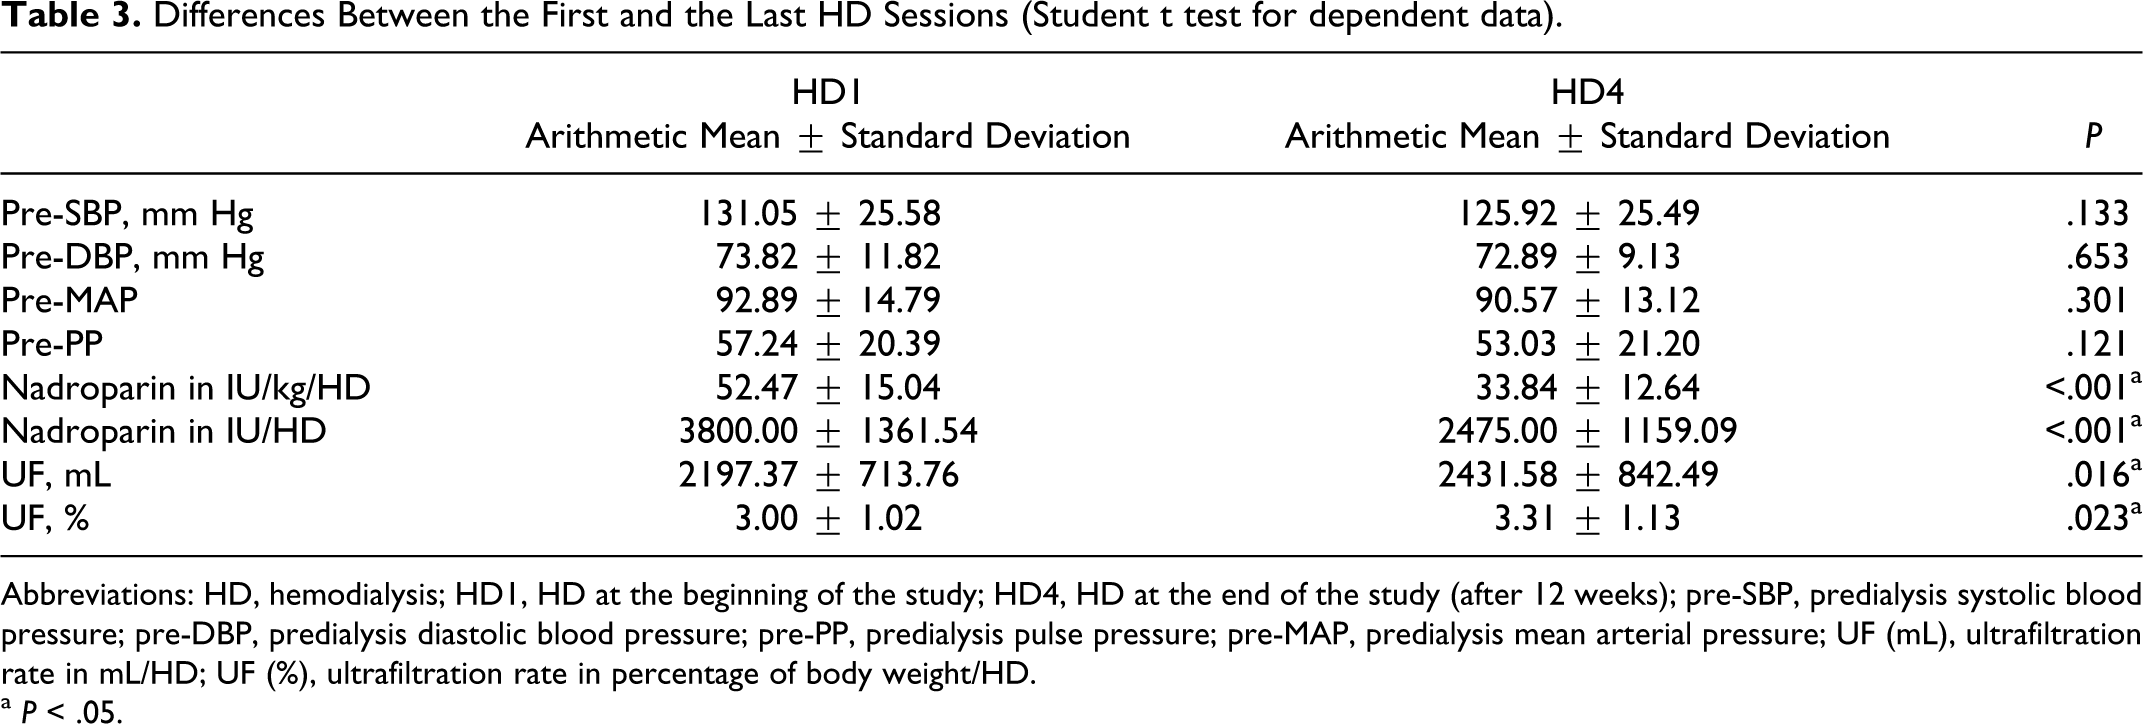
Abbreviations: HD, hemodialysis; HD1, HD at the beginning of the study; HD4, HD at the end of the study (after 12 weeks); pre-SBP, predialysis systolic blood pressure; pre-DBP, predialysis diastolic blood pressure; pre-PP, predialysis pulse pressure; pre-MAP, predialysis mean arterial pressure; UF (mL), ultrafiltration rate in mL/HD; UF (%), ultrafiltration rate in percentage of body weight/HD.
a P < .05.
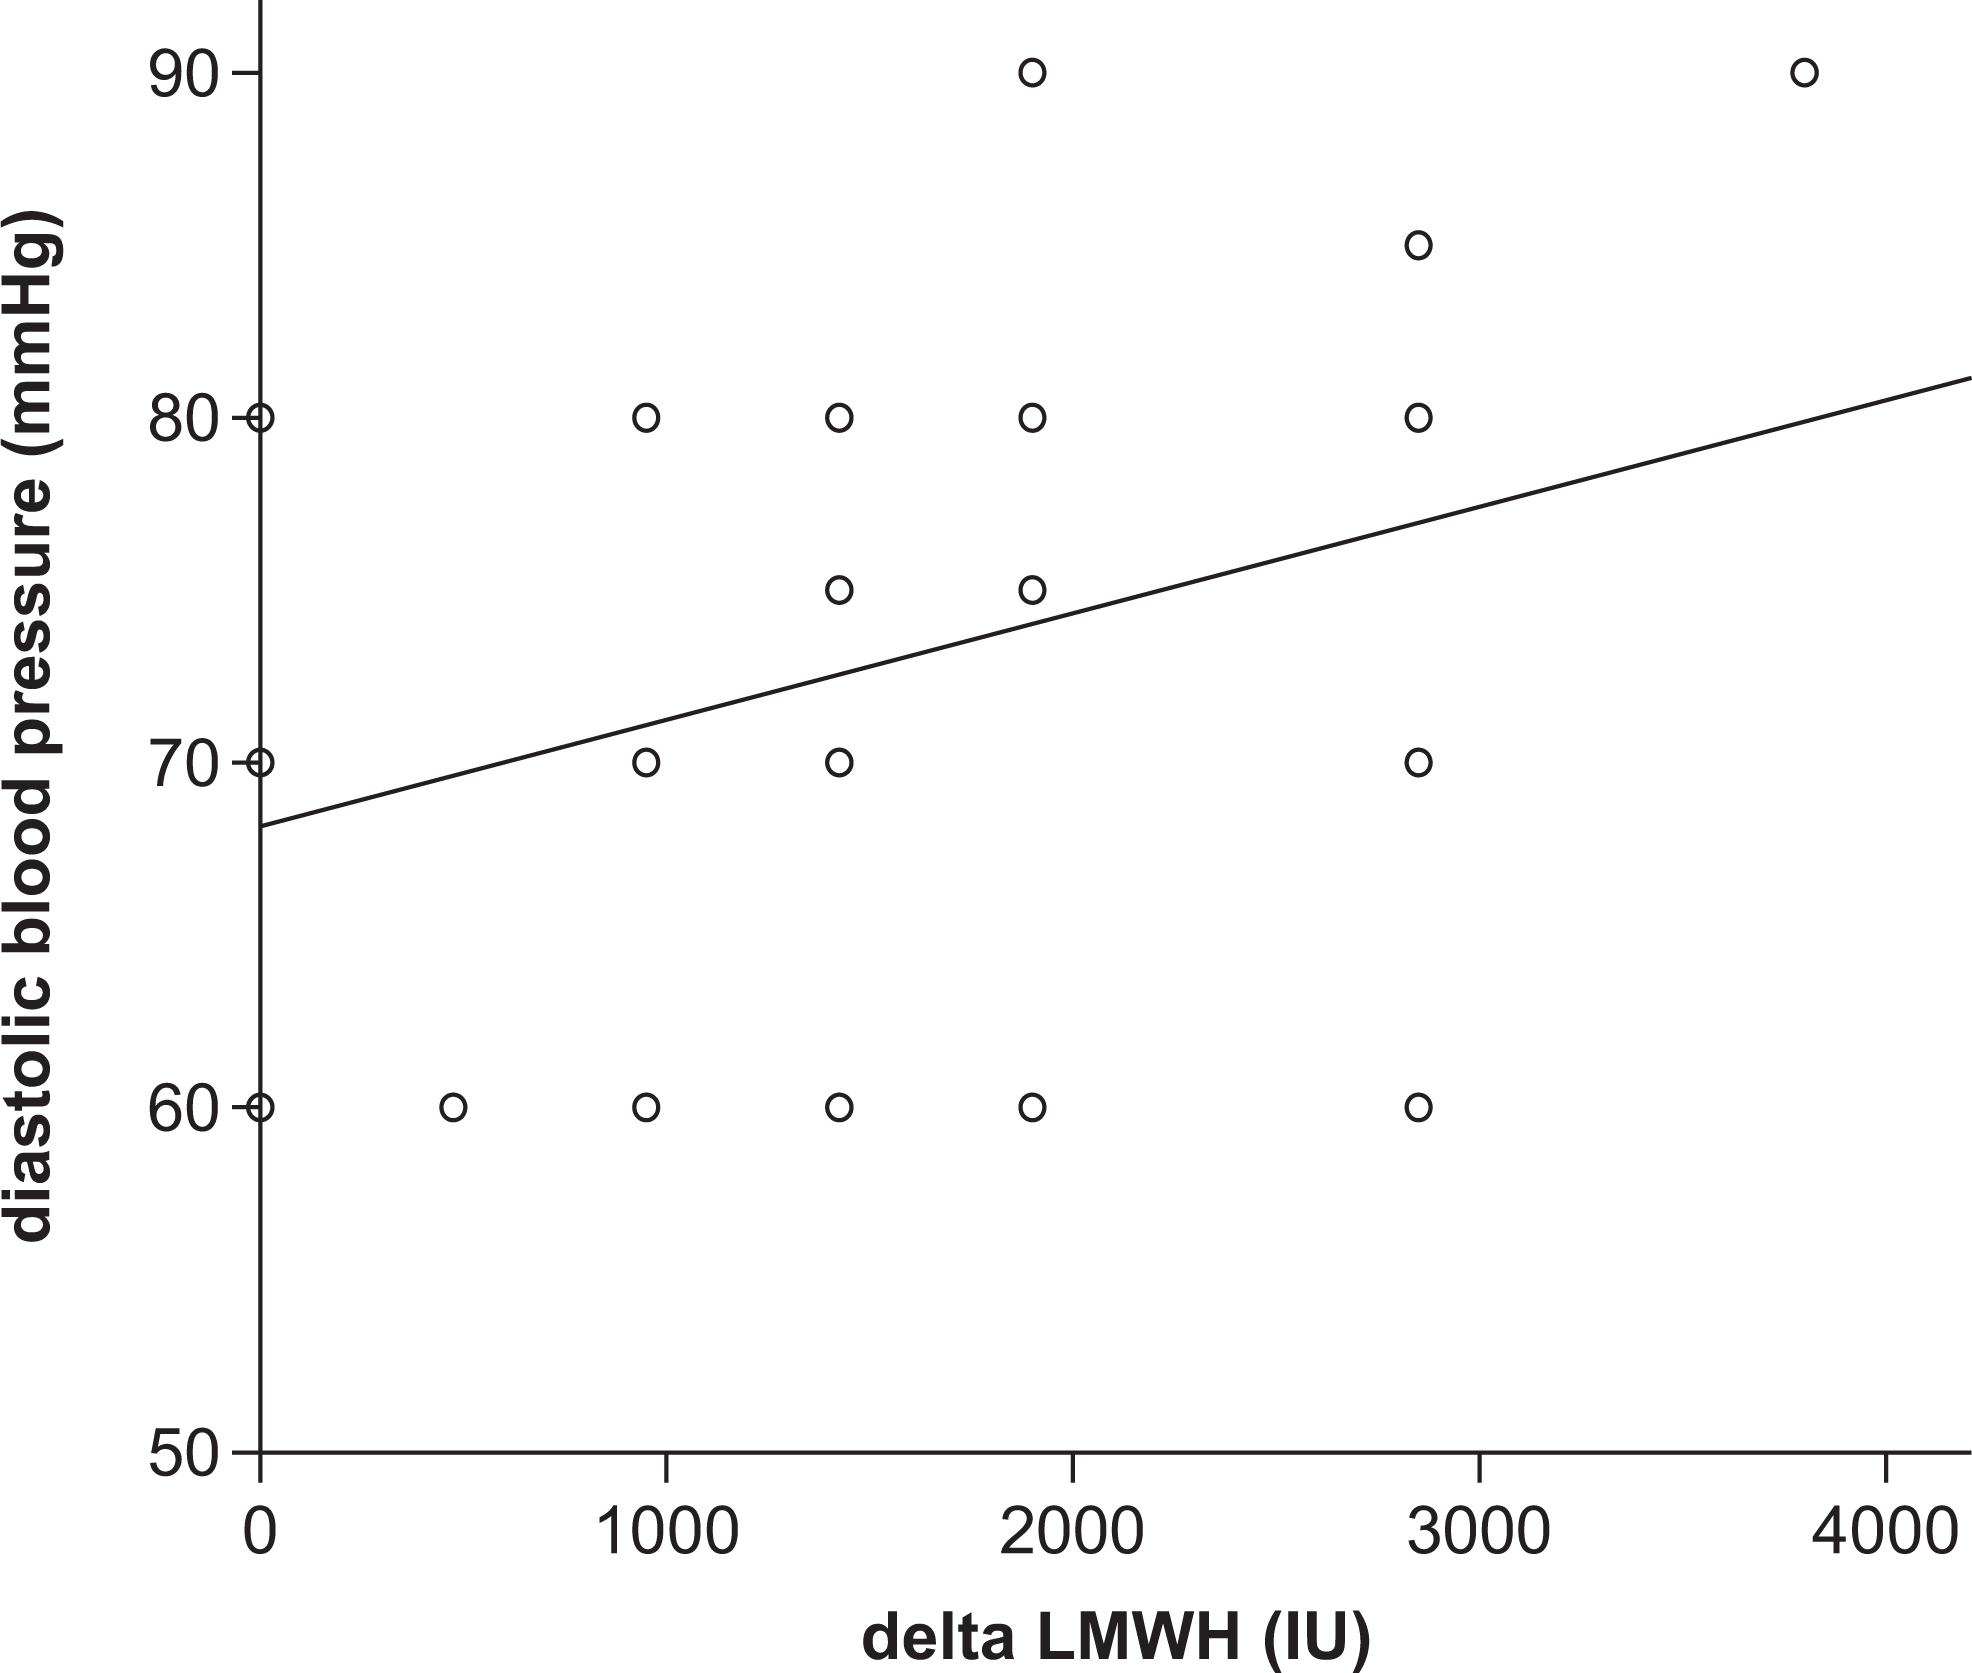
Correlation between delta LMWH (level of decreasing) and diastolic pressure on the beginning of the last HD session (rho = 0.310; P = .031; y = 0.003x + 68.15). LMWH indicates low-molecular-weight heparin; HD, hemodialysis.
The delivered dose of HD, determined by single-pool Kt/V (spKt/V) at the beginning and at the end of the study, did not show significant difference (HD1 spKt/V 1.201 ± 0.157 vs HD4 spKt/V 1.18 ± 0.171; P = .151). Despite the predialysis systolic blood pressure (pre-SBP) in the first HD was higher than in the last HD session, the significant difference was not found (131.05 ± 25.58 vs 125.92 ± 25.49 mm Hg; P = .133). The predialysis diastolic blood pressure (pre-DBP) was slightly higher in the first HD but without significance (73.82 ± 11.82 vs 72.89 ± 9.13 mm Hg; P = .653). The predialysis pulse pressure (pre-PP) value was nonsignificantly higher in the first versus last HD session (57.24 ± 20.39 vs 53.03 ± 21.20 mm Hg; P = .121).
We found significantly higher UF rate at the end of the study period, either as mL/HD (HD1 2197.37 ± 713.76 vs HD4 2431.58 ± 842.49 mL/HD; P = .016) or as percentage of body weight/HD in both sessions (HD1 3.00 ± 1.02 vs HD4 3.31 ± 1.13%; P = .023). In our HD population, 24 patients (60%) were on antihypertensive medications and 16 (40%) did not use any of these drugs. Between patients who were treated for arterial hypertension, number of antihypertensive medications was different: 3 patients were on 1 drug, 6 patients on 2 drugs, 11 patients on 3 drugs, and 2 patients were on 4 and 5 drugs. Most of the patients received calcium channel blockers (17), followed by β-blockers (14), central α-agonists (10), diuretics (7), and angiotensin-converting enzyme (ACE) inhibitors (7). The antihypertensive medication was not changed during study period.
This study showed that the reduction of nadroparin dose influenced on pre-DBP in HD4, but the significant correlations were not found (delta LMWH and pre-SBP and pre-PP values in the last HD session, rho = 0.088; P = .303 and rho = 0.015; P = .464, respectively).
Discussion
As it was found that LMWH cause less pronounced hypotensive effect than UFH (which is dose dependent), we postulated that decreased standard dose of nadroparin delivered at the beginning of HD session could have less influence on decreasing blood pressure (systolic, diastolic, mean, and pulse pressure) before and during HD.
The data about optimal blood pressure and survival of hemodialyzed patients are still controversial. In a retrospective multicenter study, Zager and coworkers 15 found that pre-SBP in the range of 130 to 180 mm Hg, that is, high BP values had little power to predict all-cause mortality or cardiovascular mortality during 2- to 3-year follow-up. In contrast, when pre-SBP was below 120 mm Hg, a dramatic increase of short-term mortality was noted. 16 These observations have caused considerable uncertainty and have led to concern that aggressive lowering of BP may paradoxically increase cardiovascular mortality and thus be counterproductive. This argument requires careful analysis and discussion. 17 Charra and coworkers 18 found that an average predialytic blood pressure values were in the normotensive range with predialysis MAP above and below the median of 97 mm Hg (eg, blood pressure approximately 130/70 mm Hg). They also documented that the progressive survival benefit was seen in HD patients who had low blood pressure. But other authors found that patients with SBP less than 120 mm Hg have the highest risk of death. 19
In the frail elderly individuals, a value of DBP inferior to 60 mm Hg is associated with radical decrease of survival, independent from large artery stiffness and left ventricular function, suggesting that more rational antihypertensive therapy, not only based on systolic pressure levels, is needed. 20
In elderly HD patients, the high incidence of hypotension is due to cardiovascular disease, limited regulatory mechanism of cardiac function, and vascular compliance, especially in eating or body position changes. Hypotension during HD results from inability to adequately increase arteriolar tone and a reduction in left ventricular function. Both vascular tone and left ventricular function appeared to be impaired by the dialysis procedure. 21
Other authors found that the combination of low DBP, congestive heart failure, cardiac arrhythmias, low UF volume, and advanced age of HD patients resulted in a correlation with relative blood volume (RBV). They documented that medication and fluid status influence the adequate cardiovascular compensatory mechanisms, such as vascular compliance, venous capacity, and cardiac function. 22
Increased arterial stiffness is responsible for a disproportionate increase in SBP and relative decrease in DBP; thus, the consequent higher PP at any given value of MAP is likely to cause microvascular damage and disruption. 23 Decreasing of DBP has negative effect on occurrence of severe periventricular white matter lesions of the brain. So each clinical condition that may lead to hypotension might accelerate the underlying degenerative processes. 24 Episodes of hypotension, hypoperfusion, and hypoxia may contribute to cognitive deficit through a reduction in cerebral blood flow, causing neuronal ischemia in the most vulnerable regions of the brain. 25
Increased pre-SBP (155 ± 28 vs 140 ± 22 mm Hg, P = .03) and pre-DBP (85 ± 19 vs 78 ± 17 mm Hg, P = .12) values were found in diabetic patients due to autonomous nervous system and blood pressure regulation impairment in these patients. 22
Elderly HD patients have low pre-DBP. 22 It may be due to the low compliance of the vascular system because of the vascular calcification and stiffness of the vessels. 26 The older patients are more likely to have systolic hypertension and are at risk of intradialytic hypotension due to blunted autonomic compensatory responses, although there was no association between post-HD blood pressure and age. 27
The significant correlation between level of nadroparin dose decreasing and rise in pre-DBP, which was found at the end of our study (correlation between delta nadroparina and pre-DBP in the last HD session), may have the same reasons: autonomous nervous system and blood pressure regulation impairment (50% of our patients were diabetics) and vascular calcification and stiffness of the vessels (62% of our patients were older than or equal to 65 years of age).
The pre-SBP and pre-DBP in the first HD were higher than in the last HD session in our study (not significantly). The possible explanation of this fact is that NO reserve is better restored between HD sessions with low nadroparin doses (NO synthesized in the vascular endothelium diffuses in the adjacent vascular media where it has vasodilatory action).
The increased arterial stiffness is responsible for a disproportionate increase in SBP and relative decrease in diastolic pressure. 23 Our results were different despite the fact that 62% of our population were elderly individuals with atherosclerotic vessels.
The occurrence of hypotension on HD does not necessarily mean that the patient's extracellular volume (ECV) has been normalized. A short or very short thrice-weekly HD often leads to hypotension just because the session time is too short to allow for an adequate intravascular space refilling by the interstitial space. 28 Overhydrated patients show a characteristic seemingly paradoxical RBV behavior during treatment: they have only a small decrease, sometimes even an increase, in RBV. 22
During the few hours of HD session, the plasma compartment is ultrafiltered down to nadir. Refilling from the interstitial space occurs, but it lags some hours behind, and it does not reach a new state of equilibrium between interstitial and plasma spaces before some hours. This explains that just at the end of the session, the patient is normally plasma-wise, really “dry”, displaying some signs of hypovolemia, which will disappear within a few hours. 29
Assessing the ideal dry weight on pure clinical ground is not very easy. The modification of ECV and blood pressure response need few weeks, even months, and is usually explained by cardiovascular remodeling and the delay needed to clean out middle molecular vasoactive substances accumulated in ESRD patients. 29
The data of Barth et al 22 identify females, elderly and diabetic patients with high pre-SBP and high BMI as a possible target groups to take special advantage of close RBV monitoring to reduce symptomatic hypotension. Contrary to these findings, Caplin et al 27 found no relationship of HD-associated symptoms (including hypotension) with increasing intradialytic weight loss, higher averaged UF rates, blood flow rates, or dialyzer surface area. Similarly, symptom reporting was not increased in diabetics and patients with cardiovascular diseases.
Intradialytic hypotension is a common complication in HD patients (76.4%) and could be explained by rapid rates of UF in plasma refilling, leading to relative intravascular hypovolemia. 30,31
The UF rates in our patients significantly differ during study period (presented as mL/HD: 2197.37 ± 713.76 in HD1 vs 2431.58 ± 842.49 mL/HD in HD4; P = .016; and as percentage of body weight/HD: 3.00 ± 1.02 in HD1 vs 3.31% ± 1.13% in HD4; P = .023) but were in recommended values. This average UF rates did not cause hypotension (and relative intravascular hypovolemia). The higher UF rates at the end of the study were the consequence of the climate (the end of the spring and the beginning of the summer).
In patients on daily home HD, in comparison to 3 HD/week, DBP remained constant (82.80 ± 7.2 vs 76.9 ± 10.1 mm Hg, not significant), but SBP showed a significant decrease (141.1 ± 17.2 vs 130.9 ± 19.2 mm Hg, P < .001). 32
In our study, the differences in pre-SBP, pre-DBP, and MAP were not significant during study period.
Shoji and coworkers 33 found that patients with pre-DBP lower than 69 mm Hg had greater fall in DBP during HD and increased 2-year mortality. The average pre-DBP in our study was 73.82 ± 11.82 mm Hg (at the beginning of the study) and 72.89 ± 9.13 mm Hg (at the end of the study). It is the possible reason for stability of our HD patients: only one severe episode of hypotension (which needed intervention) was found in 1 HD1 patient. No other hypotensive episodes during HD sessions were noted.
A large proportion of HD patients use the antihypertensive medications that often are very poor in controlling hypertension. Besides, if the patient is receiving antihypertensive medication, a change in blood pressure is not the sole criterion for reassessing the dry weight. 28 In the present study, 60% patients needed 1 to 5 antihypertensive medications, which also mean that HD treatment per se is not always enough for blood pressure control.
As we presented earlier, nadroparin dose decreasing was safe. 34 During this study, no unfavorable events (cerebrovascular or cardiovascular) were noted. It seems that these lowered and individually optimized nadroparin doses and values of pre-SBP, pre-DBP, and pre-MAP in our patients have saving effect for cardiovascular and cerebrovascular morbidity and mortality.
Conclusion
This is the first report of influence of nadroparin dose lowering on blood pressure in patients with ESRD who were treated with HD. We demonstrated significant correlation between level of LMWH decreasing and rise in pre-DBP at the end of the study.
Footnotes
Declaration of Conflicting Interests
The authors declared no potential conflicts of interest with respect to the research, authorship, and/or publication of this article.
Funding
The authors disclosed receipt of the following financial support for the research, authorship, and/or publication of this article: supported by grant No 216-0000000-0520 (Immunological, hematological, reological, and other features of uraemic syndrome) from the Ministry of Science, Education and Sports of the Republic of Croatia. The authors were not financially supported by the manufacturer of nadroparin.