
Abstract
Allergic contact dermatitis is the most frequent manifestation of immunotoxicity in humans with a prevalence rate of 15% to 20% over general population. Skin sensitization is a complex end point that was for a long time being evaluated using animal testing. Great efforts have been made to completely substitute the use of animals and replace them by integrating data from in vitro and in chemico assays with in silico calculated parameters. However, it remains undefined how to make the best use of the cumulative data in such a way that information gain is maximized and accomplished with the fewest number of tests possible. In this work, 3 skin sensitization prediction models were considered: one to discriminate sensitizers from non-sensitizers, considering a 2-level scale; one according to the GHS, considering a 3-level scale; and the other to categorize potency in a 6-level scale, according to available human data. We used a data set of known human skin allergens for which in vitro, in chemico, and in silico descriptors where available to build classifiers based on soft and hard multivariate modeling. Model building, optimization, and refinement resulted in 100% accuracy in distinguishing between sensitizers and non-sensitizers. The same model was able to perform the characterization, in 3 and 6 levels, respectively, with 98.8 and 97.5% accuracy. Combining data from in vitro and in chemico tests with in silico descriptors is relatively simple to implement and some predictors are fitting the adverse outcome pathway for skin sensitization.
Introduction
Allergic contact dermatitis (ACD) is a skin inflammatory disease caused by reactive chemicals with low molecular weight termed haptens. Impressively, there are currently more than 4,000 substances identified as skin allergens, with some of them being present on a multitude of products in consumers’ households such as cosmetics, cleaning products, and fragrances. 1,2 From a pathophysiological point of view, ACD involves the activation of both the innate and the adaptive arms of the immune system and is divided into 2 distinct phases: the initial sensitization phase and a later elicitation or challenge phase. The sensitization phase is triggered by the first contact of skin with the hapten, leading to formation of immunogenic hapten−protein complexes. These complexes are captured and processed by Langerhans cells and dermal dendritic cells (DCs), which then mature and migrate to draining lymph nodes in order to present the allergen to T lymphocytes. Then, T-cells are activated and expand into allergen-specific effector T-cells. Regarding the elicitation phase, it occurs after a second contact with the allergen, leading to a strong inflammatory response caused by the cytotoxic activity of allergen-specific effector T-cells against keratinocytes. 2
ACD represents between 10% and 15% of occupational illnesses in the United States and Europe, 3 and the only way to prevent symptoms is avoiding contact with allergens. 4 Consequently, skin sensitization is a quintessentially toxicological end point to evaluate the safety of new molecules prior to their market launch. In the past, this was mostly done using animal models, like the guinea pig maximization test (GPMT) or the local lymph node assay (LLNA). However, the use of animals raised ethical and economic issues, and in 2013, their use to ensure the toxicological safety of cosmetics ingredients was banished in Europe. 5 As a result, there is a pressing need to develop new and alternative test methods to predict skin sensitization. Thankfully, the development of integrated approaches to testing and assessment and defined approaches (DA) had been fueled by the increasing mechanistic understanding of the adverse outcome pathway (AOP) for skin sensitization. Consequently, the development of in vitro and in chemico tests reflect the key events of these mechanisms: allergen covalent binding to skin proteins (KE1), keratinocyte responses, activation of DCs, and T-cell proliferation. 6 Until now, 6 methods were approved by the Organization for Economic Co-operation and Development (OECD) for skin sensitization prediction, that contribute only for hazard identification, allowing to distinguish sensitizers from non-sensitizers. However, the prediction of potency is also of great importance for risk assessment and is imperative for the development of models with this aim. The validated models for hazard identification include the Direct Peptide Reactivity Assay (DPRA), 7 KeratinoSens, LuSens, 8 the human cell line activation test (h-CLAT), the U937 cell line activation test, and the interleukin-8 Luc assay. 9 These have several disadvantages as they are costly, time-consuming, exhibit some variability, have a reduced applicability to poorly water-soluble compounds, and require the isolated substance for testing. In addition, the accuracy of these models is lower than 80%. 10 On the other hand, these in chemico and in vitro assays are not designed to assess all the physicochemical and biological properties that are associated with a given chemical’s capacity to cause skin sensitization. Thus, in an attempt to obtain a better performance, some of these methods were combined with each other and/or with computational methods. This strategy led to a slight increase in accuracy; however, the methods became more complex. 11 In silico methods have some advantages like their low cost, concomitantly requiring only the structure of the compound without the need of obtaining the synthesized or isolated product. Despite that, these methods are limited to organic substances with well-defined structures in order to be processed by software packages, such as TIMES-SS and E-Dragon. However, in silico calculated data may offer a valuable complement to the current battery of in chemico/in vitro tests. Indeed, there is a strong need to identify new ways to combine the data sets from different assays in order to obtain a robust and powerful approach able to identify and categorize skin sensitizers.
Data sets are often multivariate systems with several independent variables (predictors) and a dependent variable (target; skin sensitization), where predictors are used to generate a decision rule able to describe the response. However, in systems with a high number of variables not all are necessarily relevant to the description of the response and can potentially be excluded. Thus, multivariate analysis is a helpful tool because it allows the condensation of the information in order to facilitate an easier representation and interpretation, condense variables, perform a data space analysis, and remove unexplained variations such as ones caused by noise. Principal component analysis (PCA) and hierarchical clustering analysis (HCA) are essentially unsupervised exploratory methods, omitting the response from the initial data set, they provide information about the organization of samples among the multivariate system. Linear discriminant analysis (LDA) and partial least squares (PLS) are considered supervised methods since they require response values to classify and predict new situations. PCA is more often used for object representation while HCA reveals object similarities 12 ; LDA is more suited for classification purposes while PLS is used for multivariate response description. 13,14 Either LDA and PLS can describe original variables as factors (linear combinations of variables that maximize the intergroup discrimination or correlation), which will complicate the final interpretation in terms of variable impact on model response. 15 -18 For that reason, Multivariate Ordinarily Least Squares (MOLS) is the preferred algorithm to describe the responses by assuming a multivariate polynomial response, it is possible to combine all the advantages of least squares statistics and the possibility to directly relate the response with each original variable accessing all relevant dependencies. However, in order to avoid over-fitting, it is imperative to perform a careful model selection and validation to preserve a parsimonious and more robust model. 19 -22
In view of all this, the aim of this study was to develop models for hazard identification, distinguishing sensitizers from non-sensitizers (2 level response), and to also able to ensure the categorization of chemicals according to the Globally Harmonized System of Classification and Labeling of Chemicals (GHS), considering skin sensitizers category 1A, skin sensitizers category 1B and non-sensitizers (3 level response), and 6 classes (6 level response), using experimental (in vitro and in chemico descriptors) and computational (in silico) information. The relevance and correlation of the information gathered in the models with the skin sensitization response, more specifically with the AOP, is also discussed.
Experimental
Data Sets
The initial data set was based on the work of Basketter and colleagues that identified 131 chemicals organized by 6 levels of potency according to the available human information. 23 This classification is based on the probability of these compounds to induce skin sensitization in humans. Category 1 compounds are the most potent ones and they are considered extreme sensitizers. Categories 2, 3, and 4 contain less potent compounds, designated strong, moderate, and weak sensitizers, respectively. Categories 5 and 6 included chemicals showing a low capacity to induce skin sensitization. Thus, categories 1 to 4 are considered sensitizers and 5 and 6 are considered non-sensitizers. 23 A 3 category classification system was also included according to the classification defined by the GHS. This system considers one category for skin sensitizers that includes 2 subcategories (1A and 1B) and a non-sensitizers category. Subcategory 1A compounds are extreme and strong skin sensitizers and subcategory 1B chemicals correspond to moderate and weak sensitizers. 24 Doing the parallelism with the previous classification system, the 3 GHS categories correspond to the combination of categories 1 and 2 (subcategory 1A), categories 3 and 4 (subcategory 1B), and categories 5 and 6 (non-sensitizers). 23,25
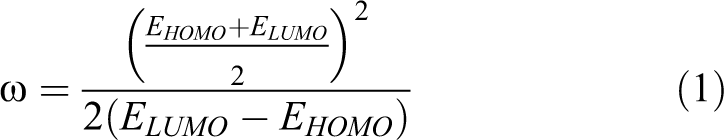
For this study, compounds belonging to each category have been selected, excluding metals and compounds for which information about all descriptors was not available. Experimental (in chemico and in vitro) and computational (in silico) descriptors were considered and used as predictors. The in chemico predictors included cysteine (CysDep) and lysine (LysDep) depletion from DPRA whose values were retrieved from reference published data sets. 10,26 -28 The concentration that reduces 30% cell viability (EC30) was determined in house (in vitro descriptor), using the Alamar Blue assay. 29 THP-1 cells were exposed for 24 hours to several concentrations of the considered chemicals in a dose–response experiment and analyzed for viability by the reduction of resazurin. The EC30 values were calculated by linear regression of obtained data. A protein adduct formation descriptor obtained by the TIMES-SS package software 28 was used as an in silico predictor alongside constitutional, topological charge indices, functional group counts, topological, charge, geometrical, molecular properties, walk and path counts, information indices, and atom-centered fragments descriptors calculated through the VCLABS E-DRAGON, an online free software. 30,31 The electrophilicity index (ω) has also been included since previous studies have shown its relevance for the description of the skin sensitization response. 32 To achieve this goal, the energy of highest occupied (EHOMO) and lowest unoccupied (ELUMO) molecular orbitals have been obtained from geometry optimization calculations, using density functional theory (B3LYP/6-31G) and the values obtained were related by the following equation 1 described by Parr and colleagues 33 :
The explanation of the descriptors can be consulted in supporting information.
Test Cases
In order to evaluate the suitability and predictive ability of chemicals to induce skin sensitization, 3 test cases were studied based on the predictors mentioned above. The in vitro and in chemico test case included the 3 experimental descriptors above indicated (case1: n = 81 samples, m = 3 variables), the in silico test case was based exclusively on descriptors calculated computationally (case2: n = 90 samples, m = 383 variables), and the last test case used a combination of experimental and computational variables (in vitro + in chemico + in silico; case3: n = 81, m = 386). The second test case (exclusively computational) presents the advantage of not requiring any laboratory testing. These 3 data sets can be consulted in supplementary material.
Data Processing
Direct relations were explored between a pool of variables (predictors) and the skin sensitization response transduced in discrete levels of potency as a homogeneously distributed numerical vector.
By default, variables with null variance were removed and the remaining variables were standardized to null mean and unitary variance to avoid scale effects. PLS models were explored in Octave (MatLab compatible program). 34
Model Refinement and Selection
MOLS model refinement was performed with R-project resources, 35 using forward and forward-backward model based on Akaike Information Criterion (AIC) eq. (2), and Bayesian Information Criterion (BIC), eq. (3):


where n corresponds to the number of samples and
Several merit functions were used to evaluate each model fitting and predictive ability such as: squared Pearson multivariate correlation (R
2), adjusted squared Pearson’s multivariate correlation (R
2
adj), mean fitting error (
Results
Case1: In Vitro and In Chemico Approach
For case1, we tried to access data structures only by using in vitro and in chemico information. This data set consists of n = 81 compounds (samples) with skin sensitization accessed via 3 (m = 3) experimental descriptors (“CysDep,” “LysDep,” and “EC30”). PCA allows for 80.2% of information recovery with f = 2 factors (and 100% recovery with f = 3 factors). Figure 1 represents the corresponding 3-dimensional scores plot.
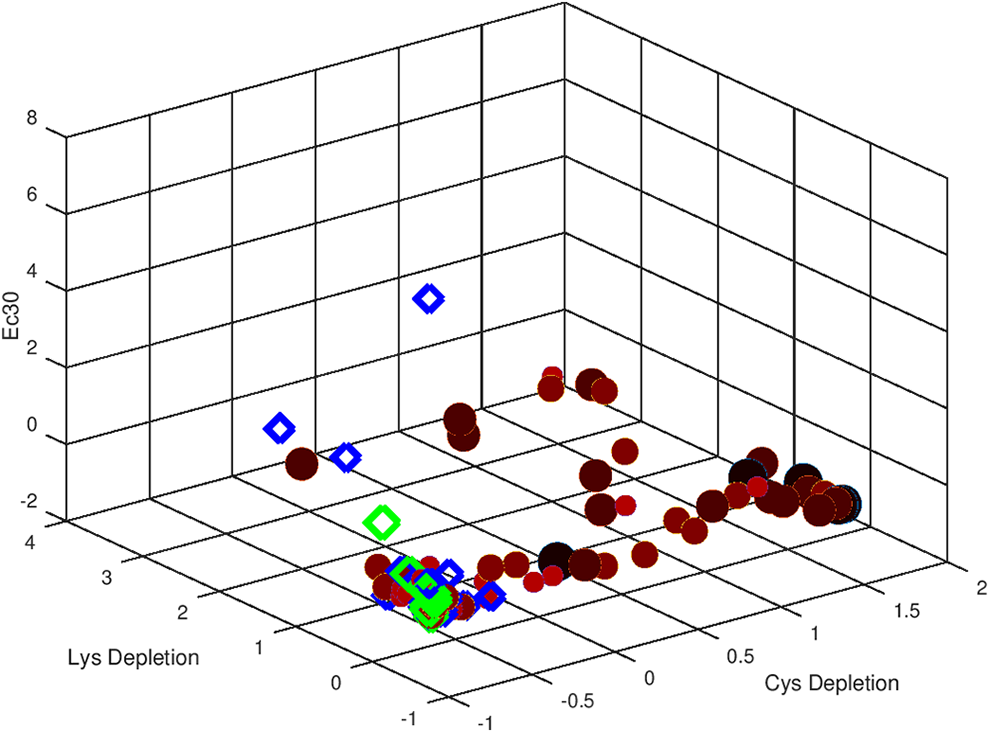
Three-dimensional scores representation of standardized results obtained with in vitro and in chemico data. Sensitizers are represented in filled reddish circles (darker colors and grater dimensions for more toxic) and non-sensitizers in open diamonds (green and blue colors).
From Figure 1, it is possible to conclude that evaluation of the potency of sensitizers according to 6 or 3 categories may not be feasible by using only these 3 in vitro and in chemico descriptors. We can also infer that “CysDep” seems to be the most discriminating variable since there is a tendency to allocate more potent skin sensitizers to higher scores, while less toxicity generally corresponding to lower ones. There is also a tendency to have all results aligned in a single line parallel to “CysDep” axis, which also reveals that this is the most relevant variable from this pool of experimental descriptors in terms of skin sensitization hazard. In the same way, “LysDep” and “EC30” seem to be the less discriminating variables that do not allow clear distinction in 2, 3, or 6 categories. The dispersion of the objects over these axes is lower, which indicates a lower contribution of these variables in the description of the system.
Previous work demonstrated that using Ward method as an association criterion for Euclidean distance similarity could easily evidence data structure. 17 By performing HCA with Ward’s method on standardized variables of case1 data set, we obtained the dendrogram pictured in Figure 2.
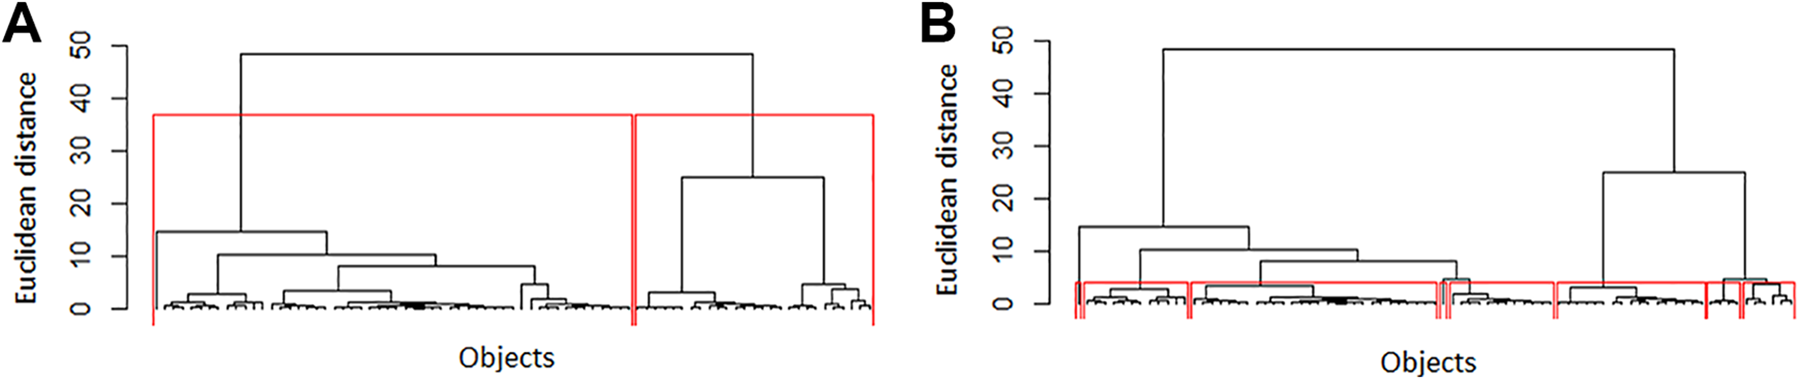
Dendrogram of case1 standardized variables obtained with Ward’s association method for Euclidean distances. Considerations by assuming 2 cluster formation (A) and 6 cluster formation (B).
Two distinct groups can be easily identified (group 1: on the left; group 2: on the right). Group 1 contains 66.7 and group 2 only 33.3% of the total number of samples. In a first attempt, this looks very promising since we have 56 sensitizers (69.1%) and 25 non-sensitizers (30.9%) in this data set. However, a closer inspection into these 2 groups revealed that the first one consists of similar percentages of sensitizers and non-sensitizers, but the second one mostly consists of sensitizers. In addition, the less populated group, group 2, includes most of categories 1 (extreme skin sensitizers) and 2 (strong skin sensitizers) chemicals, whereas group 1, the most populated, contains mostly categories 4 (weak skin sensitizers), 5, and 6 (non-sensitizers) compounds. Category 3 (moderate skin sensitizers) chemicals are evenly included in both groups. Similar classification problems are obtained in the case of 3-level potency classification.
In order to better verify how samples are clustered inside these 2 big groups, 6 smaller groups were considered (Figure 2B). All groups have compounds from 3 or 4 categories demonstrating a large overlap between categories. Furthermore, all groups contain chemicals from adjacent categories, except group 6 that includes compounds from categories 2, 3, and 5.
Furthermore, by performing LDA with this data set, the results were not satisfactory. Best results were obtained via cross validation with LDA following a one-fifth conservative resampling (80% of samples as calibrating set and 20% as testing set, ensuring that all categories are represented in both data sets) which allowed to obtain 61.1% prediction accuracy for hazard identification response (2-level classification: sensitizer or non-sensitizer).
By using MOLS in this system, we only must consider 7 polynomial first-degree models from P = 4 (all 3 in vitro and in chemico descriptors plus a constant, t01) to P = 2 (simpler model considering each variable individually, t05-t07). Model performance results are presented in Table 1.
Characterization and Performance of Obtained Models in Case1 (In Vitro and In Chemico).
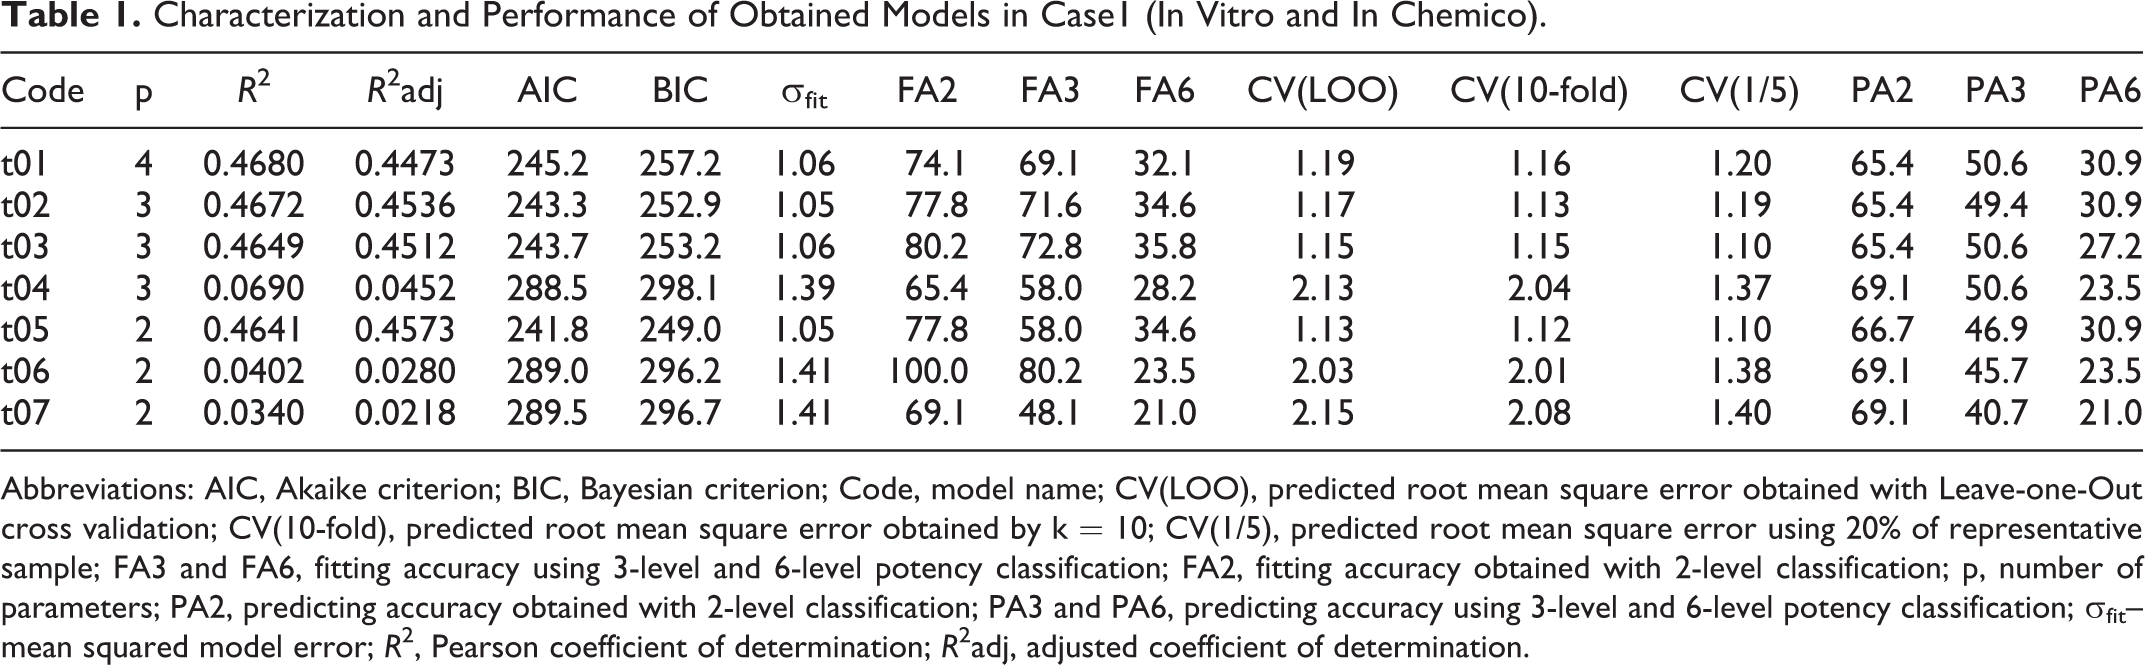
Abbreviations: AIC, Akaike criterion; BIC, Bayesian criterion; Code, model name; CV(LOO), predicted root mean square error obtained with Leave-one-Out cross validation; CV(10-fold), predicted root mean square error obtained by k = 10; CV(1/5), predicted root mean square error using 20% of representative sample; FA3 and FA6, fitting accuracy using 3-level and 6-level potency classification; FA2, fitting accuracy obtained with 2-level classification; p, number of parameters; PA2, predicting accuracy obtained with 2-level classification; PA3 and PA6, predicting accuracy using 3-level and 6-level potency classification; σ fit– mean squared model error; R 2, Pearson coefficient of determination; R 2adj, adjusted coefficient of determination.
By using only experimental data from in vitro and in chemico assays, detailed in Table 1, the results indicate that all tested models poorly describe the skin sensitization response either for hazard identification or for potency categorization. Best predictive models for 6-level toxicity response are t05 (“CysDep”) and t02 (“CysDep” and “LysDep”) with very low fitting and predicting accuracy of 34.6% and 30.9%, respectively (corresponding to 53 and 56 fails in 81). Better results are obtained in the case of 3-level potency classification with a fitting ability of 80.2% but a bad result in terms of predicting by achieving only 45.7% accuracy. In the case of 2-level response, best fitting and predicting models are t06 (“EC30”) and t04 (“LysDep” and “EC30”) with better fitting ability (100.0% and 65.4%) but still low predicting ability (69.1%), respectively.
From all these results, we can conclude that it is not possible to fully describe and predict chemical skin sensitization based exclusively in these in vitro and in chemico results and new approaches were tested subsequently (case2 and case3).
Variable Selection
After this preliminary approach, we tried to include more information into our initial system by adding extra in silico variables. As more variables were added to the initial system, the more confusing it becomes—PCA was unable to retrieve 80% in a reasonable number of factors (f = 11 for case2 and f = 12 for case3) and also HCA and LDA yielded worse results than previous ones. The main reason for this failure may be related to the fact that the extra variables can contribute some useful information, while some variables are increasing system information that is not related to the studied response (skin sensitization).
We then tested a new approach starting by selecting the relevant variables that can help to describe skin sensitization. To achieve this goal, we used PLS as soft-modeling approach in order to identify more relevant variables and then, by using model selection criteria with MOLS, we developed several predictive models. In our soft-modeling experience with PLS, 15,26 we found that this algorithm tends to preserve the same latent factor variables that may be collinear (have similar information) while they are related to target response—these variables will show similar impact (as loadings). In order to select only most relevant variables, we established 2 criteria, one direct and the other weighted. The direct criterion is exclusively based on variable impact over each latent factor—in this way, we selected the most relevant contributions (with loadings above the mean) along the first 5 latent factors. 22 The weighted approach was based on crossing loading information with the described response (amount of justified variability)—this way we are able to emphasize the impact of variables by considering their contribution in the description of the response. We kept in mind that these criteria will not solve the collinearity problem between selected variables, but this gap will be resolved with MOLS, via model refinement (least significant variables removal).
In Table 2, we describe the most relevant variables by detected direct and weighted assessment.
Most Relevant Variables Detected With PLS in Case2 (In Silico Descriptors) and Case3 (In Vitro, In Chemico, and In Silico Descriptors) by Direct and Weighted Criteria.a
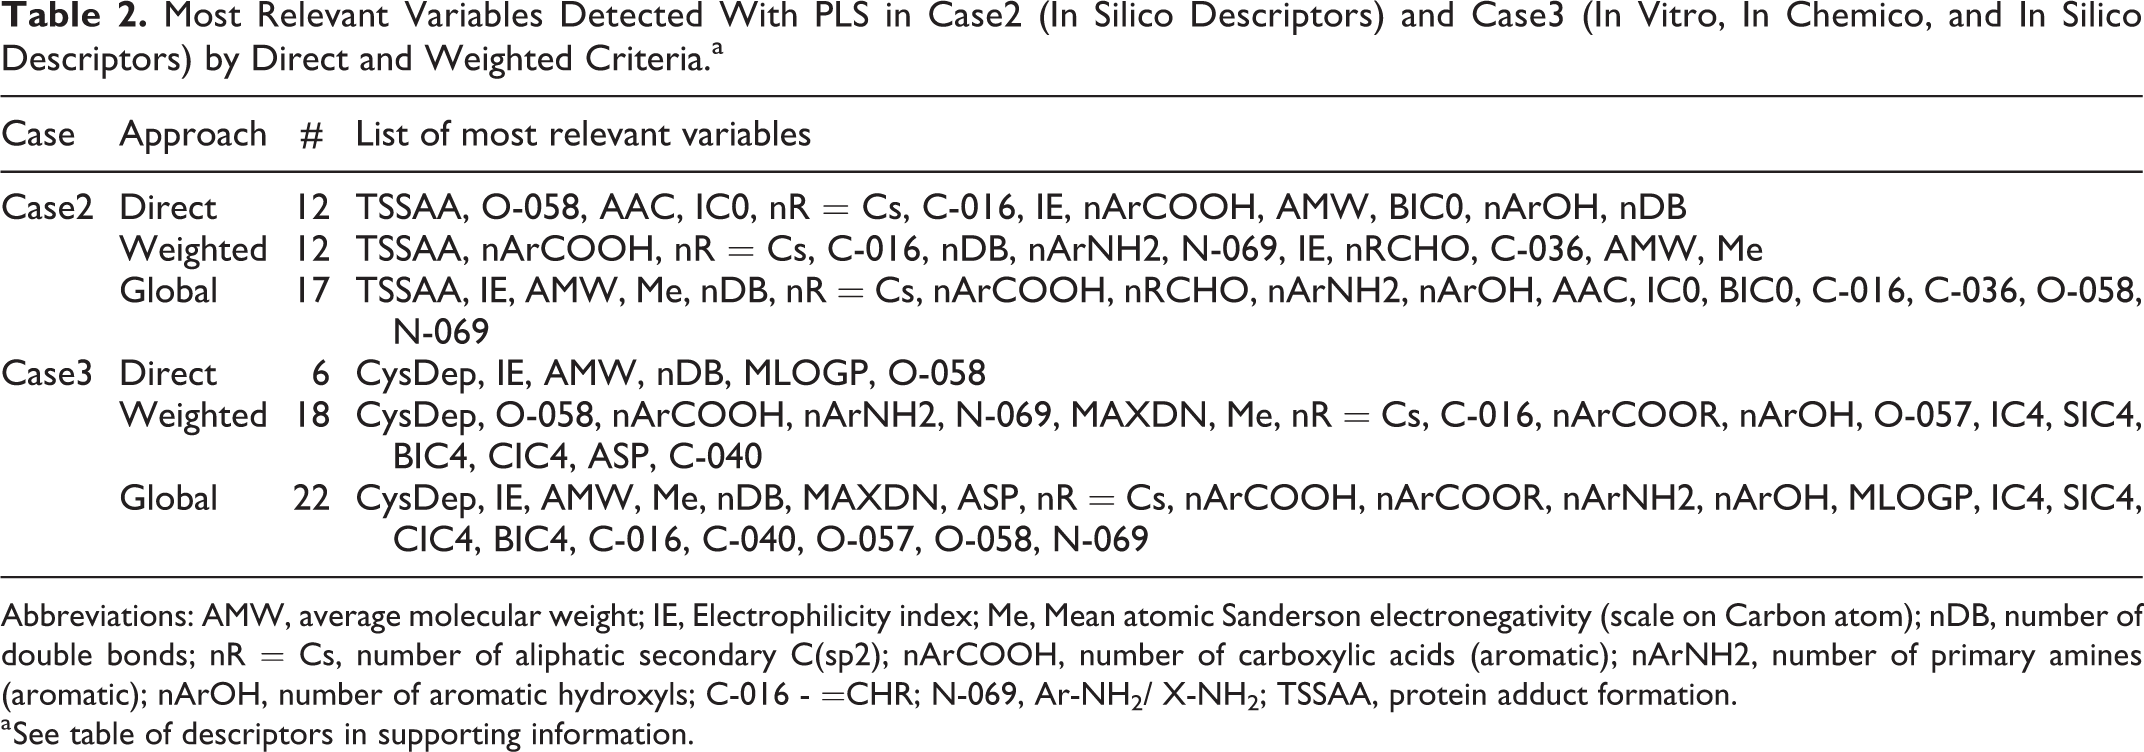
Abbreviations: AMW, average molecular weight; IE, Electrophilicity index; Me, Mean atomic Sanderson electronegativity (scale on Carbon atom); nDB, number of double bonds; nR = Cs, number of aliphatic secondary C(sp2); nArCOOH, number of carboxylic acids (aromatic); nArNH2, number of primary amines (aromatic); nArOH, number of aromatic hydroxyls; C-016 - =CHR; N-069, Ar-NH2/ X-NH2; TSSAA, protein adduct formation.
a See table of descriptors in supporting information.
Surprisingly, in both cases (case2 and case3), PLS soft-modeling approach pointed out that only a very small fraction of tested variables (17 in 383 [4.4%] and 22 in 386 [5.7%]) were detected as very relevant. The only evidenced experimental parameter was “CysDep,” either by direct and weighted approaches; “TSSAA” was only detected in in silico approach; and several predictors were detected in both cases (IE, AMW, Me, nDB, the number of terminal primary carbons sp2 [nR = Cs], nArCOOH, nArNH2, nArOH, C-016, O-058, N-069).
Model Selection
PLS is extremely robust to deal with multivariate systems (n<<m) but presents a huge difficulty in what concerns interpretation based on original variables. Since we are interested in understanding sensitizing potency, we preferred to use hard-modeling with MOLS to keep original response dependencies. With these PLS-selected variables, explained in Table 2, we developed 18 (17 dependencies and a constant) and 23 (22 dependencies and a constant) starting models with p = 1 initial parameter in MOLS and performed AIC and BIC optimization in ascending mode (“forward”). After convergence, the selected models were simplified by “backward” and “backward-forward” methodologies. With this process, we ended with 34 and 48 models for case2 and case3, respectively. Model performance evaluation is summarized in Tables 3 and 4.
Characterization and Performance of Obtained Models in Case2 (In Silico).
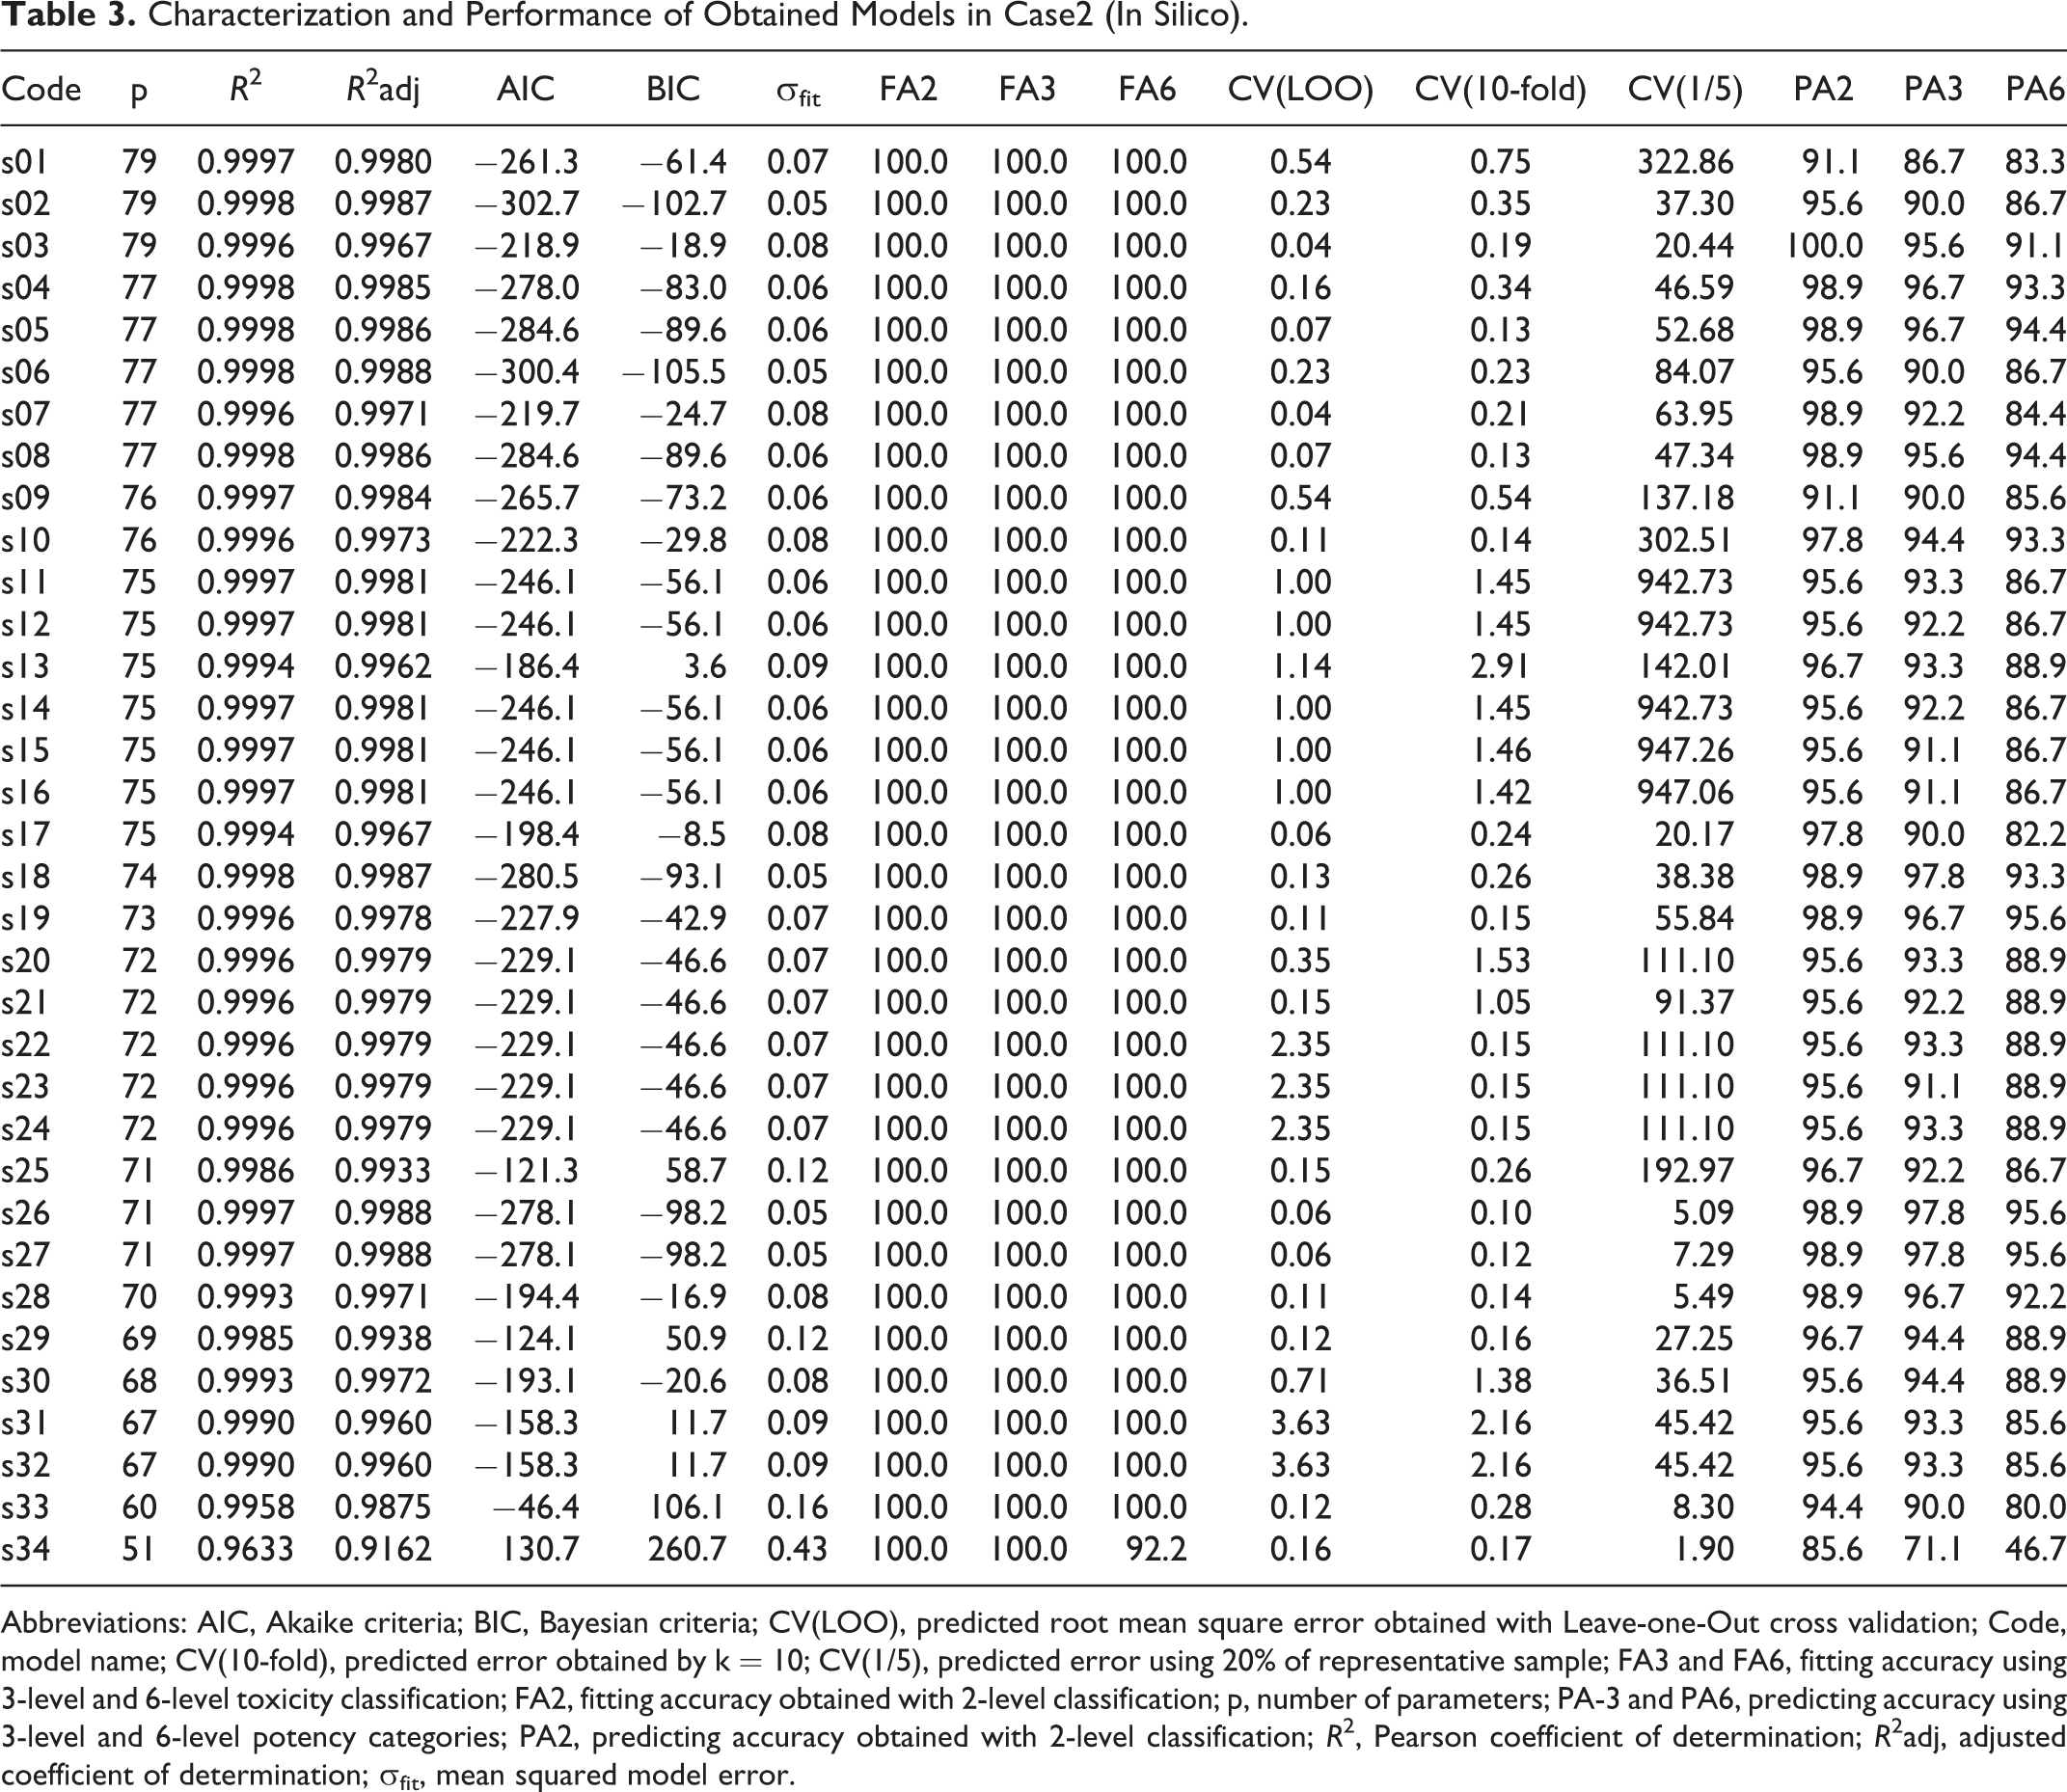
Abbreviations: AIC, Akaike criteria; BIC, Bayesian criteria; CV(LOO), predicted root mean square error obtained with Leave-one-Out cross validation; Code, model name; CV(10-fold), predicted error obtained by k = 10; CV(1/5), predicted error using 20% of representative sample; FA3 and FA6, fitting accuracy using 3-level and 6-level toxicity classification; FA2, fitting accuracy obtained with 2-level classification; p, number of parameters; PA-3 and PA6, predicting accuracy using 3-level and 6-level potency categories; PA2, predicting accuracy obtained with 2-level classification; R 2, Pearson coefficient of determination; R 2adj, adjusted coefficient of determination; σfit, mean squared model error.
Characterization and Performance of Obtained Models in Case3 (In Vitro, In Chemico, and In Silico).
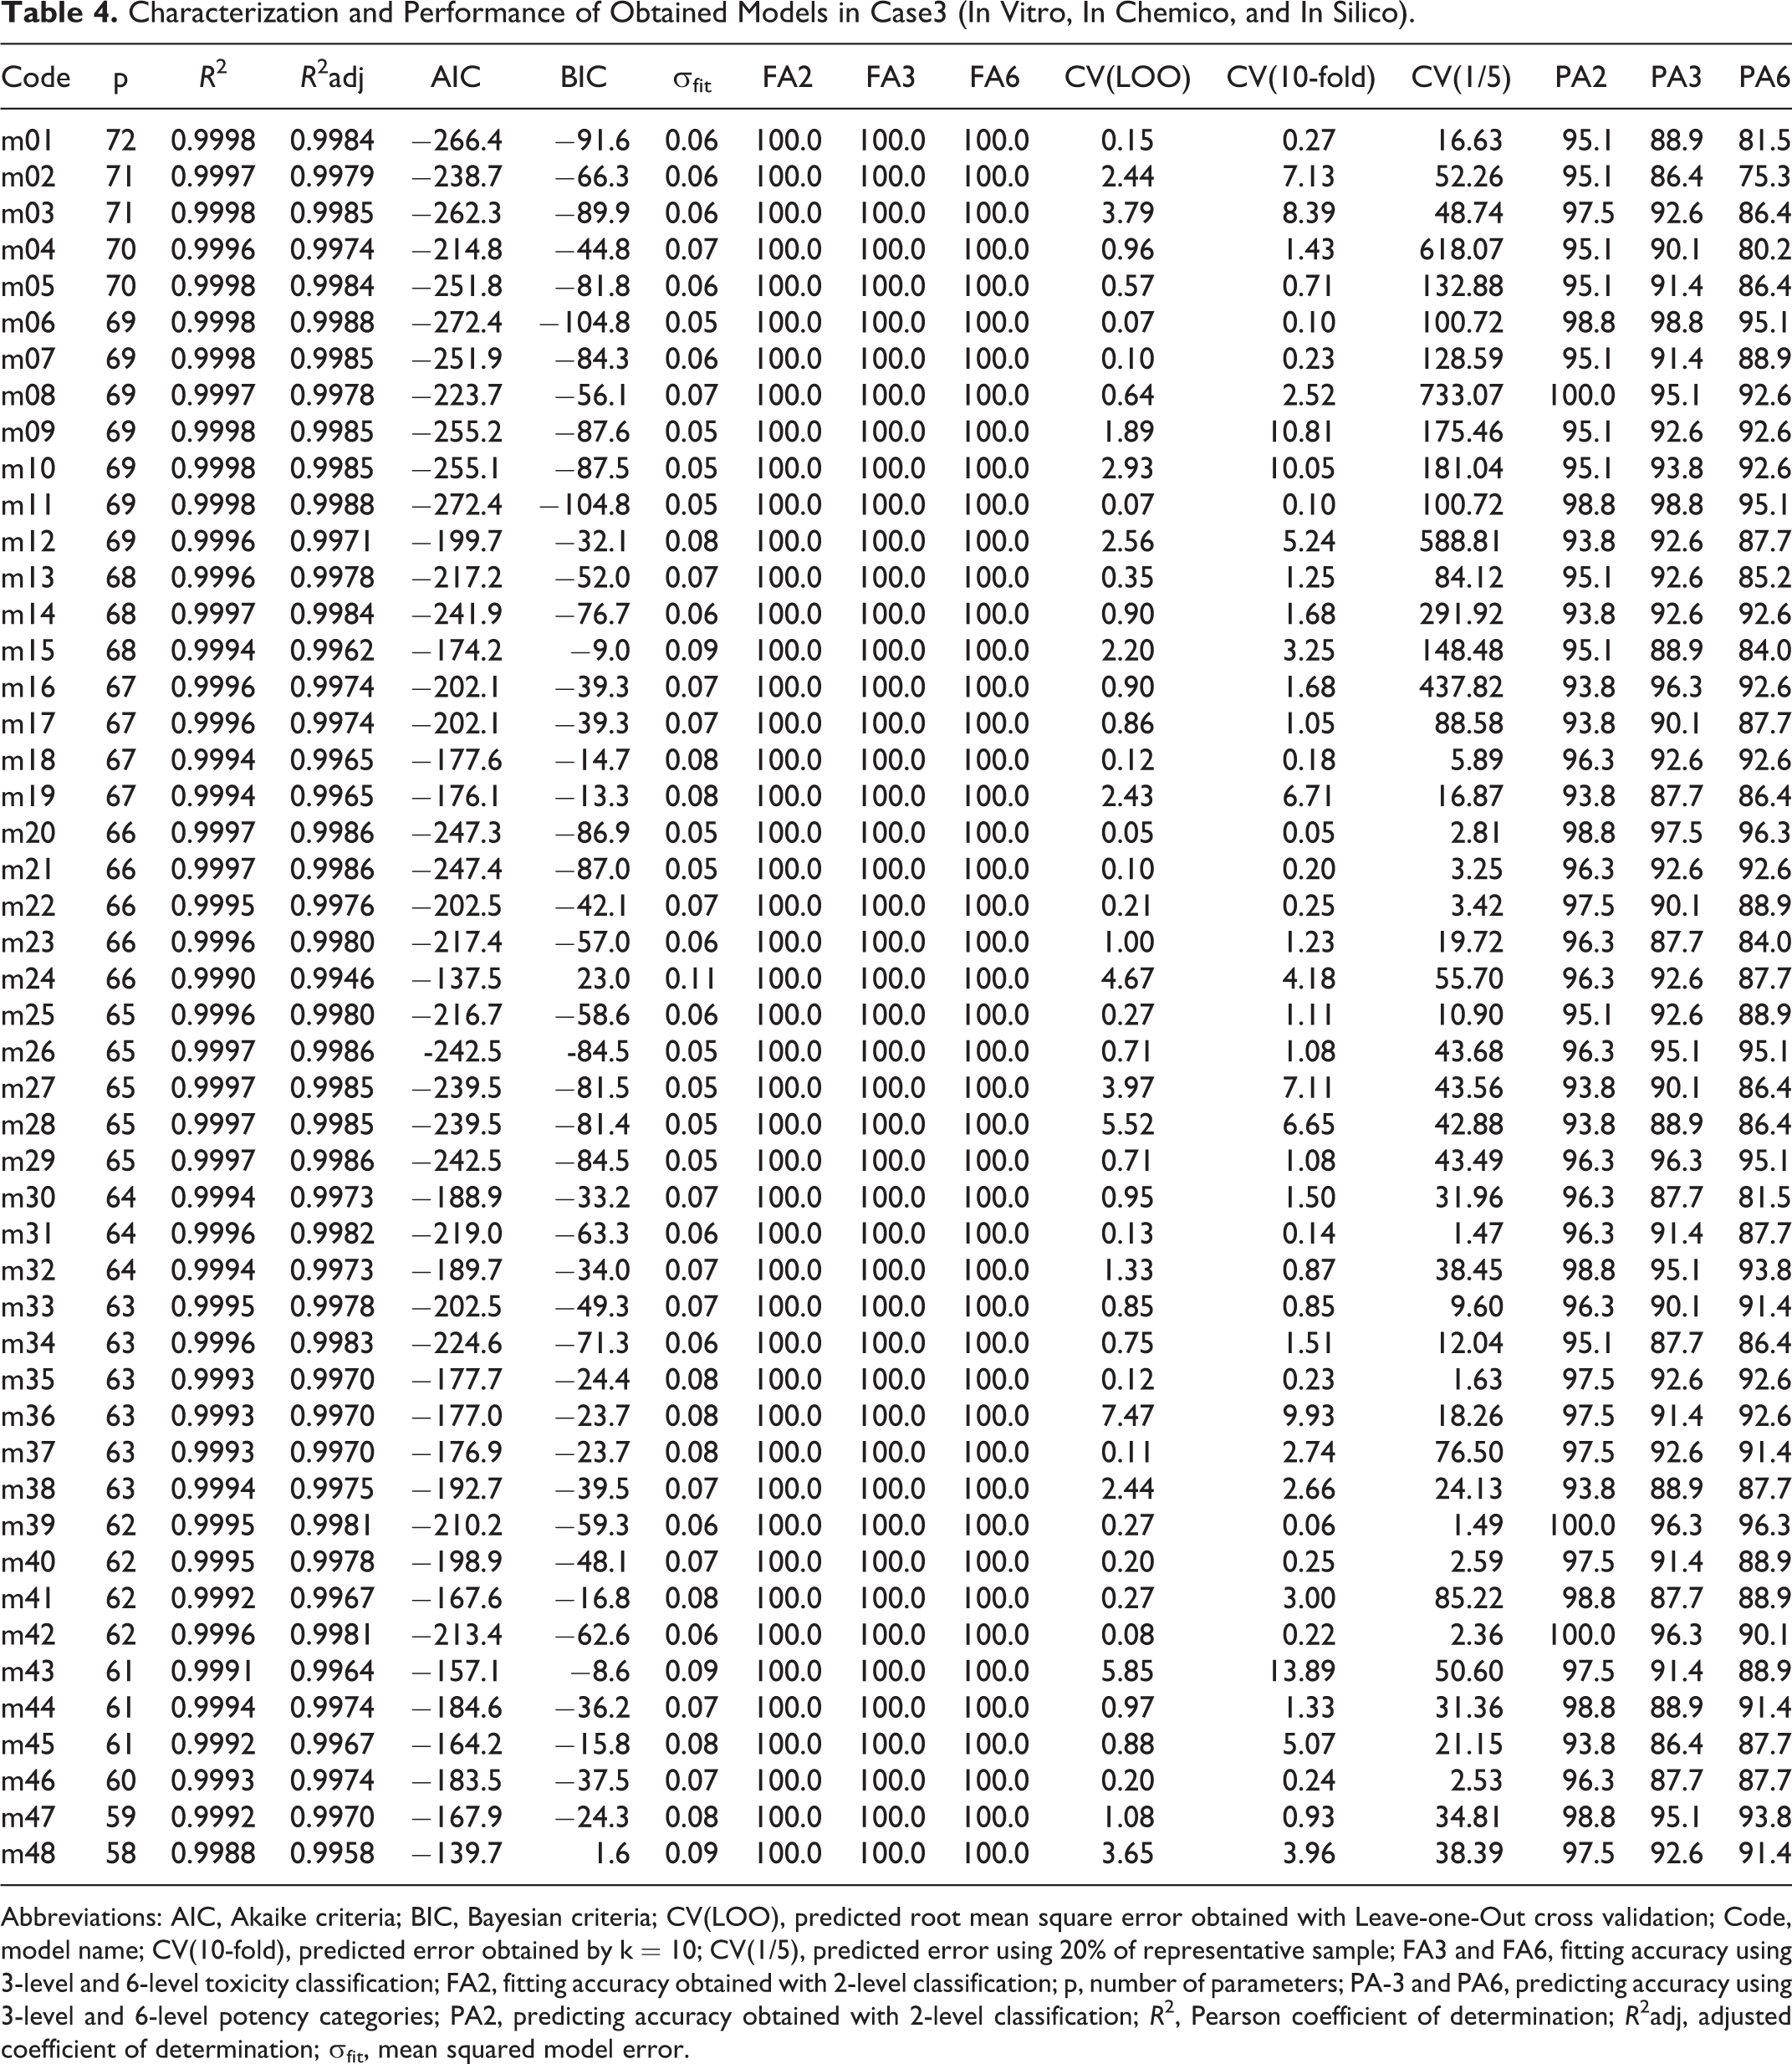
Abbreviations: AIC, Akaike criteria; BIC, Bayesian criteria; CV(LOO), predicted root mean square error obtained with Leave-one-Out cross validation; Code, model name; CV(10-fold), predicted error obtained by k = 10; CV(1/5), predicted error using 20% of representative sample; FA3 and FA6, fitting accuracy using 3-level and 6-level toxicity classification; FA2, fitting accuracy obtained with 2-level classification; p, number of parameters; PA-3 and PA6, predicting accuracy using 3-level and 6-level potency categories; PA2, predicting accuracy obtained with 2-level classification; R 2, Pearson coefficient of determination; R 2adj, adjusted coefficient of determination; σfit, mean squared model error.
From Tables 3 and 4, we see that all MOLS models are extremely accurate in describing the response (for most models R2 and R2adj > 0.999 and FA6 = FA3 = FA2 = 100%). However, these models present several dependencies that may be responsible for their difficulty in predicting new results. By comparing predicting cross-validation errors, from CV(LOO) to CV(1/5), predictions are extremely dependent upon training set dimensions, suggesting that these models are able to increase their prediction ability as the training set increases.
Analyzing the results for case2 (in silico data; Table 3) and case3 (in vitro, in chemico and in silico data; Table 4), we selected model “s26” (p = 71) and model “m20” (p = 66) as the best representative models, respectively. Model “s26” presents a predicting accuracy of 95.6% (6 fails in 90), 97.8% (2 fails in 90), and 98.9% (1 fail in 90) for 6-level, 3-level, and 2-level toxicity response, respectively. In turn, model “m20” was able to predict 96.3% (3 fails in 81), 97.5% (2 fails in 81), and 98.8% (1 fail in 81) of same 6-level, 3-level, and 2-level responses, respectively. Considering these results, we can conclude that the experimental information is crucial to increase prediction with simpler models (7.0% reduction in the number of parameters).
In order to check whether further model simplification was still possible, we processed them with “least significant parameter removal” criterion. 22 In Tables 5 and 6, we present this simplification process.
Performance Evolution of Model “s26” (Case2) by Successive Removal of Least Significant Parameters.
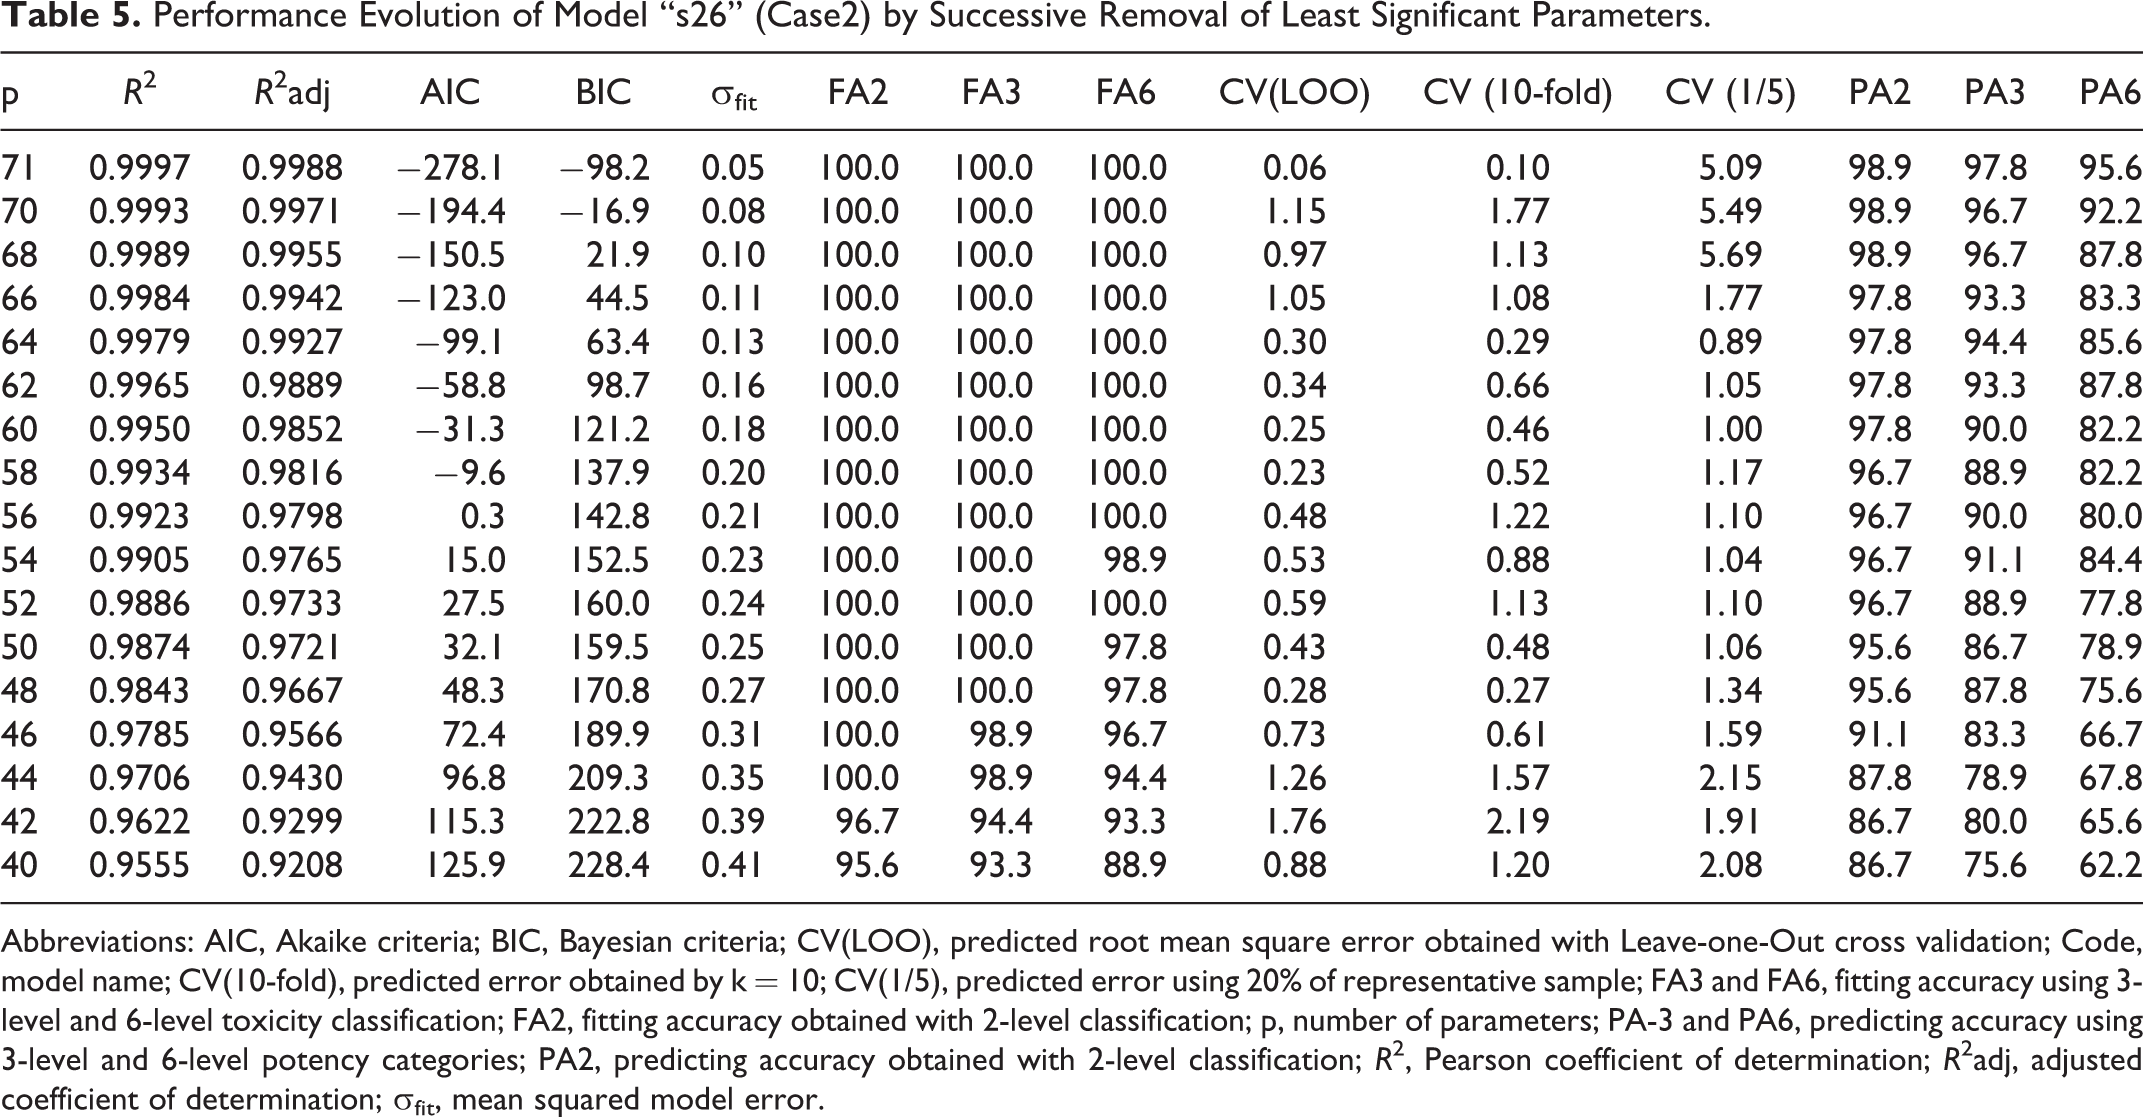
Abbreviations: AIC, Akaike criteria; BIC, Bayesian criteria; CV(LOO), predicted root mean square error obtained with Leave-one-Out cross validation; Code, model name; CV(10-fold), predicted error obtained by k = 10; CV(1/5), predicted error using 20% of representative sample; FA3 and FA6, fitting accuracy using 3-level and 6-level toxicity classification; FA2, fitting accuracy obtained with 2-level classification; p, number of parameters; PA-3 and PA6, predicting accuracy using 3-level and 6-level potency categories; PA2, predicting accuracy obtained with 2-level classification; R 2, Pearson coefficient of determination; R 2adj, adjusted coefficient of determination; σfit, mean squared model error.
Characterization and Performance of Model “m20” (Case3) During Its Simplification (Removal of Least Significant Parameter).
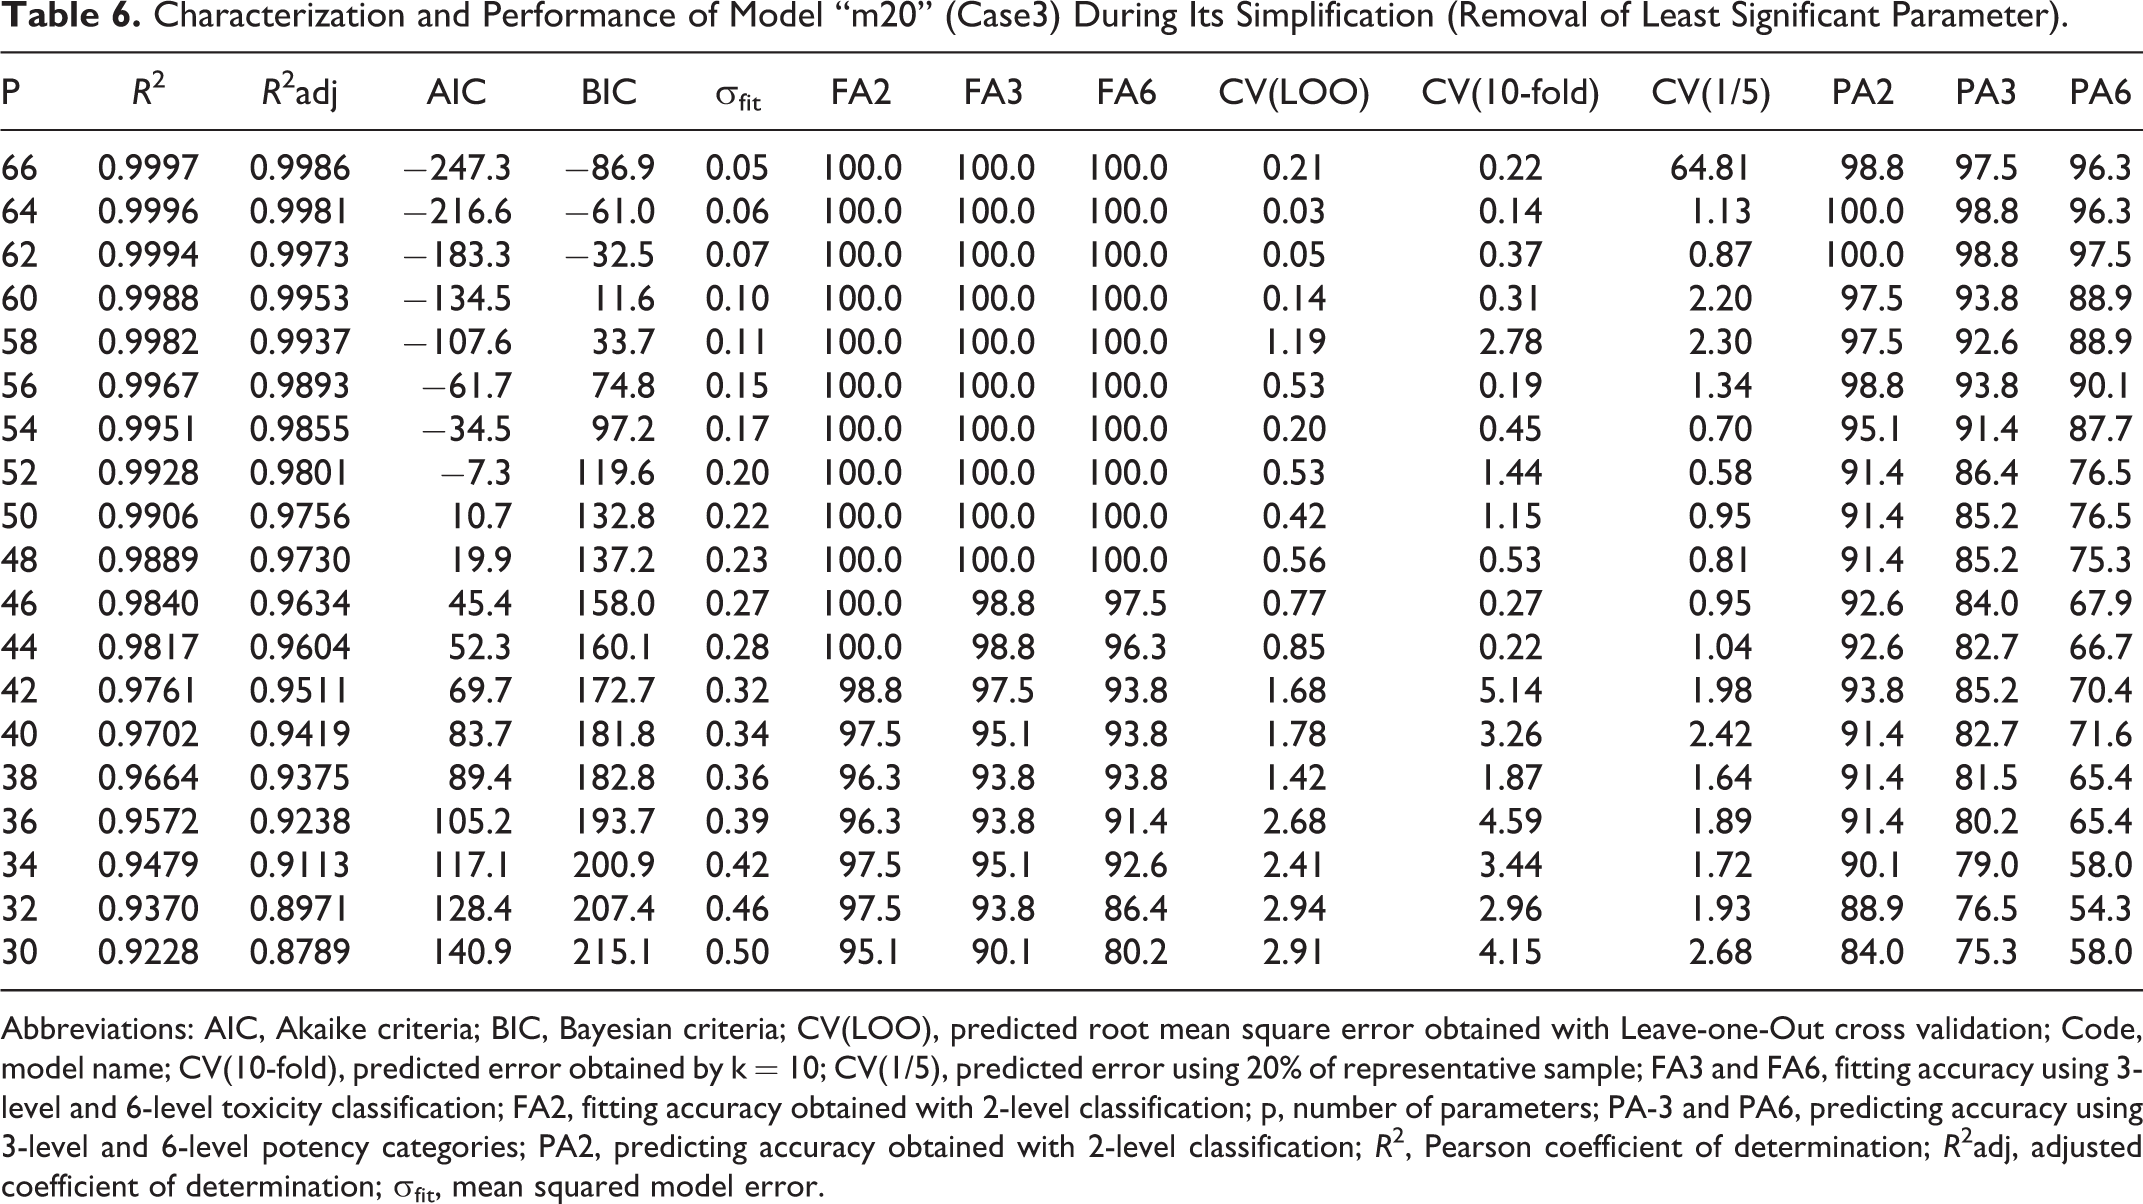
Abbreviations: AIC, Akaike criteria; BIC, Bayesian criteria; CV(LOO), predicted root mean square error obtained with Leave-one-Out cross validation; Code, model name; CV(10-fold), predicted error obtained by k = 10; CV(1/5), predicted error using 20% of representative sample; FA3 and FA6, fitting accuracy using 3-level and 6-level toxicity classification; FA2, fitting accuracy obtained with 2-level classification; p, number of parameters; PA-3 and PA6, predicting accuracy using 3-level and 6-level potency categories; PA2, predicting accuracy obtained with 2-level classification; R 2, Pearson coefficient of determination; R 2adj, adjusted coefficient of determination; σfit, mean squared model error.
From Table 5, we can conclude that is not possible to simplify the case2 model “s26” (p = 71) without seriously compromising its performance—the removal of one single parameter implies an irreversible loss in the predictive accuracy of 6-level response—from 4 fails to 7 fails out of 90. A smaller impact is observed in the 3-level case by increasing from 2 to 3 fails out of 90. However, in terms of 2-level response, the predictive ability is maintained with p = 68 parameters (1 fail in 90) and still significant till p = 48 (4 fails in 90) where PA3 and PA6 are very low (11 and 22 fails in 90, respectively).
In case3, selected model “m20” (p = 66) may be refined to p = 62 parameters with an additional improvement in predictive ability—from 3 fails to 2 and from 2 to 1 fails in 81 in PA6 and PA3 and from 1 fail to no fails in PA2. This is a clear evidence of an “overfitting” error in multivariate models. Continuing model simplification, predictive ability decreases but it is still possible to accurately predict 2-level toxicity with p = 56 (1 fail in 81) while PA3 and PA6 remains above 90% (with 5 and 8 fails in 81, respectively). With p = 48 (72.7% of initial parameters), it is still possible to correctly describe the response (100% in FA6, FA3, and FA2), but predictive ability considerably decreases (7 fails in 81 for 2-level response). It is still possible to go further in the model simplification to p = 42 (63.6% of initial parameters) where fitting ability (93.8%, 97.5%, and 98.8% for FA6, FA3, and FA2) and predictive ability for 2-level response (93.8% in PA2) remain significant.
By comparing both cases, we can see that data from in vit ro and in chemico assays seem to be relevant to describe and predict toxicity and the best results are obtained when combined with some in silico parameters.
According to Table 6, the initial model (“m20” with p = 66) preserves information related to all experimental descriptors (CysDep, LysDep, and EC30) and 63 (62 plus a constant) in silico predictors (electrophilicity index [EI], number of nitrogen atoms [nN], number of halogen atoms [nX], nR09, TI1, TI2, ww, Whete, Jhetp, MAXDP, PW4, BAC, Lop, D/Dr03, T(N.Cl), GGI1, GGI5, GGI6, JGI2, JGI3, JGI7, JGI9, J3D, ADDD, G1, PJI3, L/Bw, QYYp, G(N.S), G(O.S), nCp, nCs, the number of substituted benzenes sp2 [nCb-], nCconj, nR = Cs, the number of non-terminal carbons sp [nR#C-], number of aliphatic esters [nRCOOR], nRCHO, nRNH2, number of hydroxyl groups [nROH], nArOH, nOHt, nHBonds, hydrophilic factor [Hy], AMR, MLOGP, SRW05, piPC05, piPC06, piPC08, piPC09, SIC0, CIC0, BIC1, C-001, C-005, C-008, C-024, H-051, H-052, O-056, S-107).
By simplification, with the removal of 4 variables (nR09, Lop, nRCHO, H-052), the new model gains maximal prediction accuracy (97.5%, 98.8%, and 100.0% accuracy for 6-level, 3-level, and 2-level responses, respectively).
By further simplification, with the removal of extra 6 in silico predictors (Whete, JGI2, J3D, nCconj, MLOGP, O-056), the model remains accurate, describing all responses (100.0% for FA6, FA3, and FA2) but losing some predictive ability—there is a generic increase in fails from 0 to 1, from 1 to 5, and from 2 to 8 in PA2, PA3, and PA6, respectively.
By removing 8 extra variables, we encounter a very interesting situation where all responses are very well described (100% for FA2, FA3, and FA6), and we still get a good prediction for 2-level response (91.4%), but results for 3-level and 6-level responses were not as good (only about 85.2% and 75.3%).
After striping another extra 6 predictors, we still get a quite satisfactory model in describing all responses (98.8%, 97.5%, and 93.8% for FA2, FA3, and FA6) while higher performance differences are evidenced in terms of prediction—a quite satisfactory prediction for 2-level response case (PA2 = 93.8), a reasonable prediction in 3-level response (PA3 = 85.2%) and a bad result for 6-level response (PA6 = 70.4%). This last relatively reliable model maintains dependencies with 41 predictors—2 experimental (CysDep and Ec30) and 39 in silico (EI, nN, TI1, ww, Jhetp, PW4, BAC, D/Dr03, T(N.Cl), GGI1, GGI5, GGI6, JGI3, JGI7, JGI9, G1, PJI3, QYYp, G(N.S), nCp, nCs, nCb-, nR=Cs, nRCOOR, nRNH2, nROH, nArOH, nOHt, Hy, AMR, SRW05, piPC05, piPC06, piPC09, SIC0, CIC0, C-001, C-008, H-051).
Discussion
Results demonstrated the advantage of using PLS and MOLS combined with a first-degree polynomial approach in order to retrieve information for describing and predicting skin sensitization.
Recalling Table 2, PLS was able to select 22 predictors, where only one of the experimental descriptors was evidenced (CysDep). Comparing PLS and MOLS results on variable relevance, they only coincide in 3 predictors (CysDep, IE, nR = Cs). Previous works involving soft-modeling (PLS) and hard-modeling (MOLS) in response description and prediction 19,20,22 also showed similar results, while PLS is only focused in relating predictor subspace information with response subspace information and, independently of variable correlation, MOLS, with all statistical support, is able to detect internal subspace correlations and thus allows to select most relevant and independent ones. However, PLS was important in our approach given it allowed the generation of initial seeding predictors for model generating and building processes.
By analyzing the molecular descriptors that demonstrated to be relevant for the description of the response, and by considering the key events beyond the AOP for skin sensitization, it is possible to find common points. These molecules are frequently strong electrophiles with polarized bonds and have functional groups like amides, aldehydes and ketones. Therefore, it is easy to understand the presence of the EI as a molecular descriptor related with the KE1 since it is a descriptor of reactivity that measures the global electrophilic nature of a molecule within a relative scale. The relevance of descriptors like the nROH or the number of aromatic hydroxyl groups is also clear. The substantially greater electronegativity of oxygen in comparison with carbon and hydrogen is responsible for the polarization of the covalent bonds in this functional group. In the same way, the nN is also related to KE1 because this atom is a part of the constitution of an amide, described as one of the reactive functional groups in skin sensitizers.
As a consequence of the skin sensitizers structural characteristics, they react mostly with cysteine and lysine residues via bimolecular and aromatic nucleophilic substitution (SN2 and SNAr), acylation reactions, Michael addition, and Schiff base formation, as shown in Figure 3. 32,38,39
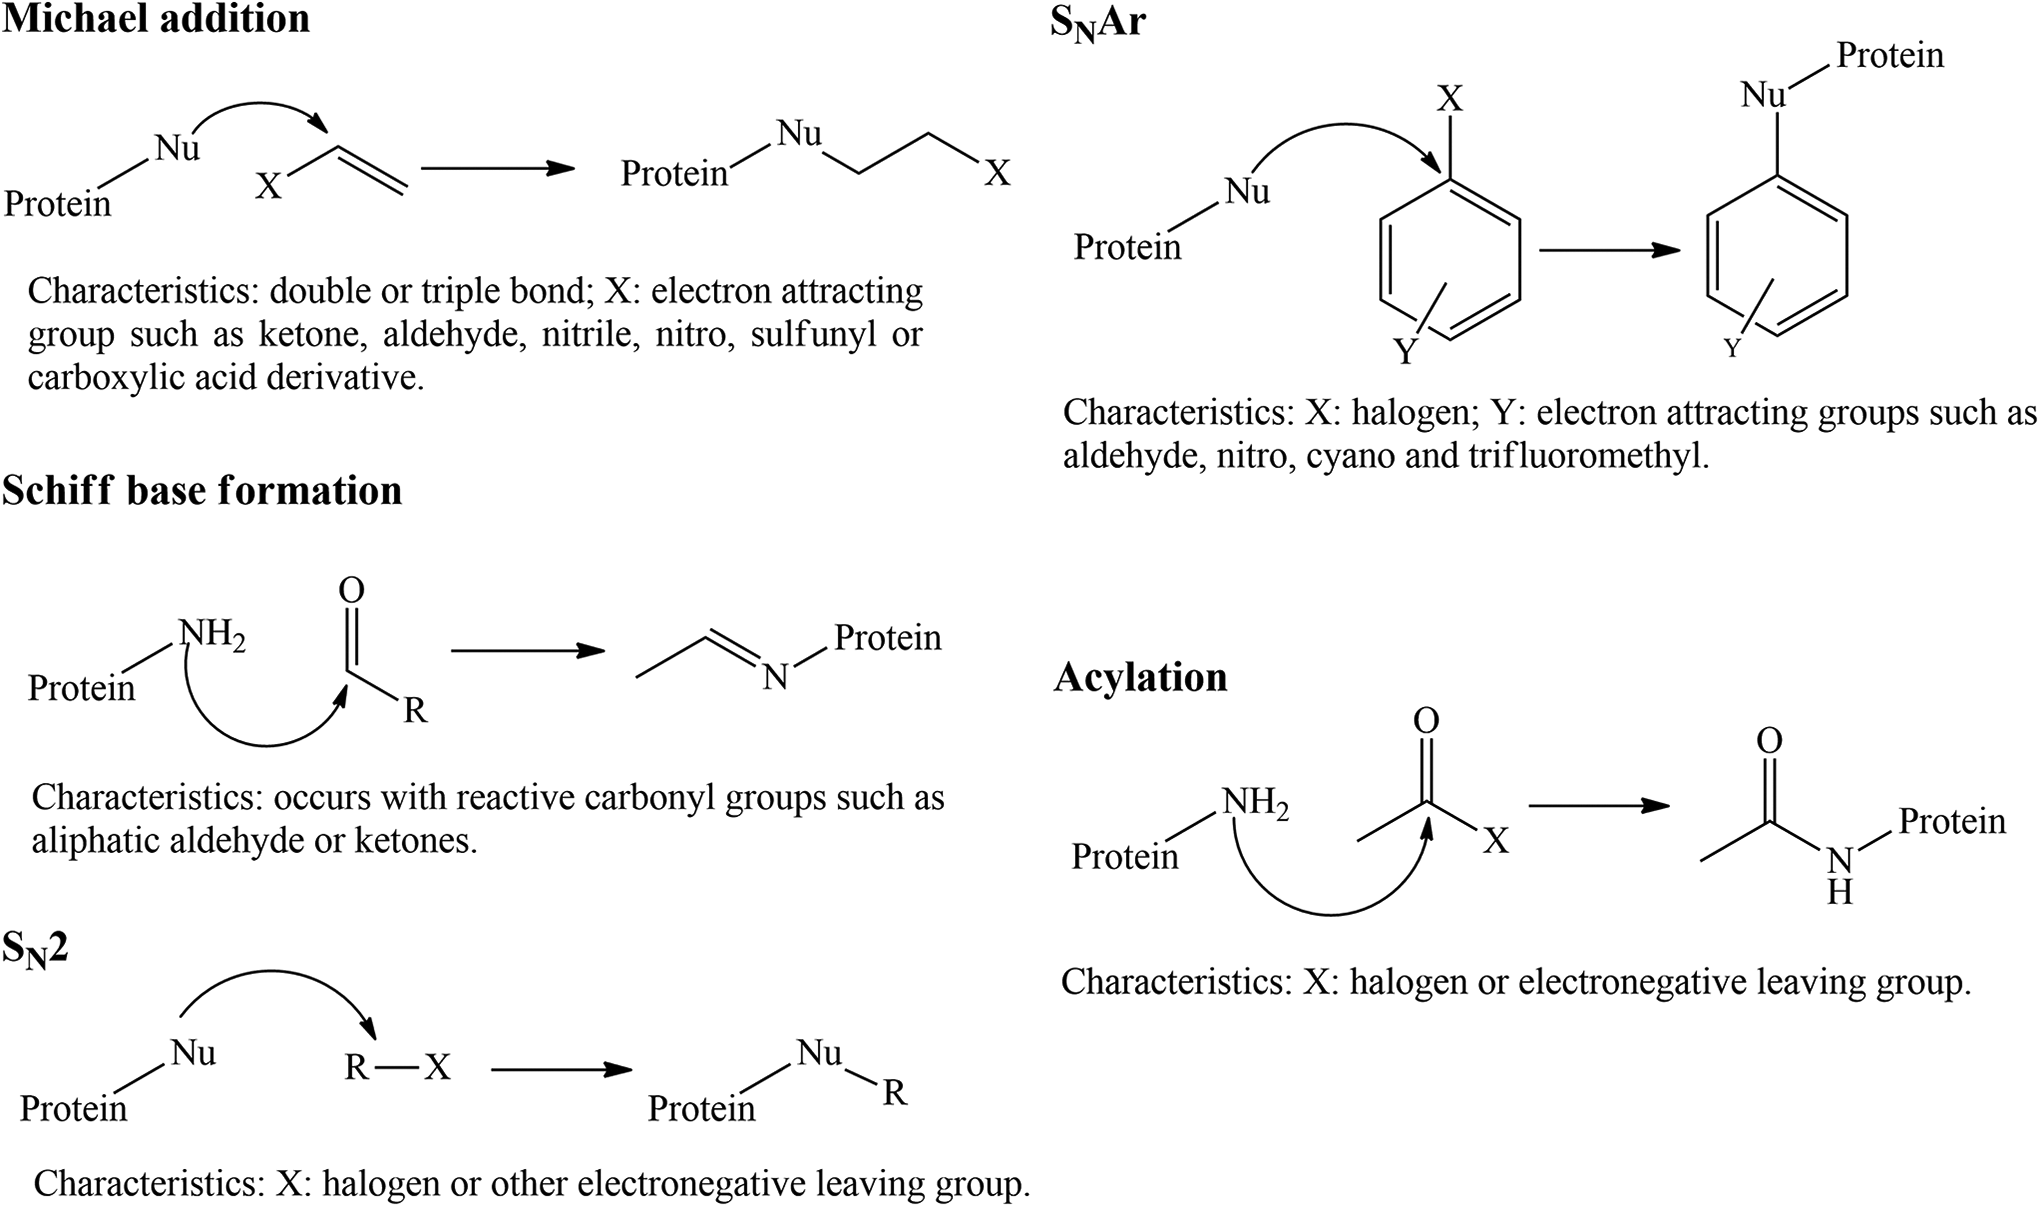
Mechanisms of reactions between proteins and allergens, promoting skin sensitization. Nu indicates nucleophile; SN2, bimolecular nucleophilic substitution; SNAr, aromatic nucleophilic substitution. Adapted from reference. 32
Thus, descriptors like nRCOOR, nX, nCb-, nR = Cs, and nR#C-, are correlated with the reactivity between proteins and allergens. Aliphatic esters are carboxylic acid derivatives and for this reason can react with proteins via Michael addition. This reaction also involve double or triple bonds and consequently sp2 and sp carbons (nR = Cs and nR#C-). For the occurrence of KE1 via SN2, SNAr, or acylation, the nX might be determinant because in general they are good leaving groups. In addition, the reactivity via SNAr is also benefited by the presence of substituted benzenes (nCb-).
Skin penetration properties have a relevant role to trigger the AOP for skin sensitization. Sensitizers are compounds capable of penetrating the skin, and once there, they react with skin proteins as described previously. In this regard, the inclusion of the octanol–water partition coefficient (LogP; descriptor MLOGP) and the Hy are also relevant because the penetration depends on the chemicals lipophilicity or hydrophobicity. It is also known that the surface charge of the molecules influences skin penetration and their reactivity, which was confirmed by the selection of 7 topological charge descriptors (GGl1, GGl5, GGl6, JGI2, JGI3, JGI7, and JGI9). On the other hand, the walk and path variables describe molecular complexity that also influences the above events. Eight of these descriptors turned out to be relevant (SRW05, piPC05, piPC06, piPC08, piPC09, SIC0, CIC0, and BIC1). It should also be noted that the geometry of the molecules influences reactivity, which supports the selection of 8 of these descriptors (J3D, ADDD, G1, PJI3, L/Bw, QYYp, G[N.S], and G[O.S]).
Supporting the confidence on the variables selected by our approach, previous studies revealed that descriptors correlated with the reactivity, the energy of highest occupied and lowest unoccupied molecular orbitals, and with the skin penetration are preferred in the description of the skin sensitization response. 40
In fact, there are several other methods described in the literature to evaluate risk and potency of skin sensitizers. However, very few use human information to train models, being hazard retrieved from animal methods such as the LLNA or GPMT, the most commonly used. This constitutes a serious limitation because the information obtained by these methods does not adequately correlate with human clinical responses. The potency categorization of chemicals is also predicted in some approaches but considering just 3 or 4 categories. In this study, 6-levels of classification have been considered allowing a more accurate classification of chemical potency.
For hazard identification (sensitizers vs non-sensitizers), our method revealed a better performance in relation to the methods already available (generally inferior to 90%). The model with the best performance until now was described by Strickland and colleagues. 41 This defined approach includes information from 3 in chemico and in vitro assays (DPRA, h-CLAT, and KeratinoSens), 6 physicochemical properties, and 12 in silico descriptors from QSAR Toolbox version 3.2. This model showed 92% of accuracy and included the average of cysteine and lysine depletion, information obtained with h-CLAT assay and with the Toolbox and LogP as predictors. The study also reveals the importance of cysteine depletion and LogP in the skin sensitization response, 2 descriptors also identified in our approach (CysDep and MLOGP). However, the aforementioned method has a performance equal to, if not worse than our models and the experimental assays considered are more complex, making the prediction less practical and more expensive.
Models to predict the potency of chemicals generally show lower accuracies than for hazard identification and our models are no exception. However, our accuracy reveals an advance relative to other methods described in the literature. Zang and colleagues described a model to predict skin sensitization potency considering the GHS classification for LLNA and humans, using 6 physicochemical properties and experimental data from DPRA, h-CLAT, and KeratinoSens assays. 42 Authors described the best model as having an accuracy of 89% and 81% relatively to LLNA and human data, respectively. When compared to our approach, we achieved an accuracy for 6-levels potency in humans equal, if not better, considering or not experimental data. Once again, the experimental assays used by Zang et al adds limitations to the model, such as the costs and the time expended.
Conclusions
In this work, we evaluated the feasibility of experimental and computational descriptors to properly predict the skin sensitization potential of chemicals and their potency. To achieve this goal, we used a data set of known human skin allergens and non-allergens with different potencies to build classifiers for high-throughput virtual screening. Two skin sensitization responses were considered, 1 to categorize the potency of chemicals (according to a 6-level and 3-level scale) and the other for hazard classification, aiming to distinguish skin sensitizers from non-sensitizers (2-level scale).
In an initial modeling stage, PLS was used to extract the most relevant predictors from a huge pool of variables (over 380), using a direct and a weighted criteria. With this selected pool, several models were developed and refined with MOLS optimization based on first degree polynomial dependencies, according to the AIC and BIC criteria. Via hard-modeling, we were able to retrieve direct dependencies between predictors and responses, evidencing their relevance in describing and predicting new values. This modeling methodology is relatively simple to implement and present the advantages of evidencing direct relationship between predictors and the adverse outcome pathway for skin sensitization.
From our results, we conclude that by using exclusively in silico calculated descriptors, it is possible to avoid time-consuming experimental tests, but the models are less accurate than the ones additionally including in vitro and in chemico information. However, in practical terms, it can be advantageous to consider both, using in a first approach, the models based on in silico data and then the models based on in vitro, in chemico, and in silico data to confirm the results. For instance, it is possible to estimate the potential of a chemical to induce skin sensitization, as well as its respective potency, in a fast and cheap way and, importantly, without the need of having the chemical synthesized or isolated. Using this strategy, it is possible for chemical, cosmetic, and pharmaceutical industries to make better and more informed decisions in initial chemical screening steps, before investing resources in experimental assays.
Supplemental Material
Supplementary_Material - Evaluating Skin Sensitization Via Soft and Hard Multivariate Modeling
Supplementary_Material for Evaluating Skin Sensitization Via Soft and Hard Multivariate Modeling by Filipa A. L. S. Silva, Gonçalo Brites, Isabel Ferreira, Ana Silva, Bruno Miguel Neves, Jorge L. G. F. S. Costa Pereira and Maria T. Cruz in International Journal of Toxicology
Footnotes
Author Contributions
Silva, F. contributed to conception and design, contributed to acquisition, analysis, and interpretation, drafted manuscript, and critically revised manuscript; Brites, G. contributed to conception, contributed to acquisition, and critically revised manuscript; Ferreira, I. contributed to conception, contributed to acquisition and critically revised manuscript; Silva, A. contributed to conception, contributed to acquisition, and critically revised manuscript; Neves, B. contributed to conception and design, contributed to analysis and interpretation, drafted manuscript, and critically revised manuscript; Pereira, J. contributed to conception and design, contributed to acquisition, analysis, and interpretation, drafted manuscript, and critically revised manuscript; Cruz, M. contributed to conception and design, contributed to interpretation, drafted manuscript, and critically revised manuscript. All authors gave final approval and agree to be accountable for all aspects of work ensuring integrity and accuracy.
Declaration of Conflicting Interests
The author(s) declared no potential conflicts of interest with respect to the research, authorship, and/or publication of this article.
Funding
The author(s) disclosed receipt of the following financial support for the research, authorship, and/or publication of this article: The Coimbra Chemistry Centre (CQC) is supported by Fundação para a Ciência e a Tecnologia (FCT), through the project UI0313/QUI/2013, also co-funded by FEDER/COMPETE 2020-UE. The Center for Neuroscience and Cell Biology (CNC) is supported by European Regional Development Fund (ERDF) through the Competitiveness Factors Operational Program – COMPETE 2020 and by National Funds through the FCT within the scope of the Strategic Project with the reference: POCI-01-0145-FEDER-007440. This work was also financed by the ERDF, through the Centro 2020 Regional Operational Programme: project CENTRO-01-0145-FEDER-000012-HealthyAging2020, the COMPETE 2020 – Operational Programme for Competitiveness and Internationalisation, the Portuguese national funds via FCT, ref. CENTRO-01-0145-FEDER-029369. Isabel Ferreira and Gonçalo Brites are supported by the FCT through an individual PhD fellowship (SFRH/BD/110717/2015 and PD/BDE/142926/2018, respectively).
Supplemental Material
Supplemental material for this article is available online.
References
Supplementary Material
Please find the following supplemental material available below.
For Open Access articles published under a Creative Commons License, all supplemental material carries the same license as the article it is associated with.
For non-Open Access articles published, all supplemental material carries a non-exclusive license, and permission requests for re-use of supplemental material or any part of supplemental material shall be sent directly to the copyright owner as specified in the copyright notice associated with the article.