
Abstract
Despite several studies addressing nanoparticle (NP) interference with conventional toxicity assay systems, it appears that researchers still rely heavily on these assays, particularly for high-throughput screening (HTS) applications in order to generate “big” data for predictive toxicity approaches. Moreover, researchers often overlook investigating the different types of interference mechanisms as the type is evidently dependent on the type of assay system implemented. The approaches implemented in the literature appear to be not adequate as it often addresses only one type of interference mechanism with the exclusion of others. For example, interference of NPs that have entered cells would require intracellular assessment of their interference with fluorescent dyes, which has so far been neglected. The present study investigated the mechanisms of interference of gold NPs and silver NPs in assay systems implemented in HTS including optical interference as well as adsorption or catalysis. The conventional assays selected cover all optical read-out systems, that is, absorbance (XTT toxicity assay), fluorescence (CytoTox-ONE Homogeneous membrane integrity assay), and luminescence (CellTiter Glo luminescent assay). Furthermore, this study demonstrated NP quenching of fluorescent dyes also used in HTS (2′,7′-dichlorofluorescein, propidium iodide, and 5,5′,6,6′-tetrachloro-1,1′,3,3′-tetraethyl-benzamidazolocarbocyanin iodide). To conclude, NP interference is, as such, not a novel concept, however, ignoring this aspect in HTS may jeopardize attempts in predictive toxicology. It should be mandatory to report the assessment of all mechanisms of interference within HTS, as well as to confirm results with label-free methodologies to ensure reliable big data generation for predictive toxicology.
Keywords
Introduction
Studies addressing interference of nanoparticles (NPs) with conventional toxicity assays have been recorded since more than a decade ago. For example, quenching of fluorescent dyes by gold NPs (AuNPs) have been demonstrated as early as 2002, 1 while interference of carbon nanotubes (CNTs) with colorimetric-based assays have been demonstrated since 2006. 2-6 Several high-quality reviews on NP-assay interference have been published throughout the recent years. 7-12 Yet, Ong et al 13 reported that of the papers published in 2010, which used at least one type of colorimetric or fluorimetric-based assay, 95% of these were published without reporting screening for NP interference. In 2012, the percentage of published papers not reporting on assay interference assessment decreased by a mere 5% (ie, from ∼95 to ∼ 90%). 13
Interference of NPs can occur via several mechanisms. NPs with optical properties, that is, surface plasmon resonance (SPR), may interfere indirectly with the assay by altering the absorbance, fluorescence, or luminescence read-outs. 14,15 NPs may also interfere directly with the assay by interacting with the substrate and/or product due to their large surface area per unit mass and surface reactivity. 16,17 NPs may also catalyze the conversion of substrate to product. Once again, the large surface area per unit mass and surface reactivity may lead to an excess in surface energy with subsequent enhancement in the NPs’ catalytic activity. 17-19 Metal NPs have shown to exhibit catalytic activities. 20-22 Finally, NPs, particularly metal NPs with strong SPR, for example, AuNPs, silver NPs (AgNPs), platinum, and copper NPs may enhance or quench the intensity of fluorophores via resonant energy transfer. 23 , 24 Despite all these possible mechanisms, Ong et al 13 found that the most common control performed by published studies was the addition of NPs to the assay components alone (2010: 5%, 2012: 8%), followed by measurement of the intrinsic fluorescence or absorbance of the NPs (2010: 2%, 2012: 5%), and then with NPs and an analyte (2010: 1%, 2012: 4%). Therefore, researchers appear to favor assessing certain mechanisms over others and do not test all the possible mechanisms. While conducting a meta-analysis on literature addressing NP toxicity, Labouta et al 25 noticed that of 2,896 sample data, tetrazolium salt colorimetric-based assays (eg, 3-[4,5-dimethylthiazole-2-yl]-2,5-diphenyltetrazolium bromide [MTT], 3-(4,5-dimethylthiazol-2-yl)-5-(3-carboxymethoxyphenyl)-2-(4-sulfophenyl)-2H-tetrazolium [MTS], 2,3-Bis-(2-methoxy-4-nitro-5-sulfophenyl)-2H-tetrazolium-5-carboxanilide [XTT], and water-soluble tetrazolium salts [WST-1]) always resulted in higher cell viability compared with the lower cell viabilities reported using lactate dehydrogenase (LDH) assays for magnesium oxide, aluminium oxide (Al2O3), iron (III) oxide (Fe2O3), and copper oxide (CuO) NPs. Moreover, Labouta et al 25 showed that 85% of the studies selected for the meta-analysis do not report screening for NP interference.
One would expect that the importance of NP interference screening would become more vital with time to prevent further discrepancies among studies. However, with the advent of the high-throughput screening (HTS) era for NP toxicity, it appears that the assessment of NP interference and the reporting thereof have perhaps been somewhat neglected. The HTS has undoubtedly become the next major development in nanotoxicology to advance predictive toxicity assessment and therefore risk governance. Yet, it appears that most of these HTS platforms still require the use of colorimetric or fluorimetric-based assays. For example, Lui et al 26 suggested a web-based platform for HTS data analyses tool that provides statistical methods suitable for engineered nanomaterial (ENM) toxicity data for the elucidation of toxicity mechanisms and development of structure–activity relationships for predictive ENM toxicity. Their HTS setup included assays for cellular membrane permeability by propidium iodide (PI) uptake, intracellular calcium flux by Fluo4 fluorophore, reactive oxygen species (ROS) production by MitoSox Red fluorophore, and mitochondrial membrane potential by 5,5′,6,6′-tetrachloro-1,1′,3,3′-tetraethyl-benzamidazolocarbocyanin iodide (JC-1) fluorophore. 26 More recently, Filipova et al 27 suggested a “three-in-one” screening assay for NP toxicity, which could be scaled up for high-throughput testing. Their screening assay, however, consisted of the WST-8 tetrazolium salt assay, LDH assay, and Hoechst 33342, of which the WST-8 and LDH assays showed interference with carbon-based NPs. 27 It would have been valuable if the authors had assessed all types of interference mechanisms present instead of just only one mechanism. Several other HTS screening programs have also been devised consisting of the DNA intercalating dye, Hoechst 33342, to assess cell number and nuclear size, JC-1 dye to assess perturbation of mitochondrial membrane potential, Fluo4, and PI. 28
In addition, several large projects supported through the European Union’s Research and Innovation funding initiatives such as the previous 7th Framework program (FP7; ie, NanoMILE, NanoTest, NanoSolutions, NanoReg, Marina, and Sun) and the current Horizon 2020 program have and will rely on HTS to create big data for predictive in silico modeling approaches. An advanced review published by Collins et al 29 under the FP7 NanoReg program has addressed several HTS setups particularly for NPs ranging from high-throughput flow cytometry analysis (to assess apoptosis/necrosis, ROS production, specific cellular uptake), multiplex analysis of secreted cytokines and growth factors and so on, high throughput comet, micronucleus and histone protein γH2AX assays (for genotoxicity testing), as well as high-throughput omics assays (ie, chip-based or genome-wide sequencing technologies for genetic alterations). Undoubtedly, as mentioned in their review, all these high-throughput platforms suffer from at least some type of NP interference, and certain NPs would have to be excluded from these HTS platforms. Similarly, one of the HTS platforms used during the NanoMILE project consisted of high-throughput fluorescent imaging of both Hoechst 33342 and PI. 30 In another HTS platform of the NanoMILE project, Röttgermann et al 31 designed micropatterned single-cell arrays for real-time tracking of NP-induced cell death in sets of thousands of cells in parallel. Two fluorescent indicators of apoptosis, that is, Annexin (pSIVA) and PI, were simultaneously monitored in their setup. The NP interference screening was not reported in these studies.
In the United States, the University of California’s Center for the Environmental Impact of Nanotechnology as well as the UCLA Center for NanoBiology and Predictive Toxicology have also relied on automated epifluoretic-based HTS approaches consisting of the DNA intercalating dye, Hoechst 33342, JC-1, Fluo4, and PI. 32-37 It is inevitable that interference with these fluorescent dyes by most NPs will be present. Therefore, it is critical that mandatory interference assessment and reporting thereof in all HTS setups be implemented.
The aim of this current study is to present the experimental strategies needed to investigate the different types of interference mechanisms with conventional toxicity assays namely the absorbance-based XTT assay for mitochondrial activity, the fluorescence-based CytoTox One assay for LDH release for membrane integrity, and the luminescence-based CellTiter Glo assay for adenosine triphosphate (ATP) levels for cell viability. Interference with these three assays was determined on all levels ranging from interference in the conversion of substrate to product, to interference with product only, or with substrate only. The results of these assays were also compared to that of a label-free, impedance-based system, which is not affected by NP interference. In addition, this study shows interference with three additional fluorescent dyes namely, 2′,7′-dichlorofluorescein (DCF), PI, and JC-1.
Materials and Methods
Particles
The citrate-capped AuNPs were prepared by Mintek (Randburg), as described in Vetten et al. 38 The final concentration of the AuNPs in Milli-Q water was 0.07 mg/mL. The citrate-capped AgNPs, which was suspended in 2 mM aqueous citrate buffer at a final concentration of 0.02 mg/mL, was obtained from Sigma Aldrich (730785-25ML). The NPs were tested for sterility, that is, Tryptic Soy Agar culture for bacterial growth and Malt Extract Agar culture for fungal growth, and were confirmed to be free of biological contaminants.
Particle sample characterization
The shape and size distributions of AuNPs and AgNPs in their respective solutions (Milli-Q water for AuNPs and citrate buffer for AgNPs) as well as in dispersion medium consisting of phenol red-free Roswell Park Memorial Institute media (Lonza) supplemented with 1% penicillin/streptomycin (Lonza) and 1% heat-inactivated fetal bovine serum (Lonza), hereafter referred to as dispersion medium, were determined using transmission electron microscopy (TEM, JOEL-JEM 1010), operating at 120 kV. Briefly, samples were deposited as droplets on carbon-coated copper grids and allowed to air dry prior analysis. The sizes of a minimum of 50 NPs were measured using ImageJ 1.46r (National Institutes of Health) to obtain an average NP size. The surface area per mass (m2/g) of NPs was calculated based on the average NP size with the assumption that all NPs are spherical in shape (Supplemental Equations 1-5).
The surface charges of AuNPs and AgNPs, as described by their Ζ potential, were determined using the Zetasizer Nano ZS (Malvern Instruments). The pH of the particles was measured at 37 °C using the CyberScan pH 6500 pH/ion meter (EUTECH Instruments). The ultraviolet-visible (UV-vis) absorption spectra and fluorescence emission spectra of the particles were determined with the Cecil Super Aurius CE3021 spectrophotometer and LS55 fluorescence spectrophotometer (Perkin Elmer), respectively.
Particle sample preparation for cell-based studies
For cell-based studies, the AuNP stock solution was centrifuged at 13,000 × g for 30 minutes and resuspended in appropriate volumes of dispersion medium to final concentrations of 2.5, 5, 10, 25, and 50 µg/cm2 (corresponding to 8, 16, 32, 80, and 160 µg/mL). The AgNP stock solution was directly suspended in appropriate volumes of dispersion medium (ie, without prior centrifugation) to final concentrations of 0.1, 0.5, 1, 2, and 5 µg/cm2 (corresponding to 0.32, 1.6, 3.2, 6.4, and 16 µg/mL). The NP suspensions were not vortexed or sonicated prior use. The dose used in this study (µg/cm2) represents the mass of NPs per unit surface area of the culture dish. It is stated in Stone et al, 39 reporting dose as µg/cm2 is perhaps more relevant compared to µg/mL due to the observation that the majority of the particles administered will settle due to agglomeration and gravity over time in culture. In addition, Phalen et al 40 also demonstrated that expressing in vitro NP concentrations as µg/cm2 (in this case surface area of the well) allows for direct comparison to more realistic in vivo scenarios such as µg of NP per surface area of the lung. Nevertheless, the concentrations of AuNPs and AgNPs used in this study are also reported in µg/mL to allow extrapolation between studies.
Particle sample preparation for cell-free interference studies
For interference (cell-free) studies, the AuNP stock solution was centrifuged and resuspended in dispersion medium to final concentrations of 5, 10, and 25 µg/cm2. The AgNP stock solution was directly suspended in appropriate volumes of dispersion medium to final concentrations of 0.1, 1, and 2 µg/cm2.
Cell Cultures
The cell model of choice was the human bronchial epithelial cell line, BEAS-2B, which was obtained from Sigma Aldrich (catalogue number 95195102433), originally from the European Collection of Cell Cultures, operated by the Health Protection Agency Culture Collections. This lung cell model was chosen based on the fact that (1) inhalation is regarded as the most likely route of accidental exposure for NPs 41 and (2) the BEAS-2B cell line is a popular choice of cell type for studies on the nanosafety of inhaled NPs, particularly for AuNPs and AgNPs. 42-44
Cell-Based Studies
For all cell-based studies, BEAS-2B cells were used at passage numbers 16-20 and were seeded in appropriate 96-well plates at 5 × 10⁴ cells/cm2 in 100 µL dispersion medium. For the XTT assay, experiments were performed in sterile transparent 96-well plates (Costar Corning Inc). For the LDH and ATP assays, experiments were performed in sterile, opaque-walled 96-well plates (Costar Corning Inc) to minimize fluorescence or luminescence interference between wells. For the xCELLigence real-time cell analyzer (RTCA), experiments were performed in specialized E-plates. The cells were allowed to reach exponential (log) phase 24 hours after seeding in an incubator (37 °C, 5% CO2). The dispersion medium was replaced with 100 µL dispersion medium containing particles at different final concentrations (see Particle sample preparation for cell-based studies section), and the cells were treated for at least 24 hours. Untreated cells received 100 µL dispersion medium only without particles. Cell toxicity was assessed with the XTT, LDH, and ATP assays as well as with the xCELLigence RTCA, as per manufacturer instructions (see below).
Cell-Free Interference Studies
The cell-free interference studies for the XTT, LDH, and ATP assays followed the same approach, that is, the design of the cell-free interference studies included the investigation of (1) particle interference at the wavelengths of the optical read-out (absorbance, fluorescence, luminescence,) and (2) particle interference with the assay components, that is, adsorption and/or catalysis of substrate and/or product (Figure 1). The detailed principles of each assay are provided in Supplemental Data 1.
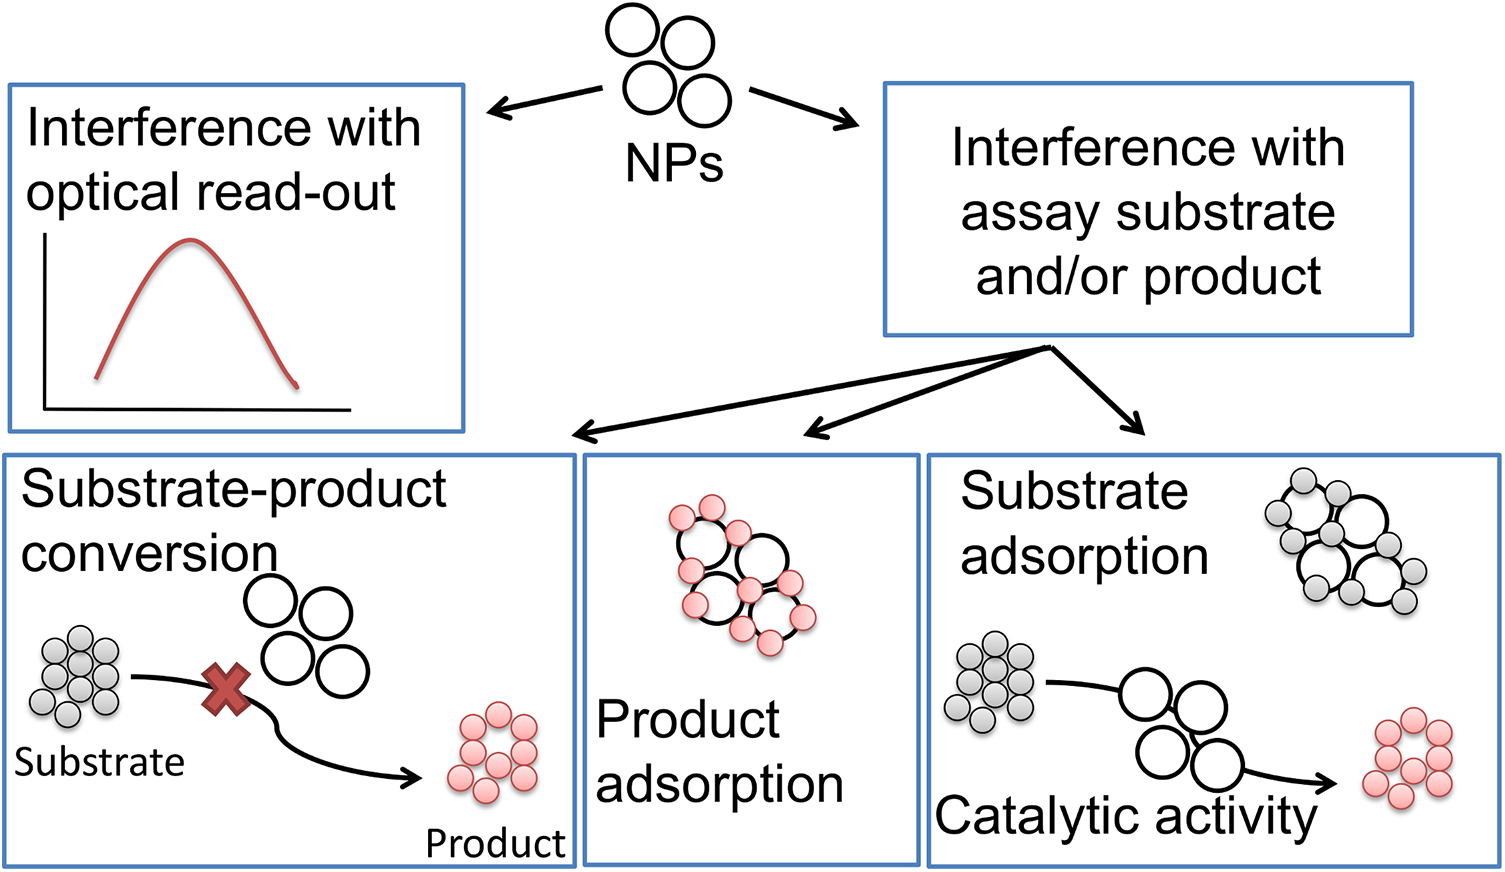
Schematic diagram of the study design to investigate optical interference with chromophores, fluorophores, and luminophores as well as adsorption and/or catalysis by particles in the absence of cells.
XTT Assay
Cell-based studies
Cells were treated with AuNPs and AgNPs as described in Particle sample preparation for cell-based studies section. After treatment, 20 µL reconstituted XTT stock reagent (1 mg/mL tetrazolium salt with 1% N-methyl dibenzopyrazine methyl sulfate [PMS] in phosphate-buffered saline [PBS]) was added to the cells and was incubated for 2 hours in an incubator. The absorbance was recorded at 450 nm on an ELx 800 spectrophotometric plate reader (BioTek instruments) to quantify the formazan product, which is proportional to the activity of mitochondrial dehydrogenase in viable cells. Viability of the treated cells was calculated as a percentage of the untreated, control cells.
Cell-free interference studies
Reaction of particles in dispersion medium without XTT assay components
Different concentrations of particles were suspended in 100 µL dispersion medium in a 96-well plate, and the absorbance was recorded at 450 nm to determine whether particles absorb light at the same wavelength of the formazan chromophore product. The wavelength of 450 nm was chosen to assess the absorbance of XTT substrate since a full absorbance spectrum showed that it absorbs at the same wavelength as the formazan product, that is, 450 nm, although at a lower intensity than the formazan product (Supplemental Figure 1).
Reaction of particles in the conversion of XTT substrate to formazan product in the presence of 0.1 mM nicotinamide adenine dinucleotide cofactor
A 20 µL of stock XTT substrate reagent was added to wells with different concentrations of the particles in 100 µL dispersion medium containing 0.1 mM nicotinamide adenine dinucleotide (NADH; Roche Diagnostics) as cofactor. 45,46 The control wells received 20 µL XTT substrate and 100 µL dispersion medium containing 0.1 mM NADH with no particles. After a 2-hour incubation period at 37 °C (to allow formazan product formation), absorbance was recorded at 450 nm.
Since the above experiment could only measure interference of the particles at one wavelength (ie, 450 nm), it was decided to further investigate whether these particles result in interference at other wavelengths based on their strong SPR properties. Therefore, the above experiment was repeated and scaled up to larger 1 mL volumes in microcentrifuge tubes in order to obtain the complete UV-vis spectra. Note that the dose of all experiments conducted in microcentrifuge tubes is in mass (µg) of particle per volume (mL) of dispersion medium (ie, µg/mL) for the reason that µg/cm2 could not be calculated for the conical bottom of the microcentrifuge tube. Nevertheless, the concentrations of the experiments in microcentrifuge tubes were scaled up within the same ratios as those concentrations of the experiments in 96-well plates to allow comparison.
Reaction of particles with formazan chromophore product
This reaction differed from the previous experiment (see Reaction of particles in the conversion of XTT substrate to formazan product in the presence of 0.1 mM NADH co-factor section) in that the formazan product was produced first before particles were added. More specifically, formazan was produced from XTT substrate in the presence of 0.1 mM NADH and dispersion medium in a final volume of 100 µL in a 96-well plate. The plate was allowed to incubate for 4 hours to ensure that product formation reached saturation (plateau). Different concentrations of particles suspended in 20 µL dispersion medium were added to the wells containing formazan. Control wells received 100 µL formazan and 20 µL dispersion medium without particles. The absorbance of the plate was recorded at 450 nm.
Reaction of particles with XTT substrate
A total of 20 µL XTT substrate was added to wells of a 96-well plate containing different concentrations of particles in 100 µL dispersion medium, with control wells containing 20 µL XTT substrate and 100 µL dispersion medium with no particles. Absorbance at 450 nm was recorded after a 2-hour incubation period.
Quantification of the degree of adsorption of XTT components to AuNP surfaces adsorption of XTT substrate
For the experiments conducted as described in Reaction of particles with formazan chromophore product section and Reaction of particles with XTT substrate section, results were expressed as absorbance values. However, using an adsorption isotherm model, it is possible to calculate the exact concentration of dye (ie, XTT substrate and formazan product in our case) adsorbed to particle surfaces. 47,48 Therefore, the initial concentration of XTT substrate (ie, before the addition of AuNPs as described in Reaction of particles with formazan chromophore product section) and the initial concentration of formazan product in Reaction of particles with XTT substrate section were calculated. Thereafter, the degree of the adsorption of the XTT substrate and formazan product on AuNP surfaces was quantified using the following equation, which was deduced from a Langmuir isotherm modified by Forest et al 49 to account for NP mass (Supplemental Equations 6-15, Supplemental Figure 2, Supplemental Table 1):

where:
l = path length of sample,
V = volume of sample.
Lactate Dehydrogenase Assay
Cell-based studies
Cells were treated with AuNPs and AgNPs as described in Particle sample preparation for cell-based studies section. After treatment, 100 µL of CytoTox-ONE Reagent containing resazurin substrate was added to the cells and was incubated for 10 minutes at room temperature. Thereafter, a 50 µL Stop solution was added to the wells to stop the continued generation of resorufin. Fluorescence was recorded at 560/590 nm using the FLx 800 fluorometric plate reader (BioTek instruments) to quantify the amount of resorufin produced, which is proportional to the amount of LDH released by dead/damaged cells. Cytotoxicity is generally calculated as a percentage of the maximum LDH release control, which is untreated cells lysed with 9% Triton X-100 to release all cytoplasmic LDH. However, for the purposes of this study, viability of the treated cells was calculated as a percentage of the untreated, control cells to allow comparisons with the other toxicity assays.
Cell-free interference studies
Reaction of particles in dispersion medium without LDH assay components
Different concentrations of particles were suspended in 100 µL dispersion medium in a 96-well plate, and the fluorescence emission spectra were recorded at an excitation of 560 nm to determine whether the particles emit at the same wavelength as the resorufin, the fluorophore product of resazurin.
Reaction of particles in the conversion of resazurin substrate to resorufin product in the presence of 0.1 mM NADH co-factor
CytoTox-ONE Reagent containing resazurin substrate (100 µL) was added to wells with different concentrations of particles in 100 µL dispersion medium containing 0.1 mM NADH as cofactor with control wells containing dispersion medium, resazurin, and NADH with no particles. NADH has been used previously as a reductant to produce resorufin product via diaphorase. 50 After a 10-minute incubation at room temperature, fluorescence was recorded at 560/590 nm.
Reaction of particles with resorufin fluorophore product
This reaction differed from the previous experiment (see Reaction of particles in the conversion of resazurin substrate to resorufin product in the presence of 0.1 mM NADH cofactor section) in that the resorufin product was produced first before particles were added. More specifically, resorufin (180 µL) was produced from 90 µL resazurin substrate in the presence of 90 µL dispersion medium containing 0.1 mM NADH in a 96-well plate. The plate was allowed to incubate at room temperature for 10 minutes to allow saturated product formation. Different concentrations of particles suspended in 20 µL dispersion medium were added to the wells containing resorufin. Control wells received 180 µL resorufin product and 20 µL dispersion medium without particles. The fluorescence of the plate was recorded at 560/590 nm.
Reaction of particles with resazurin substrate
A total of 100 µL resazurin substrate was added to wells of a 96-well plate containing different concentrations of particles in 100 µL of dispersion medium with control wells containing 100 µL resazurin and 100 µL dispersion medium with no particles. Fluorescence was recorded at 560/590 nm after a 10-minute incubation period.
Adenosine Triphosphate Assay
Cell-based studies
Cells were treated with AuNPs and AgNPs as described in Particle sample preparation for cell-based studies section. After treatment, a 100 µL CellTiter-Glo Reagent containing beetle luciferin and luciferase was added to the cells. The plate containing the cells was shaken for 2 minutes to induce cell lysis and was incubated for another 10 minutes at room temperature to stabilize the luminescent signal. Luminescence was recorded using the FLx 800 fluorometric plate reader to quantify the luminophore, oxyluciferin product, which is proportional to the amount of ATP present in viable cells. Viability of the treated cells was calculated as a percentage of the untreated, control cells.
Cell free interference studies
Reaction of particles in dispersion medium without ATP assay components
Different concentrations of particles were suspended in 100 µL dispersion medium in a 96-well plate, and the luminescence was recorded to determine whether the particles emit light at the same wavelength as the oxyluciferin luminophore product.
Reaction of particles in the conversion of luciferin substrate to oxyluciferin product in the presence of 1.5 µM ATP cofactor
CellTiter-Glo Reagent containing the substrate luciferin (100 µL) was added to wells of a 96-well plate containing different concentrations of particles in 100 µL dispersion medium and 1.5 µM ATP (Sigma Aldrich) as a cofactor. Control wells received 100 µL luciferin and 100 µL dispersion medium containing ATP with no particles. The plate containing the mixture was mixed for 2 minutes on an orbital shaker and allowed to incubate for 10 minutes at room temperature to stabilize the luminescent signal after which the luminescence was recorded.
Reaction of particles with oxyluciferin product
Oxyluciferin (180 µL) was produced from 90 µL luciferin substrate and 90 µL dispersion medium containing 1.5 µM ATP in a 96-well plate. Different concentrations of particles suspended in 20 µL dispersion medium were added to the wells containing oxyluciferin. Control wells received 180 µL oxyluciferin and 20 µL dispersion medium with no particles. The plate was then mixed for 2 minutes and the luminescence was measured.
Reaction of particles with luciferin substrate
A total of 100 µL luciferin substrate was added to wells of a 96-well plate containing different concentrations of particles in 100 µL dispersion medium. Control wells contained luciferin substrate and dispersion medium with no particles. Luminescence was recorded after a 2-minute mix and 10 minutes of incubation.
xCELLigence RTCA
Cell-based studies
Unlike the XTT, LDH, and ATP assays, the xCELLigence RTCA single plate instrument (ACEA Biosciences) is independent of optical parameters or dye color formation to determine the degree of cell viability or cytotoxicity. Instead, the xCELLigence RTCA monitors cellular events in real time by measuring the electrical impedance, displayed as cell index (CI) values (Supplemental Data 1), of adherent cells across the microelectrodes integrated on the bottom of the wells of an E-plate.
Cells were treated with AuNPs and AgNPs, as described in Particle sample preparation for cell-based studies section, in a 96-well E-Plate. The E-plate was placed in the xCELLigence RTCA in an incubator. Scans were acquired every 5 minutes for 24 hours, and then every 15 minutes for the remainder of the experiment. The CI values were normalized at a selected time point (Supplemental Data 1), which was chosen as the time just before the addition of NPs to minimize interwell variability and allow comparison between wells. Statistically significant differences were determined at the time point 24 hours after treatment. Half-maximal inhibitory concentration (IC50) values were calculated using the RTCA software, version 1.2 (ACEA Biosciences).
Cell-free interference studies
Wells containing particles at the highest concentrations (ie, 50 µg/cm2 for AuNPs, 5 µg/cm2 for AgNPs) in 100 µL dispersion medium only in the absence of cells were added to an E-plate to see whether the particles have the ability to interfere with the CI value. Control wells received 100 µL of dispersion medium only with no particles.
Dichloro-dihydro-fluorescein diacetate (DCFH-DA) Assay
Reaction of particles in dispersion medium without DCFH-DA assay components
Sterile, opaque-walled 96-well plates (Costar Corning Inc) were used to minimize fluorescence interference between wells. Different concentrations of particles were suspended in 100 µL dispersion medium in a 96-well plate, and the fluorescence emission spectra at different wavelengths was recorded at an excitation of 480 nm to determine whether the particles fluoresce at the same wavelength as the DCF product.
Reaction of particles with DCF product
The DCF standard from the OxiSelect DCFH-DA Intracellular ROS assay (Cell Biolabs) was used in this study. A total of 50 µL of 100 nM DCF in dispersion medium was added to wells of a 96-well plate containing different concentrations of particles in 100 µL dispersion medium. Control wells contained 50 µL of 100 nM DCF and 100 µL dispersion medium with no particles. After 1 hour, the fluorescence was recorded at 480/530 nm using the FLx 800 fluorometric plate reader. Since the DCF protocol requires several wash steps with PBS, it was decided to repeat the experiment by replacing dispersion medium with PBS during the DCF and particle dilutions. As identical results were obtained, it was decided to only show the results with dispersion medium.
Propidium Iodide
Reaction of particles in dispersion medium without PI
Sterile, opaque-walled 96-well plates (Costar Corning Inc) were used to minimize fluorescence interference between wells. Different concentrations of particles were suspended in 100 µL dispersion medium in a 96-well plate, and the fluorescence emission spectra at different wavelengths were recorded at an excitation of 485 nm to determine if particles fluoresce at the same wavelength as PI.
Reaction of particles with PI
A 5 µM PI solution diluted in 50 µL dispersion medium was added to wells of a 96-well plate containing different concentrations of particles in 100 µL dispersion medium. Control wells received 50 µL of 5 µM PI and 100 µL dispersion medium with no particles. After 30 minutes, fluorescence was recorded at 485/590 nm using the FLx 800 fluorometric plate reader. Again, the experiment was repeated by replacing the dispersion medium with PBS, however only results with dispersion medium are shown as both produced similar results.
5,5′,6,6′-Tetrachloro-1,1′,3,3′-tetraethyl-benzamidazolocarbocyanin Iodide Assay
Reaction of particles in dispersion medium without JC-1
Sterile, opaque-walled 96-well plates (Costar Corning Inc) were used to minimize fluorescence interference between wells. Different concentrations of particles were suspended in 100 µL dispersion medium in a 96-well plate, and the fluorescence emission spectra at different wavelengths was recorded with an excitation of 488 nm to determine if particles fluoresce at the same wavelength as JC-1.
Reaction of particles with JC-1
The 10× JC-1 stock solution provided with the kit was diluted to a 1× JC-1 working solution with assay buffer (also provided with kit) and will hereafter be referred to as JC-1 (1×). A total of 50 µL JC-1 (1×) was added to wells of a 96-well plate containing different concentrations of particles in 100 µL dispersion medium with control wells containing 50 µL JC-1 (1×) and 100 µL dispersion medium with no particles. After 30 minutes, fluorescence was recorded at 488/527 nm (green fluorescence) using the FLx 800 fluorometric plate reader. The experiment was repeated by replacing the dispersion medium with PBS. Only results with dispersion medium are shown as both produced similar results.
Reaction of particles with JC-1 in the presence of cells
The above interference experiments with JC-1 were conducted in the absence of cells. However, interference of AuNPs and AgNPs with JC-1 was also assessed in the presence of cells using fluorescence microscopy (CytoViva 150 Unit integrated onto the Olympus BX43 microscope equipped with an EXFO fluorescence Illumination System; CytoViva). BEAS-2B cells were seeded onto coverslips in 12-well plates at a concentration of 5 × 10⁴ cells/cm2 and allowed to proliferate for 24 hours before treatment. Cells were treated with different concentrations of AuNPs and AgNPs for 24 hours. Untreated cells received dispersion medium only. A positive control consisted of cells treated with 50 µM carbonylcyanide m-chlorophenylhydrazone (CCCP) for 1 hour to depolarize the mitochondrial potential of the cells; JC-1 (1×) was added to the cells following treatment. After incubation for 15 minutes at 37 °C, JC-1 was removed and the cells were washed twice with prewarmed assay buffer. The coverslips were placed on microscope slides with a drop of assay buffer prior analysis on the CytoViva fluorescence microscope. Images were acquired using a Dagexcel X16 camera and software. Hyperspectral imaging (HSI) was performed at ×60 magnification using the HSI System 1.1 and ENVI software, incorporated onto the CytoViva Unit, to determine if AuNPs and AgNPs were internalized by BEAS-2B cells. Spectral angle mapping (SAM) was used to identify NPs within the cell samples that corresponded to a previously defined spectral library. To obtain the spectral libraries for the NPs, a drop of NP-containing solution was placed on a microscope slide and allowed to dry prior to the acquisition of a hyperspectral scan. Following this, spectral profiles of randomly chosen NPs, in the absence of cells, that appear to either be well dispersed or had aggregated were selected. These spectral libraries were used to identify NPs internalized by cells and adsorbed to cell surfaces.
To test for interference within cells, a second experiment was conducted in which cells were treated with AuNPs or AgNPs, as discussed above, for 24 hours and then treated with CCCP for 1 hour, to depolarize the mitochondrial potential of the NP-treated cells, before being stained with JC-1. The staining procedure and analysis was performed as discussed above. This interference experiment would give an indication as to whether the NPs could interfere with JC-1 in cells that are expected to be depolarized.
Statistics
All cell-based and cell-free interference experiments were repeated 3 times in triplicate (n = 9). Results are presented as mean values with standard deviations. Significant differences were calculated using the Kruskal-Wallis test followed by Mann-Whitney U test. A P value ≤0.05 was considered significant. All tests were performed with Statistica 64 Version 10 (StatSoft Inc. Tulsa).
Results
Particle Sample Characterization
The particle characteristics of AuNPs and AgNPs are presented in Table 1. The TEM analysis showed that both AuNPs and AgNPs were predominantly spherical in shape. Gold NPs increased in diameter from 11.25 ± 1.40 nm to 14.68 ± 1.74 nm when suspended in dispersion medium, whereas AgNPs decreased slightly in size from 9.81 ± 2.56 nm to 8.15 ± 1.70 nm. The average sizes of AuNPs and AgNPs were determined with TEM, which is shown in Figure 2.
Characterization of AuNPs and AgNPs.
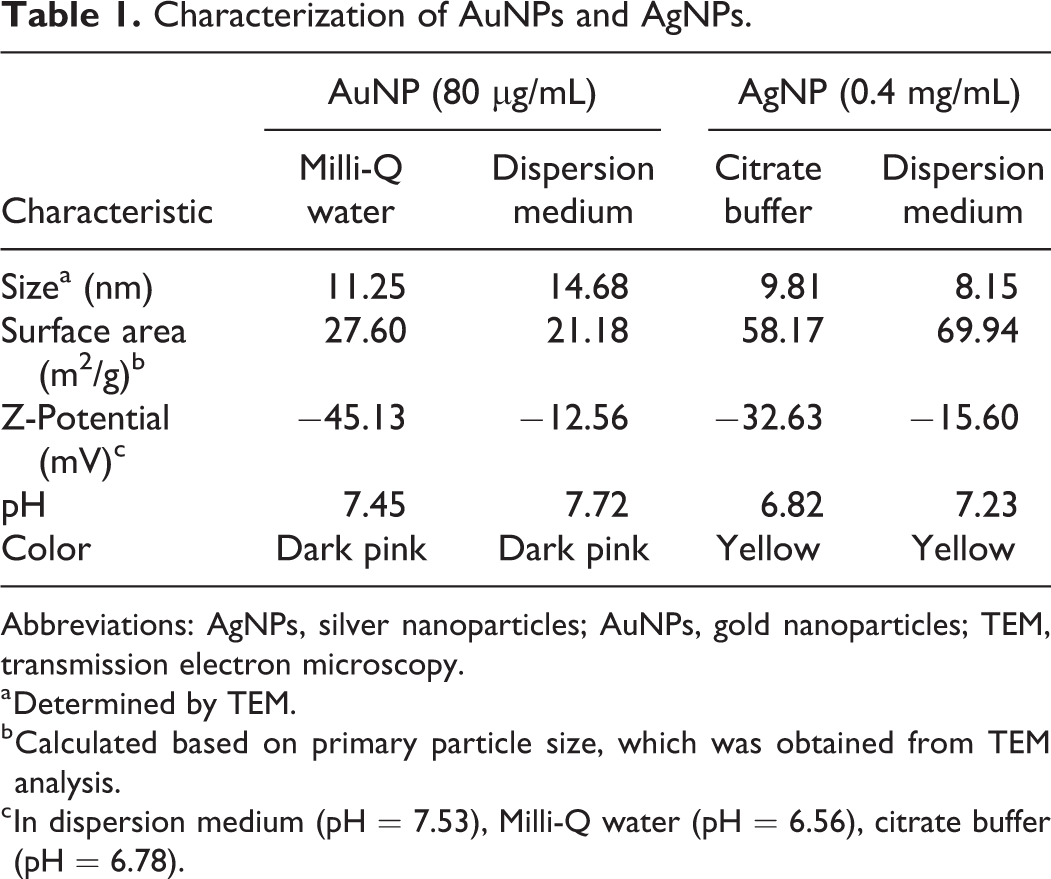
Abbreviations: AgNPs, silver nanoparticles; AuNPs, gold nanoparticles; TEM, transmission electron microscopy.
a Determined by TEM.
b Calculated based on primary particle size, which was obtained from TEM analysis.
c In dispersion medium (pH = 7.53), Milli-Q water (pH = 6.56), citrate buffer (pH = 6.78).
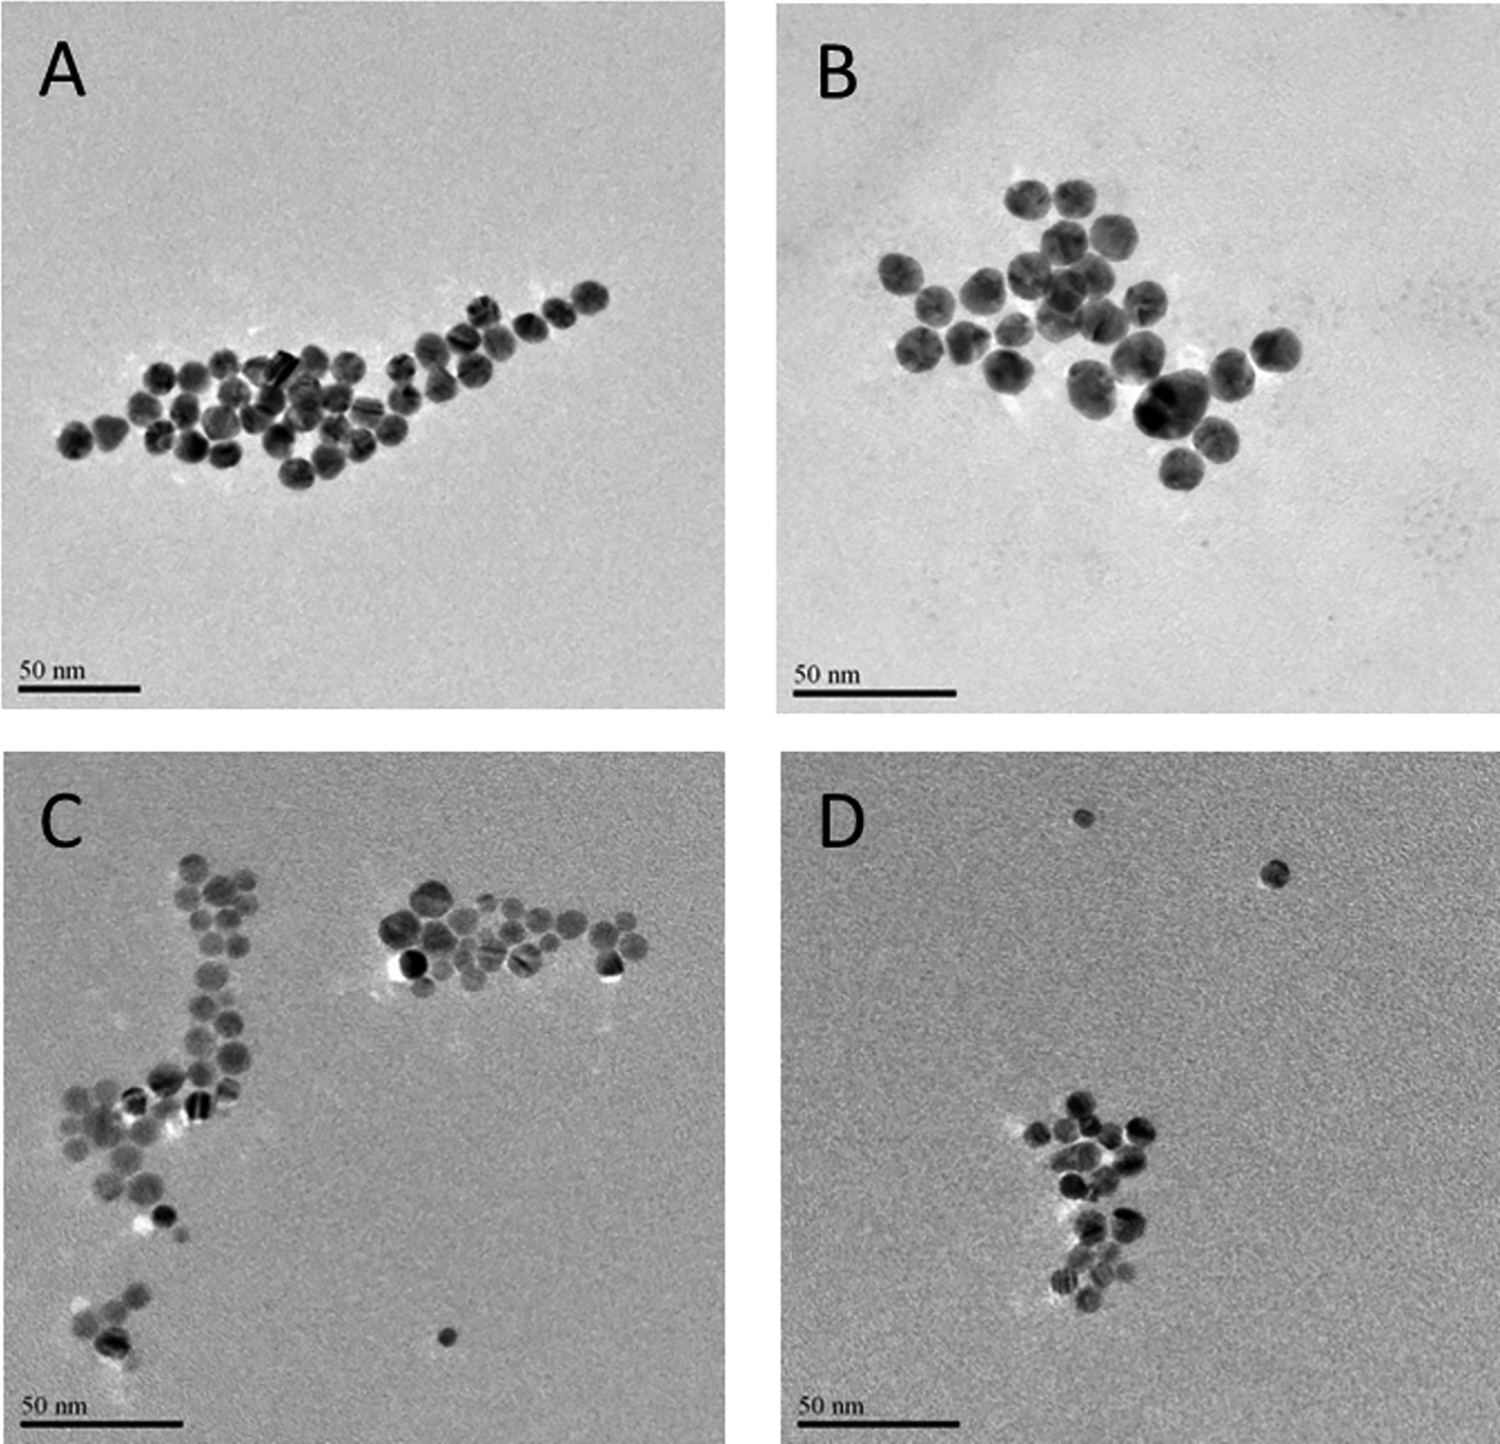
Characterization of AuNPs and AgNPs using transmission electron microscopy (TEM). The average sizes of AuNPs (80 µg/mL) in Milli-Q water (A) and dispersion medium (B) and AgNPs (0.4 mg/mL) in 2 mM citrate buffer (C) and dispersion medium (D) were determined using TEM. AgNPs indicates silver nanoparticles; AuNPs, gold nanoparticles.
The surface charges of all the particles became less negative when suspended in medium (Table 1), which may be due to the formation of protein coronas. None of the particles appeared to affect the pH of the suspension solutions.
The UV-vis absorption spectra as well as fluorescence emission spectra for AuNPs and AgNPs are shown in Figure 3. Gold NPs exhibited strong SPR peaks at 520 nm (Figure 3A) and AgNPs at 400 nm (Figure 3C). The absorbance and fluorescence spectra of AgNPs were altered after suspension in dispersion medium (Figure 3C and D), possibly indicating aggregation, whereas AuNPs only showed an altered fluorescence spectrum (Figure 3B) but not an altered absorbance spectrum (Figure 3A), despite its increase in size, as observed with TEM.
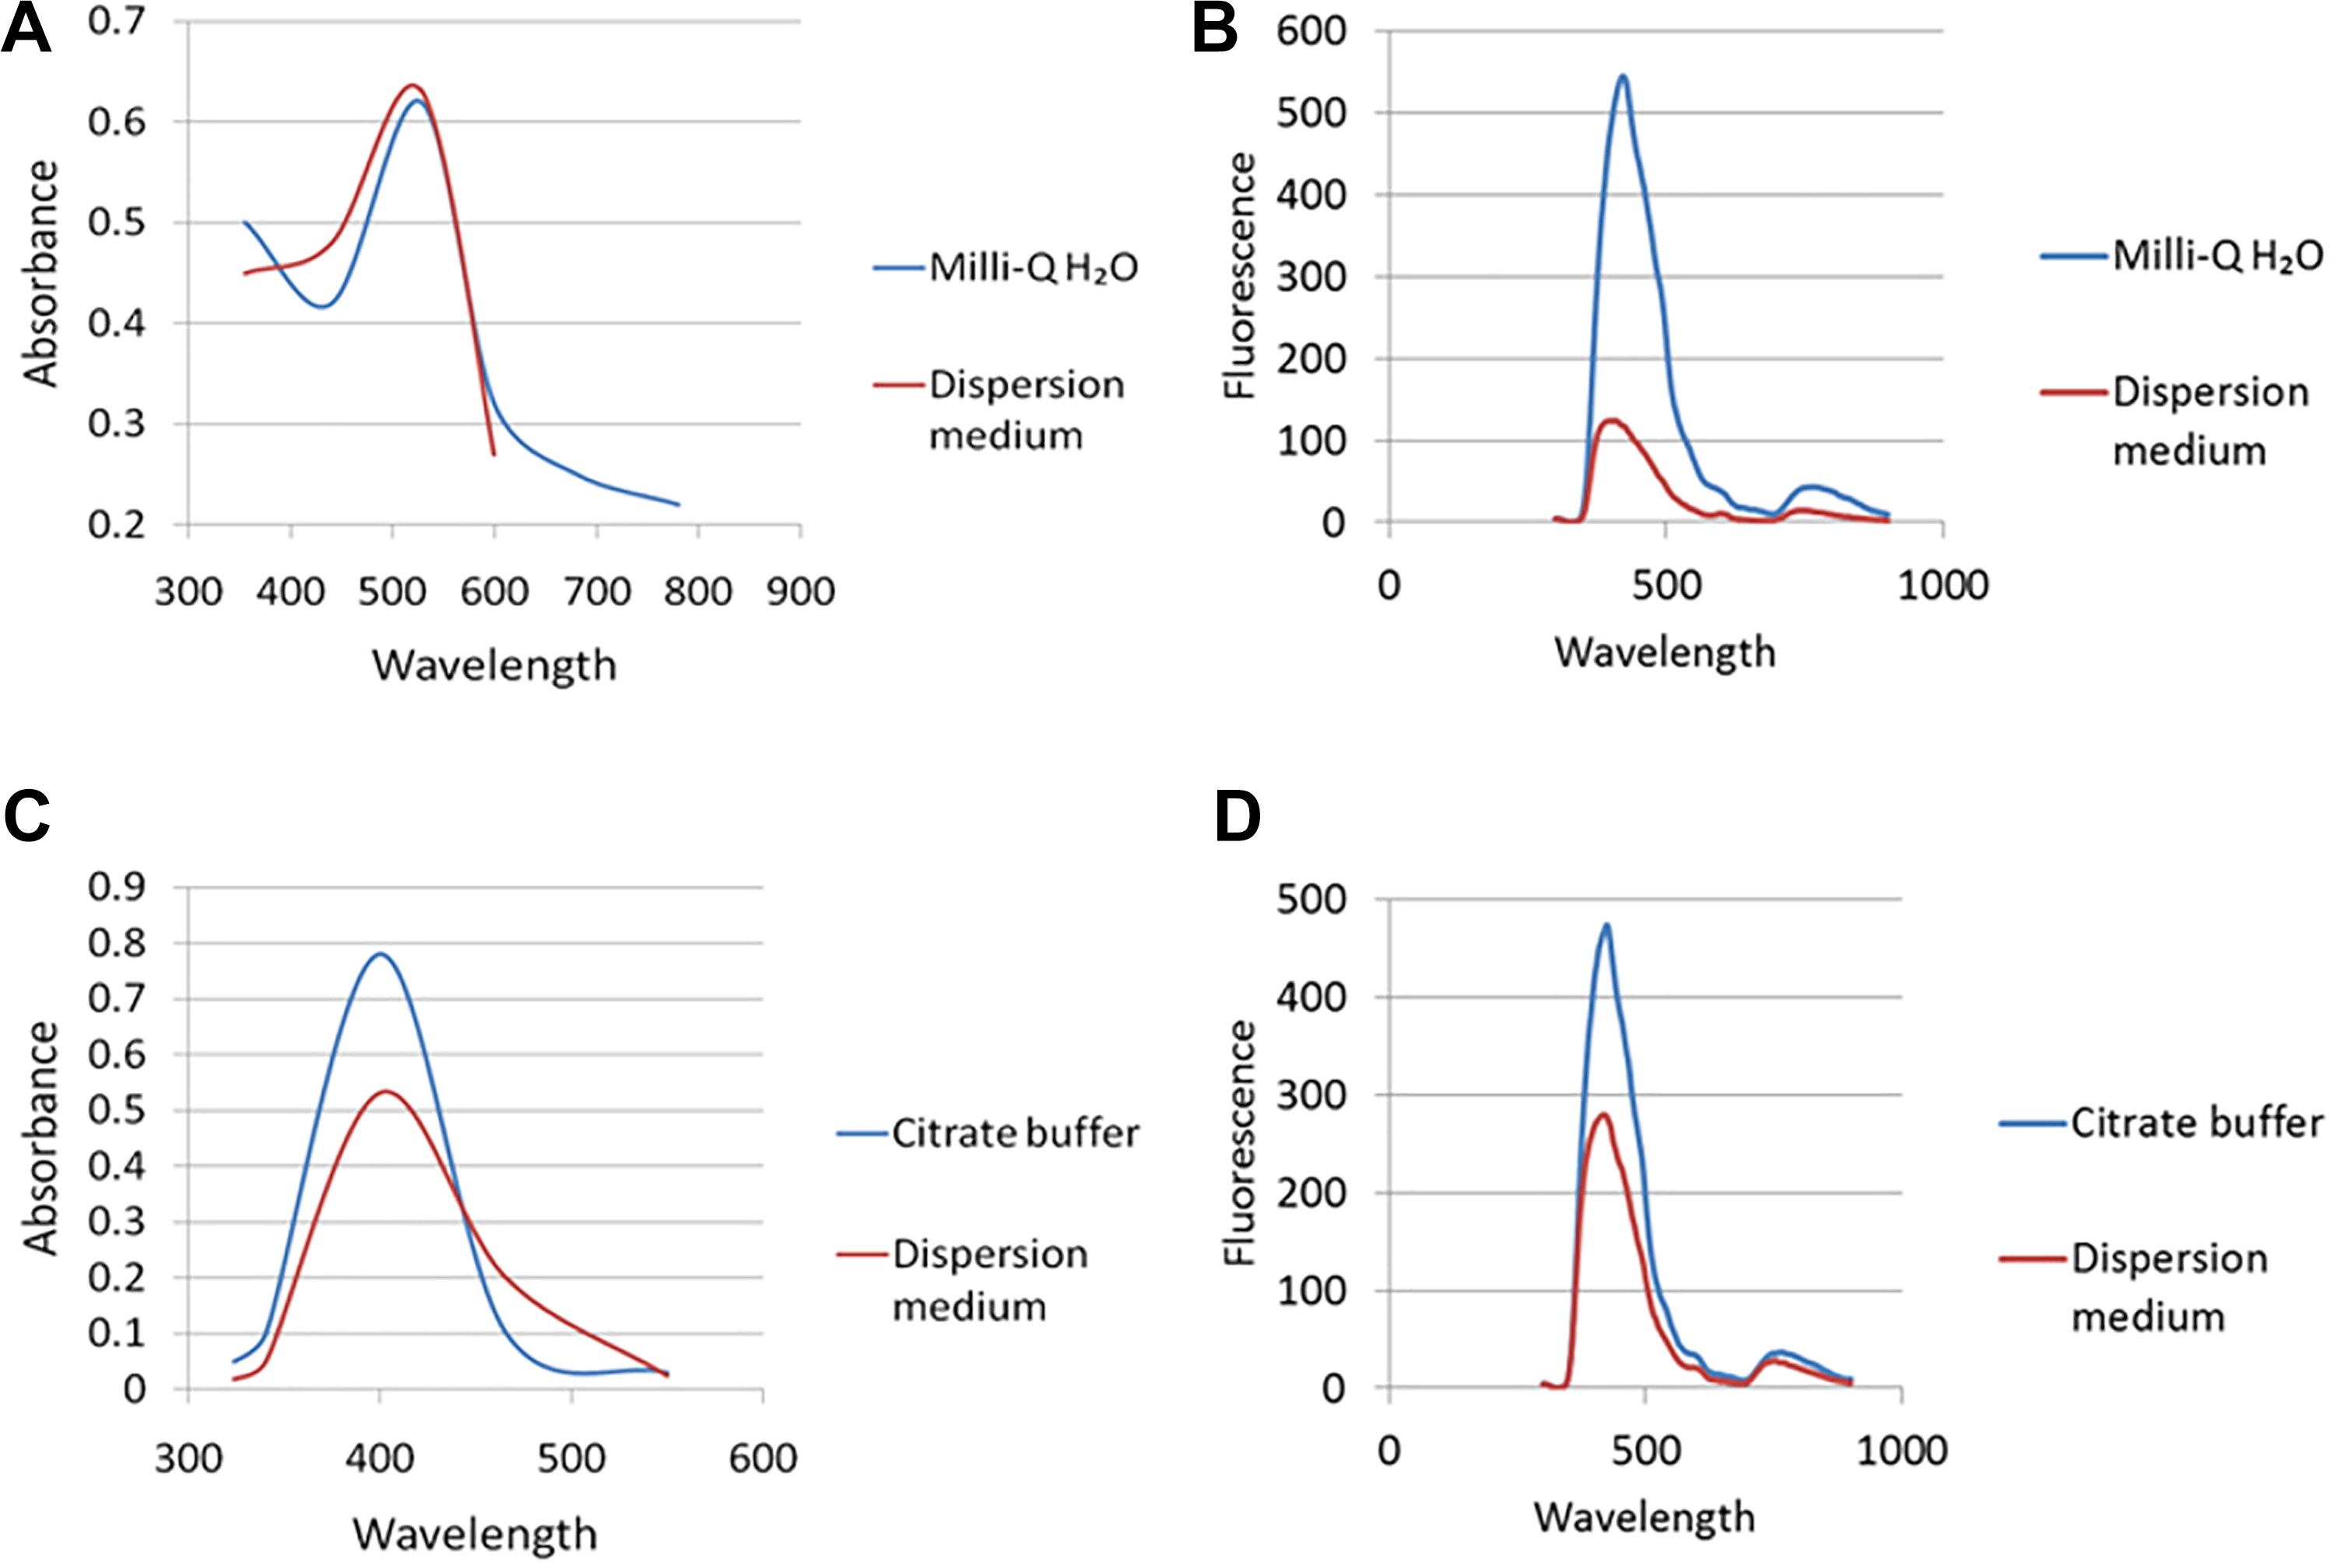
UV-vis absorption spectra and fluorescence emission spectra (excitation wavelength at 300 nm) of AuNPs and AgNPs. A, The UV-vis absorption spectra and (B) fluorescence emission spectra of AuNPs (80 µg/mL) in Milli-Q water and dispersion medium. C, The UV-vis absorption spectra and (D) fluorescence emission spectra of AgNPs (0.4 mg/mL) in 2 mM citrate buffer and dispersion medium. AgNPs indicates silver nanoparticles; AuNPs, gold nanoparticles; UV, ultravilolet.
XTT Assay
Cell-based studies
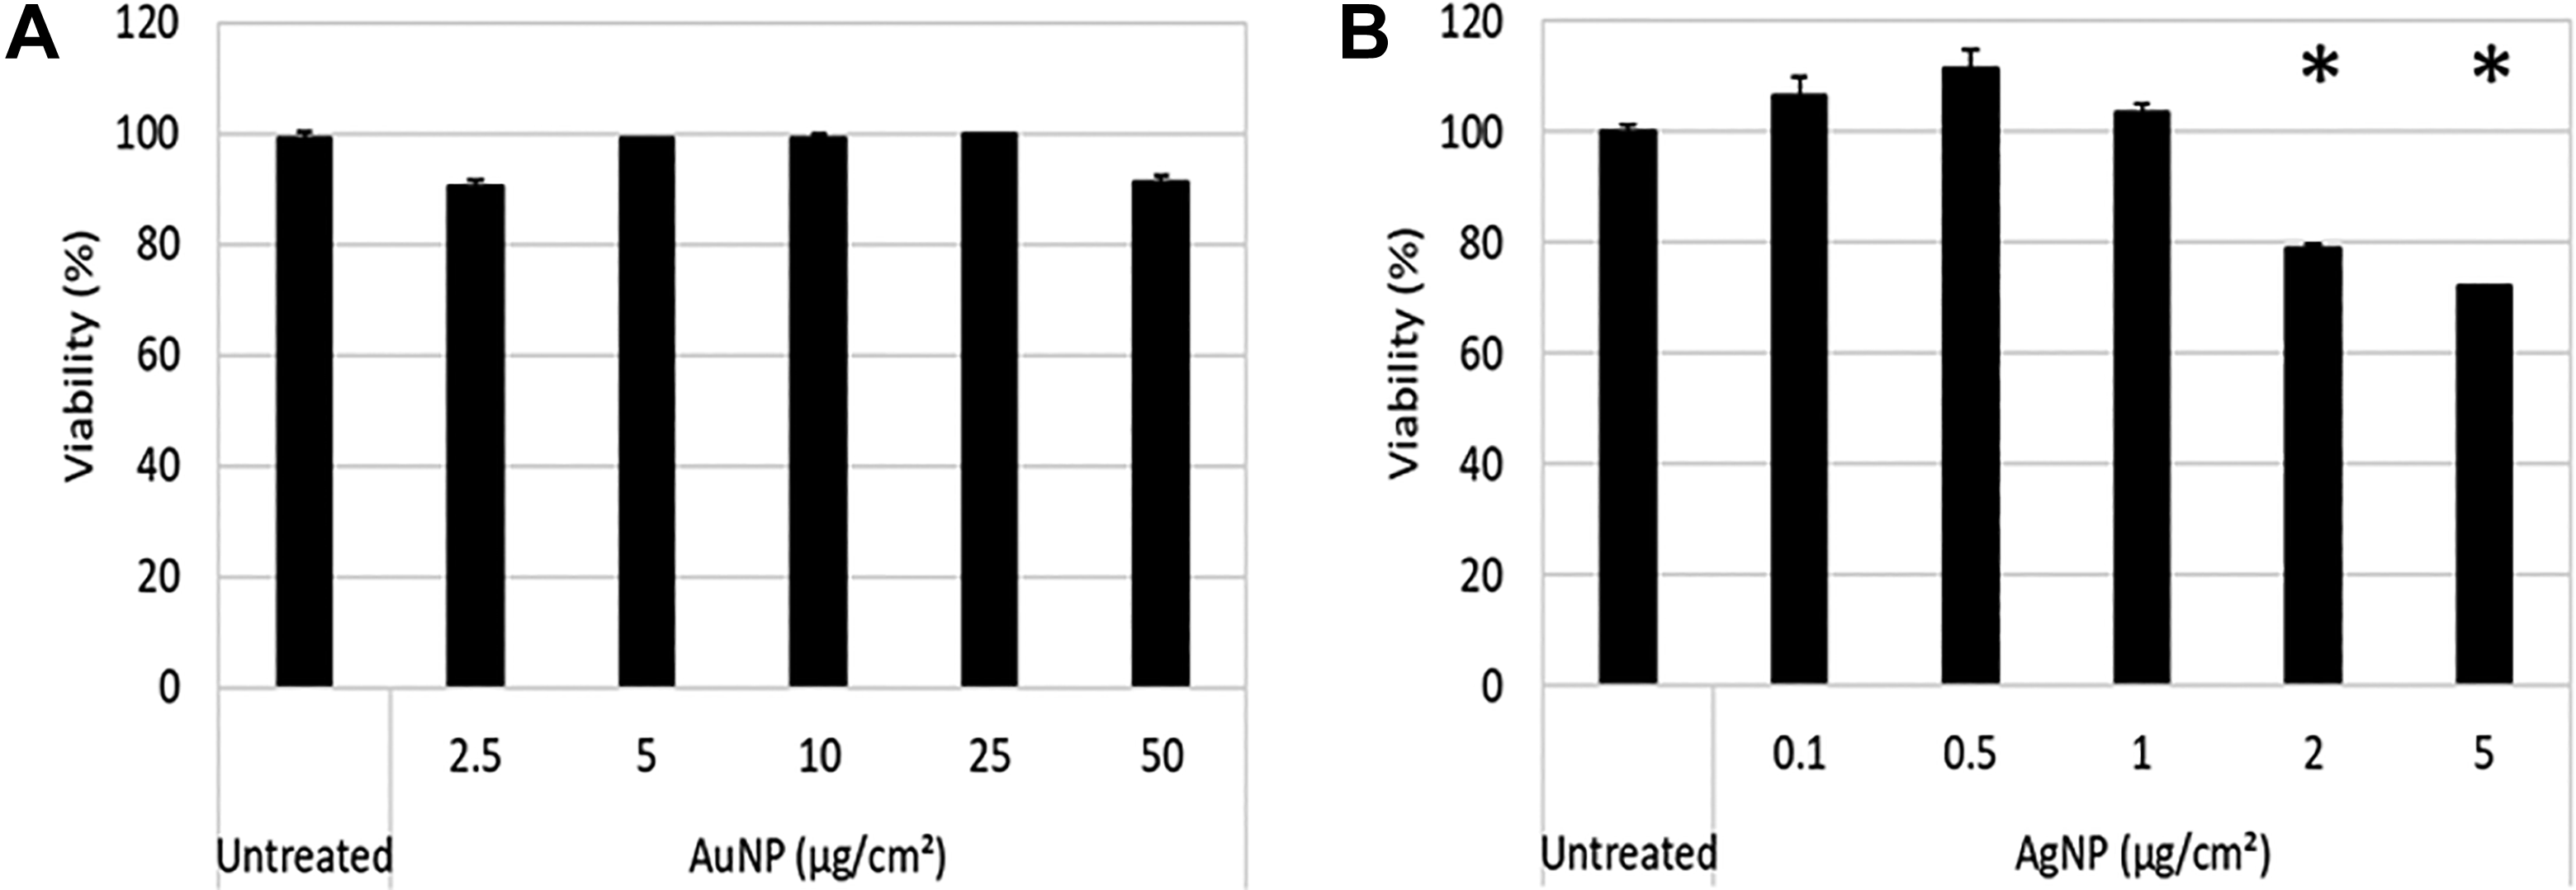
As expected, the XTT assay, which is a tetrazolium salt-based assay, showed interference with both NPs and showed a concentration-dependent increase in viability, which was significantly higher than the untreated cells from 5 µg/cm2 for both NPs (Figure 4A and B).
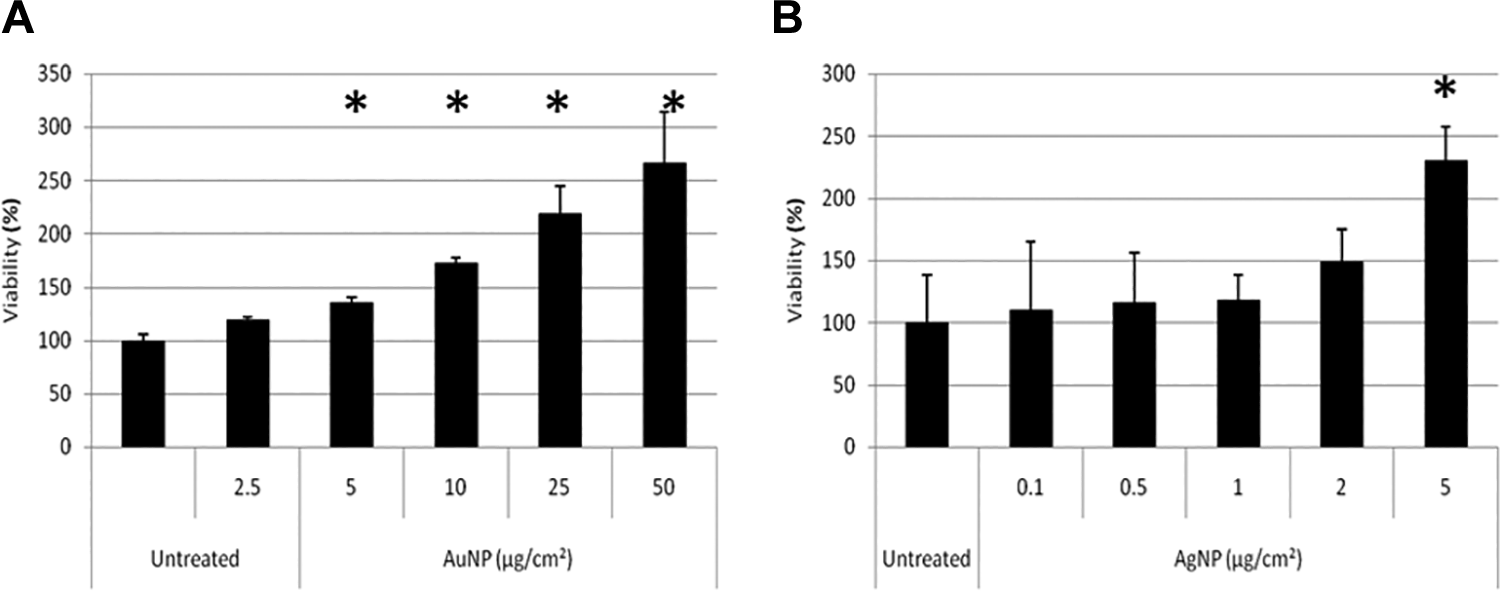
Toxicity assessment of BEAS-2B cells exposed to AuNPs (A) and AgNPs (B) using the XTT assay. Cells were treated with particles for 24 hours. Absorbance was measured at 450 nm. Average viability is represented as a percentage of the untreated control cells. Error bars indicate standard deviations; *P < 0.05, compared to untreated. AgNPs indicates silver nanoparticles; AuNPs, gold nanoparticles.
Although interference with the XTT assay was evident, the mechanism leading to the interference is not known. The next section discusses in detail how each mechanism of interference was assessed to determine the predominant mechanism leading to the false results observed in Figure 4.
Cell-free interference studies
Gold NPs
Reaction of AuNPs in dispersion medium without XTT assay components
Gold NPs were first suspended in dispersion medium, and the absorbance was recorded at 450 nm to determine if AuNPs interfere with the absorbance at the wavelength at which the final product, the formazan chromophore, is read (Figure 5A). Gold NPs showed a significant increase in absorbance at 450 nm with an increase in AuNP concentration. This is due to the SPR of AuNPs and although it is centered at 520 nm (Figure 3A), the background absorbance at 450 nm is high enough to cause interference with the read-out of the XTT assay.
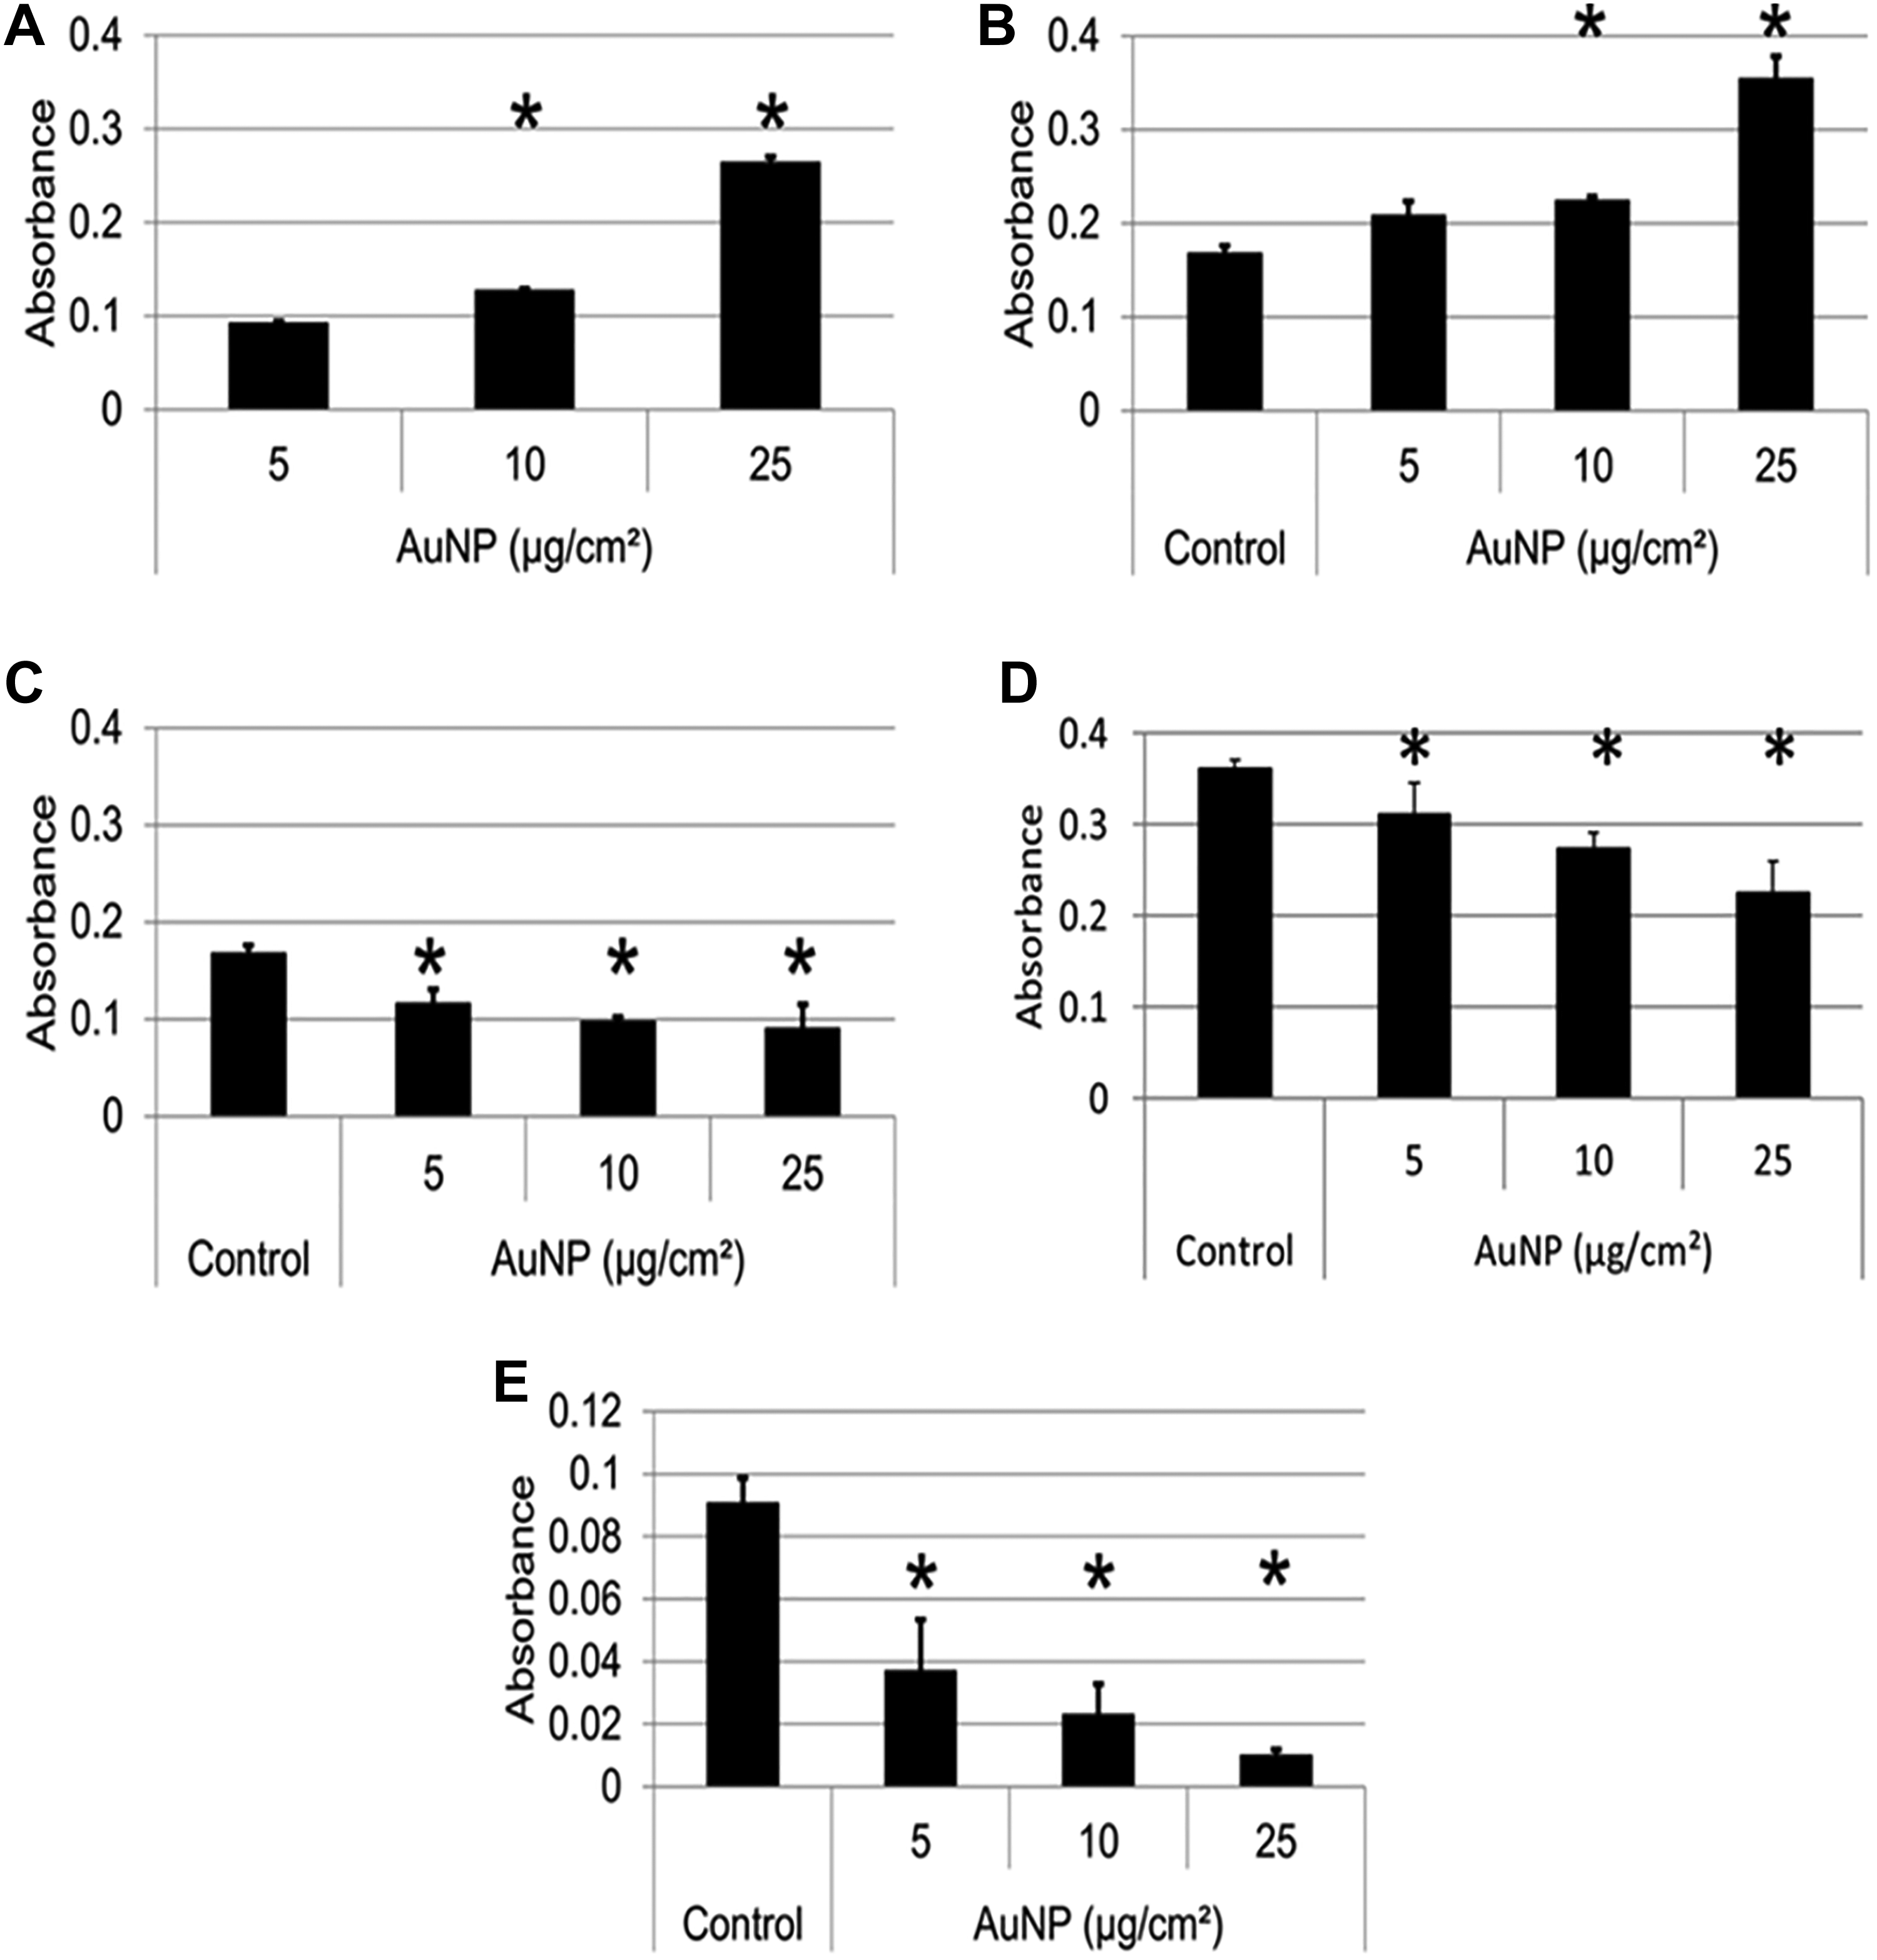
Reaction of AuNPs with the XTT assay. A, The absorbance of AuNPs at 5, 10, and 25 µg/cm2 in dispersion medium only was recorded at 450 nm to determine whether AuNPs interfere with the read-out signal. B, Reaction of AuNPs in the conversion of XTT substrate to formazan product in the presence of 0.1 mM NADH cofactor. Control represents XTT plus NADH. C, Subtraction of the absorbance of AuNPs in dispersion medium only shown in (A) from the absorbance of AuNPs in XTT and NADH shown in (B). D, Reaction of AuNPs with formazan. Control represents formazan only. E, Reaction of AuNPs with XTT substrate. Control represents XTT substrate only. Data are presented as average absorbance values at 450 nm with error bars indicating standard deviations; *P < 0.05, compared to 5 µg/cm2 (for A), or to control (for B-E). AuNPs indicates gold nanoparticles; NADH, nicotinamide adenine dinucleotide.
b. Reaction of AuNPs with XTT assay components
The next step was to determine whether AuNPs have the ability to interfere with XTT assay components. First, AuNPs were incubated with XTT substrate and NADH cofactor. Nicotinamide adenine dinucleotide reduces the tetrazolium ring of XTT to produce the formazan product, thereby simulating a typical cell-based XTT assay. Figure 5B shows an increase in absorbance with increasing AuNP concentration at 450 nm. From these results, it can be said that such interference by AuNPs with XTT components was significant enough to alter the results of a cell-based study shown in Figure 4A, which may be falsely interpreted as an overestimation of cell viability.
To further determine the mechanisms of interference, it was argued that if there was no interference between the AuNPs and the assay components, the absorbance at different concentrations of AuNPs in Figure 5B would have been the combined absorbance of the control and the absorbance of AuNPs at different concentrations shown in Figure 5A. A lack of additive absorbance in Figure 5B would therefore indicate that the interference could result not only due to the absorptive ability of AuNPs at the same wavelength as formazan (which leads to the increase in viability in cell-based studies) but also due to their ability to adsorb this product on their surfaces, leading to a subsequent decrease in absorbance. Indeed, when the values shown in Figure 5A were subtracted from the values shown in Figure 5B, a decrease in absorbance was obtained at all three concentrations (Figure 5C), indicating adsorption by AuNPs. To further confirm these results, AuNPs were incubated with formazan, the already converted product (Figure 5D) and with the XTT substrate in the absence of cofactor (Figure 5E) where a similar decrease in absorbance was obtained. Note that Figure 5D and E show the results after subtraction of the absorbance values of NPs alone in dispersion medium.
The above experiment was performed at only one wavelength that is, 450 nm, however, more information may be obtained when the whole absorbance spectrum is scanned in the presence of XTT substrate, NADH cofactor and AuNPs (Supplemental Figure 3), which shows an increase in formazan absorbance at 450 nm with increasing AuNP concentration, corresponding to the results in Figure 5B. Interestingly, the formation of a second peak at 600 nm was also visible from 32 µg/mL AuNPs and was more pronounced at 80 µg/mL AuNPs (Supplemental Figure 3). This peak could be explained by the presence of aggregated AuNPs. To confirm this suggestion, an additional experiment was performed where AuNPs in dispersion medium was incubated for 2 hours in an incubator. After this incubation period, the absorbance spectrum was recorded, which showed pronounced aggregation (inset in Supplemental Figure 3). Therefore, the aggregation of AuNPs seen in the presence of formazan product is not due to the formazan itself but rather from the 2-hour incubation period needed to form the formazan product.
c. Quantification of adsorption interference
It is clear from the results in Figure 5 that AuNPs exhibit the ability to adsorb XTT substrate and formazan product. The next step was to determine whether the adsorption interference observed could be quantified using the Langmuir adsorption isotherm. The Langmuir adsorption isotherm model, which assumes that the specific homogeneous sites within the adsorbent are responsible for the sorption, was initially developed to describe the sorption of gases 51 but was later applied to aqueous compounds and adsorbates such as proteins onto a solid adsorbent. 52,53 More recently, the Langmuir isotherm has successfully been applied to dyes adsorbed to NPs. For example, Naghizade Asl et al 48 and Mosallanejad and Arami 47 have shown the applicability of using the Langmuir isotherm for describing the adsorption of organic dyes to CuO NPs and the adsorption of sunset yellow dye to cadmium sulfide NPs, respectively.
The initial concentration of XTT substrate, that is, before the addition of AuNPs (control in Figure 5E), was calculated as 0.0074 M, and the initial concentration of formazan product (control in Figure 5D) was calculated as 56.1 M (Supplemental Equations. 6-15, Supplemental Figure 2, Supplemental Table 1). Using the Langmuir isotherm, it was possible to calculate the exact amount of XTT substrate and formazan adsorbed to AuNP surfaces and the amount free in solution (Figure 6). At the highest concentration of AuNPs, the maximum amount of XTT substrate adsorbed was 0.0063 M (Figure 6B) and the maximum amount of formazan adsorbed was 21 M (Figure 6D).
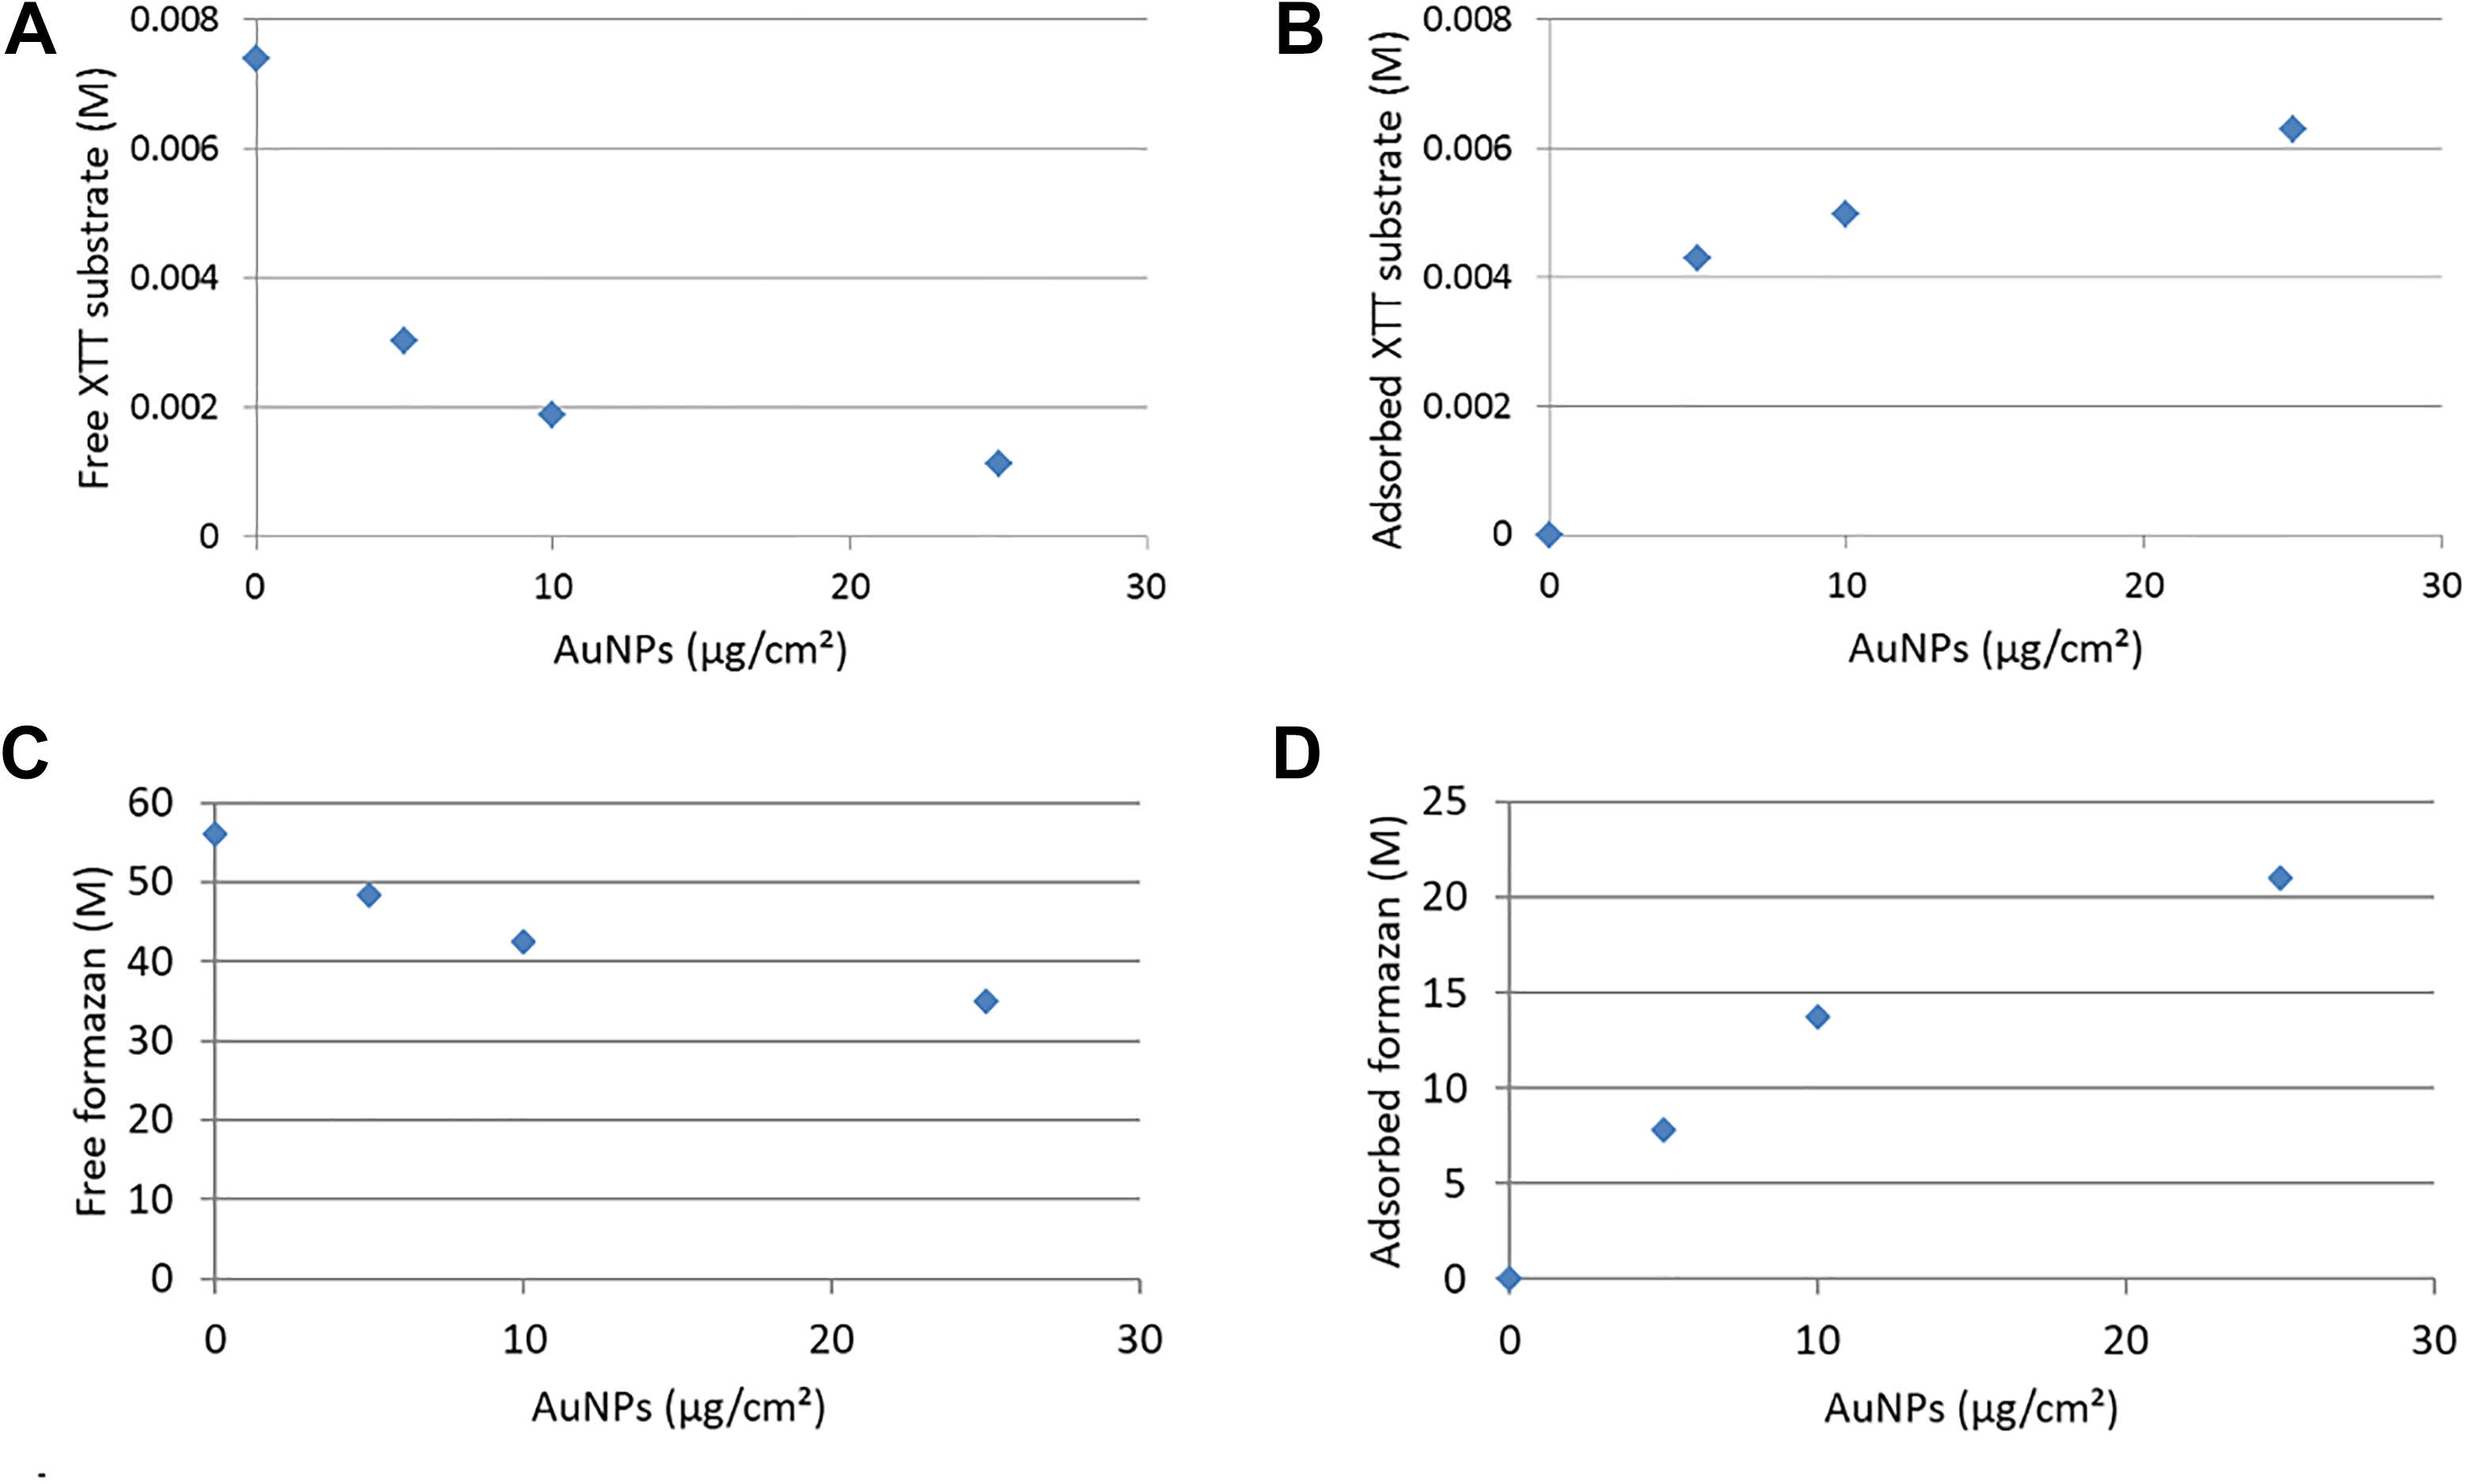
XTT substrate (A and B) and formazan product (C and D) free in solution (A and C) and adsorbed to AuNPs (B and D) in the presence of increasing concentrations of AuNPs. AuNPs indicates gold nanoparticles.
Silver NPs
Similar detailed cell-free investigations were also conducted on AgNPs. It was indicated in the Materials and Methods section that the concentrations of AgNPs to be tested for cell-free interference will include 0.1, 1, and 2 µg/cm2. However, since significant differences between untreated and treated cells were only observed at 5 µg/cm2 during the cell-based studies (Figure 4B), it was decided to also include this AgNP concentration when conducting the cell-free interference studies for the XTT assay.
a. Reaction of AgNPs in dispersion medium containing no XTT assay components
When suspended in dispersion medium, AgNPs showed a significant increase in absorbance at 450 nm (Figure 7A), which is attributed to the SPR of AgNPs peaking at around 400 nm (Figure 3C). This observation was further confirmed by conducting absorbance spectra of different concentrations of AgNPs in dispersion medium (Supplemental Figure 4).
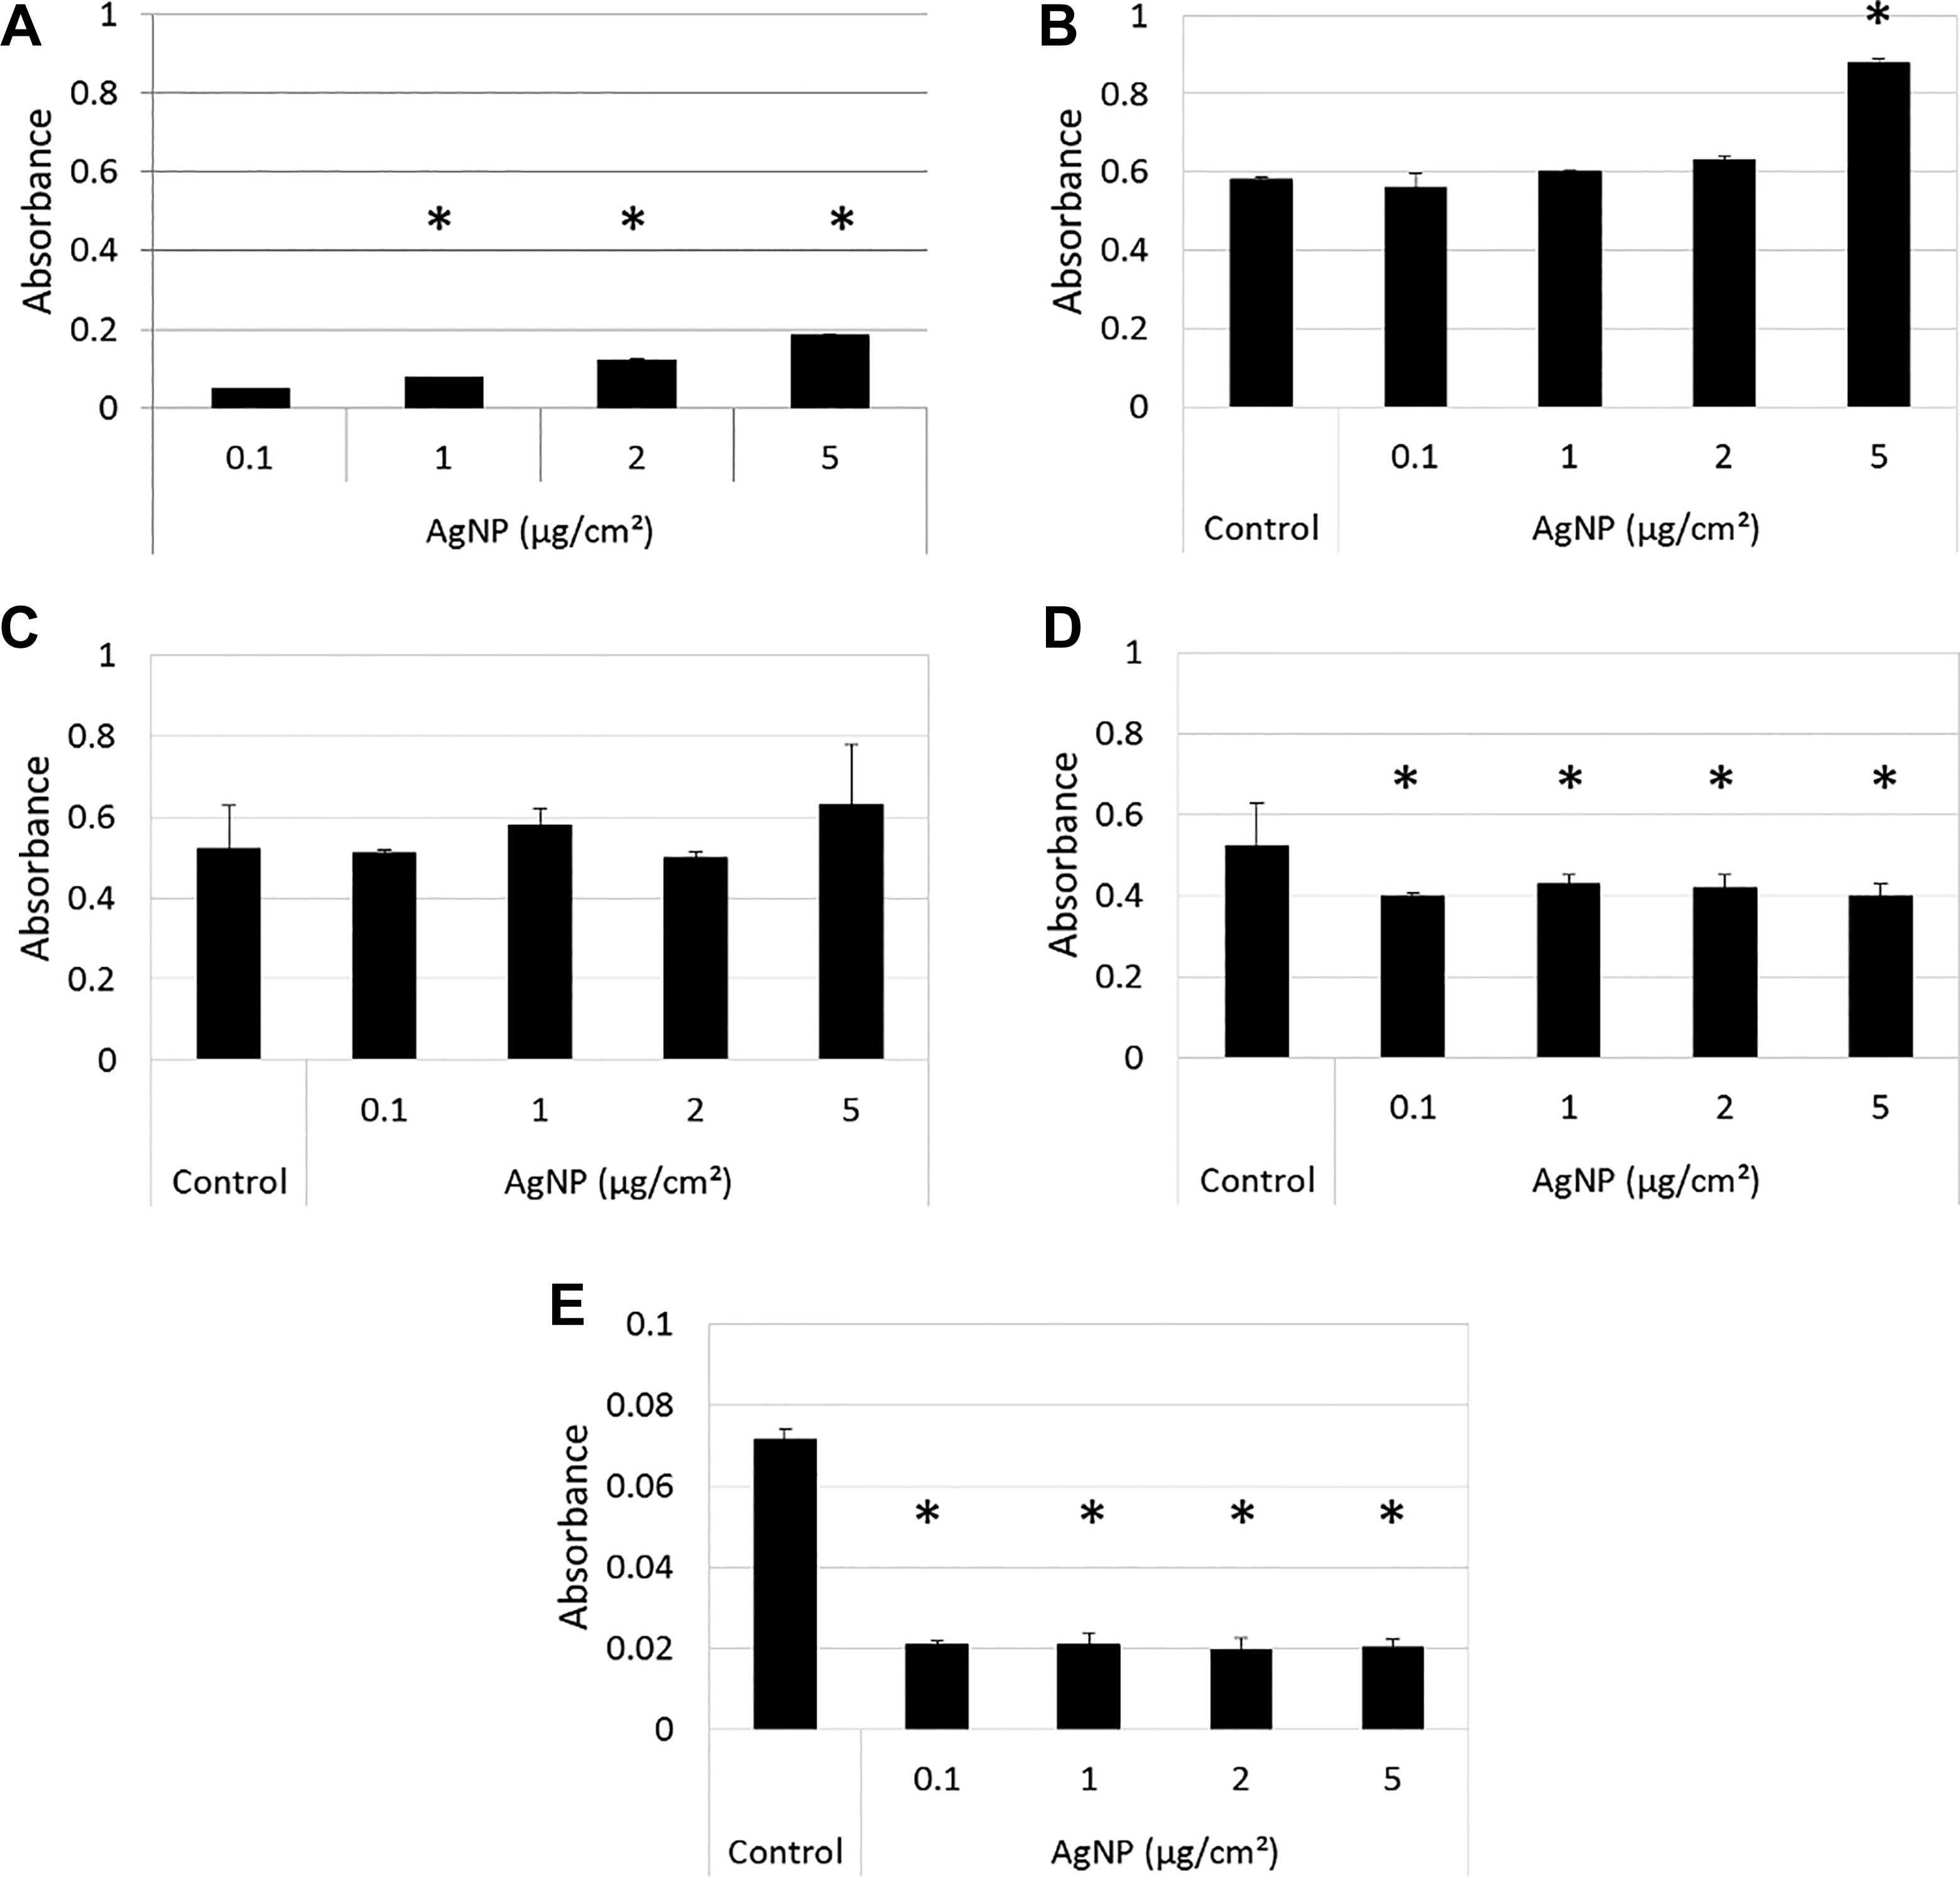
Reaction of AgNPs with the XTT assay. A, The absorbance of AgNPs at 0.1, 1, 2, and 5 µg/cm2 in dispersion medium only was recorded at 450 nm to determine whether AgNPs interfere with the read-out signal. B, Reaction of AgNPs in the conversion of XTT substrate to formazan product in the presence of 0.1 mM NADH cofactor. Control represents XTT plus NADH. C, Subtraction of the absorbance of AgNPs in dispersion medium only shown in (A) from the absorbance of AgNPs in XTT and NADH shown in (B). D, Reaction of AgNPs with formazan. Control represents formazan only. E, Reaction of AgNPs with XTT substrate. Control represents XTT only. Data are presented as average absorbance values at 450 nm with error bars indicating standard deviations; *P < 0.05, compared to 0.1 µg/cm2 (for A), or to control (for B-E). AgNPs indicates silver nanoparticles; NADH, nicotinamide adenine dinucleotide.
b. Reaction of AgNPs with XTT assay components
When incubated with XTT substrate and NADH cofactor, AgNPs did not show a specific upward or downward trend, except for a significant increase at 5 µg/cm2 (Figure 7B), which explains the increase in absorbance seen in the presence of cells at 5 µg/cm2 (Figure 4B). This observation was further confirmed by conducting absorbance spectra of different concentrations of AgNPs in the presence of XTT substrate and NADH cofactor (Supplemental Figure 5).
Subtracting the absorbance of AgNPs in dispersion medium only (Figure 7A) from the absorbance of AgNPs in XTT substrate and NADH (Figure 7B) did not result in a significant difference from 0.1 to 5 µg/cm2 (Figure 7C), indicating that:
The optical interference seen in Figure 7A is not pronounced enough to cause altered absorbance in the presence of cofactor in Figure 7B and
AgNPs do not interfere with the XTT components in the presence of cofactor.
Silver NPs were then incubated with formazan, the already converted product (Figure 7D), and with the XTT substrate (Figure 7E) where a significant decrease in absorbance was obtained after subtraction of the absorbance values of NPs in dispersion medium. These results indicate that AgNPs also exhibit an inherent capacity to adsorb XTT components in the absence of cofactor.
Lactate Dehydrogenase Assay
Cell-based studies
In contrast to the XTT assay (Figure 4), the LDH assay didn’t show any significant differences between untreated and AuNP-treated cells (Figure 8A). For the AgNPs, the LDH assay showed a significant decrease in viability at 2 and 5 µg/cm2 (Figure 8B). Whether these results are a true reflection of the actual toxicity (or lack thereof) will only be confirmed by also assessing the possible interference mechanisms at play in the absence of cells, as discussed below.
Toxicity assessment of BEAS-2B cells exposed to AuNPs (A) and AgNPs (B) using the CytoTox One (LDH) toxicity assay. Fluorescence was measured at 560/590 nm. Average viability is represented as a percentage of the untreated control cells. Error bars indicate standard deviations; *P < 0.05, compared to untreated cells. AgNPs indicates silver nanoparticles; AuNPs, gold nanoparticles; LDH, lactate dehydrogenase.
Cell-free interference studies
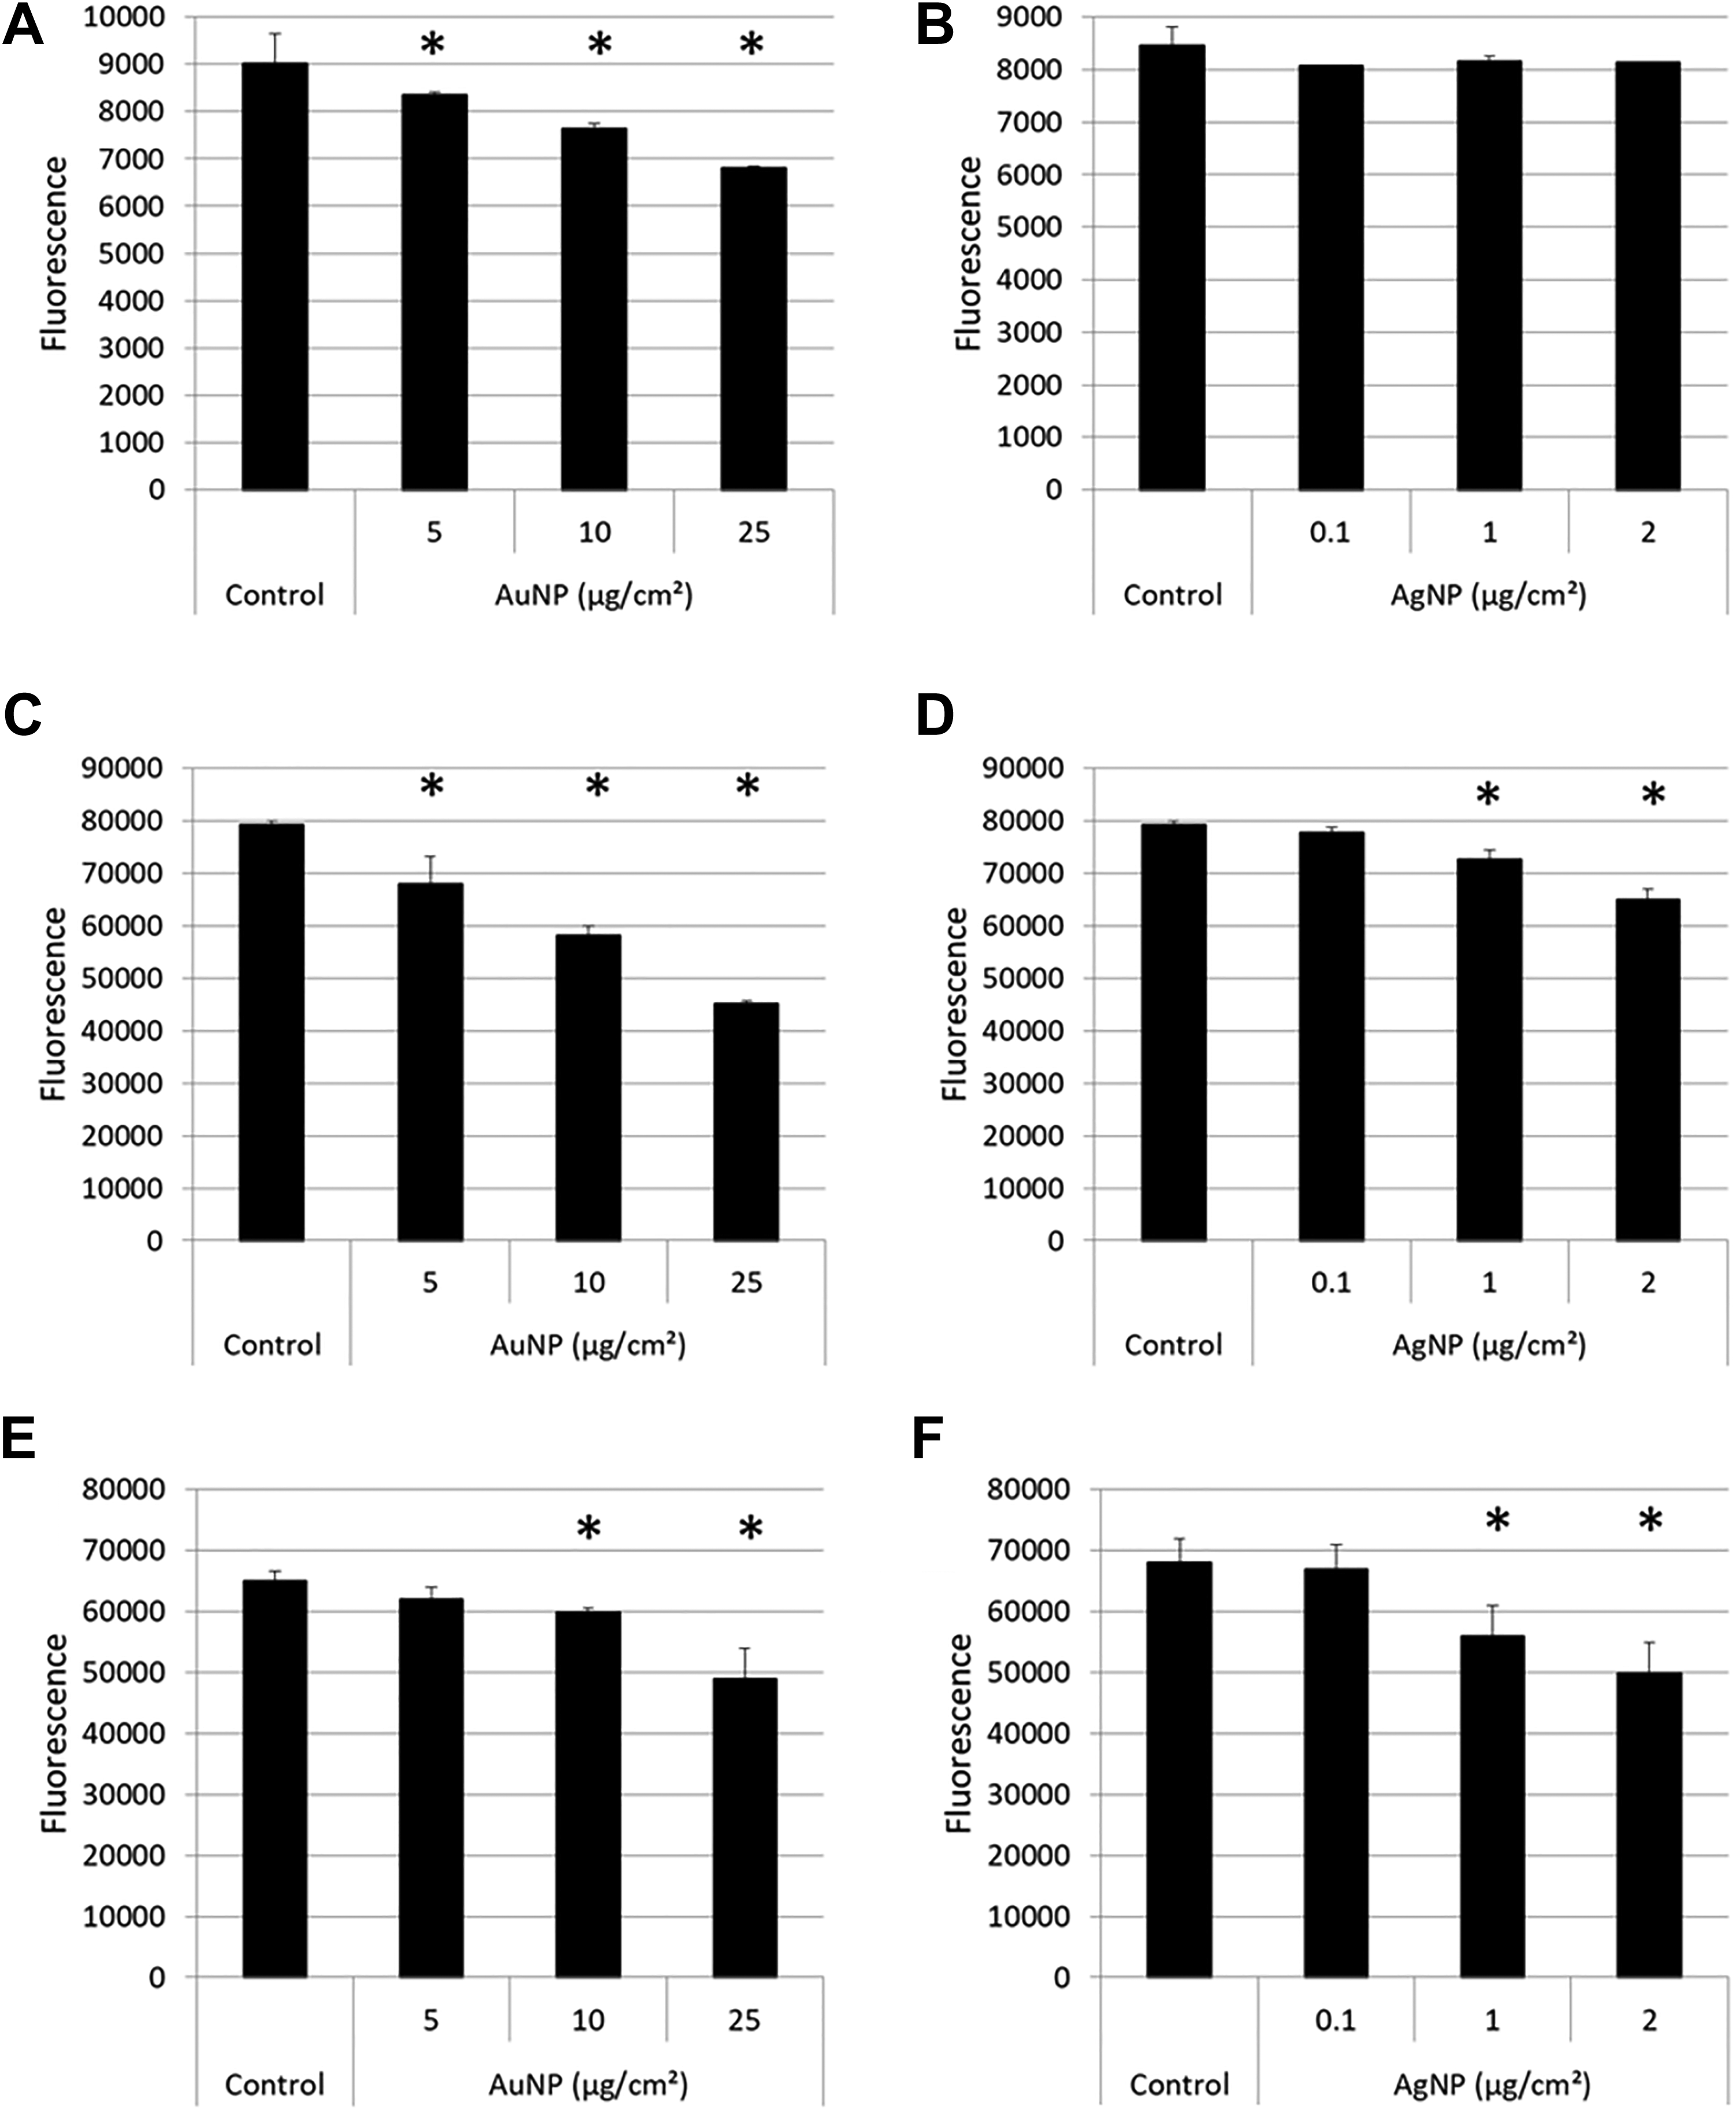
The interference of particles with the LDH assay system was next investigated. None of the particles showed any significant fluorescence values at 560 nm excitation and 590 nm emission, the wavelengths used to detect the resorufin product in the LDH assay (Supplemental Figure 6). Furthermore, AuNPs (Figure 9A-C) appeared not to show any interference with the LDH assay components in the presence or absence of NADH cofactor. The lack of interference therefore shows that the results obtained with the LDH assay represent the true toxicity of the AuNPs.
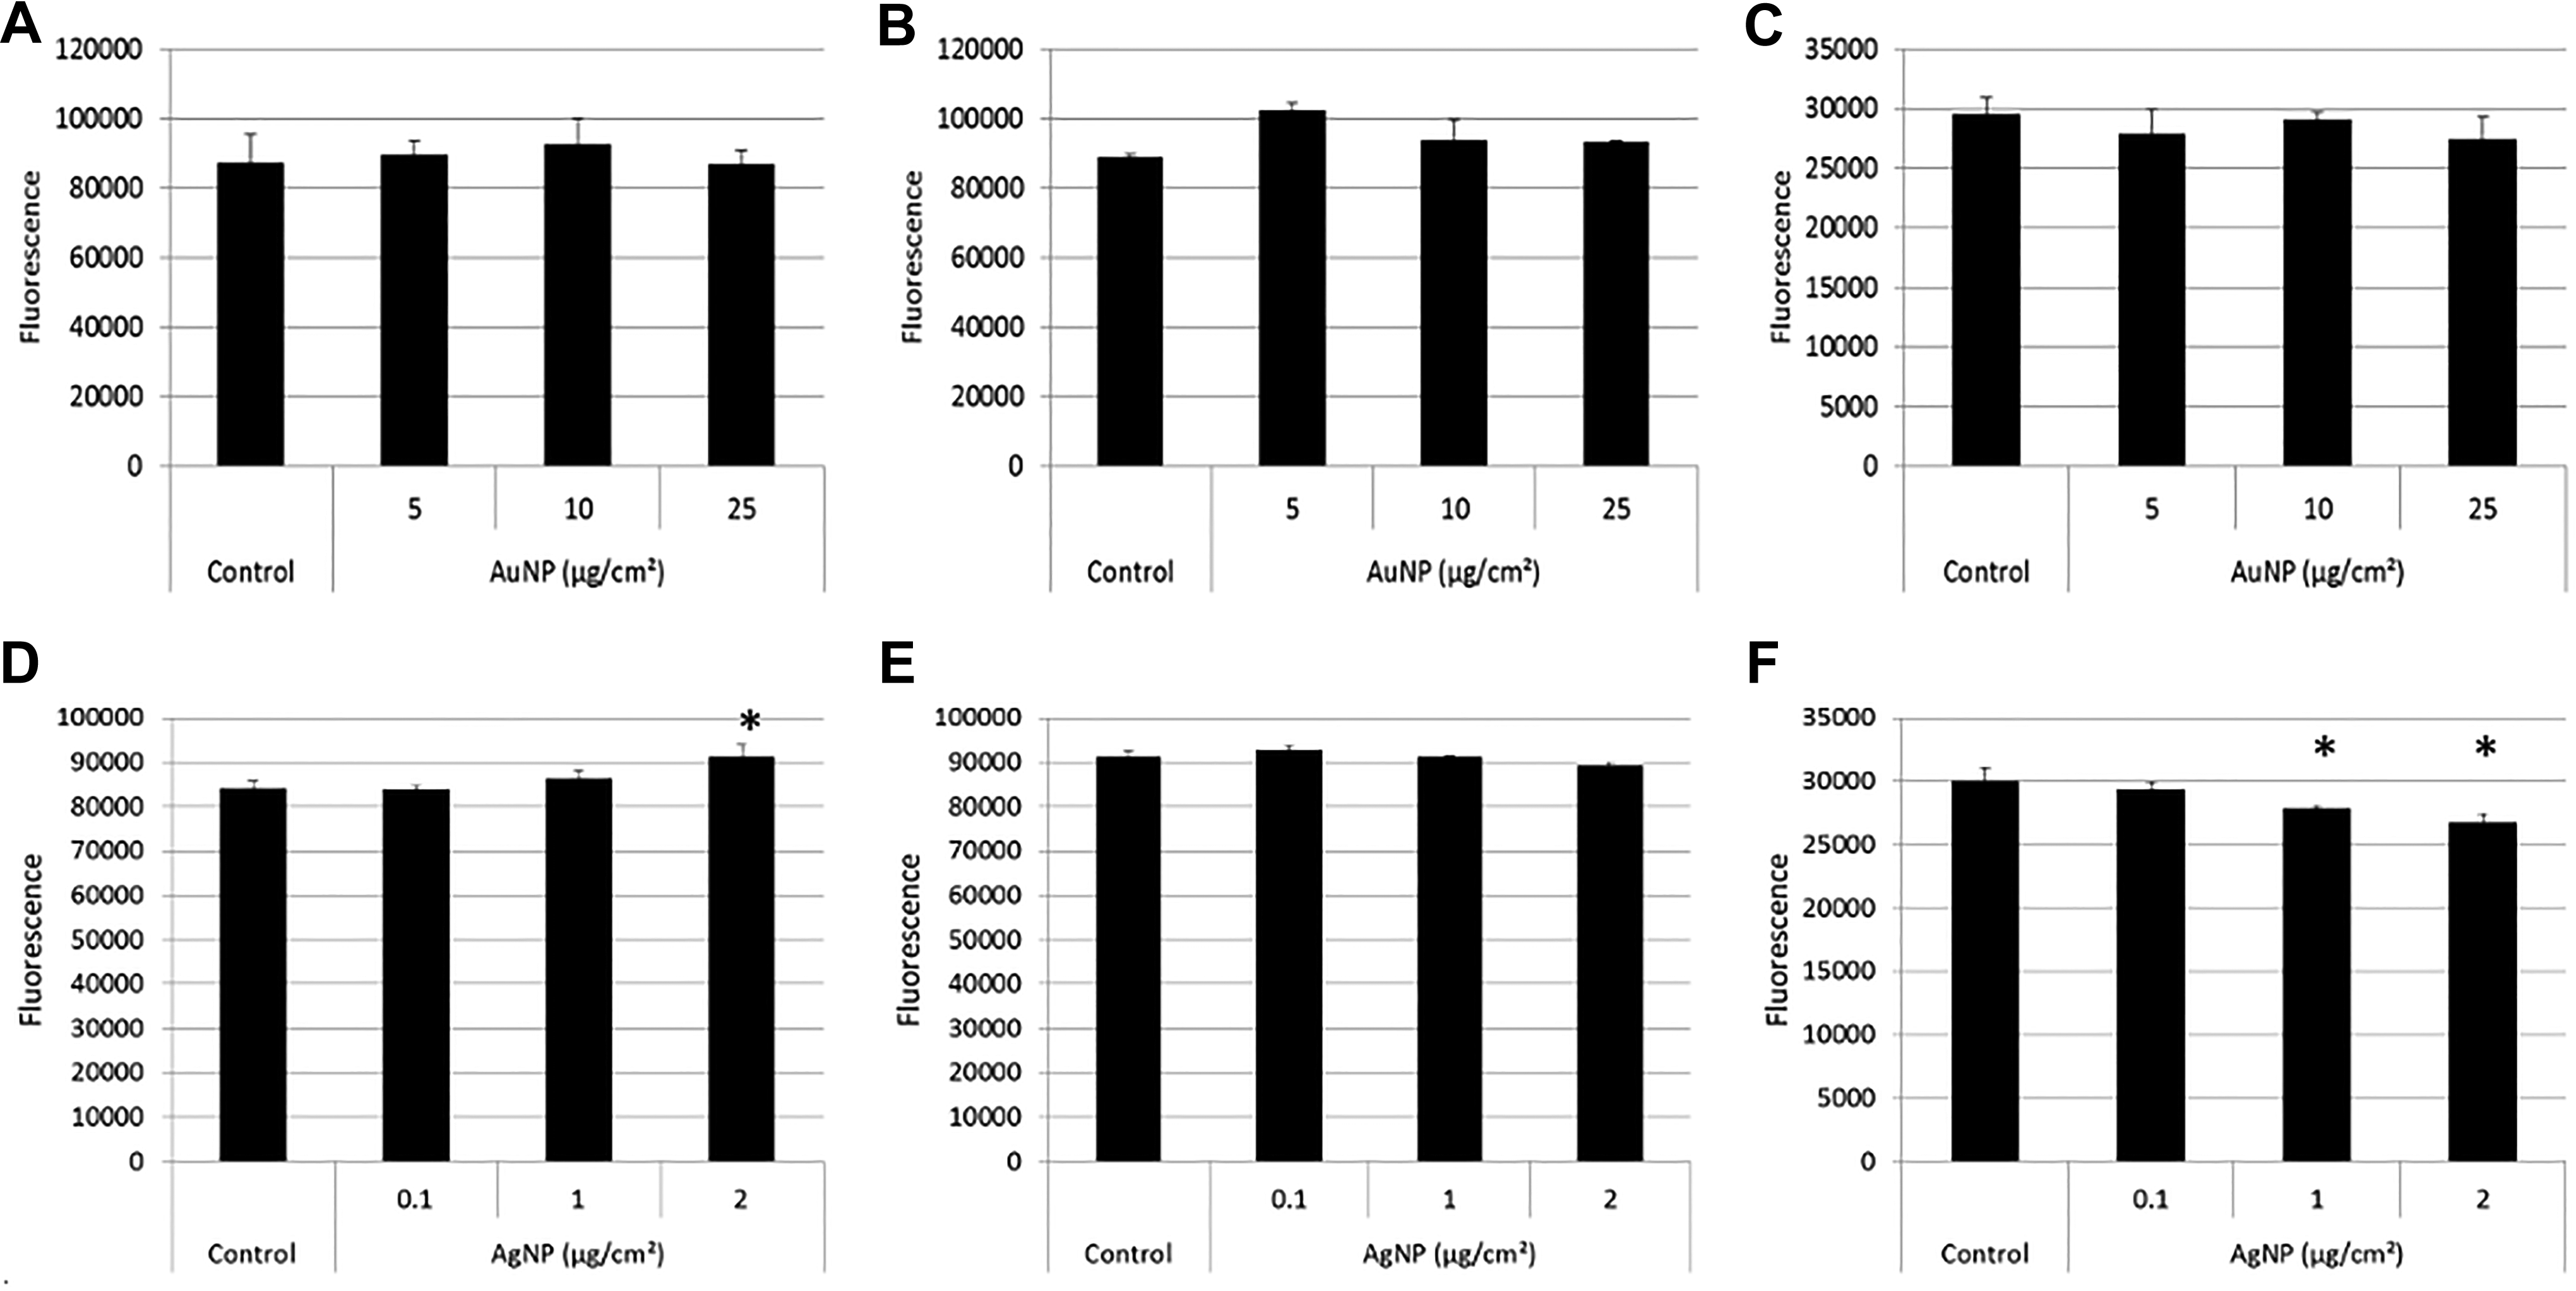
Reaction of AuNPs and AgNPs with the LDH assay. Reaction of AuNPs (A) and AgNPs (D) in the conversion of resazurin substrate to resorufin product in the presence of 0.1 mM NADH cofactor. Control represents resazurin and NADH. Reaction of AuNPs (B) and AgNPs (E) with resorufin. Control represents resorufin only. Reaction of AuNPs (C) and AgNPs (F) with resazurin substrate. Control represents resazurin only. Data are presented as average fluorescence values at 560/590 nm with error bars indicating standard deviations; *P < 0.05, compared to control. AgNPs indicates silver nanoparticles; AuNPs, gold nanoparticles; LDH, lactate dehydrogenase.
Silver NPs, on the other hand, were able to produce resorufin product in the presence of cofactor (Figure 9D) and adsorb the substrate in the absence of cofactor (Figure 9F).
Adenosine Triphosphate Assay
Cell-based studies
For the ATP assay, a trend toward concentration-dependent toxicity was observed for AuNPs, which was significantly lower than the untreated cells at 50 µg/cm2 (Figure 10A). For AgNPs, the ATP assay showed a significant decrease in viability at 2 and 5 µg/cm2 (Figure 10B). As with the LDH assay, whether these results are a true reflection of the actual toxicity will only be confirmed by also assessing the possible interference mechanisms at play in the absence of cells, as discussed below.
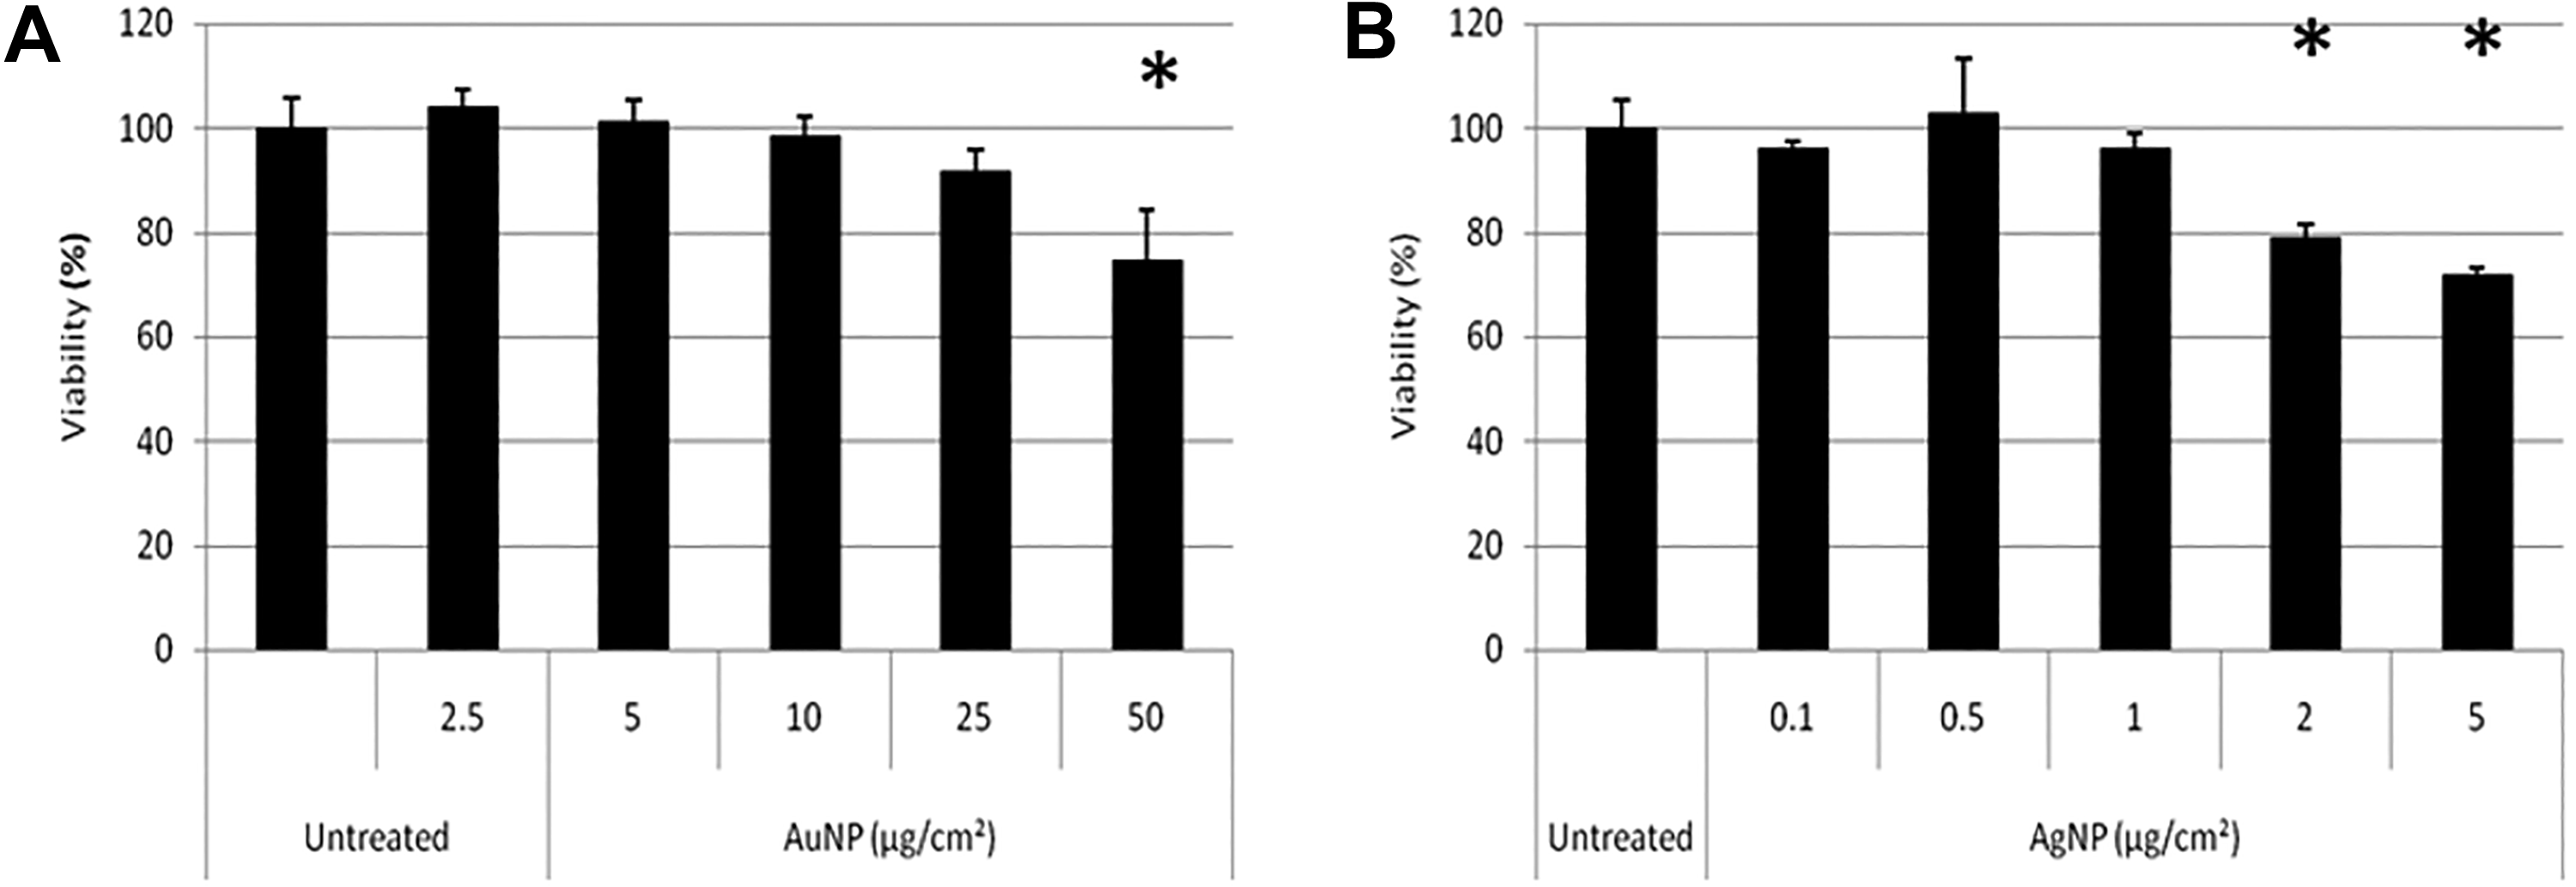
Toxicity assessment of BEAS-2B cells exposed to AuNPs (A) and AgNPs (B) using the CellTiter Glo (ATP) toxicity assay. Average viability is represented as a percentage of the untreated control cells. Error bars indicate standard deviations; *P < 0.05, compared to untreated cells. AgNPs indicates silver nanoparticles; ATP, adenosine triphosphate; AuNPs, gold nanoparticles.
Cell-free interference studies
The interference of AuNPs with the ATP assay system was next investigated. Although luminescence values were detected for AuNPs in dispersion medium, the relative luminescence units were approximately 1% of what is generally obtained in the presence of ATP assay components. Subtracting the optical interference from the data did not cause any significant change in the luminescence recorded (results not shown). The adsorptive properties of AuNPs, as seen with XTT assay components, were again observed when AuNPs were incubated with luciferin substrate and ATP cofactor (Figure 11A). Gold NPs adsorbed the components thereby quenching the luminescence in a concentration-dependent manner. The interference of AuNPs with the ATP assay may therefore be falsely interpreted as an overestimation of toxicity in a cell-based study, similar to what was observed in Figure 10A. The incubation of AuNPs with oxyluciferin product alone produced no change in luminescence (Figure 11B); the incubation with luciferin substrate alone produced a decrease in luminescence compared to the control (Figure 11C). Therefore, the decrease in luminescence seen in Figure 11A may have resulted from the ability of AuNPs to adsorb luciferin, thereby preventing its conversion to oxyluciferin.
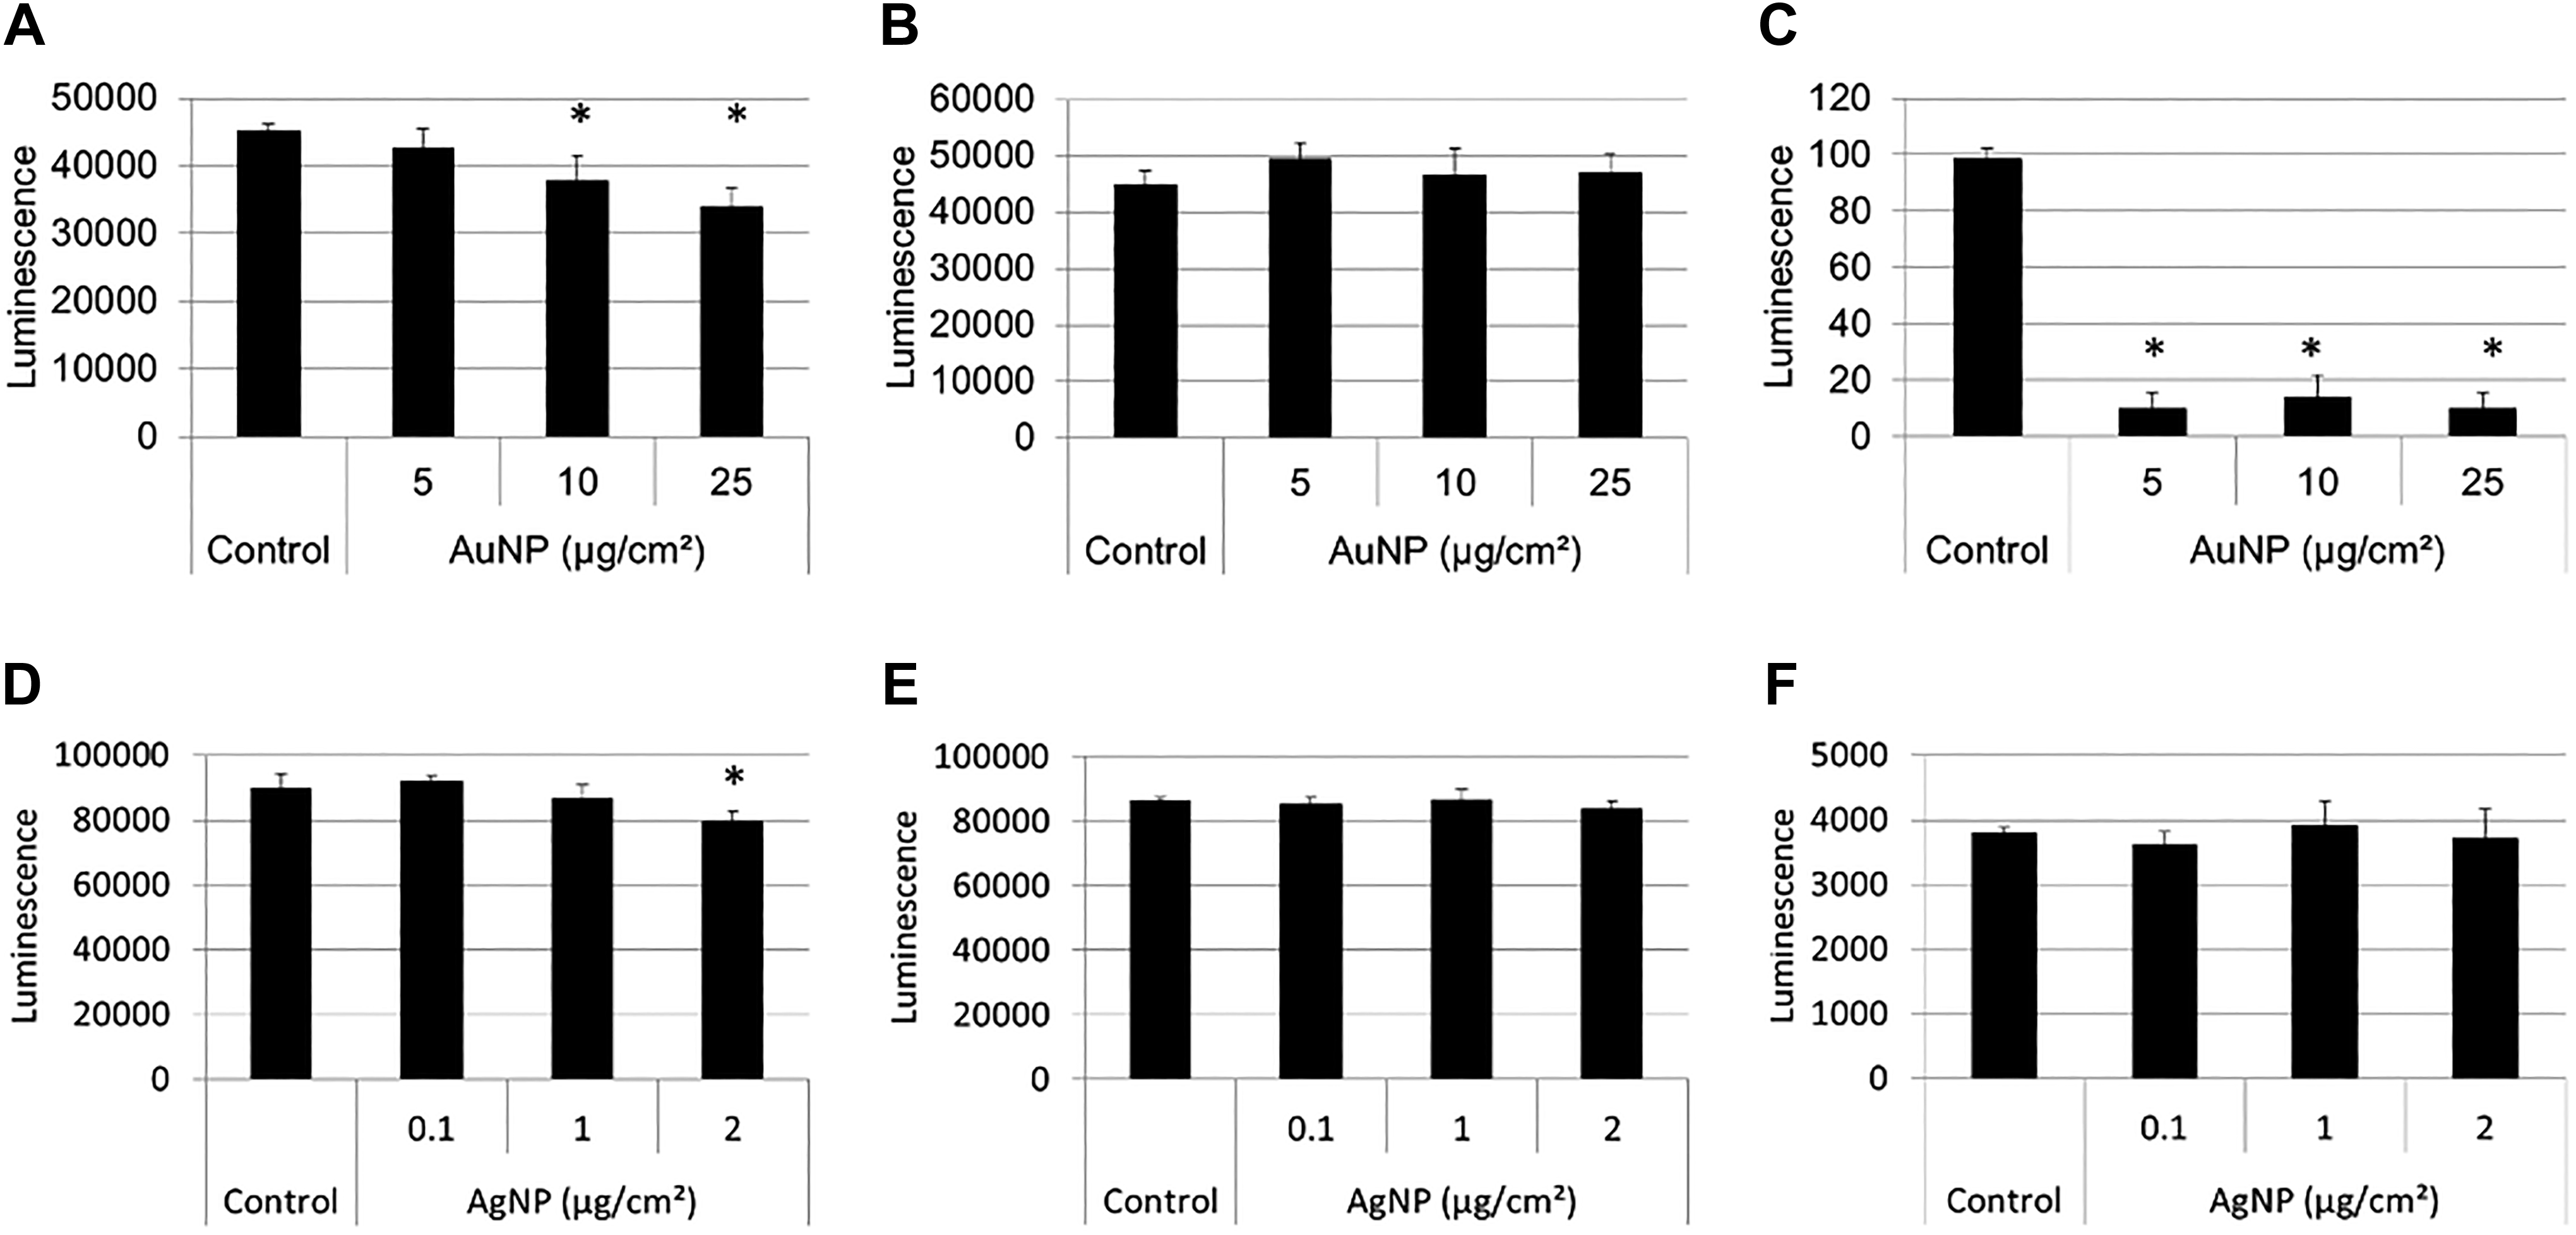
Reaction of AuNPs and AgNPs with the ATP assay. Reaction of AuNPs (A) and AgNPs (D) in the conversion of luciferin substrate to oxyluciferin product in the presence of 1.5 µM ATP cofactor. Control represents luciferin and ATP. Reaction of AuNPs (B) and AgNPs (E) with oxyluciferin. Control represents oxyluciferin only. Reaction of AuNPs (C) and AgNPs (F) with luciferin. Control represents luciferin only. Data are presented as average luminescence values with error bars indicating standard deviations; *P < 0.05, compared to control. AgNPs indicates silver nanoparticles; ATP, adenosine triphosphate; AuNPs, gold nanoparticles.
As with AuNPs, the relative luminescence units of AgNPs in dispersion medium were approximately 1% of what is generally obtained in the presence of ATP assay components and did not cause any significant change in the luminescence recorded (results not shown). A significant decrease in luminescence was observed at 2 µg/cm2 when AgNPs were incubated with oxyluciferin in the presence of cofactor (Figure 11D), while in the absence of cofactor, no significant decrease in luminescence was seen with oxyluciferin or luciferin only (Figure 11B and C). These results suggest that AgNPs have the ability to adsorb the product, more so in the presence of cofactor than in its absence.
xCELLigence RTCA
Figure 12 shows the growth curves, indicated by CI, for BEAS-2B cells treated with AuNPs (Figure 12A) and AgNPs (Figure 12B). The cells were treated approximately 24 hours after seeding, and the CI was normalized at a time point just before treatment (black vertical line). For AuNPs, a lack of toxicity was observed; while for AgNPs, a dose-dependent toxicity was observed with IC50 values calculated as 1.721 µg/cm2. These toxicities, or lack thereof, are the true toxicities as it is in the absence of interference.
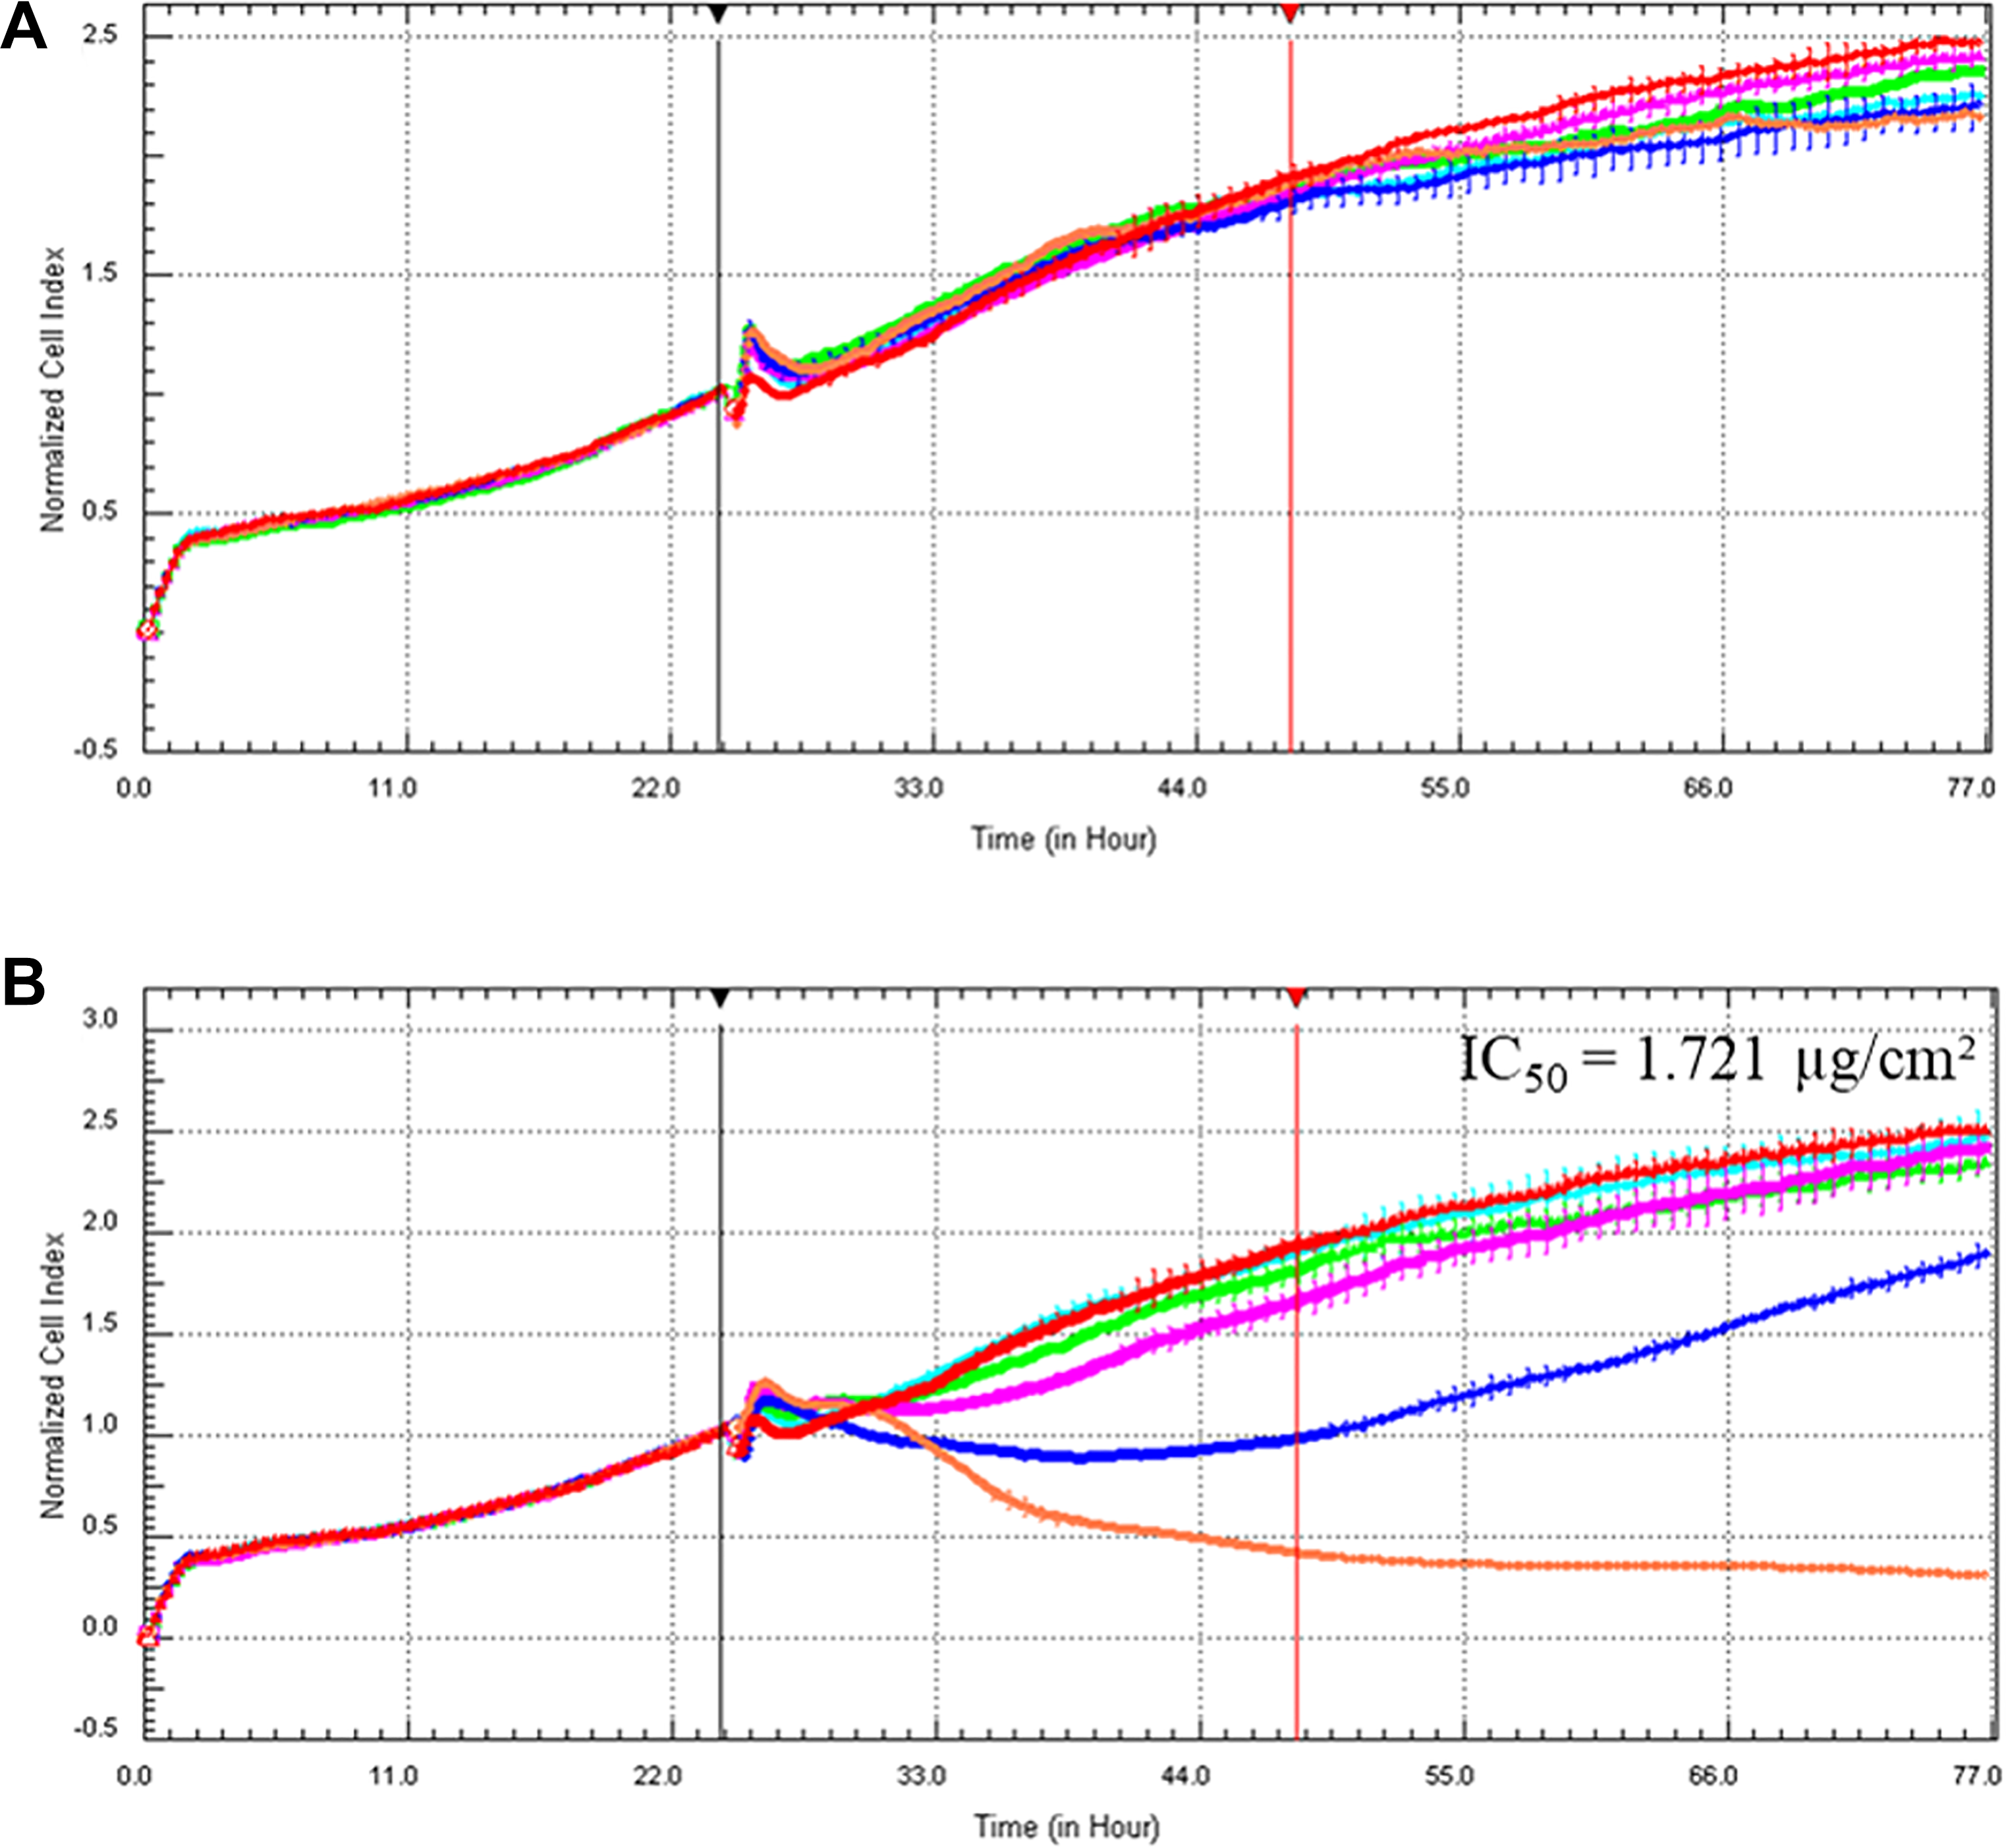
Normalized CI of BEAS-2B cells exposed to AuNPs (A) and AgNPs (B) using the xCELLigence RTCA. Cells were seeded and allowed to recover for approximately 24 hours prior to treatment with AuNPs at 2.5 (light blue), 5 (green), 10 (pink), 25 (dark blue), and 50 (orange) µg/cm2 and AgNPs at 0.1 (light blue), 0.5 (green), 1 (pink), 2 (dark blue), and 5 (orange) µg/cm2. Untreated cells (red) received dispersion medium only. The CI curves were normalized (black vertical line) at 24 hours for AuNPs and AgNPs. The red vertical line indicates the 24th hour after the addition of the AuNPs. AgNPs indicates silver nanoparticles; AgNPs, gold nanoparticles; CI, cell index; RTCA, real-time cell analyzer.
The results obtained from the xCELLigence RTCA (Figure 12) was used to calculate the viability as a percentage of the untreated, control cells at the time point 24 hours after treatment (Figure 13) to allow for comparisons with the results obtained from the XTT, LDH, and ATP cell-based assays (Figures 4, 8, and 10). Figure 13 shows that, for AuNPs, none of the five concentrations caused significant toxicities in BEAS-2B cells (Figure 13A), while AgNPs showed a significant, concentration-dependent increase in toxicity (Figure 13B). These results compare well with the results obtained with the LDH assay for both particles (Figure 8A and B) as well as with the ATP assay for AgNPs (Figure 10B).
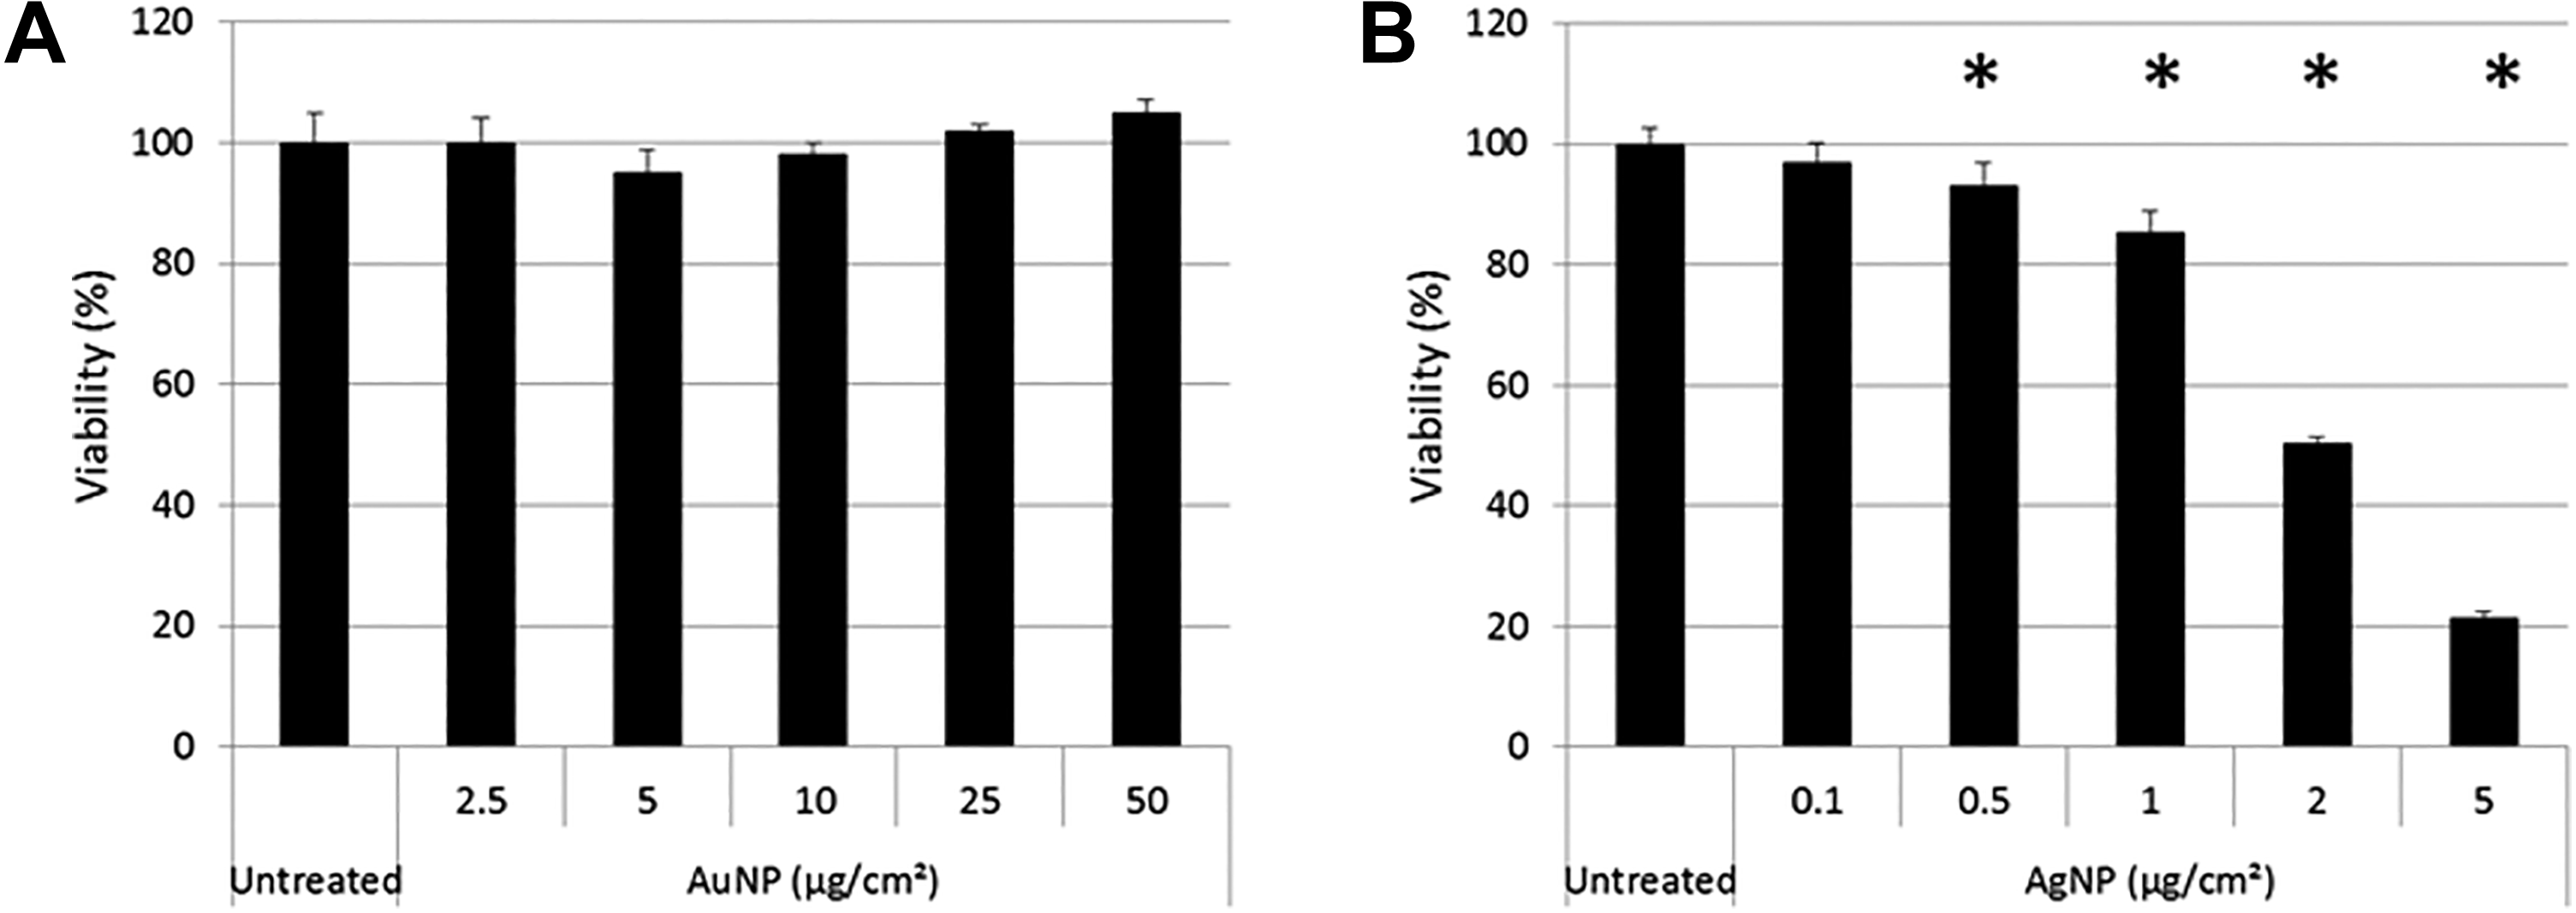
Toxicity calculated at 24 hours after treatment of BEAS-2B cells with AuNPs (A) and AgNPs (B) using the xCELLigence RTCA. The percentage viability at the 24th hour after treatment was calculated to determine any statistical differences between treated and untreated cells. AgNPs indicates silver nanoparticles; AuNPs, gold nanoparticles; RTCA, real-time cell analyzer.
The good correlation of the LDH assay (for both NPs) and the ATP assay (for AgNPs only) with the xCELLigence RTCA is clearly a result of the lack of interference, or slight interference as in the case of AgNPs, between these conventional assays (Figures 9 and 11D-F) and the xCELLigence RTCA, which also showed no interference with the AuNPs and AgNPs (Figure 14).
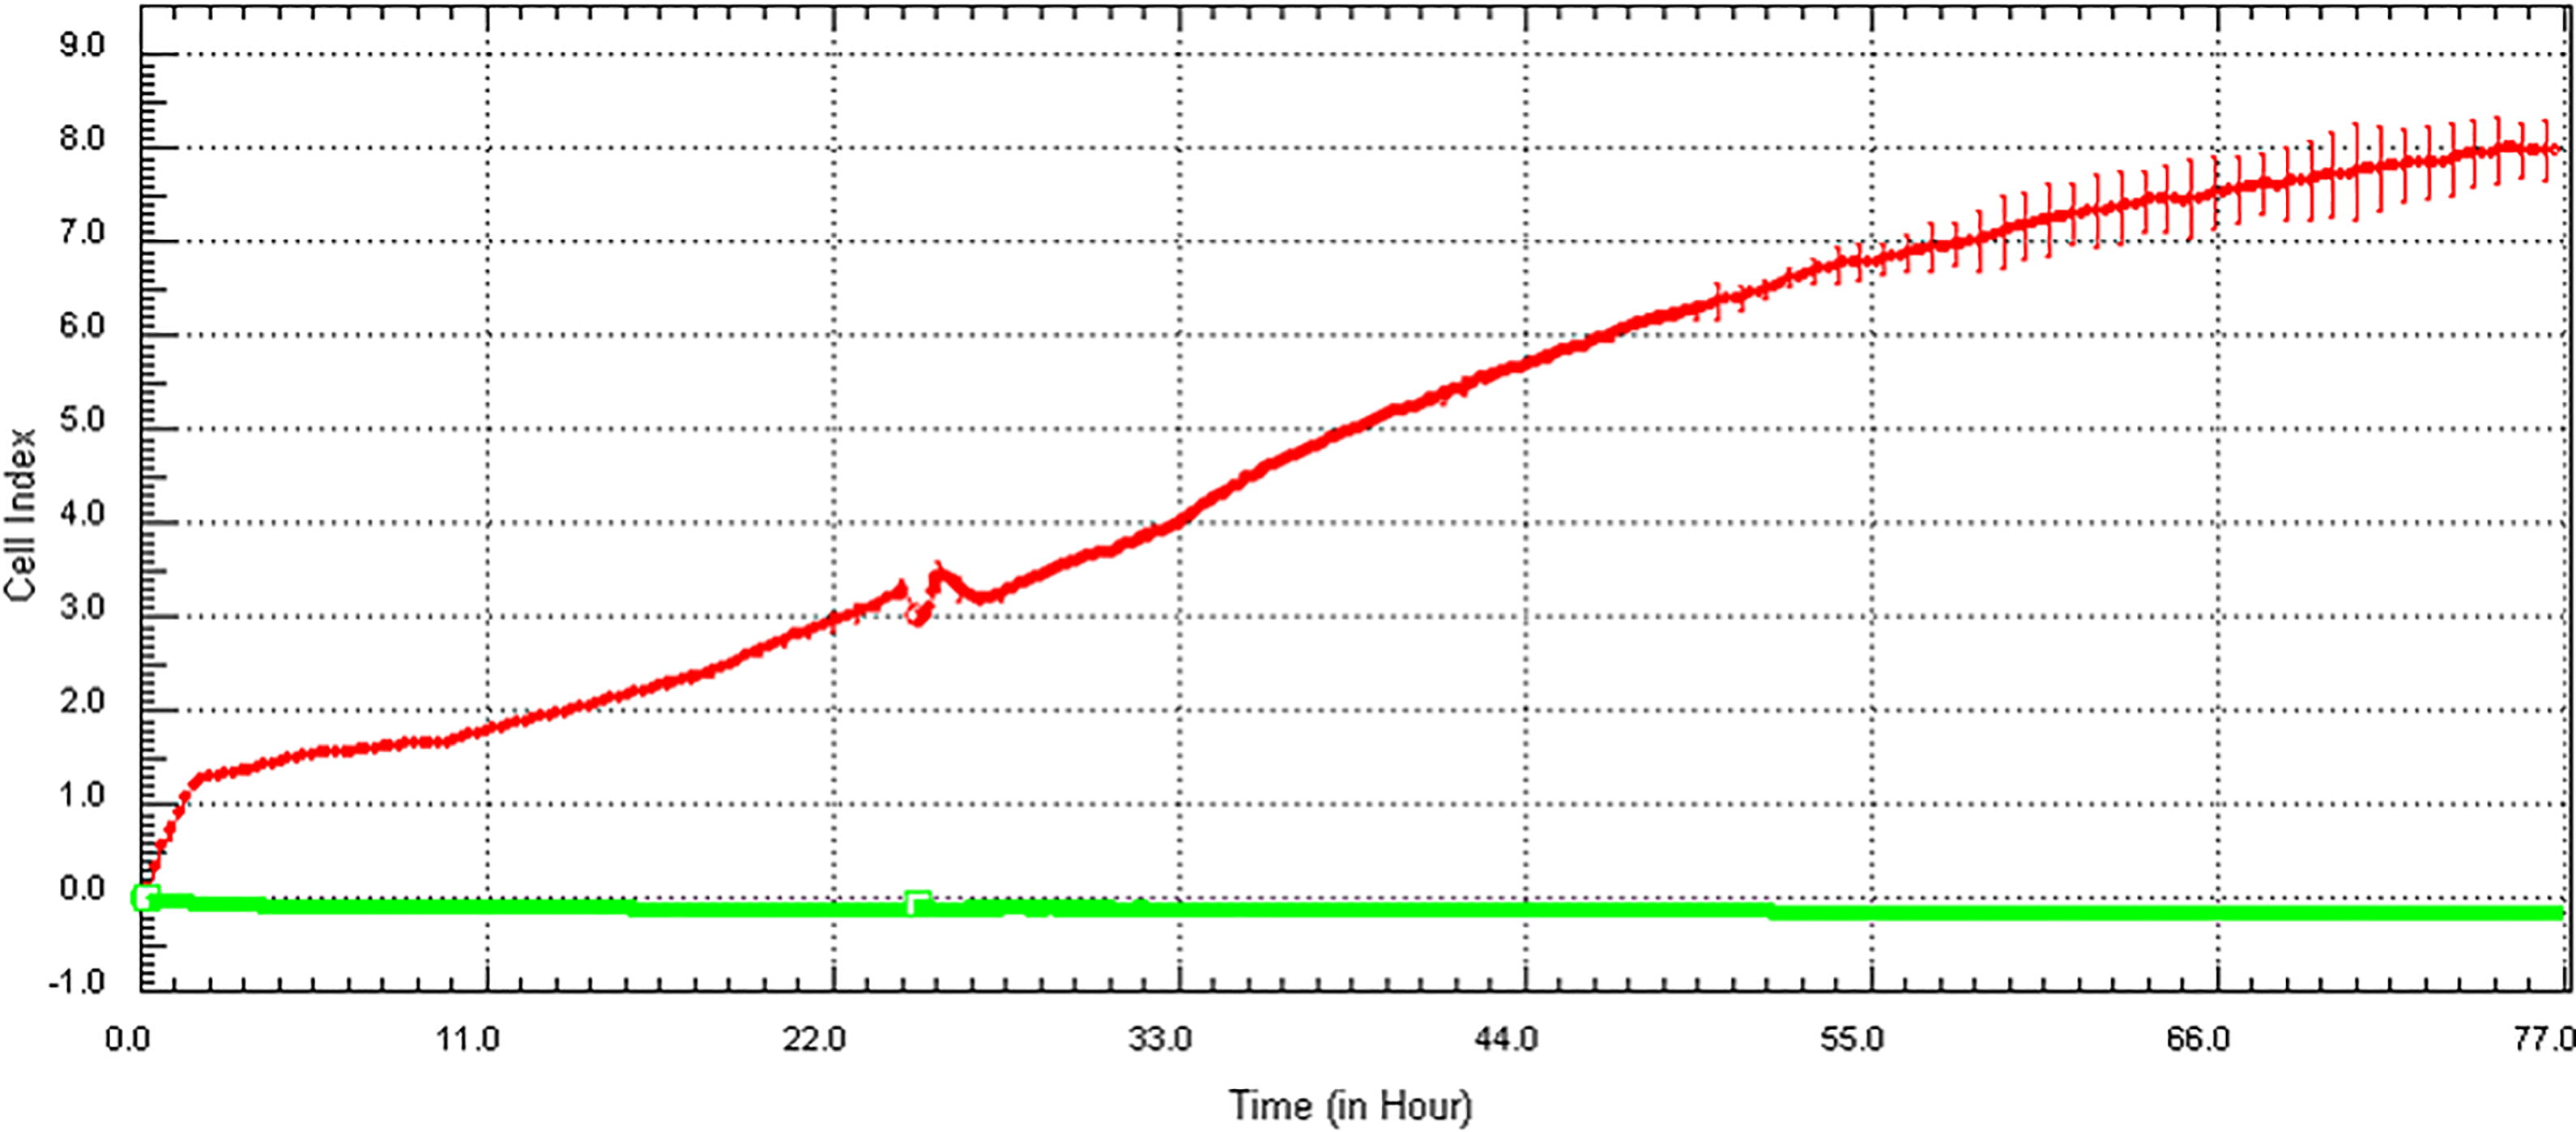
Reaction of NPs with the xCELLigence RTCA. Wells containing only AuNPs or AgNPs at the highest concentrations in the absence of cells or wells containing media only (green horizontal line) did not show an increase in CI value and remained 0 over time. The red line demonstrates the normal increase in CI of untreated BEAS-2B cells. AgNPs indicates silver nanoparticles; AuNPs, gold nanoparticles; CI, cell index; RTCA, real-time cell analyzer.
DCFH-DA Assay, PI, and JC-1 Assay in the Absence of Cells
The next step was to assess the interference of the particles with three fluorescent dyes, which included the popular DCF, PI, and JC-1, and these dyes are commonly used in HTS platforms.
None of the particles in dispersion medium alone showed any interference with fluorescence at 480 nm excitation (Supplemental Figure 7). However, when incubated with 100 nM DCF (Figure 15), an apparent concentration-dependent quenching of fluorescence intensity was observed for AuNPs (Figure 15A), which was also confirmed when full fluorescence emission spectra were recorded (Supplemental Figure 8). Silver NPs did not quench the fluorescence of the DCF at 100 nM (Figure 15B). Quenching was only observed at the highest concentration of AgNPs with 10 and 1000 nM DCF (Supplemental Figure 9).
Reaction of AuNPs and AgNPs with DCF, PI, and JC-1. For DCF (A and B), the fluorescence intensities of the particles in 100 nM DCF product were recorded at 480/530 nm. Controls represent DCF product only. For PI (C and D), the fluorescence intensities of the particles in 5 µM PI were recorded at 485/590 nm. Control represents 5 µM PI only. For JC-1 (E and F), the fluorescence intensities of the particles with 1× JC-1 dye were recorded at 488/528 nm. Controls represent 1× JC-1 only. Data are presented as average fluorescence values with error bars indicating standard deviations; *P < 0.05, compared to controls. AgNPs indicates silver nanoparticles; AuNPs, gold nanoparticles; DCF, 2′,7′-dichlorofluorescein; JC-1, 5,5′,6,6′-tetrachloro-1,1′,3,3′-tetraethyl-benzamidazolocarbocyanin iodide; PI, propidium iodide.
Similar to DCF, no interference with fluorescence was observed for AuNPs and AgNPs at 590 nm, the read-out for the fluorophore PI at 485 nm excitation (Supplemental Figure 10). However, when AuNPs (Figure 15C) and AgNPs (Figure 15D) were incubated with PI, both appeared to quench the fluorescence in a concentration-dependent manner. The fluorescence emission spectra of these particles confirming these results are shown in Supplemental Figure 11.
A similar effect was again seen with all the particles showing a lack of fluorescence at 488 nm excitation, the wavelength at which the JC-1 dye is recorded (Supplemental Figure 12). When the particles were incubated with JC-1, a concentration-dependent quenching of fluorescence was seen with AuNPs and AgNPs (Figure 15E and F). These results were also confirmed at the red fluorescence wavelengths, that is, 488/590 nm as well as the full fluorescence spectra (Supplemental Figure 13).
JC-1 Assay in the Presence of Cells
Gold NPs
Since JC-1 is generally analyzed with fluorescence microscopy in HTS assays, 34,35 it was decided to further assess interference of AuNPs with JC-1 in the presence of cells using fluorescence microscopy. For the purpose of this experiment whereby interference was tested within cells, it was decided to only use the two lower concentrations of AuNPs, that is, 5 and 10 µg/cm2 to better reflect NP concentrations used in actual cell-based studies. Spectral angle mapping was used to first confirm that AuNPs are indeed able to enter the BEAS-2B cells. The spectral library used for the SAM analysis is shown in Figure 16A. Several AuNPs were also found to be adsorbed to the cell surfaces (Figure 16B and C).
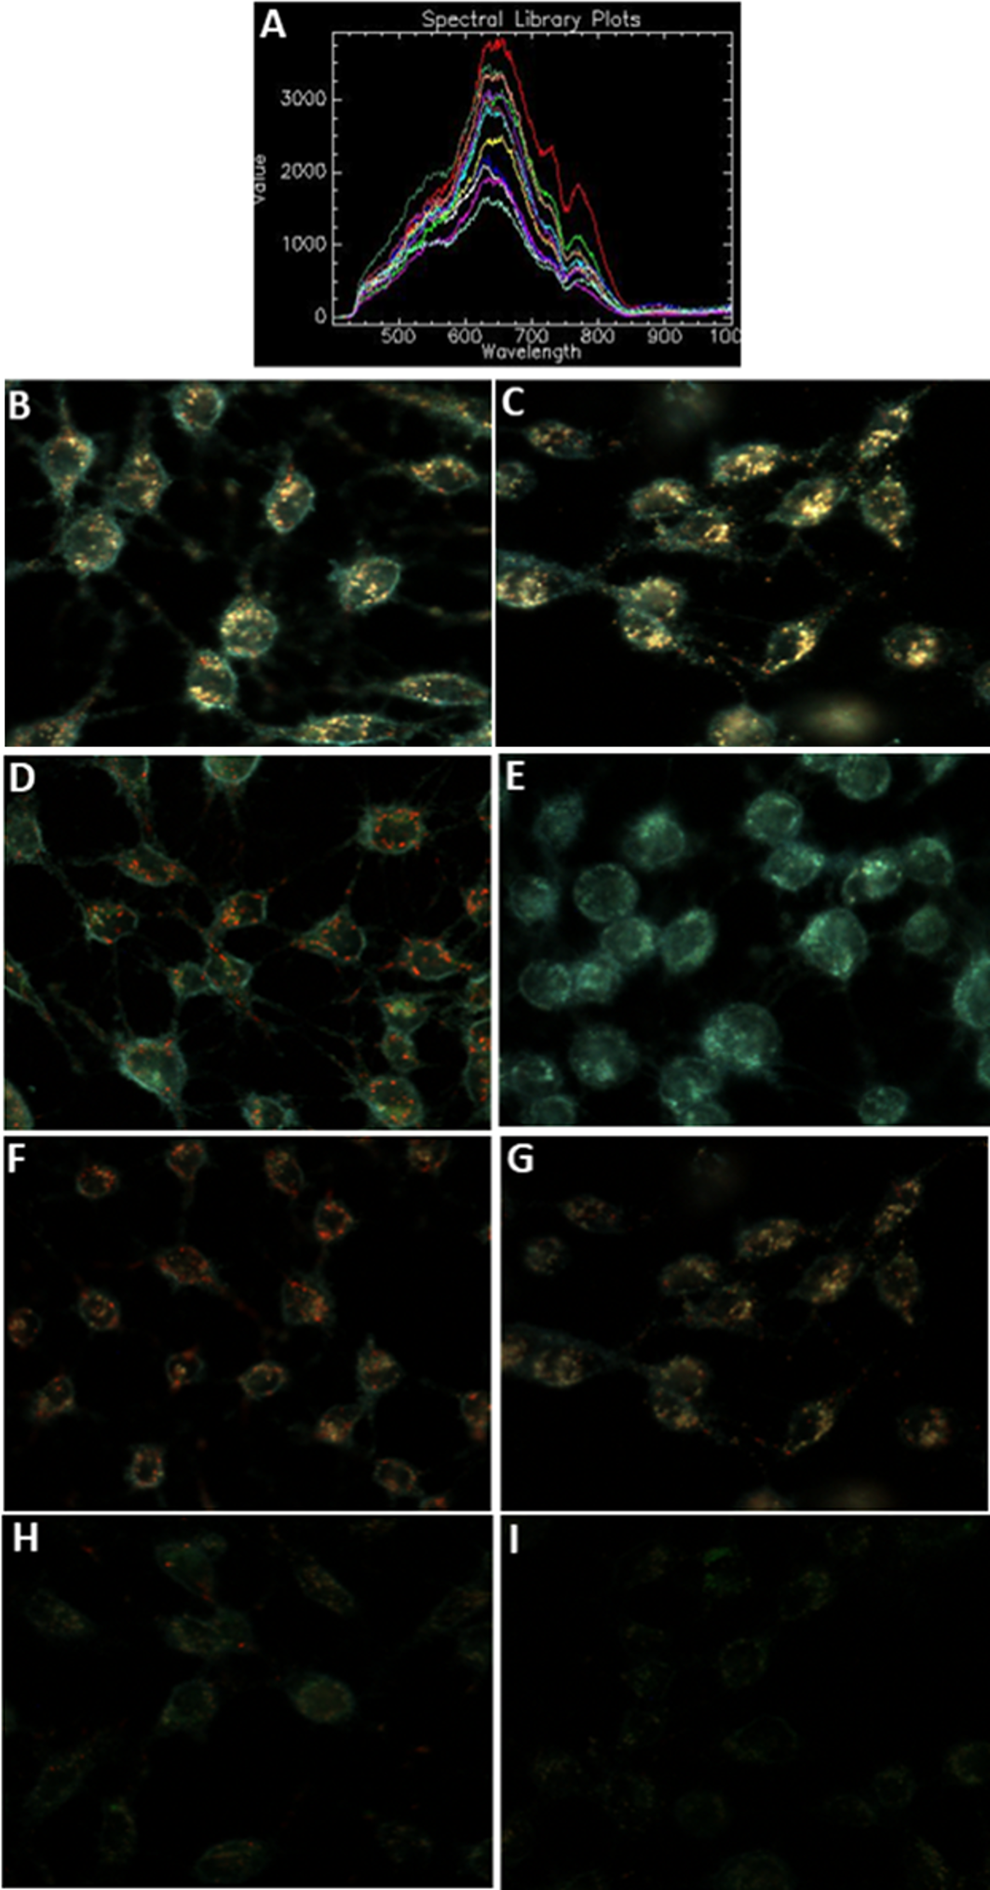
Reaction of AuNPs with JC-1 in the presence of BEAS-2B cells. A, The spectral profile of AuNPs collected following uptake in BEAS-2B cells. Dark-field images at ×60 magnification show BEAS-2B cells treated with AuNPs at 5 µg/cm2 (B) and 10 µg/cm2 (C) for 24 hours but not stained with JC-1. D, Untreated, healthy BEAS-2B cells stained with JC-1 dye. E, Apoptotic BEAS-2B cells with depolarized mitochondria stained with JC-1 dye (positive control). The BEAS-2B cells exposed to 5 µg/cm2 AuNPs (F) and 10 µg/cm2 AuNPs (G) for 24 hours and stained with JC-1 dye. The BEAS-2B cells treated with CCCP to depolarize mitochondria and then treated with 5 µg/cm2 AuNPs (H) and 10 µg/cm2 AuNPs (I) for 24 hours before being stained with JC-1 dye. AuNPs indicates gold nanoparticles; CCCP, carbonylcyanide m-chlorophenylhydrazone; JC-1, 5,5′,6,6′-tetrachloro-1,1′,3,3′-tetraethyl-benzamidazolocarbocyanin iodide.
Experiments were then conducted to assess the mechanism of interference of JC-1 with intracellular AuNPs. Generally, untreated, nonapoptotic BEAS-2B cells (negative control) stain red due to the presence of aggregated JC-1 reagent, called J-aggregates, inside the mitochondria (Figure 16D). Cells with depolarized mitochondria (positive control) stain green due to the monomeric structure of JC-1 (Figure 16E). Figure 16F and G shows JC-1 stained cells treated with AuNPs at 5 and 10 µg/cm2, respectively. From these figures, it can be concluded that AuNPs at these concentrations appear to be nontoxic based on the presence of red J-aggregates, which corresponds to the results obtained with the xCELLigence RTCA (Figure 12A).
To investigate the interference of AuNPs with the JC-1 dye, cells were first treated with AuNPs and then depolarized with CCCP before being stained with JC-1 dye. A lack of interference by NPs would have resulted in green fluorescence similar to what is shown in Figure 16E as all cells would be apoptotic due to the CCCP treatment. Interestingly, red fluorescence could still be observed in cells treated with 5 µg/cm2 AuNPs (Figure 16H), while a quenching of both green and red fluorescence was observed at 10 µg/cm2 (Figure 16I), indicating that AuNPs may have the ability to adsorb and aggregate the JC-1 dye, which may eventually lead to fluorescence quenching when the NP concentration is increased. These results correspond to those seen with the fluorescence plate reader (Figure 15E) for 10 µg/cm2. The red, aggregated JC-1 seen in the presence of AuNPs at 5 µg/cm2 may falsely be interpreted as an underestimation of apoptosis, while the quenching observed at 10 µg/cm2 could make it difficult to determine the degree of apoptosis.
Silver NPs
The same experiments were conducted with AgNPs to determine if AgNPs have the ability to interfere with JC-1 intracellularly. The two concentrations of AgNPs used included 0.1 and 1 µg/cm2. Figure 17A shows the spectral profile of AgNPs, which was used to determine if AgNPs are internalized or adsorbed to the surfaces of cells (Figure 17B and C). Figure 17D and E shows the negative and positive controls, respectively. Figure 17F shows JC-1 stained cells after treatment with AgNPs at 0.1 µg/cm2 showing several red aggregates within the cells and indicating the presence of healthy cells. These results correspond to the xCELLigence RTCA results (Figure 12B). Figure 17G shows JC-1 stained cells after treatment with AgNPs at 1 µg/cm2 also revealing high viability. Although the xCELLigence showed this AgNP concentration to be statistically lower than the untreated cells (Figure 12B), the viability is still relatively high, explaining why red aggregates are still seen in Figure 17G.
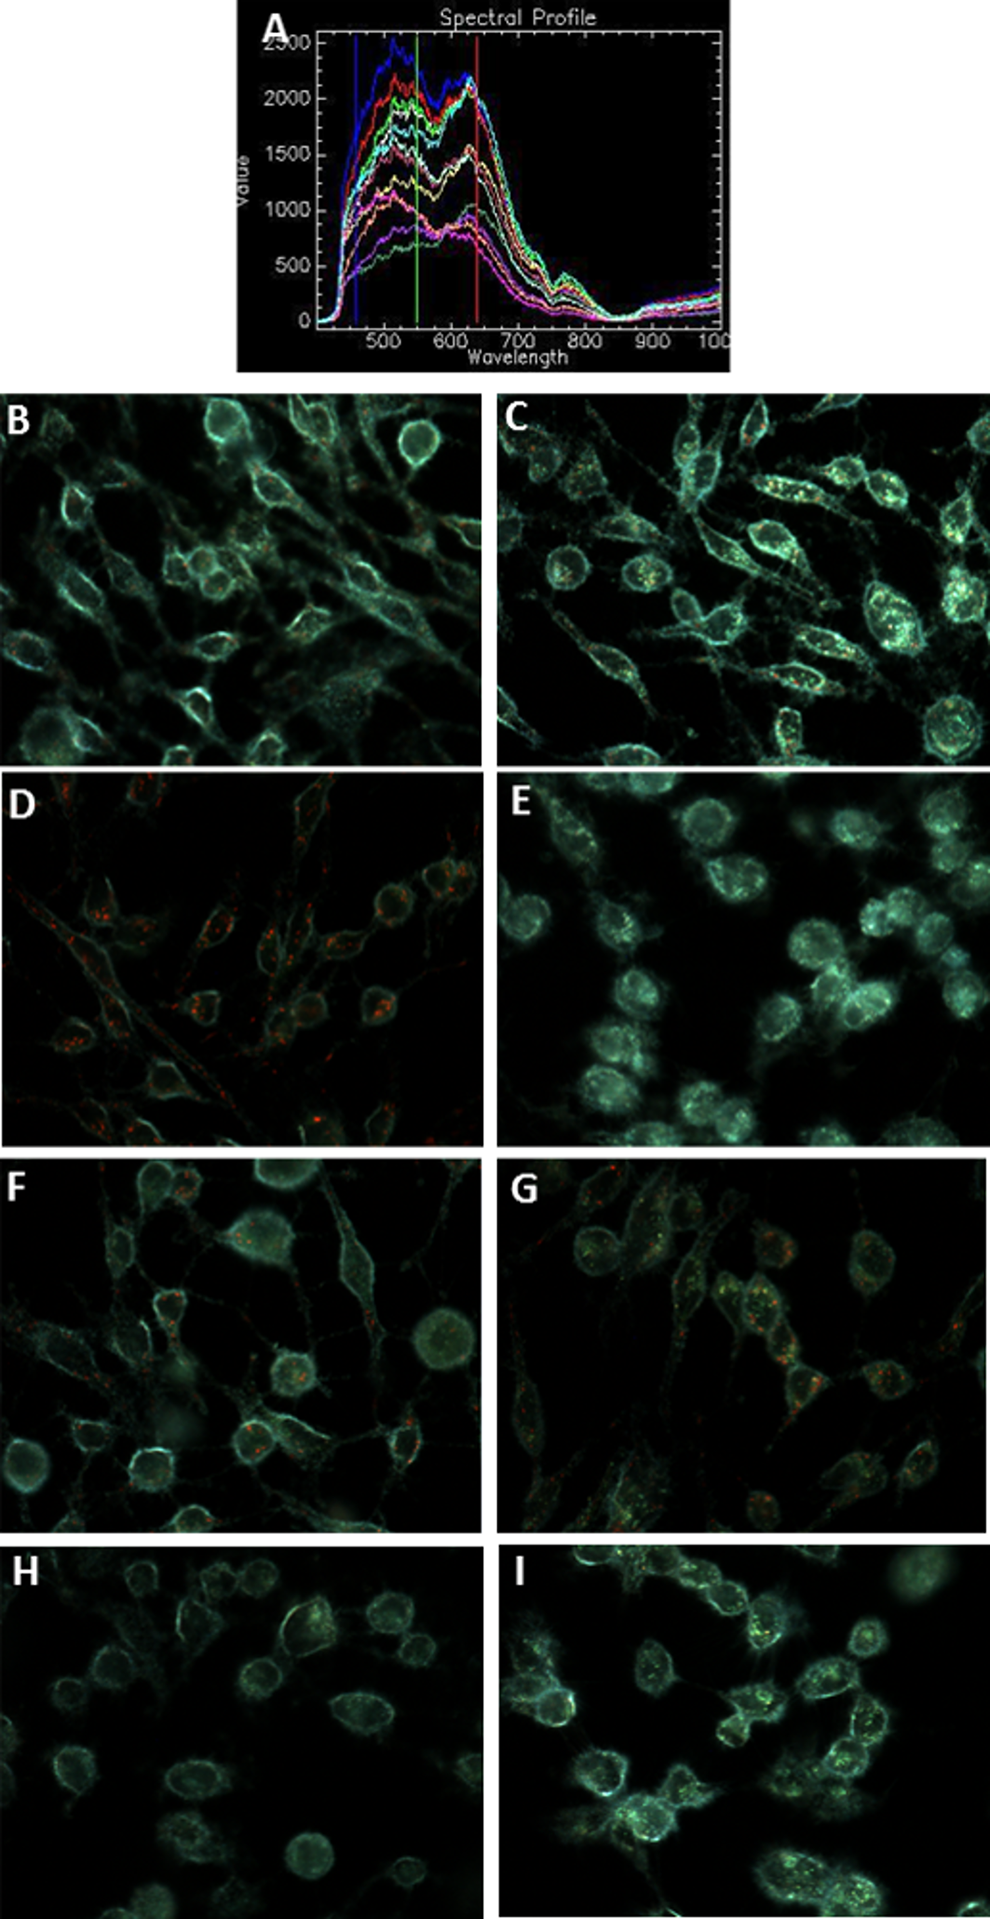
Reaction of AgNPs with JC-1 in the presence of BEAS-2B cells. A, The spectral profile of AgNPs collected following uptake in BEAS-2B cells. Dark-field images at ×60 magnification show BEAS-2B cells treated with AgNPs at 0.1 µg/cm2 (B) and 1 µg/cm2 (C) for 24 hours but not stained with JC-1; (D) untreated, healthy BEAS-2B cells stained with JC-1 dye; (E) apoptotic BEAS-2B cells with depolarized mitochondria stained with JC-1 dye (positive control); BEAS-2B cells exposed to 0.1 µg/cm2 AgNPs (F) and 1 µg/cm2 AgNPs (G) for 24 hours and stained with JC-1 dye; BEAS-2B cells treated with CCCP to depolarize mitochondria and then treated with 0.1 µg/cm2 AgNPs (H) and 1 µg/cm2 AgNPs (I) for 24 hours before being stained with JC-1 dye. AgNPs indicates silver nanoparticles; CCCP, carbonylcyanide m-chlorophenylhydrazone; JC-1, 5,5′,6,6′-tetrachloro-1,1′,3,3′-tetraethyl-benzamidazolocarbocyanin iodide.
When cells were depolarized with CCCP after NP treatment at both concentrations (Figure 17H and I), the expected green fluorescence was observed, indicating that AgNPs did not aggregate or quench the JC-1 dye, contradicting the results with the fluorescence plate reader in the absence of cells (Figure 15F).
Discussion
This study demonstrates the importance of assessing all the possible interference mechanisms that may be present in an HTS platform as this would provide guidance as to how to counteract interference or whether an alternative, more appropriate assay should be selected. Moreover, this study suggests that all interference assessments implemented in HTS platforms be reported to increase the reliability of results and confidence in the data generated.
The apparent increases in cell viability by AuNPs and AgNPs with the XTT assay are consistent with previous studies that assessed toxicity of NPs with tetrazolium-based colorimetric assays. 54-58 This observed increase in cell viability by AuNPs and AgNPs is a direct result of their ability to show a concentration-dependent increase in absorbance at 450 nm, the same wavelength as the chromophore. To overcome interference due to particle absorbance, previous studies have suggested that the absorbance values of particles in dispersion medium only be subtracted from absorbance values of NPs incubated with assay components in the presence of cells.39,59-62 However, as Monteiro-Riviere et al 17 pointed out, when more than one mechanism of interference is operational, one universal solution may not apply to eliminate interference. For example, “subtraction” may not entirely eliminate interference as this would only account for one interference mechanism, that is, absorption at the same wavelength as the chromophore and will not account for other possible interference mechanisms, that is, adsorption or catalytic activity of assay components, which was also observed with AuNPs and AgNPs, as discussed below.
Forest et al 49 have recently suggested using isotherm models such as the Langmuir model to quantify the assay reagents adsorbed to particle surfaces in the absence of cells in order to correct for adsorptive interference in cell-based studies. Even though the Langmuir model was successfully used in our study to quantify the amount of XTT substrate and formazan product adsorbed to AuNP surfaces, it could not be used to correct for the interference observed in the cell-based study as in our case, adsorption of two reagents, that is, the XTT substrate and product, was observed. Therefore, calculating the amount of substrate and product adsorbed to AuNP surfaces separately in the absence of cells is not representative of what is encountered in the cell-based studies where both substrate and product are present together in one solution. This method of correction can be successfully employed if adsorption of only one reagent is observed. However, similar to subtraction, this type of correction is complicated by more than one interference mechanism.
Gold NPs and AgNPs also showed the ability to adsorb the XTT components. To overcome this type of interference, some investigators have suggested removing particles from cells via washing prior to the addition of the assay substrate as this has proven to be effective for certain NPs such as titanium dioxide (TiO2) and zinc oxide (ZnO) when using the MTT assay.14,62,63 However, the success of removing particles via washing is exclusively dependent on the ability of particles to be adsorbed on cell surfaces and to be internalized within cells. 64 As a result, washing has proven to be unsuccessful for carbon black (CB) when using the MTT assay as CB is known to have a strong adsorptive ability. 14 Similarly, in this study it was also shown that several wash steps during the preparation of the slides for fluorescence microscopy (discussed later) could not remove AuNPs and AgNPs that were adsorbed or internalized (Figures 16 and 17). Researchers have also suggested adding the assay substrate to the particle-media suspension and then removing the particles via centrifugation before quantifying the product in the particle-free media. 61,65 Although this extra centrifugation step was successful for certain particles when using the MTS assay (eg anatase, etc), it did not eliminate interference of other particles (eg, ZnO), 66 which may be explained by the fact that the centrifugation step only occurs after the particles have already interacted (and possibly interfered) with the assay substrate and/or product. Even if particles are removed by centrifugation prior to the addition of assay substrate, interference may still be present since not all particles are ever completely removed and will remain in the supernatant after centrifugation. For example, Oh et al 67 showed that a significant number of uncoated and citrate-capped AgNPs (43-82 nm) still remained in the supernatant after centrifugation at 16,000 × g for 20 minutes. Oh et al 67 suggested that even though centrifugation may help in minimizing interference for certain assays, it may still pose a problem for other, more sensitive, assays. As such, the XTT, and therefore also the MTT and MTS, assays may be unreliable in evaluating the toxicity of particles due to the ineffectiveness of interference correction.
For the LDH assay, which is dependent on fluorescence, interference may depend on the particle type as interference was observed with AgNPs but not with AuNPs. In contrast to our results, Zhou et al 68 and Alejo et al 69 showed that AuNPs have the ability to catalyze the conversion of resazurin to resorufin, however, the conditions under which catalysis took place differed from our study in that they used hydroxylamine as the reducing agent and in certain instances, the sample was irradiated to induce the reduction of resazurin to resorufin. 69 For AgNPs, the increase in fluorescence when AgNPs were incubated with assay components and cofactor did not correspond with what was seen in the cell-based LDH study (ie, showing a decrease in fluorescence). This discrepancy could be due to the presence of additional cellular proteins that were not present with the cell-free interference study. In contrast, Ong et al 13 have shown that the degree of interference caused by NPs could be decreased in the presence of analytes released by cells, compared to the degree of interference in the presence of assay components alone. They attributed this decrease in interference to the myriad of proteins and macromolecules that may bind the NPs and prevent interactions with assay components. Whether a decrease or increase in interference is observed, these observations confirm that the subtraction method is yet again inappropriate as the interference in the absence of cells may differ from the interference in the presence of cells, which was also suggested by Bancos et al 70 and Labouta et al. 71 Not only may AgNPs interfere with the assay components of the LDH assay as shown in this study but it may also inactivate the LDH via adsorption or ROS generation, 67 indicating the inappropriateness of this assay with AgNPs. Using the same assay system as well as 2 additional assays also relying on the spectral change of resazurin to resorufin (CellTiter-Blue cell viability assay and Alamar Blue), Monteiro-Riviere et al 17 showed that different particle types (CB, single-wall carbon nanotubes, fullerenes, and quantum dots) could either interfere or not interfere with resazurin and/or resorufin. This confirms our observation that interference with the LDH assay may indeed depend on the type of particle tested. In this study, the presence of interference with AgNPs but lack thereof with AuNPs when using the LDH assay may also be attributed to the possible presence of released ions in the AgNP suspension during dissolution. Determining the degree of dissolution and the degree of interference by AgNPs versus silver ions was beyond the scope of this study. Indeed, Bregoli et al 62 discussed the effect of released ions on the degree of interference of NPs, while Oh et al, 67 on the other hand, suggested that silver ions originating from AgNPs are not related to interference with the LDH assay.
With the ATP assay, we could show a decrease in viability in BEAS-2B with increasing concentrations of AuNPs, confirming the results observed with AuNP-treated K562 cells using the same ATP toxicity assay system. 72 As an adsorptive activity could be observed by the AuNPs, with no interference in the luminescence of the oxyluciferin, the decrease in viability observed with the ATP assay system in the levels of the oxyluciferin could be due to the strong adsorptive property of AuNPs toward the luciferin substrate. A similar decrease in viability was noted with AgNPs, which was shown to be due to adsorption of the product in the presence of cofactor rather than the substrate as seen with AuNPs. Although a correlation was observed between the ATP assay and the xCELLigence RTCA with AgNPs, cell-free interference studies showed that the decrease with the ATP assay was due to interference and is not the actual representation of AgNP toxicity. Therefore, even if an optically based assay produces the results expected, one can never be certain if interference was a factor in producing the results observed, further stressing the importance of validating assays in cell-free systems before cell-based toxicity tests are attempted. Similar to the XTT and LDH assays, the direct interference of particles with ATP assay components may not be easily controlled by mere subtraction of the control values in the absence of cells from those in the presence of cells nor by removing particles via washing or centrifugation.
Finally, in our hands, when AuNPs and AgNPs were incubated with the popular fluorescent dyes DCF, PI, and JC-1, fluorescence quenching could be observed, most notably with AuNPs, which is probably a result of resonant energy transfer between the dye and the NPs. Bregoli et al 62 also attributed the quenching of fluorescent dyes by metal NPs to the fact that when the excitation wavelength of the fluorochrome overlaps with the absorption spectrum of the NP, then the resulting emission spectrum decreases in the presence of NPs. They were able to confirm this experimentally with AgNPs exerting a quenching effect on the fluorophore of the Caspase 3/7 assay. This could explain the quenching observed with AuNPs and AgNPs in this study as their respective absorption spectra overlap with the excitation wavelengths of the fluorescent dyes at 480 (DCF), 485 (PI), and 488 nm (JC-1). Quenching of fluorescence by AuNPs and AgNPs has previously been reported with other fluorescent dyes, that is, lissamine dye 1 , 1,4-dihydroxy-3-methylanthracene-9,10-dione dye, 73 as well as acridine and coumarin dyes. 74 Other studies, however, reported the enhancement of the fluorescence of the DCF substrate by 4.5 nm AuNPs, which was also assumed to be the result of resonant energy transfer between H2DCF-DA and the AuNPs. 75 The difference leading to fluorescence quenching and enhancement of the substrate and DCF product, respectively, via the same mechanism, that is, resonant energy transfer, is likely dependent on the molecular chemistry between the substrate and the DCF product. Similar interference in the fluorescence intensity of DCF could also be reported for other particles including TiO2, CB, cerium oxide, boehmite, Ti-Zr-mixed oxide, Ti-Al-Zr mixed oxide, ZrO2, ZnO, barium sulfate and strontium carbonate, 14 as well as Fe2O3 and iron (II, III) oxide. 24
The strong adsorptive properties of AuNPs, as observed with the XTT and ATP assays in this study, may be the reason leading to resonant energy transfer and subsequently fluorescence quenching of DCF, PI, and JC-1 as resonant energy transfer is dependent, among other factors, on the distance between the dye molecule and the NP. 1 The strong adsorptive properties of AuNPs have also been implicated in another type of interference with PI, as observed by Keene et al 76 and Shukla et al, 77 who showed that AuNPs allow the formation of a weak covalent bond with primary amines in the PI, thereby allowing the PI to translocate with the AuNPs through the membranes of healthy cells, which would otherwise be impossible in the absence of AuNPs as PI is membrane impermeable and can only enter dead/damaged cells.
The same adsorptive ability of AuNPs was also likely responsible for the quenching observed with the JC-1 dye in the absence of cells. Indeed, when the interference study was repeated in the presence of cells, aggregation was apparent at the lowest concentration of AuNPs (5 µg/cm2), which eventually lead to quenching when the concentration was increased to 10 µg/cm2. For AgNPs, fluorescence quenching was seen in the absence of cells but not in the presence of cells. This may be explained by the possible presence of silver ions, of which the concentrations may be different within cells compared to the concentration of silver ions in the interference study in the absence of cells. Of course, this suggestion will need to be proven experimentally.
The interferences reported in this study with DCF, PI, and JC-1 are of great relevance as these dyes are regularly used in HTS platforms.34-37,78 It is therefore imperative that implementation of the interference assessment of these dyes with NPs (particularly with strong SPR) be mandatory in HTS screening systems.
Once again, interference of AuNPs and AgNPs with DCF, PI, and JC-1 may not be easily eliminated by removing NPs as the assay reaction in each case occurs intracellularly. Therefore, internalized NPs are still in contact with the dye thereby allowing interference to occur. Even if cells are lysed instead, as in the case for DCF, interference is still possible and may even be enhanced as both internalized NPs and NPs previously adsorbed to the cell surface are now in contact with the dye. As an alternative, Kroll et al 14 suggested limiting the NPs to concentrations that do not show interference as interference is generally concentration dependent. Interference of AuNPs and AgNPs with DCF, PI, and JC-1 is indeed concentration dependent; however, the lowest concentration used, particularly for AuNPs (5 µg/cm2), could still produce measurable interference. Simeonov and Davis 79 have suggested other possible alternatives for minimizing or eliminating fluorescence (and in some cases absorbance) interference particularly in HTS systems. For example, (1) using a fluorophore that excites and emits at wavelengths that are different from the excitation and emission wavelengths of the particle 79 ; (2) using a much higher concentration of the fluorophore than that of the particle, which would most likely render the interference of the particle negligible 79 ; (3) rather than using end point mode, a kinetic mode could be used as the interference of the particle will not change over time and will become negligible as the intensity of the fluorophore increases. 79 These kinetic assays have an added advantage, as the half-life of the fluorescence emitted by the particle could be shorter than the fluorescence emitted by the fluorophore. Therefore, a detection time point at which the fluorescence of the particle has already dissipated may be selected. Other viability assays such as the growth-based bacterial viability assay 80 may be another interference-free alternative; however, this technique solely relies on bacteria as the exposure organism and is perhaps not suitable to all applications.
Unlike the optically based assays, the xCELLigence assay did not show any interference with AuNPs or AgNPs. Although not shown here, we have also observed a lack of interference in several other types of particles, which included 14 and 20 nm citrate-stabilized AuNPs, 38 functionalized AuNPs, 81 ferromanganese particles, 82 and several metal-containing airborne particulates (unpublished results). The lack of interference with the xCELLigence RTCA is supported by the results of Otero-Gonzalez et al, 83 where they also showed a lack in altered impedance in the absence of cells at the highest concentrations of NPs used, which included Ag0, Al2O3, cerium oxide, iron, Fe2O3, hafnium oxide, manganese oxide, silicon dioxide, TiO2, ZnO, and zirconium dioxide (ZrO2). Similarly, using impedance-based technologies, Huang et al, 84 Tarantola et al, 85 Mariani et al, 86 and Seiffert et al, 87 confirmed a lack of interference of this technology when testing, among others, the toxicity of quartz, urban dust, diesel exhaust, TiO2, cupric oxide, and ZnO NPs. Although Meindl et al 88 suggested that interference of the CI index may be possible with CNTs precipitating on the electrodes on the surface of the E-plate wells, this was not confirmed experimentally. The xCELLigence RTCA therefore showed the true toxicity of the AuNPs and AgNPs in our study. The xCELLigence RTCA and LDH assay results correlated well with each other when the toxicity of AuNPs in BEAS-2B cells was assessed, showing a lack of toxicity before 24 hours of treatment and is attributed to the lack of interference in both assays.
Collins et al 29 have also suggested using label-free impedance-based assays, which could be scaled up in HTS platforms in the form of chip-based systems. Recently, Tan et al 89 showed the successful application of a high-throughput label-free impedance-based system to monitor the cytotoxicity of superparamagnetic iron oxide NPs.
Conclusion
In summary, this study demonstrates the different types of NP interference mechanisms with conventional toxicity assay systems as well as with fluorescent dyes often used in HTS platforms. These results confirm the importance of assessing all types of interference mechanisms present and that mere subtraction of the control values in the absence of cells from those in the presence of cells or by removing particles via washing or centrifugation will not be sufficient to control for all types of interference mechanisms. These observations further confirm that results produced from HTS studies implementing these assay systems may have certainly produced unreliable erroneous results and therefore casting doubt on their reliability and use as big data for predictive toxicology.
It is therefore critical that interference assessment in the assay systems used form the basis of all future HTS platforms and that their reporting becomes mandatory. However, it seems to be inevitable that certain NPs, particularly those with strong SPR, would have to be excluded from these HTS systems. This consideration will undoubtedly reduce erroneous data from being generated, which would only hamper the development of proper in silico predictive toxicology models.
Supplemental Material
Supplemental_Material - Interference: A Much-Neglected Aspect in High-Throughput Screening of Nanoparticles
Supplemental_Material for Interference: A Much-Neglected Aspect in High-Throughput Screening of Nanoparticles by Charlene Andraos, Il Je Yu and Mary Gulumian in International Journal of Toxicology
Footnotes
Acknowledgments
We thank Dr Wells Utembe for assistance with the Langmuir equation and Dr Melissa Vetten for proofreading previous versions of the manuscript. We also thank Mr Kailen Boodhia and Mrs Leigh-Anne Boodhia for assisting with preliminary experimental work.
Author Contribution
Andraos, C contributed to conception and design; contributed to acquisition, analysis, and interpretation; drafted the manuscript; and critically revised the manuscript. Yu, I. J contributed to conception and design, contributed to interpretation, and critically revised the manuscript. Gulumian, M contributed to conception and design, contributed to analysis and interpretation, and critically revised the manuscript. All authors gave final approval and agree to be accountable for all aspects of work ensuring integrity and accuracy.
Declaration of Conflicting Interests
The author(s) declared no potential conflicts of interest with respect to the research, authorship, and/or publication of this article.
Funding
The author(s) disclosed receipt of the following financial support for the research, authorship, and/or publication of this article: We thank the South African Department of Science and Technology (DST) for providing funding for this study.
Supplemental Material
Supplemental material for this article is available online.
References
Supplementary Material
Please find the following supplemental material available below.
For Open Access articles published under a Creative Commons License, all supplemental material carries the same license as the article it is associated with.
For non-Open Access articles published, all supplemental material carries a non-exclusive license, and permission requests for re-use of supplemental material or any part of supplemental material shall be sent directly to the copyright owner as specified in the copyright notice associated with the article.