
Abstract
Polycyclic aromatic hydrocarbons (PAHs) refer to a ubiquitous group of anthropogenic air pollutants that are generated through incomplete carbon combustion. Although the immunotoxic nature of PAHs has been previously reported, the underlying molecular mechanisms of this effect are not fully understood. In the present study, we investigated the mitochondrial-mediated epigenetic regulation of 2 PAHs, carcinogenic (benzo[a]pyrene; BaP) and noncarcinogenic (anthracene [ANT]), in peripheral lymphocytes. While ANT exposure triggered mitochondrial oxidative damage, no appreciable epigenetic modifications were observed. On the other hand, exposure to BaP perturbed the mitochondrial redox machinery and initiated cascade of epigenetic modifications. Cells exposed to BaP showed prominent changes in the expression of mitochondrial microRNAs (miR-24, miR-34a, miR-150, and miR-155) and their respective gene targets (NF-κβ, MYC, and p53). The exposure of BaP also caused significant alterations in the expression of epigenetic modifiers (DNMT1, HDAC1, HDAC7, KDM3a, EZH2, and P300) and hypomethylation within nuclear and mitochondrial DNA. This further induced methylation of histone tails, which play a crucial role in the regulation of chromatin structure. Overall, our study provides novel mechanistic insights into the mitochondrial regulation of epigenetic modifications in association with PAH-induced immunotoxicity.
Keywords
Introduction
Air pollution has been reported as a primary contributor to the increasing global burden of diseases and a leading cause of death. According to the state of global air report (2019), air pollution resulted in 147 million years of healthy life lost and almost 4.9 million deaths in the year 2017. 1 Studies have also documented that such exposures may cause alterations within the genome and are associated with the increased risk of noncommunicable diseases including cancer. 2 -4 Polycyclic aromatic hydrocarbons (PAHs), the major component of vehicle emissions, industrial activities, and combustion of coal, are characterized as ubiquitous, toxic, and typical anthropogenic air pollutants which consist of 2 or more aromatic rings. These pollutants often exist as mixtures of compounds rather than occurring individually in the ambient air. Regardless of the chemical similarities among the class, the toxicological outcome of individual PAHs varies considerably. Benzo[a]pyrene (BaP) is classified as a group 1 carcinogen by the International Agency for Research on Cancer, whereas anthracene (ANT) in its native form is noncarcinogenic. 5 Importantly, these compounds are known to affect vital immune functions through alterations in the mitogenic signaling pathways. Activation of mitogen-activated protein kinases cascade may not only lead to death of lymphoid cells but also suppresses essential immune responses. 6 Although the specific molecular mechanisms underlying such immune modulation are not known, studies suggest that the cytochrome-P450-derived metabolites of PAH activate different oxidative and electrophilic signaling pathways in lymphoid and nonlymphoid cells. Mitochondria being the primary site of energy production are a major target of environmental pollutants. 2,7,8 The mitochondrial reactive oxygen species (ROS) and electrophilic metabolites are 2 critical regulators of mitochondrial-nuclear cross-talk, which directly influence cellular functionality and regulate epigenetic mechanisms that predominately involve DNA methylation, microRNAs (miRNAs) expressions, and post-translational histone modifications. 9 -11 These mechanisms act as sensitive readouts of the impacts induced by acute and chronic exposure to such chemicals. Increasing scientific investigations have also shown that epigenetic modifications play a vital role in the initiation and progression of different adverse health outcomes of environmental exposures. 12,13 Interestingly, cell-free epigenetic signatures including methylated nuclear DNA (nDNA) and mitochondrial DNA (mtDNA), post-translational modified histones and miRNA released into the circulation are considered as fingerprints of such ongoing cellular changes. However, concentration and molecular characteristics of these circulating biomolecules significantly differ with reference to physicochemical nature of the pollutant, quantum, and period of exposure. Therefore, deeper mechanistic understanding of epigenetic modifications may prove vital to establish minimal-invasive biomarkers for human health risk assessment of PAHs, a major contributor of air pollution. 14,15 We investigated the mitochondrial-mediated epigenetic regulation of 2 PAHs, carcinogenic (BaP) and noncarcinogenic (ANT), in peripheral lymphocytes. Mature lymphocytes that circulate in the blood were selected for this study as they can be obtained in a noninvasive fashion and have shown to reflect some of the epigenetic modifications induced by PAHs. 16,17
Materials and Methods
Reagents
Cells were treated with ANT (99%, CAS: 120-12-7) and Bap (97%, CAS: 50-32-8) procured from Alfa Aesar. For the preparation of the stock solution, chemicals were dissolved in the dimethyl sulfoxide (DMSO) from Sigma-Aldrich. The lymphocytes were isolated using HiSep solution and cultured with HiKaryoXL RPMI media from HiMedia Laboratories. For assessment of oxidative stress, CellROX Deep Red Flow Cytometry assay kit from Thermo Fischer Scientific and nuclear factor erythroid 2 related factor 2 (Nrf2) sandwich enzyme-linked immunosorbent assay (ELISA) kit from BIOCODON Technologies were used. Mitochondrial membrane potential was examined by using MitoProbe DilC1 (5) assay kit from Thermo Fischer Scientific. Multicolor flow cytometric assay kits from BD Biosciences were used for evaluating apoptosis, DNA damage, cell proliferation, and activation of Caspase 3. The profiling of mitochondrial miRNAs (mitomiRs) was performed using miRNeasy Mini kit from QIAGEN and poly-A tailing kit obtained from Thermo Fischer Scientific. For relative gene expression analysis by quantitative real-time polymerase chain reaction (PCR), complementary DNA (cDNA), and GoTaq Q PCR Master Mix synthesis kits from Promega; KAPA SYBR FAST One-Step qRT-PCR kit from Merck KGaA; and Luna Universal Q Master Mix from New England Biolabs were used. The levels of DNA methylation were evaluated by using MethylFlash Global DNA Methylation ELISA Easy kit from Epigentek Group Inc and EpiJET Bisulfite Conversion kit from Thermo Fischer Scientific. The bovine serum albumin (BSA) used for preparation of the blocking buffer was purchased from HiMedia Laboratories. For assessment of histone modifications, Histone H3/H4 Modification Multiplex assay kits from Epigentek Group Inc and antibodies from Cell Signaling Technology were procured.
Study Design
The study was performed by using 2 PAHs, that is, BaP and ANT. For experiments, both chemicals were weighed and dissolved in the appropriate amount of DMSO to prepare 100 μM concentration stock solutions of both BaP and ANT. Further, this stock solution was diluted to identify an optimum dose for treatment so that the final concentration of DMSO in media is ≤0.1%. Based on earlier reports and our dose-dependent response analysis, we selected 10 µM as an optimum dose to carry out downstream experiments. 18 Isolation of lymphocytes from whole blood was done by using HiSep, and the viability of the isolated cells was measured by using trypan blue exclusion dye. Then, 1 × 10⁶ viable cells were cultured with HiKaryoXL RPMI media in 5% CO2 atmosphere at 37 °C for 24 hours. 19 The cells were exposed to PAHs for 0 hours, 30 minutes, 1, 3, 6, 12, 24, 48, and 72 hours to assess different parameters, while DMSO (0.1%) treated cells were used as controls.
Measurement of Oxidative Stress
The generation of ROS was evaluated by using CellROX Deep Red Flow Cytometry assay kit. The CellROX Deep Red is a cell-permeable reagent that remains nonfluorescent in the reduced state, but upon oxidation shows a strong fluorogenic signal indicating the levels of ROS in cells. The assay was performed by following all the necessary instructions from the supplier. In brief, cells were harvested and incubated with the CellROX Deep Red reagent at a final concentration of 500 nM for 1 hour at 37 °C in dark. The cells were then analyzed through flow cytometry. 8 For the examination of Nrf2 levels, a sandwich ELISA kit was used and the absorbance were recorded at 450 nm. 20 Briefly, the samples were premixed with the streptavidin-horseradish peroxidase (HRP)-labeled anti-Nrf2 antibody (provided in the kit) and added to the wells. After 1 hour incubation in dark, the wells were carefully washed to remove the unbounded samples and antibodies. Next, the substrate was added and the absorbance was measured at 450 nm using Spark multimode microplate reader (TECAN).
Evaluation of MtDNA and Membrane Integrity
The assessment of mitochondrial integrity was performed by evaluating the mtDNA copy number and membrane depolarization. Relative quantification of mtDNA copy number was performed through quantitative real-time PCR (Insta Q96) using 2 primer sets for amplification of mitochondrial NADH dehydrogenase ortholog 1 and nuclear gene human β-actin. The values were measured as the mtDNA to nDNA ratio for a given sample. 21 Mitochondrial membrane potential was examined through MitoProbe DilC1 (5) assay kit using flow cytometry (Attune NxT). 2 1, 1′, 3, 3, 3′, 3′-Hexamethylindodicarbocyanine iodide, DilC1 (5), is a cyanin dye which primarily accumulates within intact mitochondria. The intensity of the dye reduces following disruption of the membrane potential. For labeling, cells were suspended in prewarm phosphate buffered saline (PBS) and stained with 5 µL of DilC1 (final concentration 50 nM) for 30 minutes. The cells were then washed, resuspended in 500 µL PBS, and analyzed through flow cytometry (Attune NxT, Thermo Fischer Scientific).
DNA Damage and Apoptosis
DNA damage response was examined by monitoring the levels of γH2AX using a multicolor flow cytometric tri test kit from BD Biosciences. In brief, cells were harvested and fixed for 30 minutes with 100 µL BD Cytofix/Cytoperm solution supplied within the kit. After which the cells were washed and incubated with the 100 µL BD Cytofix/Cytoperm Plus permeabilization buffer (provided in the kit) for 10 minutes on ice. Subsequently, the cells were washed and incubated with 5 µL of γH2AX specific antibody (provided in the kit) for 30 minutes. The mean fluorescence intensity of the cells was then analyzed through flow cytometry (Attune NxT). 22 For assessment of mitochondria-mediated apoptosis, caspase-3 activity was measured in cells using the caspase-3 apoptosis kit. Briefly, the cells were washed and fixed for 20 minutes on ice. After fixation, the cells were washed with PBS and stained with phycoerythrin conjugated caspase-3 antibodies (supplied in the kit) for 30 minutes. The analysis of caspase-3 positive cells was performed by flow cytometry (Attune NxT). 21
Profiling of mitomiRs Expression
To isolate mitomiRs, miRNeasy Mini Kit was used. Briefly, the cells were lysed and mixed with chloroform to perform phase separation. After which 1.5 volume of ethanol (absolute) was added to the separated aqueous phase and the blend was allowed to bind onto the RNeasy mini-column supplied within the kit. The columns were then subsequently washed and the elution of the bound miRNAs was done in fresh tubes by adding elution buffer. For downstream processing of the isolated mitomiRs, poly-A tailing was performed by using a reaction mixture comprising 5× EPAP buffer, MnCl2, ATP solution, nuclease-free water, EPAP enzyme (provided in the kit), and mitomiRs. The reaction mixture was then incubated for 1 hour at 37 °C followed by the cDNA synthesis of the poly-A tailed miRNA through reverse transcription. The operating program was set at temperature cycle of 37 °C for 60 minutes, 42 °C for 60 minutes, 70 °C for 15 minutes, and 4 °C for 10 minutes. The prepared cDNA was then amplified using GoTaq Q PCR Master Mix and specific primers and the observed Ct values were analyzed for the determination of fold change. 23,24
Expression of MitomiR Target Genes
The assessment of target genes p53, MYC, and nuclear factor κβ (NF-κβ) was done in RNA isolated using the miRNeasy Mini kit as discussed elsewhere. Initially, the isolated RNA was subjected to cDNA synthesis using 1 µL random primers, 1 µL DNT mixture, RNA, and nuclease-free water to make up the volume up to 10 µL. The mixture was then incubated at 65 °C for 5 minutes. Later, 4 µL of 5X primscript buffer, 0.5 µL RNA inhibitor, 1 µL reverse transcriptase, and 4.5 µL nuclease-free water provided in the kit were added and subjected to a cycle of 37 °C for 60 minutes, 42 °C for 60 minutes, and 70 °C for 15 minutes in a Thermal cycler (GeneAmp PCR System 9700, Applied Biosystems) to synthesize cDNA. The 4 µL of synthesized cDNA was then mixed with 10 µL of Luna universal Q master mix, forward and reverse primers (1 µL each) and 4 µL of nuclease-free water. This was then subjected to 95 °C for 45 seconds followed by 35 cycles of 95 °C for 30 seconds, 53 °C for 30 seconds, and 68 °C for 15 seconds, and 1 cycle of 68 °C for 5 minutes. 25
Assessment of Epigenetic Modifiers
To examine the expression of different epigenetic modifiers, that is, histone demethylase (KDM3a), histone deactylases 1 (HDAC1), histone deactylases 7 (HDAC7), histone acetyltransferase (P300), and histone methyltransferase (EZH2), RNA was isolated using miRNeasy Mini kit as described elsewhere. Complementary DNA synthesis was performed as per the protocol discussed earlier. The steps of PCR cycle included 95 °C for 45 seconds; 35 cycles of 95 °C for 30 seconds; 53 °C for 30 seconds; 68 °C for 15 seconds; and 68 °C for 5 minutes. The quantification of DNA methyltransferase (DNMT1) was done using KAPA SYBR FAST One-Step qRT-PCR kit by real-time PCR (Insta Q96, HiMedia Laboratories). 11
DNA Methylation Levels
The quantification of 5-methylcytosine (5-mC) was performed using MethylFlash Global DNA Methylation (5-mC) ELISA Easy kit. In brief, 5-mC coating buffer comprising 100 ng DNA sample was used for the coating of wells. After the appropriate coating and blocking, specific antibodies were added to the wells followed by the addition of HRP (provided in the kit). The readings were then recorded at 450 nm by using Spark multimode microplate reader (TECAN). 21 To examine global DNA methylation levels, LINE-1 methylation-specific PCR was performed as described previously. Briefly, 500 ng DNA sample was subjected to bisulfite conversion of cytosine to uracil using the EpiJET Bisulfite Conversion kit. 2 After thoroughly mixing the samples with the modification reagent, amplification was carried out at 98 °C for 10 minutes, followed by incubation at 60 °C for 150 minutes. Later, the amplified product was washed, desulphonated, and eluted in a step-wise manner. Subsequent amplification procedure was done using specific primer sets for methylated and unmethylated LINE-1 promoter region. The methylation levels of D1, D2, 12S, CYTB, and 16S region of mtDNA were also evaluated using a similar protocol. 2
Assessment of Histone Modifications
The histone H3/H4 modification multiplex assay kits were used for quantification of the levels of histone modifications. Simultaneous measurement of 21 different histone H3 modifications and 10 histone H4 modifications were carried out through ELISA. The assay was done in triplicates for each sample, and absorbance was recorded at 450 and 630 nm on a Spark multimode microplate reader (TECAN) 2 for histone H3 and H4, respectively. Western blot analysis of H3 modifications was performed as per standard protocol as discussed elsewhere. 26 Initially, proteins were separated through sodium dodecyl sulfate-polyacrylamide gel electrophoresis and transferred on a 0.2 µm pore-size nitrocellulose membrane (Bio-Rad). The membrane was then incubated with blocking buffer comprising 5% BSA in 1× PBS for 1 hour, washed, and incubated overnight with primary antibody at 4 °C. The HRP-labeled secondary antibody treatment was given for 2 hours. Subsequently, 3,3′,5,5′-tetramethylbenzidine substrate was used for blot development.
Results
Mitochondrial Stress and Membrane Integrity
Our results suggested that PAH exposure to cells induces significant generation of ROS. In comparison to the controls, the observed increase in mean fluorescence intensity (suggesting ROS generation) of the exposed cells was almost 3-fold higher. The maximum levels of ROS were observed in the cells exposed to BaP at 6 hours, while in ANT exposed cells, the generated ROS levels were highest at 3 hours (43.12% ± 4.98%), suggesting the early onset of ROS in ANT exposed cells. The values after 6 hours of BaP and ANT exposure were 41.25% ± 3.91% and 32.12% ± 4.15%, whereas the control values were 10.29% ± 1.86% (Figure 1A and Supplemental Figure 1A). Further, our results also indicated that PAH exposure causes significant disturbances in the mitochondrial integrity. The results of DilC1 MitoProbe labeling showed that exposure to PAH causes mitochondrial membrane depolarization with maximum levels at 6 hours of the exposure. As compared with controls (4.13% ± 1.02%), the percentage of mean fluorescence intensity observed among ANT and BaP at 6 hours was 39.89% ± 3.91% and 23.32% ± 2.69%, respectively (Figure 1B and Supplemental Figure 1B). However, results of mtDNA copy number analysis did not show any significant alterations in cells exposed to PAHs. In comparison to controls (0.60 ± 0.023), the levels of mtDNA copy number were 0.54 ± 0.038 in ANT and 0.62 ± 0.046 in BaP following 6 hour treatment (Supplemental Figure 2).
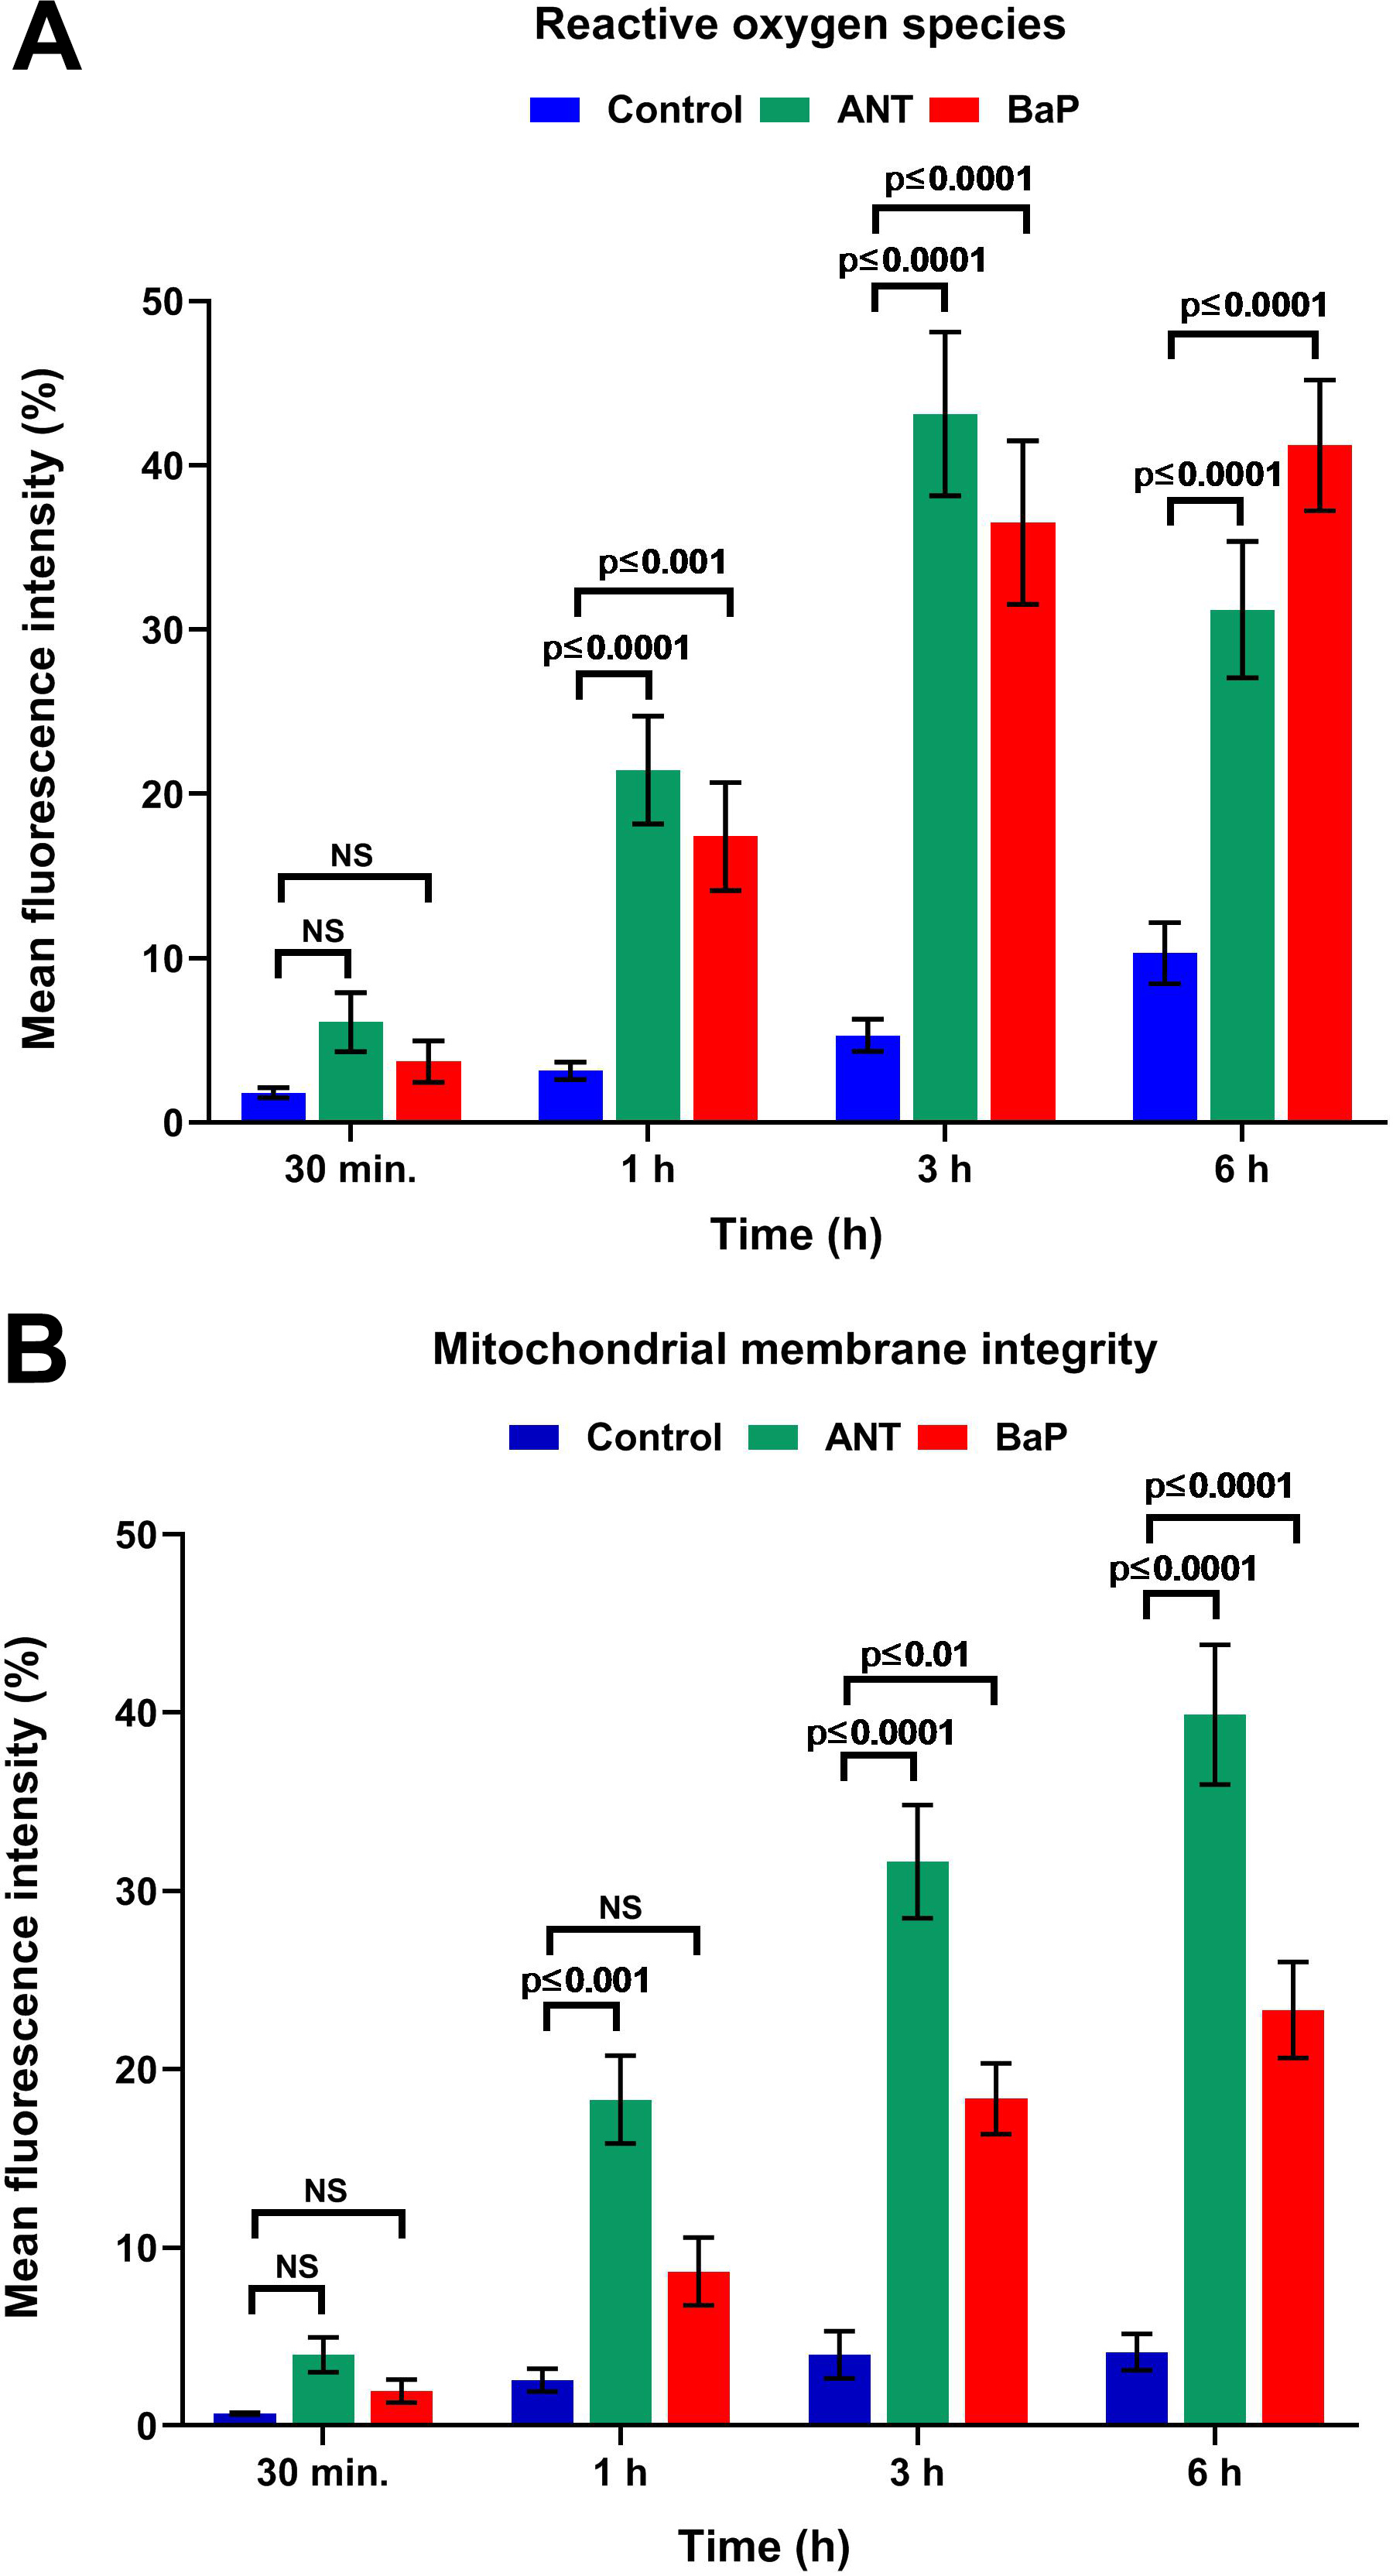
Mitochondrial oxidative stress and membrane depolarization. A, Graph showing the generation of reactive oxygen species in controls and cells exposed to ANT and BaP for 30 minutes, 1, 3, and 6 hours. Data are expressed as mean ± SE (n = 3), and P ≤ 0.05 was considered significant. B, Graph showing the loss of mitochondrial membrane potential upon exposure to ANT and BaP for 30 minutes, 1, 3, and 6 hours. Data are represented as mean ± SE values, and P ≤ 0.05 was considered statistically significant (n = 3). ANT indicates anthracene; BaP, benzo[a]pyrene; SE, standard error.
Levels of Nrf2
Quantification of the levels of Nrf2, an important regulator of oxidative stress which gets activated in response to pro-oxidants, was evaluated through ELISA. The levels of Nrf2 were significantly higher in both BaP- and ANT-exposed cells as compared to their respective controls. The recorded Nrf2 levels for cells exposed to BaP at 24 hours was 18.49 ± 2.14 pg/mL; while for ANT and controls, the levels were 28.39 ± 1.28 pg/mL and 2.9 ± 0.04 pg/mL, respectively (Figure 2).
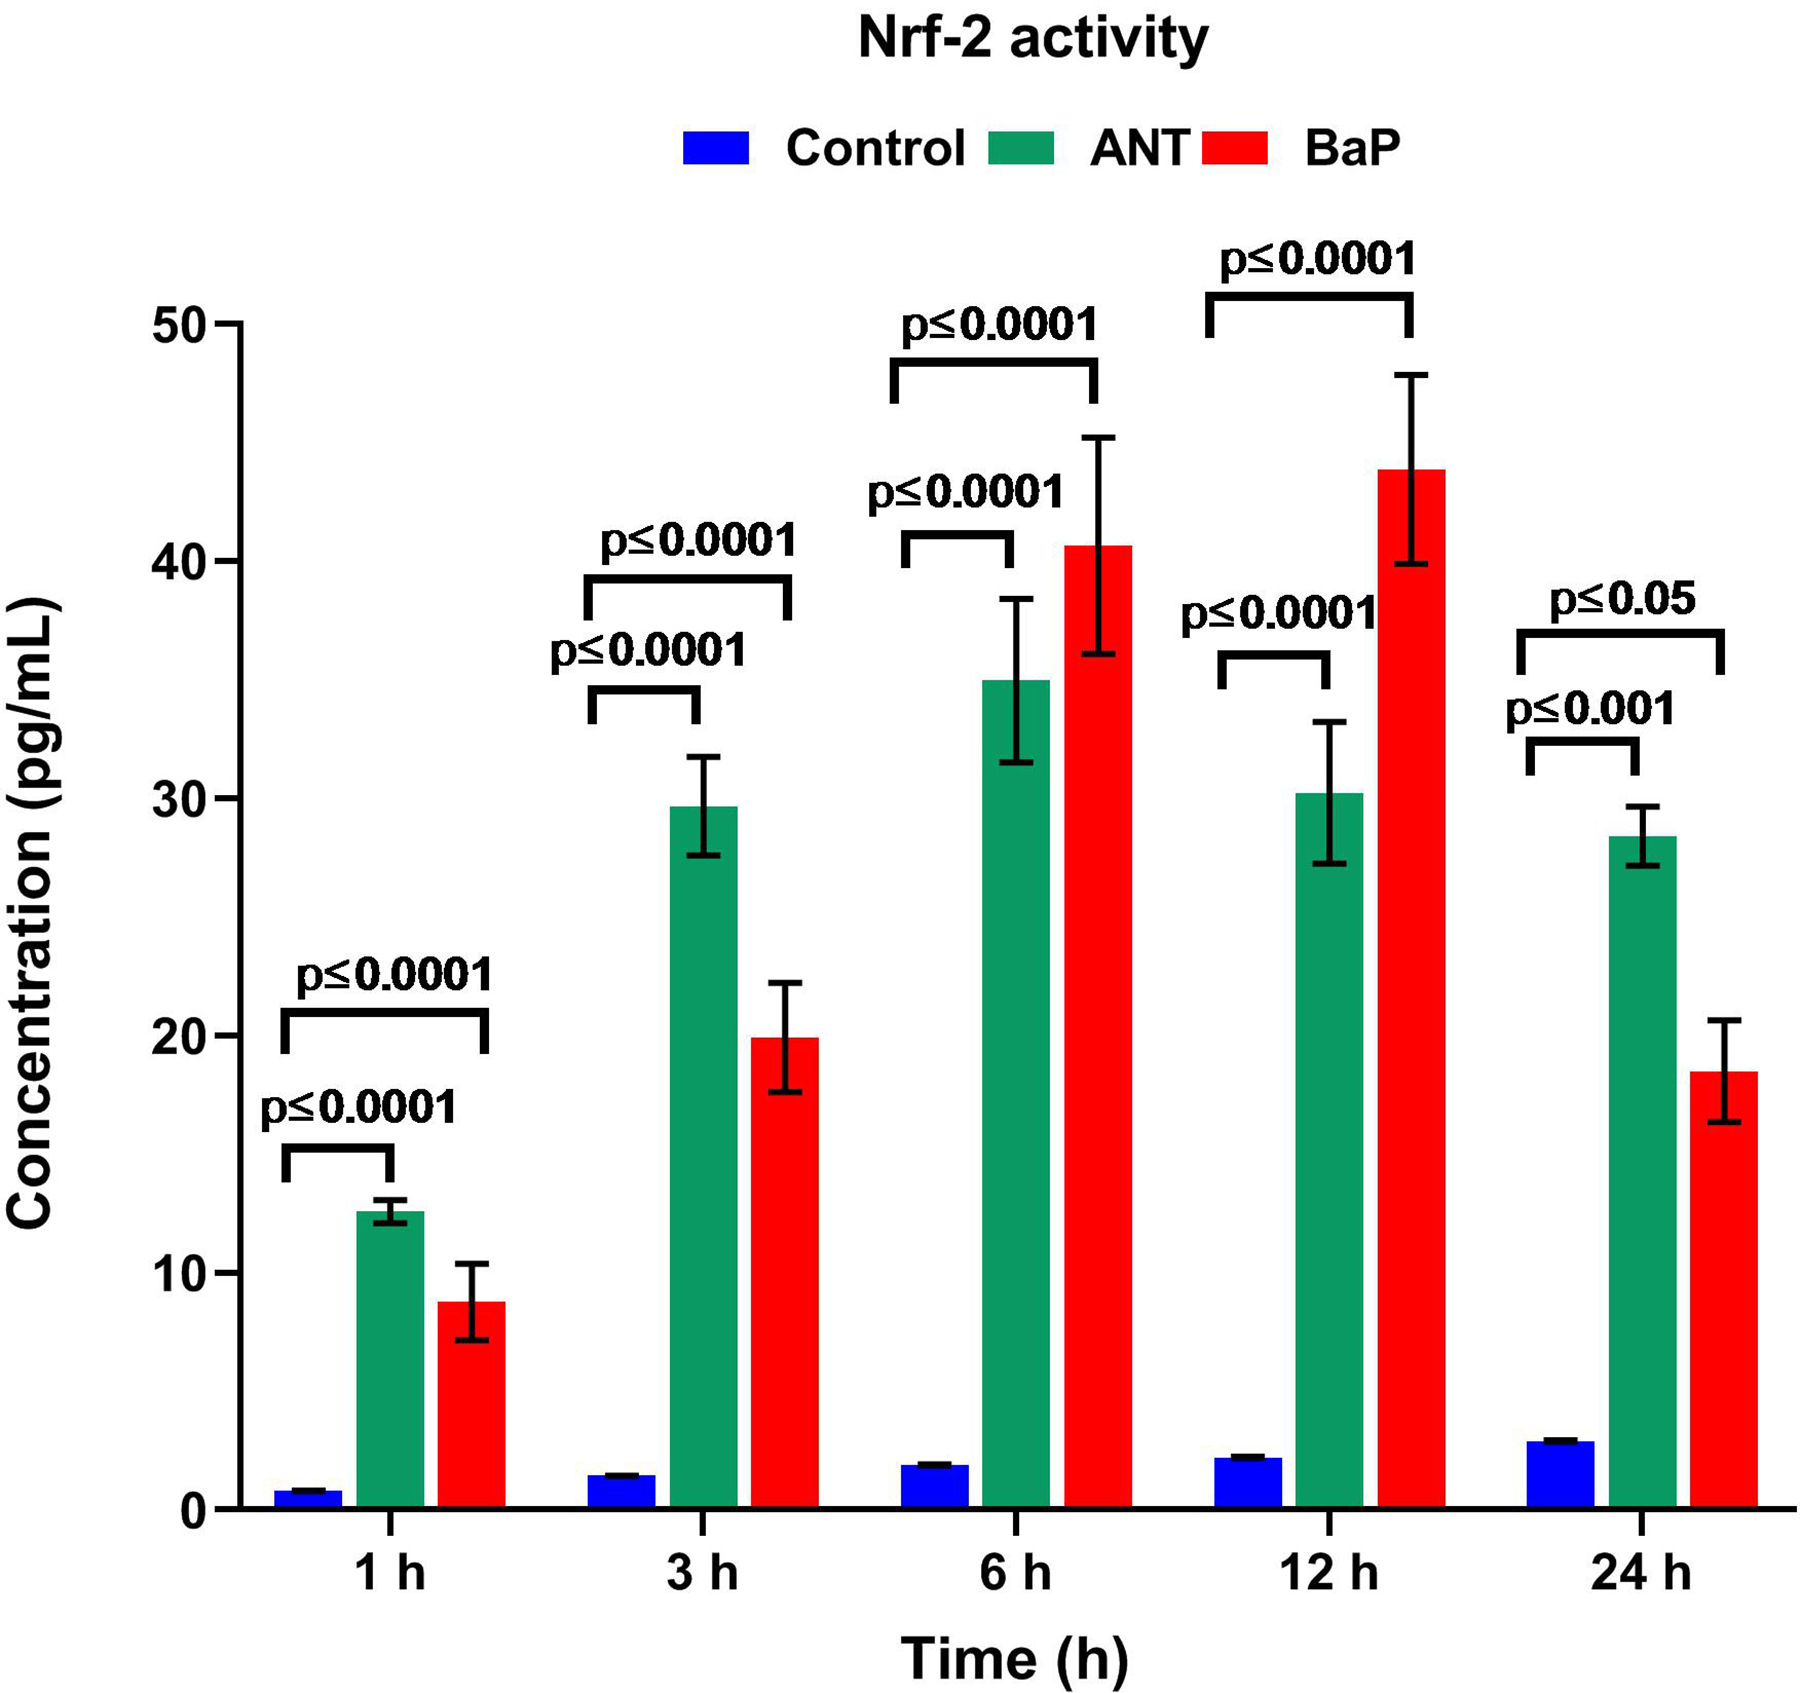
Levels of Nrf2. Graph demonstrating the levels of Nrf2 in controls and the cells exposed to ANT and BaP at different time points. Bars represent mean ± SE values, and P ≤ 0.05 was considered statistically significant (n = 3). ANT indicates anthracene; BaP, benzo[a]pyrene; Nrf2, nuclear factor erythroid 2-related factor 2; SE, standard error.
DNA Damage and Apoptosis
Increased accumulation of γH2AX and higher activation of caspase-3 in cells treated with PAHs suggested the ability of these pollutants to affect cellular integrity and proliferation. The mean fluorescence intensity for γH2AX reported at 6 hours among the ANT- and BaP exposed cells was 29.56% ± 3.45% and 21.04% ± 4.01%, respectively; whereas the control levels were 3.98% ± 0.04% (Figure 3A). Similarly, in comparison to controls, higher caspase-3 activity was also observed in the PAH exposed cells. The percentage caspase-3 activity observed at 1, 3, 6, 12, and 24 for ANT exposed cells was 2.35% ± 0.12%, 6.78% ± 0.89%, 18.92% ± 2.39%, 42.65% ± 3.97%, and 71.03 ± 6.91%, respectively; while for BaP exposed cells and controls, the observed caspase-3 activity at the similar time points was 1.89% ± 0.29%, 3.27% ± 0.82%, 6.52% ± 1.08%, 14.59% ± 2.36%, and 21.85% ± 3.92%, respectively; and 0.68% ± 0.08%, 1.03% ± 0.12%, 1.98% ± 0.19%, 3.83% ± 0.81%, and 5.97% ± 1.02%, respectively (Figure 3B).
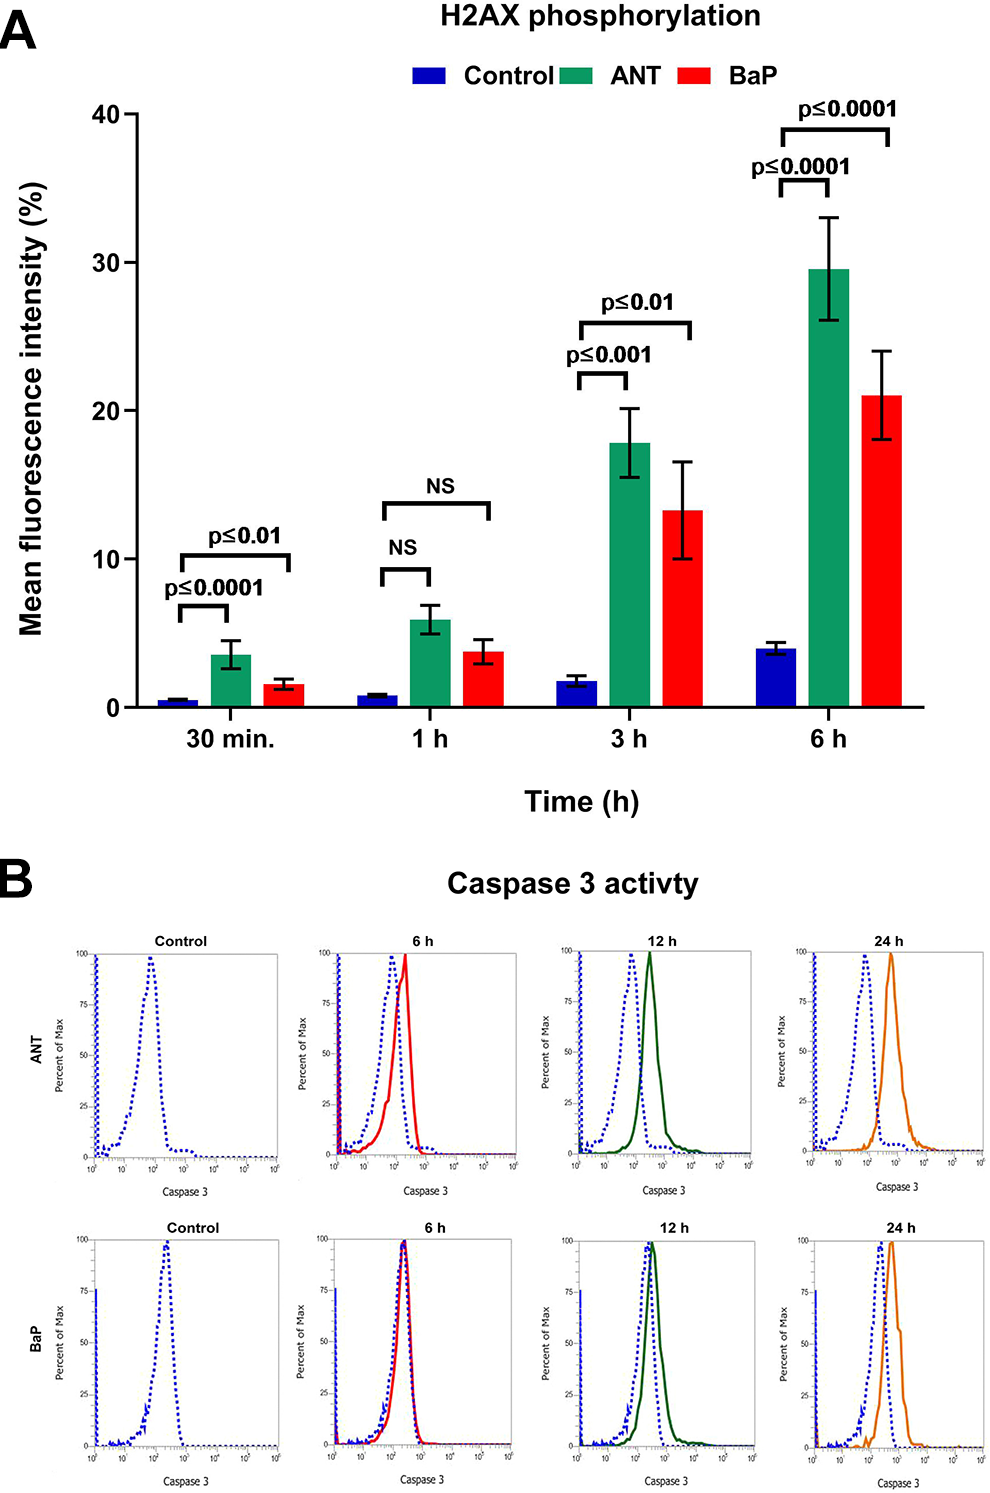
DNA damage and apoptosis. A, Graph illustrating the comparative assessment of H2AX phosphorylation in the controls and cells exposed to ANT and BaP at different time points. Data are expressed as mean ± SE, and P ≤ 0.05 was considered statistically significant (n = 3). B, Representative overlay histograms showing flow cytometric analysis of caspase-3 activation in the cells exposed to ANT and BaP for 6, 12, and 24 hours. The observed shift in the peak from control (blue) region suggests the increase in the caspase-3 activity among the exposed cells. ANT indicates anthracene; BaP, benzo[a]pyrene; SE, standard error.
Analysis of MitomiR and Targets
The results of expression analysis showed alterations in the mitomiR profiles of the BaP exposed cells. As compared to controls, downregulation of miR-24 and miR-155 and upregulation of miR-34a and miR-150 were observed in the cells exposed to BaP. The maximum downregulation and upregulation were observed in miR-24 and miR-155, respectively (Figure 4A). We further analyzed the effect of miRNA expression on their targets genes, that is, NF-κβ, MYC, and p53. Nuclear factor κβ, which gets activated upon oxidative stress and leads to the generation of an inflammatory response, is a homo- or heterodimeric complex. It acts as an inflammatory switch for the insinuation of epigenetic alterations While p53 and MYC are 2 regulatory genes that potentially regulate the process of cell cycle and apoptosis. Although expression of MYC, p53, and NF-κβ genes were upregulated in BaP treated cells, no significant changes were observed in cells exposed to ANT (Figure 4B).
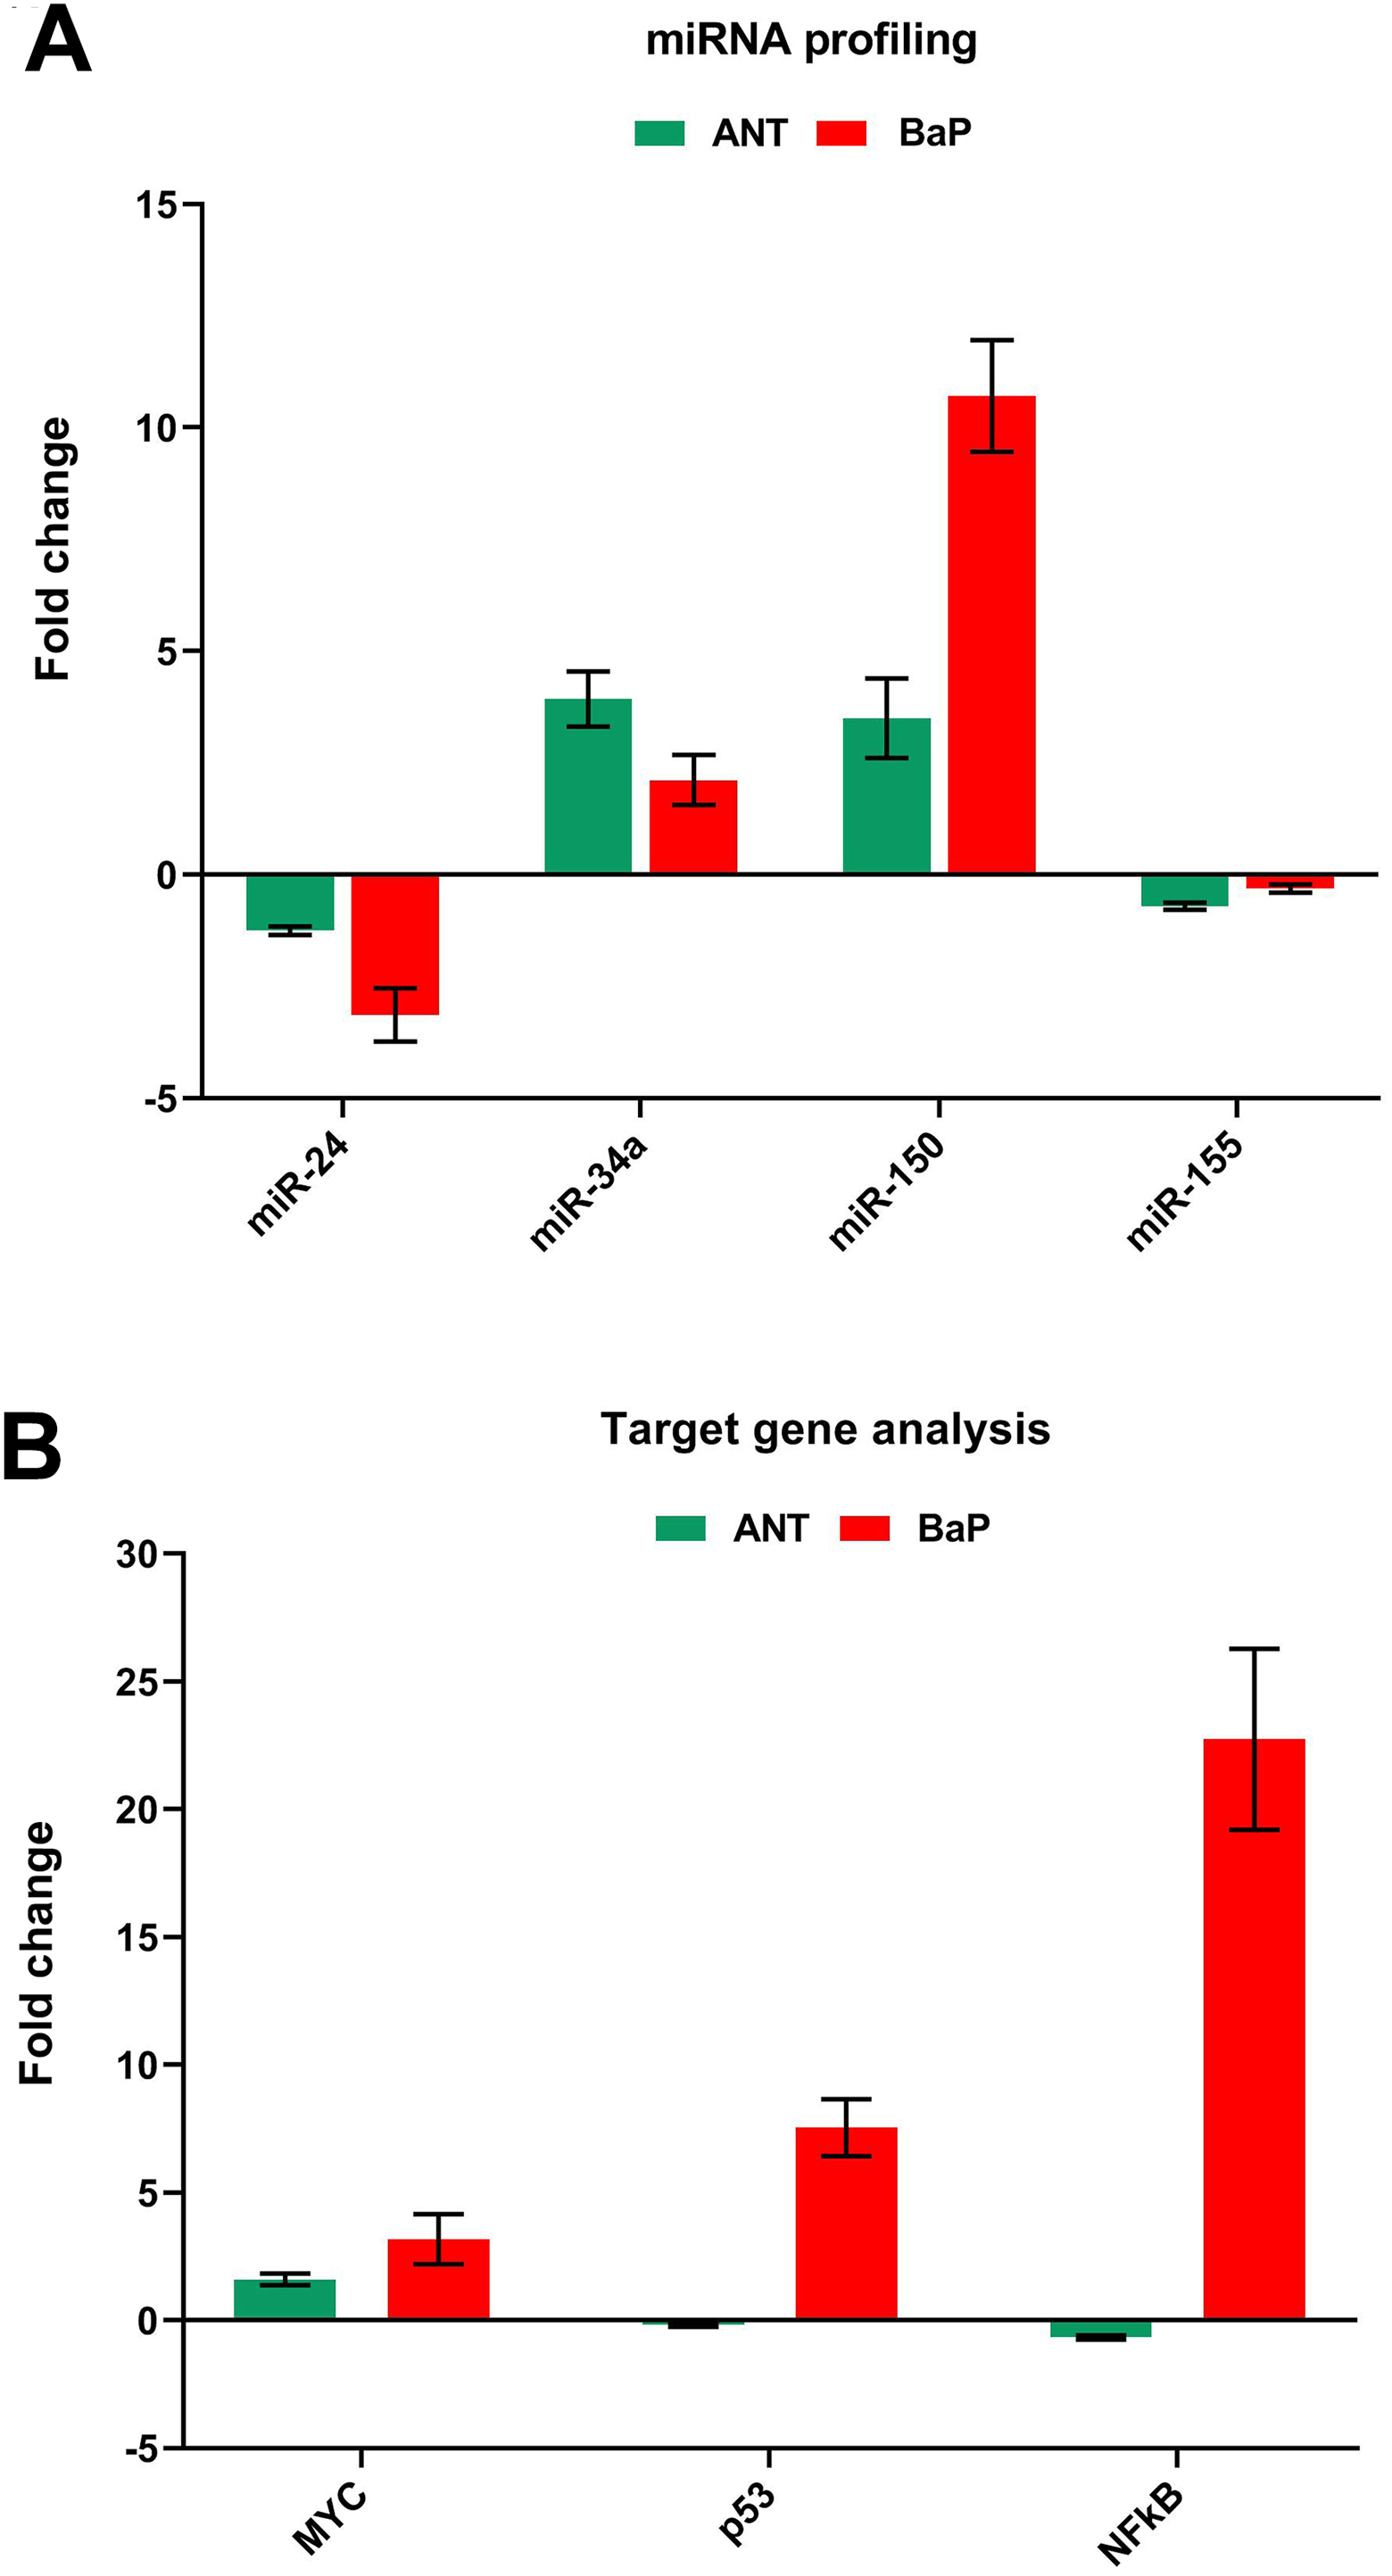
MitomiR and target analysis. The graphical representation of the expression profile of mitomiRs (A) and their targets, that is, MYC, p53, and NF-κβ (B), in the cells exposed to ANT and BaP for 72 hours. The fold change was calculated as 2−ΔΔCT by identifying dCT as the difference of internal control from their respective control and test values. ANT indicates anthracene; BaP, benzo[a]pyrene; NF-κβ, nuclear factor κβ.
Status of Epigenetic Modifiers
The analysis of epigenetic modifiers, that is, DNMT1, HDAC1, HDAC7, KDM3a, EZH2, and P300, showed marked alterations in BaP exposed cells. With respect to controls, the expression of DNMT1 was significantly lowered in the BaP exposed cells after 72 hours of exposure (Figure 5). Similarly, the levels of KDM3a, HDAC1, and HDAC7, P300, and EZH2 were also altered in cells exposed to BaP for 72 hours (Supplemental Figure 3).
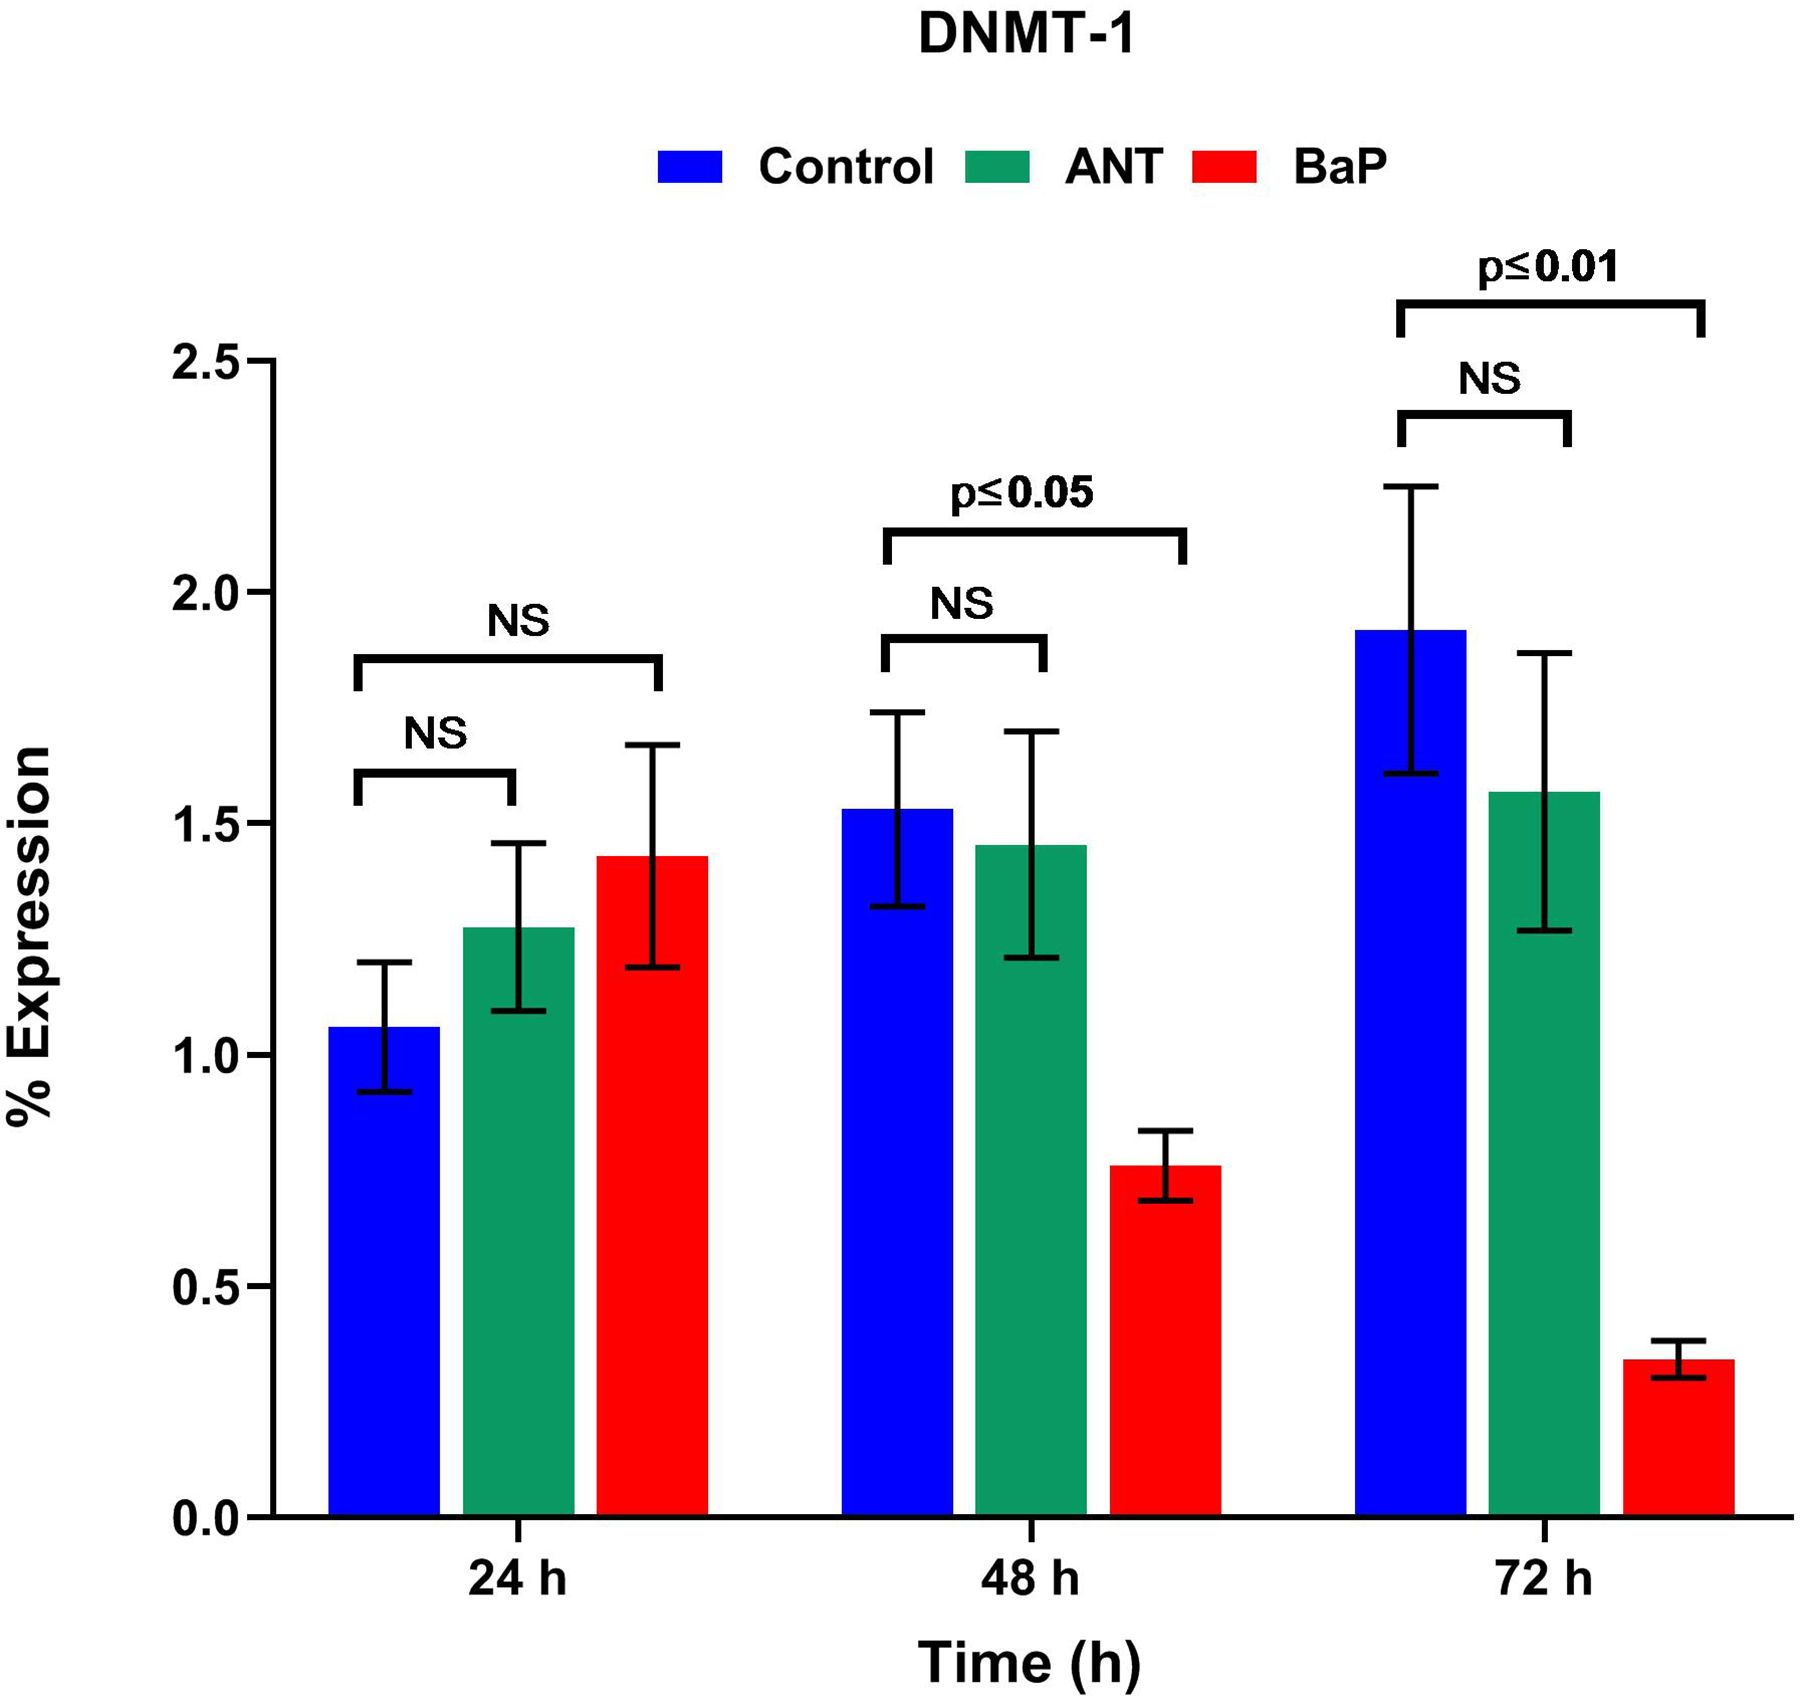
Epigenetic modifiers. Graph showing the real-time percentage expression of DNMT1 in controls and cells exposed to ANT and BaP for different time points. Data are expressed as mean ± SE, and P ≤ 0.05 was considered statistically significant (n = 3). ANT indicates anthracene; BaP, benzo[a]pyrene; SE, standard error.
DNA Methylation Profile
In cells treated with BaP for 72 hours, the methylation levels of D1, D2, 12S, CYTB, and 16S region of mtDNA were lower as compared to controls. However, no such change was observed in the cells exposed to ANT (Figure 6A). The mean value of 5-mC in BaP exposed cells at 72 hours was 0.54 ± 0.049, whereas the levels were 1.90 ± 0.098 and 2.18 ± 0.12 in ANT and control cells, respectively (Figure 6B). Similarly, the results of methylation-specific PCR showed differential expression of LINE-1 in cells exposed to BaP at 72 hours (Supplemental Figure 4). Our observations strongly indicated that BaP causes significant DNA hypomethylation, while no such changes were observed in ANT exposed cells.
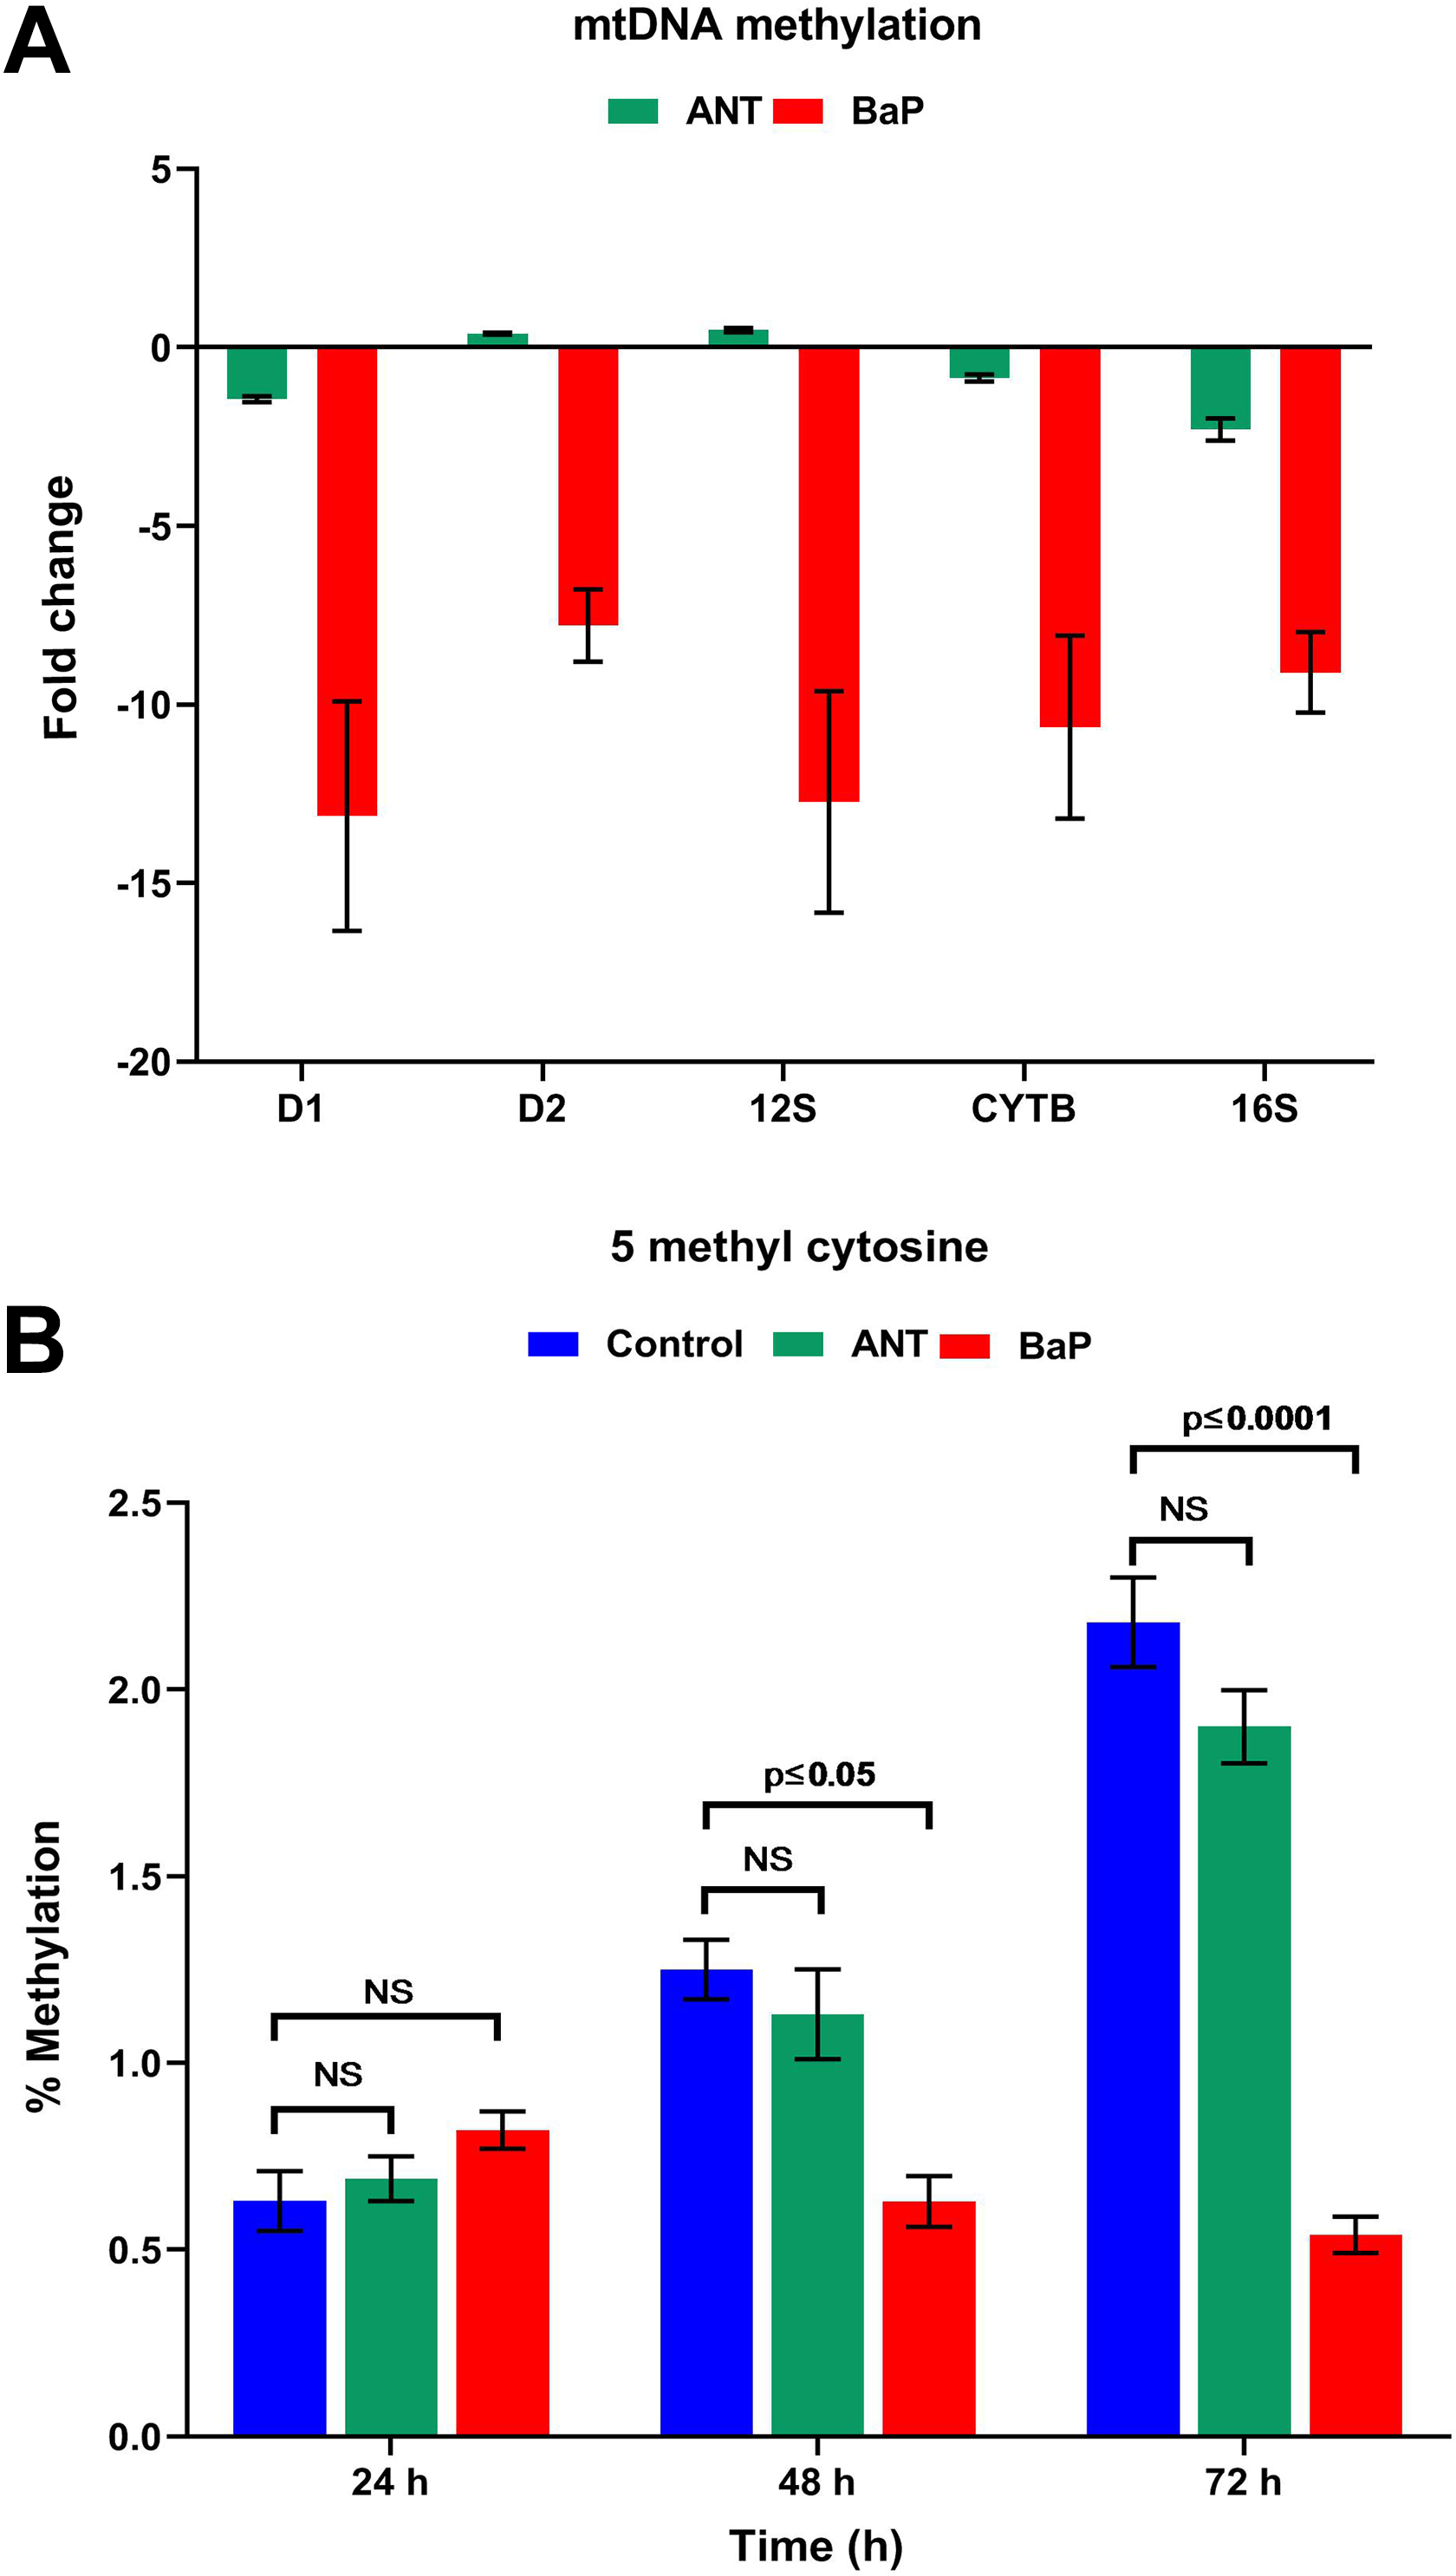
DNA methylation profile. A, Graphical representation of the mitochondrial DNA methylation in the controls and cells exposed to ANT and BaP for 72 hours. Data are expressed as mean ± SE, and P ≤ 0.05 was considered significant as compared with controls. D1; D loop, D2; D loop 2. B, Graph showing the percentage 5-mC levels indicative of global DNA methylation in controls and cells exposed to ANT and BaP for 24, 48, and 72 hours. Data are expressed as mean ± SE (P ≤ 0.05). ANT indicates anthracene; BaP, benzo[a]pyrene; SE, standard error.
Histone Alterations
The evaluation of 21 specific H3 and 10 different H4 modifications showed significant alterations in the BaP exposed cells. In contrast, no changes were observed in cells treated with ANT (Figure 7A and B). Western blot analysis of H3K4me3, H3K4me9, H3K4me27, H3K4me36, and H3K4me79 showed marked hypermethylation in BaP treated cells (Supplemental Figure 5).
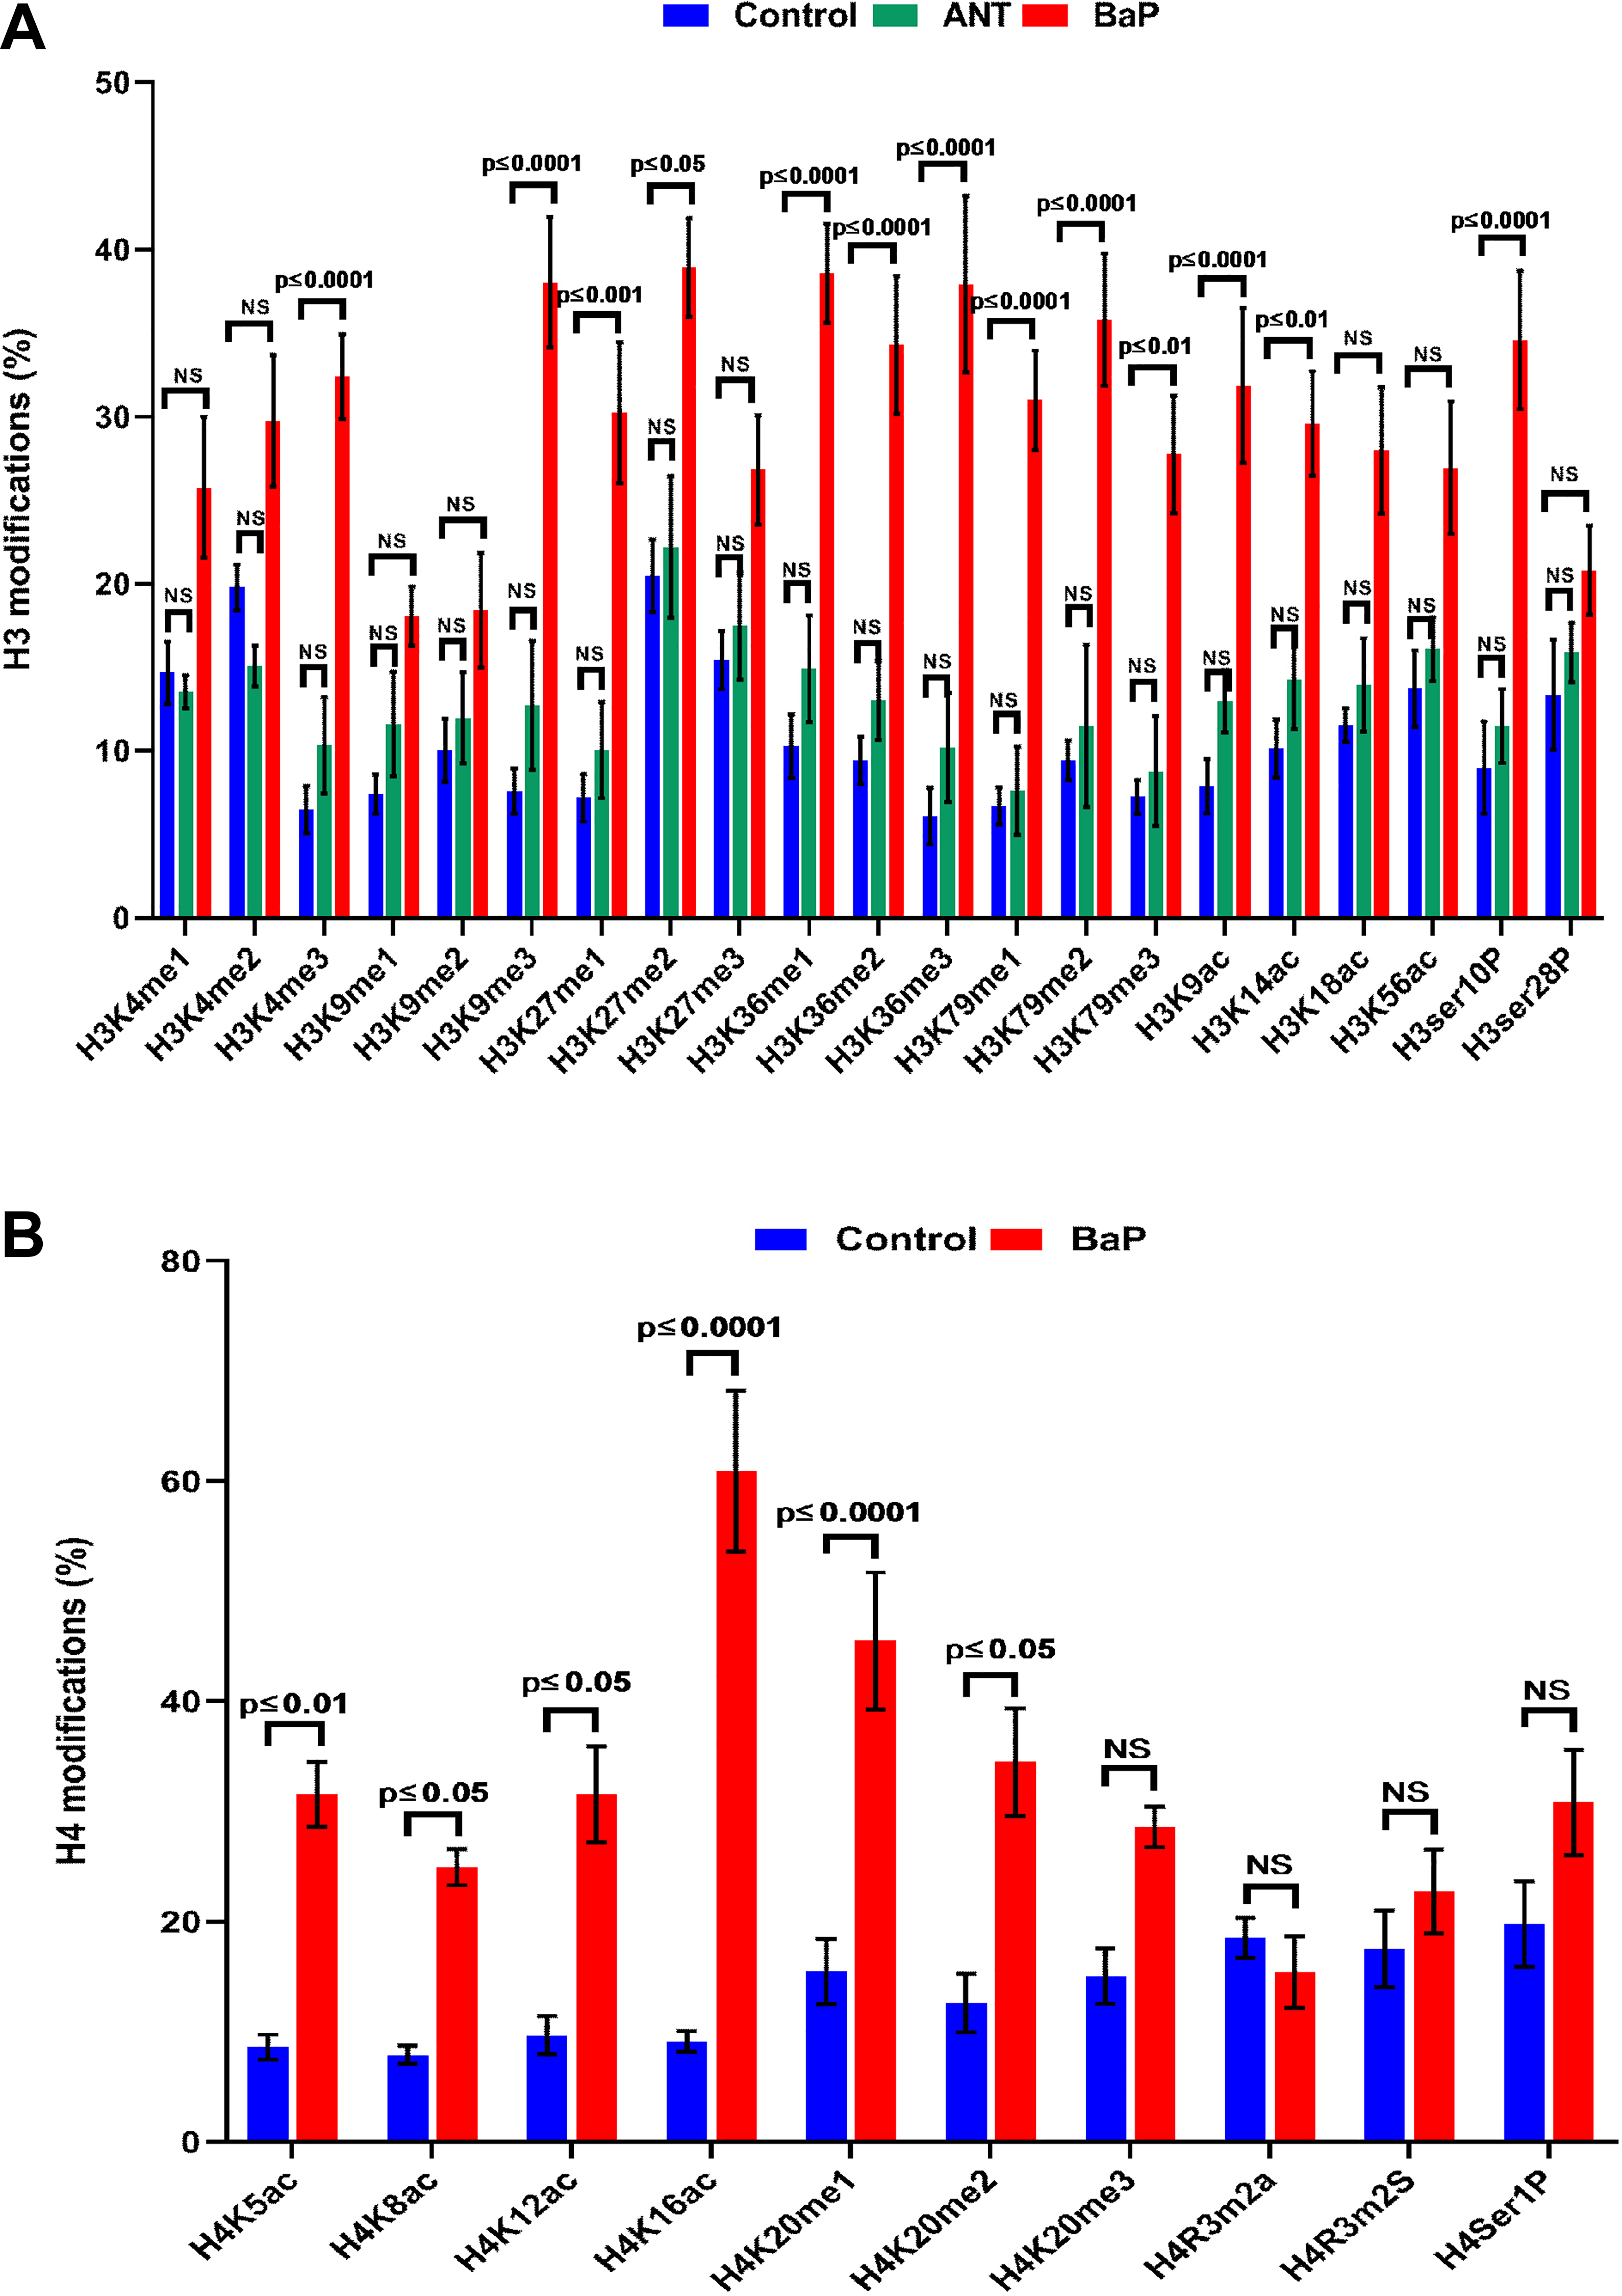
Quantification of histone (H3 and H4) alterations. A, The levels of histone H3 modifications in controls and the cells exposed to ANT and BaP for 72 hours. Data are expressed as mean ± SE and P ≤ 0.05 was considered significant as compared with controls. B, The levels of histone H4 modifications in controls and the cells exposed to BaP for 72 hours. Data are expressed as mean ± SE and P ≤ 0.05 was considered significant. ANT indicates anthracene; BaP, benzo[a]pyrene; SE, standard error.
Discussion
Acute or chronic exposure to environmental pollutants significantly impairs immune cell functions which may contribute toward development of noncommunicable diseases. Such impairments are often mediated by metabolic changes that results from improper mitochondrial functioning as these semiautonomous organelles play a key role in regulating activation, differentiation, and survival of innate and adaptive cells. Previously, we have reported that exposure to different environmental toxins including air pollutants considerably affects mitochondrial redox machinery. 22,23 In the present study, we investigated the mitochondrial-mediated epigenetic regulation in peripheral lymphocytes following exposure to a carcinogenic (BaP) and noncarcinogenic (ANT) PAHs, an important class of air pollutant. Overall, our findings suggest that exposure to ANT induces mitochondrial toxicity with no significant epigenetic alteration, while BaP disturbs the redox machinery and initiates a cascade of aberrant epigenetic modifications that include changes in the expression of mitochondrial miRNAs, DNA hypomethylation, and modification in histone tails.
Moreover, mitochondria are the essential organelles that play a crucial role in the regulation of different cellular processes including ATP generation and apoptosis. Due to the extensive regulatory functioning, these organelles not only works as a cellular source of free radicals but also are more prone to electrophillic attack, radical injury, and dysfunction. 27 -29 Importantly, these oxidative bursts may cause deleterious effects on the mitochondrial genome as it lacks the protective structure of histones and an efficient repair system. In some circumstances, mitochondria compensate for the damage by inducing mtDNA replication. However, as defective mitochondria accumulate, it further leads to abnormal bioenergetic and replicative function. 30 The results observed herein showed significantly higher levels of ROS among the peripheral lymphocytes exposed to PAH (both BaP and ANT), which confirmed the potential of these compounds to stimulate mitochondrial stress. We also recorded considerable loss of mitochondrial membrane potential in the cells exposed to both BaP and ANT. Together, our findings demonstrated that noncarcinogenic PAHs not only disrupt mitochondrial integrity but cause loss of compensatory ability of the cell leading to apoptosis.
In order to understand the impact of excessive stress generated in the mitochondrial milieu on retrograde signaling, we examined the levels of Nrf2, an important mediator of mitochondrial-nuclear cross talk. 31 Our results showed that in comparison to controls the levels of Nrf2 were significantly higher in the cells exposed to PAHs. These increased levels were maintained until 12 hours but declined subsequently suggesting the inability of cells to resist the stress. This was further confirmed by the higher accumulation of ƴH2AX in both ANT and BaP treated cells. An increase in the caspase-3 activity was also recorded in exposed cells; however, the activities were more pronounced in the cells exposed to ANT. Interestingly, the limited activation of caspases also indicated the probability that these mitochondria-induced genomic alterations in BaP exposed cells may further influence the epigenetic machinery.
Recent reports provide ample evidence that the mitochondrial niche serves as both source and regulatory target of the miRNAs that harbor within mitochondria. 32,33 In lymphocytes, these miRNAs form the basis of different signaling mechanisms engaged in the transcriptional regulation of different associated proteins. The miRNA panel used for our study comprised of 4 known mitomiRs, that is miR-24, miR-34, miR-150, and miR-155. These mitomiRs play an important role in the regulation of mitochondrial-derived inflammatory pathways considered vital for controlling protective immune responses; miR-24 and miR-150 have profound function in lymphocyte differentiation, whereas miR-155 controls the differentiation of CD4+ T cells into T helper type 1 (Th1), Th2, and Th17 subsets of helper T cells. 34 -36 A recent study suggested that miR-155 mediated gene regulation in immune cells greatly influences the cellular context of T and B lymphocytes. 37 The upregulation of miR-34a and miR-150 and downregulation of miR-24 and miR-155 in BaP treated cells were found to be associated with the expression profile of their respective target genes. We observed that exposure to BaP increases the expression of MYC, p53, and NF-κβ target genes, which are involved in a number of key cellular processes of stress-induced epigenetic alterations.
Importantly, the mitochondrial stress signals not only impact DNMT1 functioning but also are shown to be linked to mtDNA methylation. These signals facilitate translocation of DNMT1 to the mitochondria thereby influencing mtDNA gene transcription. 38 -40 Although association of BaP exposure with DNA methylation is known, the underlying mechanisms to establish the link between mitochondrial deregulation with changes in epigenetic machinery are missing. 41 Our results suggested that BaP exposure causes significant alterations in the expression of epigenetic modifiers (DNMT1, HDAC1, HDAC7, KDM3a, EZH2, and P300), while no such changes were noticed in ANT treated cells. It is noteworthy that such aberrant expression of epigenetic modifiers is likely to trigger methylation and acetylation of nDNA and histones. Our results provided clear evidence of hypomethylation in D1, D2, 12S, CYTB, and 16S region of mtDNA. In addition, the global DNA methylation analysis using LINE 1 and 5-mC showed a significant hypomethylated profile in the BaP exposed cells. These findings not only highlight the functional link between mitochondrial and DNA methylation but also indicated the ability of BaP to induce long-term cellular changes. However, we did not observe any significant changes in methylation profiles of ANT treated cells. We consider that these observations are vital as the deregulated DNA methylation profile is known to be associated with immune disorders. 42
The intermediate mitochondrial metabolites are required for covalent modifications of N-terminal tails of histones. 43 Therefore, we assumed that mitochondria dysfunction after PAH exposure may induce alterations in the histone profile. In the present study, exposure to BaP caused significant histone H3 and H4 modifications, however no notable changes were observed following treatment with ANT. Together, these histone modifications in BaP exposed cells might influence gene expression by causing irreversible errors in the vital transcriptional machinery.
Conclusion
Overall, the study demonstrates that peripheral lymphocytes treated with PAHs disturb the functional integrity of mitochondrial machinery, and the effects were more pronounced in ANT treated cells as compared to BaP. Contrarily, the subtle changes in BaP exposure triggered a cascade of epigenetic changes mediated through mitochondrial retrograde signaling (Figure 8 and Table 1). Collectively, our results contribute to the current knowledge by demonstrating the differential immunotoxic potential of ANT and BaP. The findings further suggest that PAHs, at least in part, may be responsible for the adverse effects linked to immune function related to air pollution. As epigenetic modifications have regulatory impact on gene expression patterns, functional characterization of cell-free circulating signatures can be useful to establish minimal invasive biomarkers for air-pollution linked immune disorders. However, the use of such signatures in human health risk assessment studies will require careful validation in control and experimental settings.
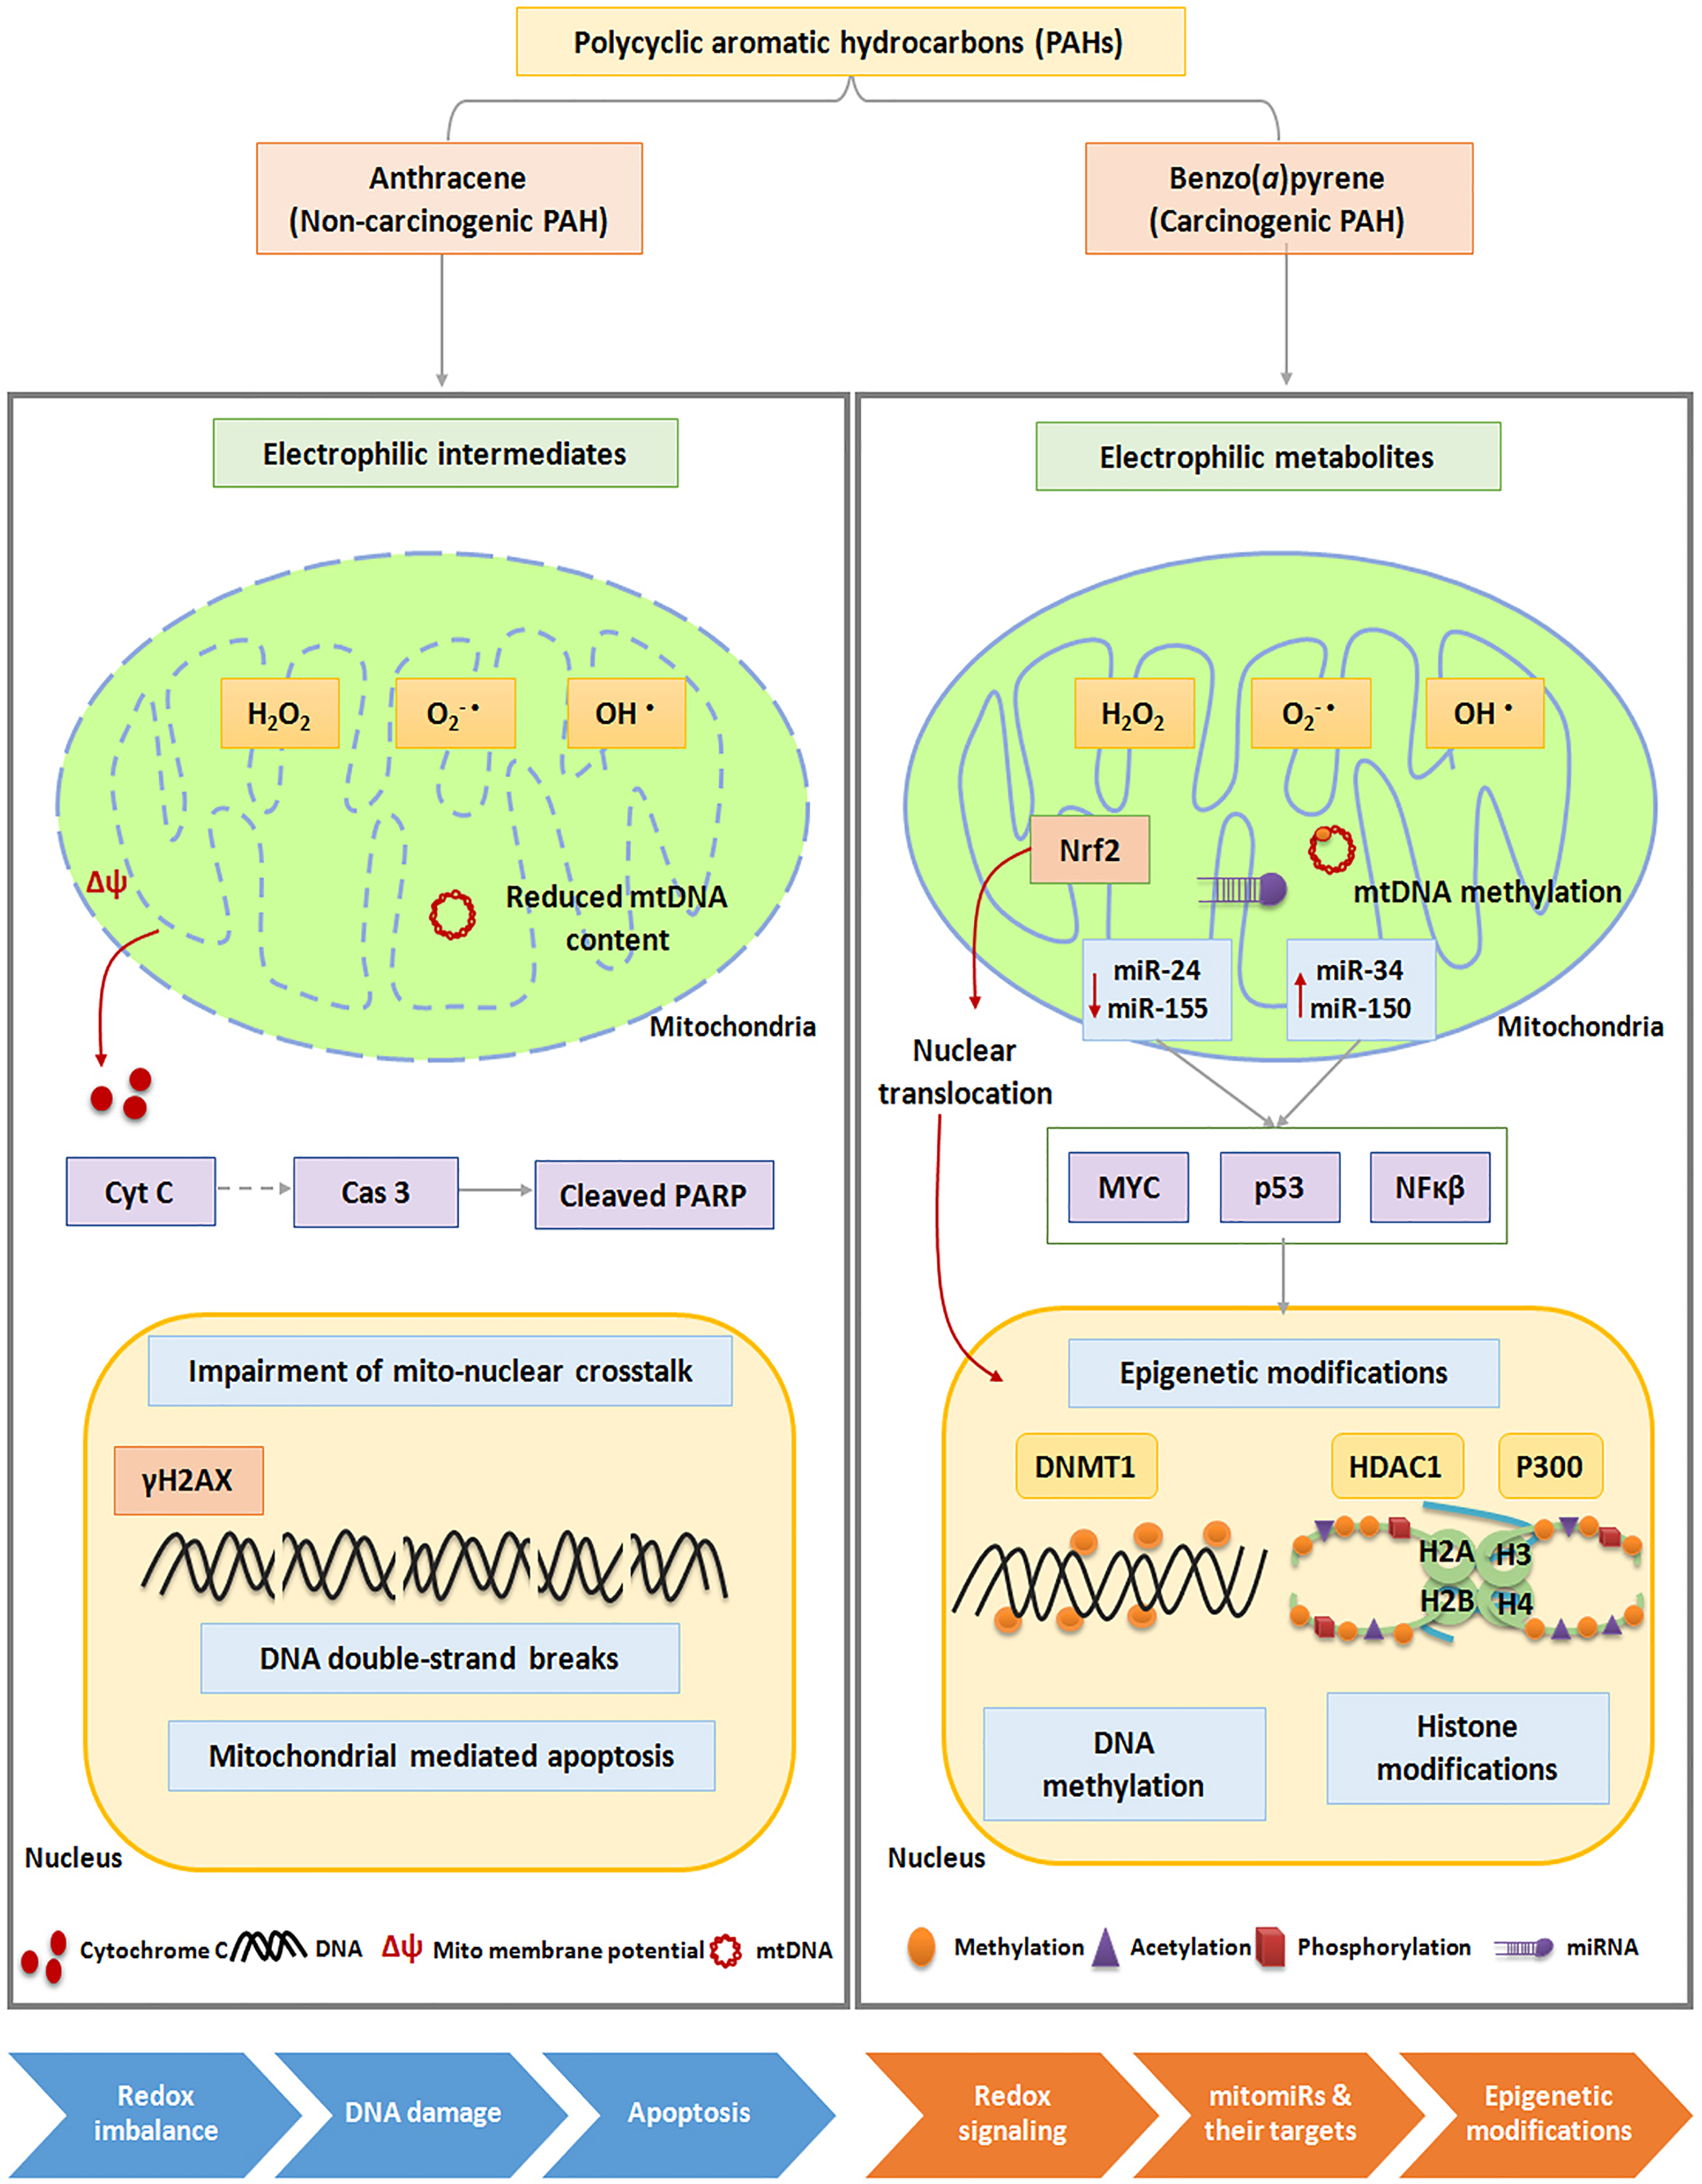
PAH-induced immunotoxicity. A novel insight into the possible role of mitochondria oxidative stress-induced epigenetic modifications in lymphocyte homeostasis following treatment with ANT and BaP. ANT indicates anthracene; BaP, benzo[a]pyrene; Cas 3, caspase-3; Cyt C, cytochrome c; DNMT, DNA methyltransferases; HDAC, histone deacetylase; miR, microRNA; PAH, polycyclic aromatic hydrocarbon; PARP, poly ADP ribose polymerase.
Differential Immunotoxic Potential of Anthracene and Benz[o]pyrene Following Exposure to Peripheral Lymphocytes.
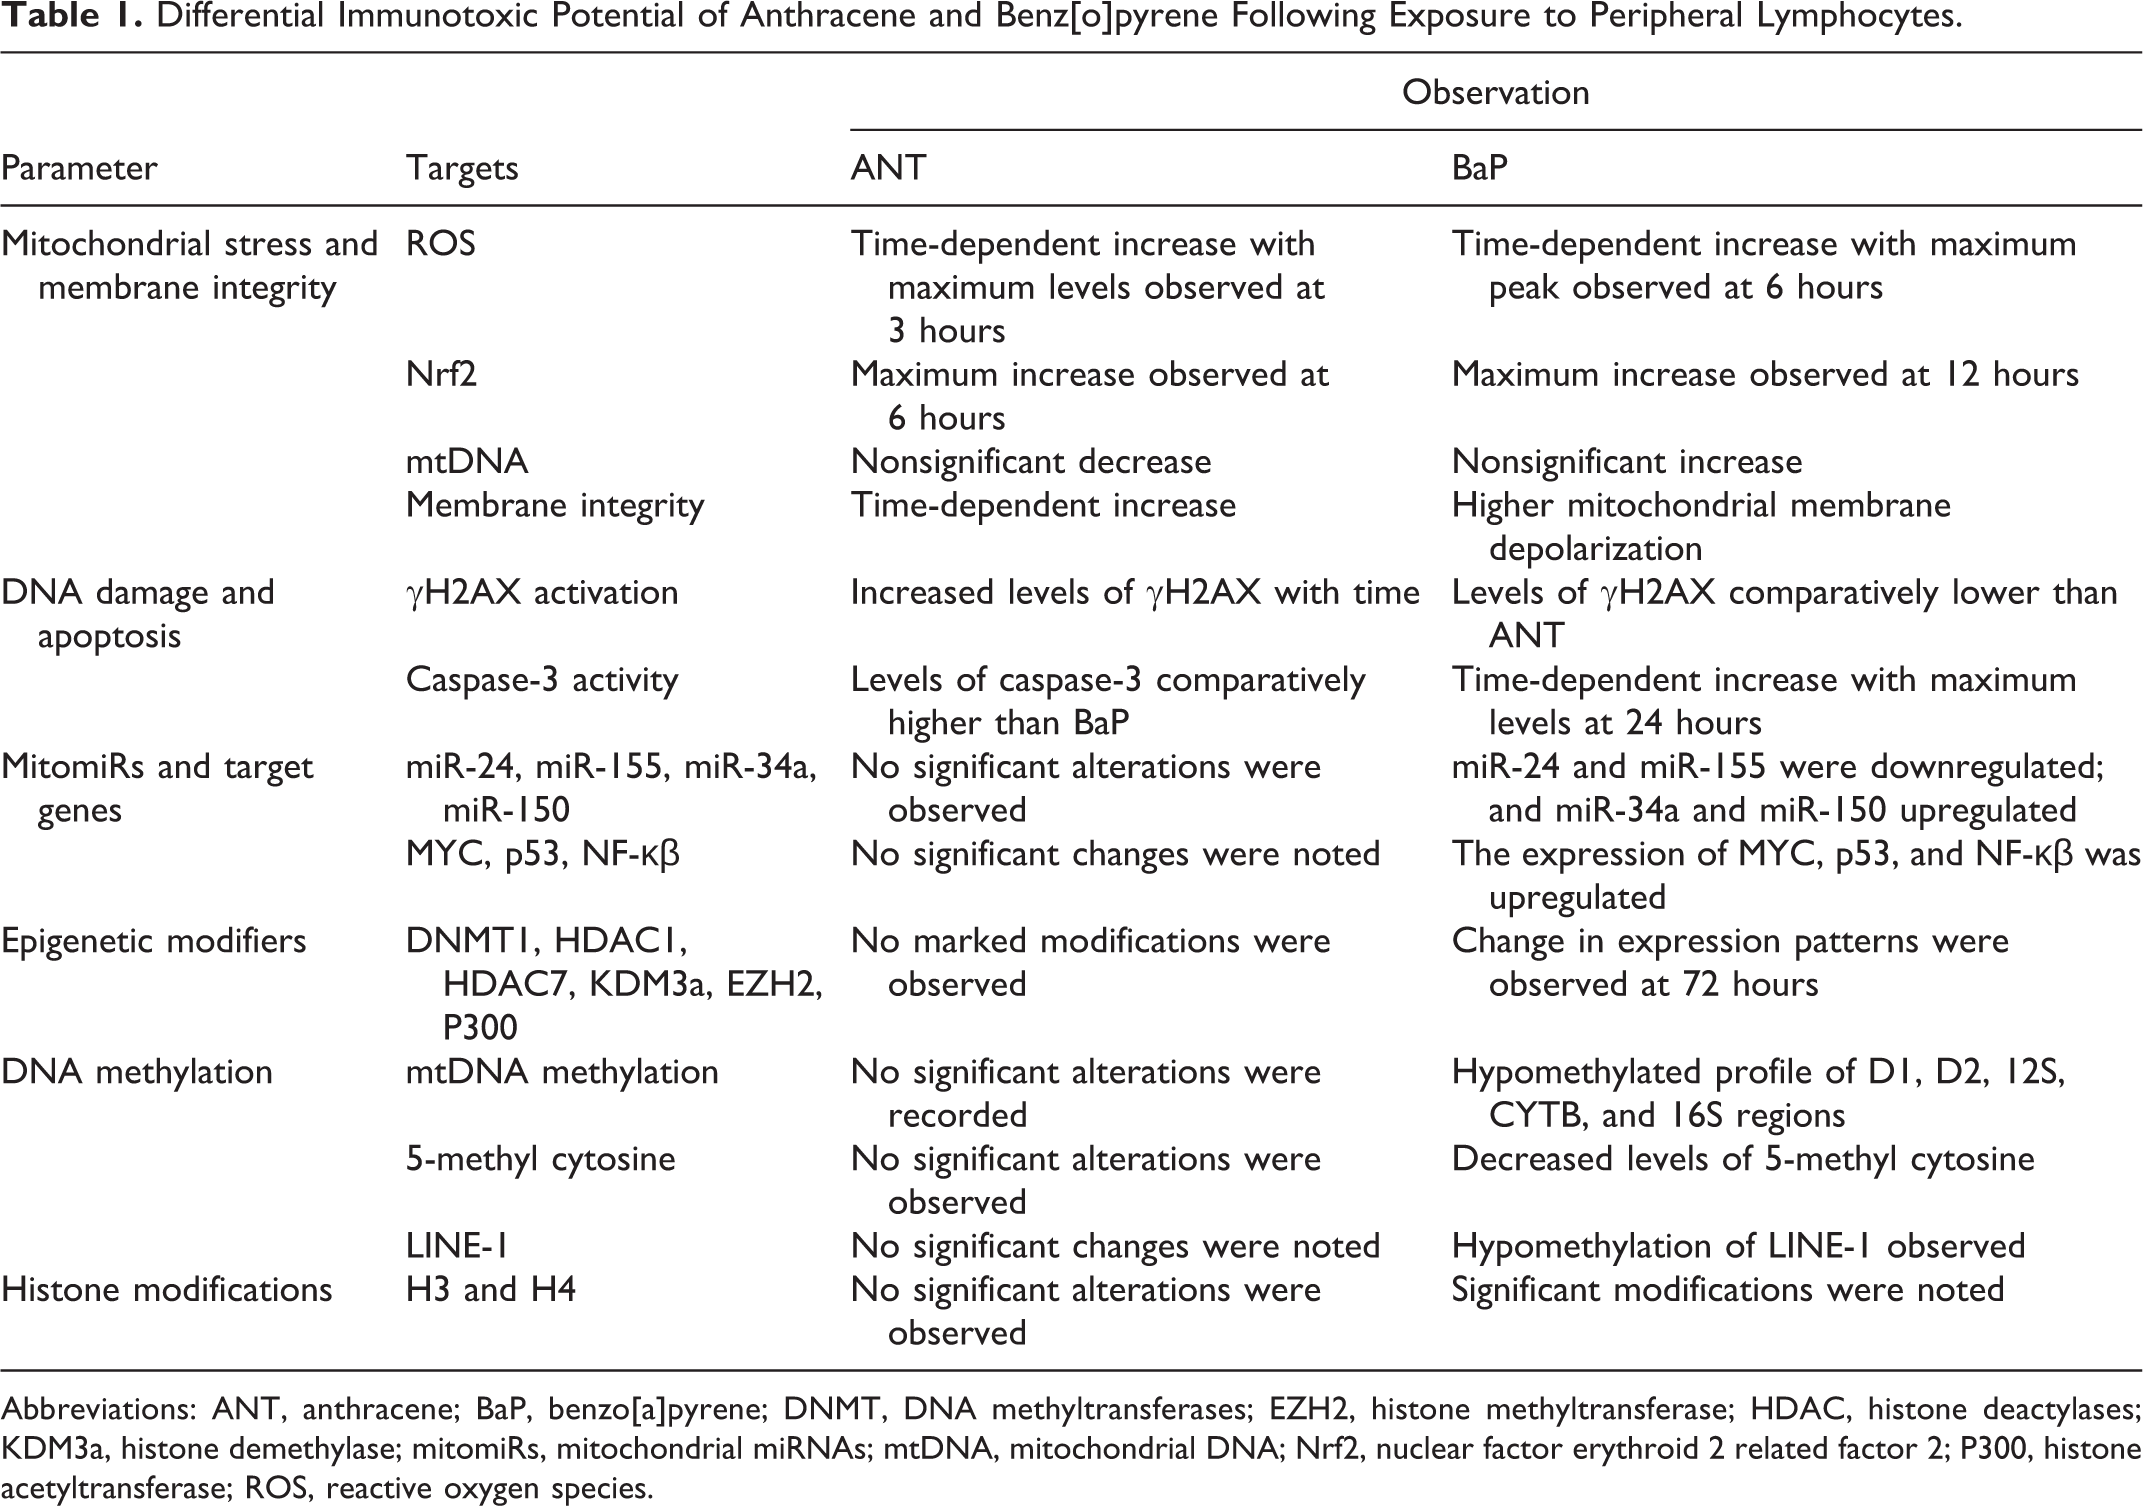
Abbreviations: ANT, anthracene; BaP, benzo[a]pyrene; DNMT, DNA methyltransferases; EZH2, histone methyltransferase; HDAC, histone deactylases; KDM3a, histone demethylase; mitomiRs, mitochondrial miRNAs; mtDNA, mitochondrial DNA; Nrf2, nuclear factor erythroid 2 related factor 2; P300, histone acetyltransferase; ROS, reactive oxygen species.
Supplemental Material
Supplemental_Material - Mapping the Mitochondrial Regulation of Epigenetic Modifications in Association With Carcinogenic and Noncarcinogenic Polycyclic Aromatic Hydrocarbon Exposure
Supplemental_Material for Mapping the Mitochondrial Regulation of Epigenetic Modifications in Association With Carcinogenic and Noncarcinogenic Polycyclic Aromatic Hydrocarbon Exposure by Arpit Bhargava, Roshani Kumari, Surbhi Khare, Ruchita Shandilya, Pushpendra Kumar Gupta, Rajnarayan Tiwari, Akhlaqur Rahman, Koel Chaudhury, Irina Yu Goryacheva and Pradyumna Kumar Mishra in International Journal of Toxicology
Footnotes
Author Contributions
Bhargava, A. contributed to acquisition and drafted the manuscript; Kumari, R. contributed to acquisition and analysis and critically revised the manuscript; Khare, S. contributed to acquisition and critically revised manuscript; Shandilya, R. contributed to acquisition and analysis and critically revised the manuscript; Gupta, P.K. contributed to acquisition and critically revised manuscript; Tiwari R. contributed to interpretation and critically revised manuscript; Rahman, A. contributed to acquisition and critically revised manuscript; Chaudhury, K. contributed to interpretation and analysis and critically revised the manuscript for important intellectual contribution; Goryacheva, I.Y. contributed to interpretation and analysis and critically revised the manuscript for important intellectual contribution; Mishra, P.K. contributed to conception and design, contributed to acquisition, analysis, and interpretation, drafted the manuscript, and critically revised the manuscript for important intellectual contribution. All authors gave final approval and agree to be accountable for all aspects of work ensuring integrity and accuracy.
Declaration of Conflicting Interests
The author(s) declared no potential conflicts of interest with respect to the research, authorship, and/or publication of this article.
Funding
The author(s) disclosed receipt of the following financial support for the research, authorship, and/or publication of this article: This work was supported by the financial assistance received from the Ministry of Human Resource and Development (MHRD) and Indian Council of Medical Research (ICMR), Government of India, New Delhi, to the laboratory of Professor Pradyumna Kumar Mishra.
References
Supplementary Material
Please find the following supplemental material available below.
For Open Access articles published under a Creative Commons License, all supplemental material carries the same license as the article it is associated with.
For non-Open Access articles published, all supplemental material carries a non-exclusive license, and permission requests for re-use of supplemental material or any part of supplemental material shall be sent directly to the copyright owner as specified in the copyright notice associated with the article.