
Abstract
Emerging studies have linked prooxidative carbamate compound exposures with various human pathologies including pancreatic cancer. In these studies, our aim was to examine mitochondrial oxidative stress-mediated aberrant chromatin responses in human pancreatic ductal epithelial cells. Posttranslational histone modifications, promoter DNA methylation, and micro-RNA (miRNA) expression patterns were evaluated following induction of mitochondrial oxidative stress by N-succinimidyl N-methylcarbamate exposure. In treated cells, perturbation in mitochondrial machinery led to hypermethylation of p16 and smad4 gene promoters and downregulation of respective gene products. Posttranslational histone modifications that include hypoacetylation of acetylated histone (AcH) 3 and AcH4, hypermethylation of monomethylated histone 3 at lysine 9 and trimethylated histone 4 at lysine 20 ubiquitinated histone (uH) 2A/uH2B, and increased phosphorylation of H2AX and H3 were observed in the treated cells. Altered expression of miRNAs denoted possible location of corresponding genes at oxidatively damaged fragile sites. Collectively, our results provide a direct role of mitochondrial oxidative stress-mediated epigenetic imbalance to perturbed genomic integrity in oxygen radical-induced pancreatic injury. Further, identification and characterization of molecular switches that affect these epigenomic signatures and targets thereof will be imperative to understand the complex role of redox-regulatory network in pancreatic milieu.
Introduction
Both endogenous and exogenous insults generate reactive oxygen species (ROS). Once this production overwhelms the cell’s antioxidant defenses, oxygen radical injury can occur. Oxidative stress plays a significant role in neoplastic development, including mutations, altered gene expression, telomeric attrition, and promotion of genomic instability. 1 Of late, reports have revealed redox metabolism as a vital determinant for epigenetic programming that might have significant consequences in posttranslational modifications. 2 Various epigenetic marks including DNA methylation and histone modifications, namely, methylation, acetylation, ubiquitination, and phosphorylation, have been directly related to crucial redox intermediates such as nicotinamide adenine dinucleotide, 8-hydroxydeoxyguanosine, and S-adenosyl methionine. Normal and pathologic stimuli originating from fluctuations of these intermediates might disturb epigenetic modifications, leading to a cascade of aberrant gene expression sequelae. 3
Epigenetic factors can provide the mechanistic basis to understand the intricate gene–environment relationship in predisposing factors to human ailments, such as gastrointestinal malignancies. 4 –6 Recently, oxidative stress has been postulated as a potential risk factor for exposure-associated pancreatic adenocarcinoma. 7 In addition, oxidative stress measurement techniques can be used to investigate a potential relationship between mitochondrial function and environmental-associated pancreatic disease outcomes. Epigenetic dimension of oxidative damage could be an inextricable component of genomic integrity in the pancreatic milieu. This might be multiplicative rather than additive and deserves greater scientific attention.
Various studies have increasingly linked prooxidative carbamate compound exposures (both chronic and acute) with exocrine pancreatic disorders. 8 –10 Despite their wide spectrum of industrial importance, epigenetic implications resulting from occupational and large-scale accidental exposures to carbamate pesticides still remains a poorly understood phenomenon. N-Methyl carbamates are a group of organic compounds that share a common functional group with the general structure –NH(CO)O– along with isocyanates. Carbamate esters have alkyl or aryl groups substituted on the nitrogen or the amide. Also, N-methylcarbamate esters are converted into isocyanates when the alcohol (–OH) group gets eliminated/abstracted. One of the carbamate esters, which is a surrogate for methyl isocyanate (MIC), N-succinimidyl N-methylcarbamate, was used for the investigations. 6,11,12 We aimed to provide a direct role of mitochondrial oxidative stress-mediated epigenetic alterations, as a central phenomenon, to perturbed genomic integrity in pancreatic epithelium.
Materials and Methods
Cell Culture and Treatment
Normal human pancreatic ductal epithelial (HPDE-6) cells were maintained in keratinocyte-free medium supplemented with 4 mmol/L
Measurement of Mitochondrial-Mediated Apoptosis
Mitochondrial-mediated apoptosis was examined by JC-1 Mitoscreen assay kit and PE active caspase 3 apoptosis kit procured from BD Bioscience (San Jose, California). Apoptotic response in cells prior to and following treatment with 0.005 µmol/L N-succinimidyl N-methylcarbamate was evaluated by flow cytometry. Experiments were carried out in triplicate. A total of 10 000 events were recorded in HI mode, and percentage of cells with depolarized mitochondria and percentage of cells positive for active caspase 3 were determined. 14
Measurement of Intracellular ROS
Qualitative detection
Cells were grown overnight on cover glasses in Dulbecco modified Eagle medium (DMEM) and subjected to treatment. A fresh stock solution of 5-(and-6)-chloromethyl-2',7'-dichlorodihydrofluorescein diacetate acetyl ester (CM-H2DCFDA, 5 mmol/L; Life Technologies Co) was prepared in dimethyl sulfoxide (DMSO) and diluted to a final concentration of 1 µmol/L in 1× phosphate-buffered saline (PBS). The cells were washed with 1× PBS and incubated with 2 mL of working solution of fluorochrome (green) marker CM-H2DCFDA (final working concentration adjusted to 2.5 µg/50 µL) for 2 hours in dark. 13,15 After staining, the cells were washed with 1× PBS and fixed in 4% paraformaldehyde for 30 minutes at room temperature. The fixed cells were washed in 1× PBS and mounted with Vecta Shield (Vector Laboratories, Burlingame, California) onto a clean glass slide. Photomicrographs were captured using applied bioimaging system (Applied Spectral Imaging, Edingen, Neckarhausen, Germany) and analyzed using spectral imaging 4.0 software. Images with a field size of 512 × 512 pixels were generated using 20× objective.
Quantitative detection
A fresh stock solution of CM-H2DCFDA (5 mmol/L) was prepared in DMSO and diluted to a final concentration of 1 µmol/L in 1× PBS. The cells were washed with 1× PBS followed by incubation with 50 µL of working solution of fluorochrome marker CM-H2DCFDA (final working concentration adjusted to 2.5 µg/50 µL) for 2 hours. 13,15 The cells were harvested, washed in PBS, and cell-associated 2′,7′-dichlorofluorescein (DCF) fluorescence (excitation at 485 nm and emission at 520 nm) was quantitated by flow cytometry using BD FACS Calibur (BD IS, San Jose, California).
Oxidative DNA Damage Quantification Assay
Oxidative damage-induced apurinic/apyrimidinic (AP) sites were detected using the DNA damage quantification kit (BioVision Research Products, Mountain View, California). Experiments were carried out in triplicate for time points 0 to 96 hours. The assay was performed per manufacturer’s instructions. The method is based on specific reaction of the aldehyde reactive probe (ARP) reagent with the open ring form of AP sites. Briefly, isolated genomic DNA was treated with biotin-tagged ARP reagent. Apurinic/apyrimidinic sites in the DNA were then quantified using an avidin–biotin assay. Enzyme-linked immunosorbent assay (ELISA) was performed according to the manufacturer’s instructions, and absorbance was measured at 650 nm on an ELISA reader. 16,17
8-Oxo-2′-deoxyguanosine ELISA
The levels of 8-oxo-2′-deoxyguanosine (8-oxo-dG) in culture supernatant were determined using a competitive immunoassay kit (Trevigen, Inc, Gaithersburg, Maryland). Experiments were carried out in triplicate for time points 0 to 96 hours. The kit uses an anti 8-oxo-dG monoclonal antibody, which is highly specific for 8-oxo-dG. The ELISA was performed according to the manufacturer’s instructions except primary antibody incubation done overnight at 4°C. 13,15
Estimation of Glutathione Reductase and Superoxide Dismutase Activities
Briefly, HPDE-6 cells (2.5 × 10⁶) were harvested by incubation in trypsin–EDTA, counted, centrifuged (250g for 10 minutes at 4°C), and washed with ice-cold PBS. For time points 0 to 96 hours, 3 independent experiments were carried out. Cells were sonicated for 10 seconds, incubated on ice for 5 minutes, and centrifuged (12 000g for 5 minutes at 4°C). The total glutathione reductase (GR) activity was measured using the GR Assay Kit (Trevigen). The assay was performed according to the manufacturer’s protocol, and values expressed as mU/mL. 18,19
The superoxide dismutase (SOD) assay was performed per manufacturer’s protocol using the SOD kit procured from Trevigen, Inc. Protein extract of 50 μg was used for the assay. Briefly, SOD reaction buffer was mixed with xanthine solution followed by nitroblue tetrazolium solution, the sample proteins isolated were added, and the absorbance was set to 0 at 550 nm. Finally, xanthine oxidase solution was added to each sample and readings were taken at 550 nm every 30 seconds for a period of 5 minutes. The total SOD activity was calculated based on the manufacturer’s formula and expressed as mU/mL as illustrated in the earlier studies. 20
Relative Quantitation of Mitochondrial DNA–Nuclear DNA Ratio
Quantification of mitochondrial DNA (mtDNA) was evaluated using a real-time polymerase chain reaction (PCR) protocol. 15,16 DNA was isolated using mtDNA isolation kit (BioVision). Three independent experiments were carried out for time points 0, 6, 24, 48, 72, and 96 hours. In brief, 2 pairs of primers were designed and used for relative quantification of mtDNA content: 1 pair for the amplification of the mitochondrial nicotinamide adenine dinucleotide dehydrogenase ortholog 1 (MT-ND1) gene (ND1-F, 5′-CCCTAA AACCCGCCACATCT-3′; ND1-R, 5′-GAGCGATGGTGAGAGCTAAGGT-3′) in mtDNA and another for the amplification of the single-copy nuclear gene human β-actin from the TIB MOLBIOL Universal Probe Library (Berlin, Germany). The data were expressed as the ratio of the mean mtDNA value of the triplicate measurements to the mean nucleosomal DNA (nDNA) value (β-actin) of the triplicate measurements for a given sample (mtDNA/β-actin).
Mitochondrial Enzyme Activity
Mitochondrial extracts were obtained using a commercial kit (BioVision) according to manufacturer’s instructions. Briefly, cells were homogenized and centrifuged twice at 1500g for 10 minutes at 4°C. The supernatant was removed and centrifuged at 10 000g for 10 minutes. The pelleted material (mitochondria) was washed 3 times, resuspended in 10 mmol/L Tris-HCl (pH 7.4) containing 10 mmol/L KCl, 0.25 mol/L sucrose, and 5 mmol/L MgCl2. Protein concentrations were measured using Bradford assay. Measurement for enzyme activity of individual mitochondrial respiratory chain complexes was performed spectrophotometrically at 37°C in a cuvette containing 1 mL of medium. We evaluated complex II (succinate ubiquinone reductase), complex III (ubiquinol–cytochrome c reductase), and complex IV (cytochrome c oxidase) enzyme activities at 96 hours and the results were expressed as nmol/min/mg of cellular protein. 15,16
Evaluation of Inflammatory Cytokine Response
Interleukin 1 (IL-1), interleukin 6 (IL-6), tumor necrosis factor α (TNF-α), and nuclear factor κ-light-chain enhancer of activated B cells (NF-κB) protein levels in the culture supernatant were quantitatively measured by the BD CBA Human Inflammation Flex Set (BD Bioscience). Time points assayed were 0, 3, 6, 12, 24, 48, 72, and 96 hours. The operations were performed according to the manufacturer’s instructions. Data were acquired on a flow cytometer and analyzed using BD CBA software. The concentration range for detection using this assay is 20 to 5000 pg/mL for each proteins. 21,22
Immunocytochemistry
For the assessment of histone modifications, immunolabeling of phosphorylated H2AX (γ-H2AX) and phosphorylated histone 3 (phospho-H3), methylated histone 3 at lysine 9 (H3K9) and histone 4 at lysine 20 (H4K20), acetylated H3 and H4, and ubiquitinated H2A and H2B was performed using antibodies procured from Merck-Millipore (Billerica, Massachusetts). Briefly, cells were grown overnight on coverslips in DMEM and subjected to treatment from 0 to 96 hours. The cells were fixed with 10% formaldehyde for 1 hour, permeabilized with 0.1% Triton-X-100 for 30 minutes, blocked with 3% bovine serum albumin (BSA) for 3 hours, and incubated with antiphospho-H2AX (1:250), antiphospho-H3 (1:500), antimonomethylated H3K9 (anti-H3K9me1 [dilution 1:5000]), antitrimethylated H4K20 (anti-H4K2me3 [dilution 1:5000]), and antiubiquitinated H2A/H2B (1:5000) primary antibodies diluted in 0.5% BSA for 3 hours at 37°C in a humidified chamber. Fluorophore-conjugated secondary immunoglobulin G (IgG) antibodies (fluorescein isothiocyanate [FITC] green/Tx Red/Cy3 Orange/Alexa-Fluor-532 (dilution 1:200)] were applied for 1 hour followed by washing in 0.1% PBS with Tween 20. The nuclear and cytoskeletal counterstaining with 4′,6′-diamidino-2-phenylindole dihydrochloride (DAPI) and phalloidin (red/green) were performed, respectively, and immediately mounted with antifade solution (Vectashield Mounting Media; Vector Laboratories). Cover slips were affixed to glass slides and representative photomicrographs were acquired through bioimaging system and analyzed with spectral imaging 4.0 software (Applied Spectral Imaging). For the quantification and kinetics measurement of γ-H2AX, phospho-H3, H3K9me1, H4K20me3, and ubiquitinated H2A/H2B proteins by flow cytometry, an indirect immunofluorescence method was followed. For primary antibodies, same ratio of dilution as outlined previously was used. For secondary labeling, fluorophore-conjugated IgG antibodies (FITC green) was used in 1:200 ratio. The immune-stained cells were then sorted through flow cytometer in FL1 channel. Cell-associated fluorescence was analyzed for 10 000 total events. 23,24
Western Blot
Analysis of acetylated forms of histones (H3 and H4) proteins and expressions levels of p16 and SMAD4 proteins were measured by immunoblotting (Western blot) as presented earlier. 25 Quantitation of signals was performed by Quanti-One Software (Bio-Rad, Philadelphia, Pennsylvania).
Methylation-Specific PCR for p16 and Smad4 Gene Promoters
Genomic DNA from the various samples was isolated using Wizard Genomic DNA purification kit obtained from Promega Corporation (Madison, Wisconsin). Purified DNA (2 µg) was subjected to sodium bisulfite conversion by EZ DNA Methylation kit (Zymo Research, Irvine, California). Following bisulfite conversion, amplification of the promoter regions of the p16 and smad4 genes by methylation-specific PCR was carried out using a thermocycler (Bio-Rad, Hercules, California). Briefly, a 50-µL PCR reaction mixture contains 2 µL of bisulfite-treated genomic DNA, deoxynucleotide triphosphates (each at 200 mmol/L), primers (50 pmol each per reaction), 2.5 mmol/L MgCl2, and 1.25 U Taq (Life Technologies Co) in 1× PCR buffer. The cycling conditions were as follows: initial denaturation and hot start at 95°C for 15 minutes, then 40 cycles consisting of 30 seconds at 95°C, 30 seconds at 60°C (unmethylated reactions) or 65°C (methylated reactions), and 1 minute at 72°C followed by a final 5 minutes extension at 72°C. Positive and negative control DNA samples and controls without DNA were used for each set of PCRs. Oligonucleotide primers were designed from Integrated DNA Technologies (Coralville, Iowa) to amplify fully methylated bisulfite-converted DNA within the intronic p16 CpG island. The sequences of the bisulfite-converted methylated p16 gene-specific primers p16MF and p16 MR and bisulfite-converted unmethylated version of p16 gene-specific primers p16UF and p16UR were used as described earlier. 26 Likewise, a similar strategy was applied for smad4 promoter hypermethylation studies. Promoter hypermethylation or unmethylation was detected as gains and losses of specific bands following analysis of the PCR products on 8% nondenaturing polyacrylamide gels containing 5% glycerol using a gel documentation system (UVP, Upland, California).
Micro-RNA Assay
Briefly, micro-RNA (miRNA) was isolated from the cells using miRNeasy mini kit (Qiagen, Valencia, California). Expression levels of miRNA molecules specific for pancreatic cancer, miR-21, miR-34a, miR-133a, miR-155, miR-196a, miR-196b, miR-216, miR-217, miR-221, miR-222, miR-301, miR-376a, and RNU48 were measured in relative light units using miRNA microplate assay in accordance with manufacturer’s instructions (Signosis, Sunnyvale, California).
Statistical Analysis
The results are represented as the mean ± standard error. Statistical differences between the studied groups were calculated using Student t-test or analysis of variance. Analysis was performed using the SPSS Inc (Chicago, Illinois) and P value of ≤.05 established statistical significance.
Results
Mitochondrial-Mediated Apoptosis
Prooxidant exposure of HPDE-6 cells resulted in loss of mitochondrial membrane potential (ΔΨ) with maximum depolarization (16.52 ± 1.15) observed at 24 hours time point. Similarly, caspase 3 activity increased to statistically higher levels (P ≤ .01) following 24 hours treatment in HPDE-6 cells with respect to controls (Figure 1). Our results, therefore, indicate that apoptosis induced by N-succinimidyl N-methylcarbamate treatment is possibly mediated through mitochondria, suggesting an impairment of mitochondrial–nuclear cross talk.
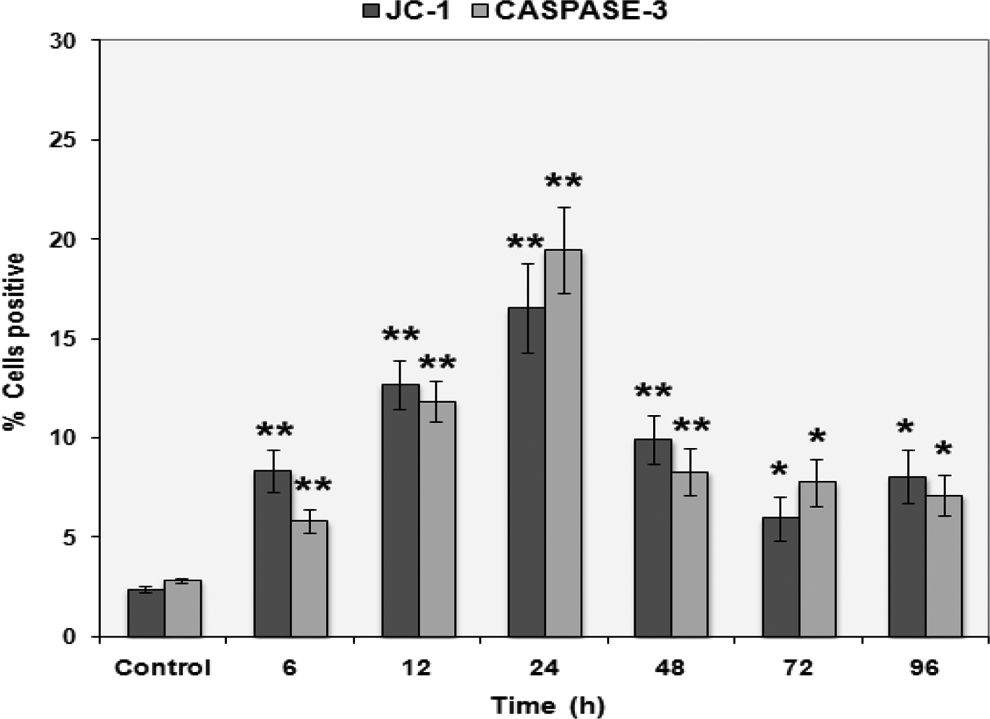
N-Succinimidyl N-methylcarbamate activates mitochondrial-mediated apoptosis in HPDE-6 cells. Quantitative assessment of JC-1 and active caspase 3 by flow cytometry in HPDE-6 cells prior to (control) and following treatment with 0.005 µmol/L N-succinimidyl N-methylcarbamate. Columns represent mean ± standard error (SE; n = 3) showing percentage of positive cells. *P < .05; **P < .01 was considered statistically significant. HPDE-6 indicates human pancreatic ductal epithelial.
Levels of Intracellular ROS
Oxidative stress is triggered by generation of intracellular ROS and we measured this phenomenon in terms of DCF oxidation (marked by DCF fluorescence). We found that in comparison to untreated and parallel controls that exhibited no change, there was increased generation of ROS (H2O2) in treated cells as marked by increased DCF fluorescence after 12 and 24 hours of treatment (Figure 2A). These results were further supported by quantitative analysis through flow cytometry with logarithmic shift in peak toward cells with maximum DCF fluorescence observed at 24 hours (Figure 2B).
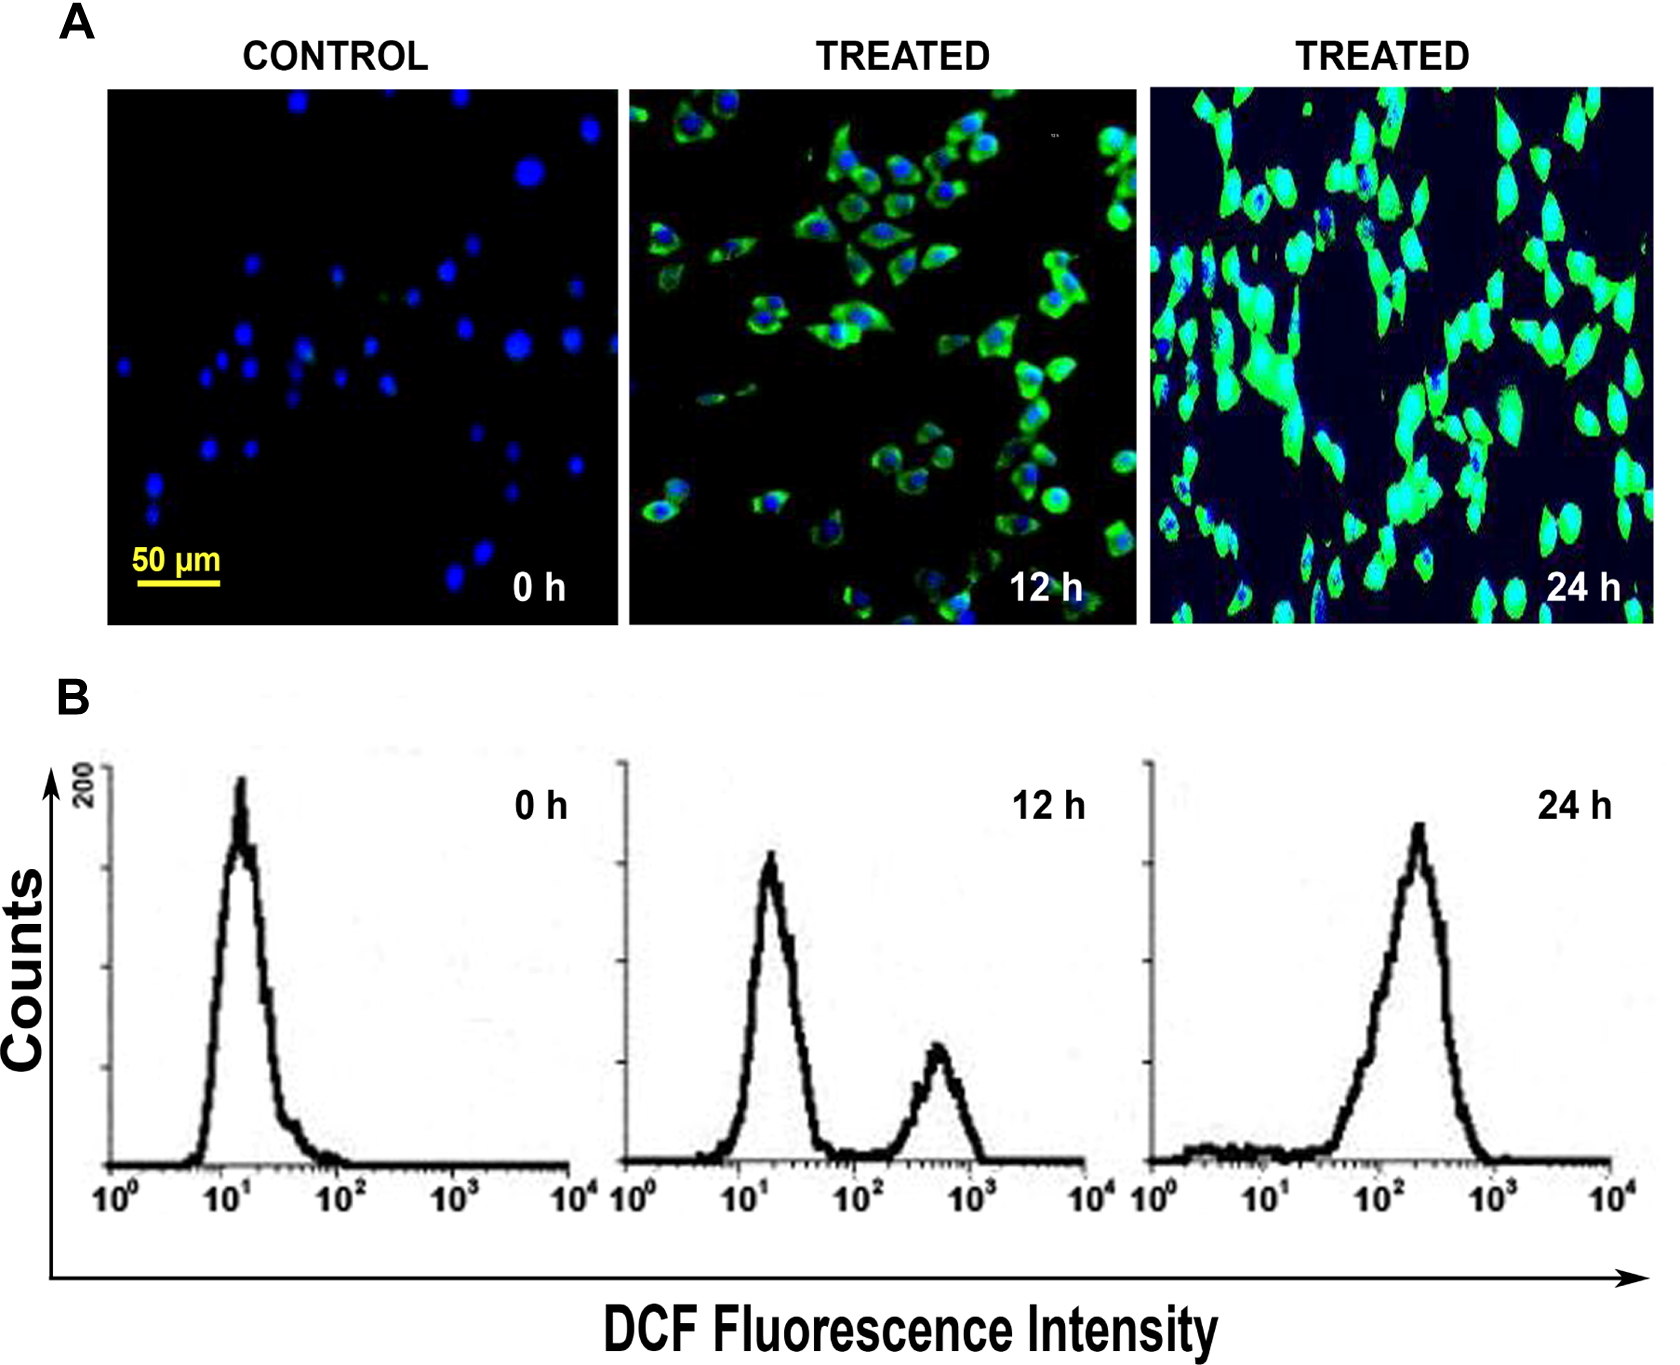
Induction of intracellular ROS in HPDE-6 cells following treatment with N-succinimidyl N-methylcarbamate. A, Representative microphotographs (×200) showing production of ROS as depicted by increased 2′,7′-dichlorofluorescein (DCF) fluorescence (green) along the time points at 12 and 24 hours in treated HPDE-6 cells in contrast to untreated control. Nuclei are counterstained with 4′,6′-diamidino-2-phenylindole dihydrochloride (DAPI). B, Flow cytometric analysis (n = 3) showing relative increase in fluorescence intensity at 12 and 24 hours posttreatment. HPDE-6 indicates human pancreatic ductal epithelial; ROS, reactive oxygen species.
Oxidative Damage
8-Oxo-2′-deoxyguanosine is a modified nucleoside base, which is the most commonly detected by-product of DNA damage. Aldehyde reactive probe, a marker for oxidative DNA damage, reacts specifically with an aldehyde group, which is the open ring form of the AP sites on the damaged DNA. In contrast to control (23.34 ± 8.58 ng/mL), time-dependent increase in 8-oxo-dG formation was observed in treated cells, with maximum value 154.03 ± 11.21 ng/mL recorded at 96 hours. In treated cells, the number of ARP sites formation in DNA per 105 base pairs increased along the time course with maximum amounts of 73.07 ± 13.64 per 105 base pairs after 96 hours while control levels were 2.91 ± 0.67 (Figure 3A).
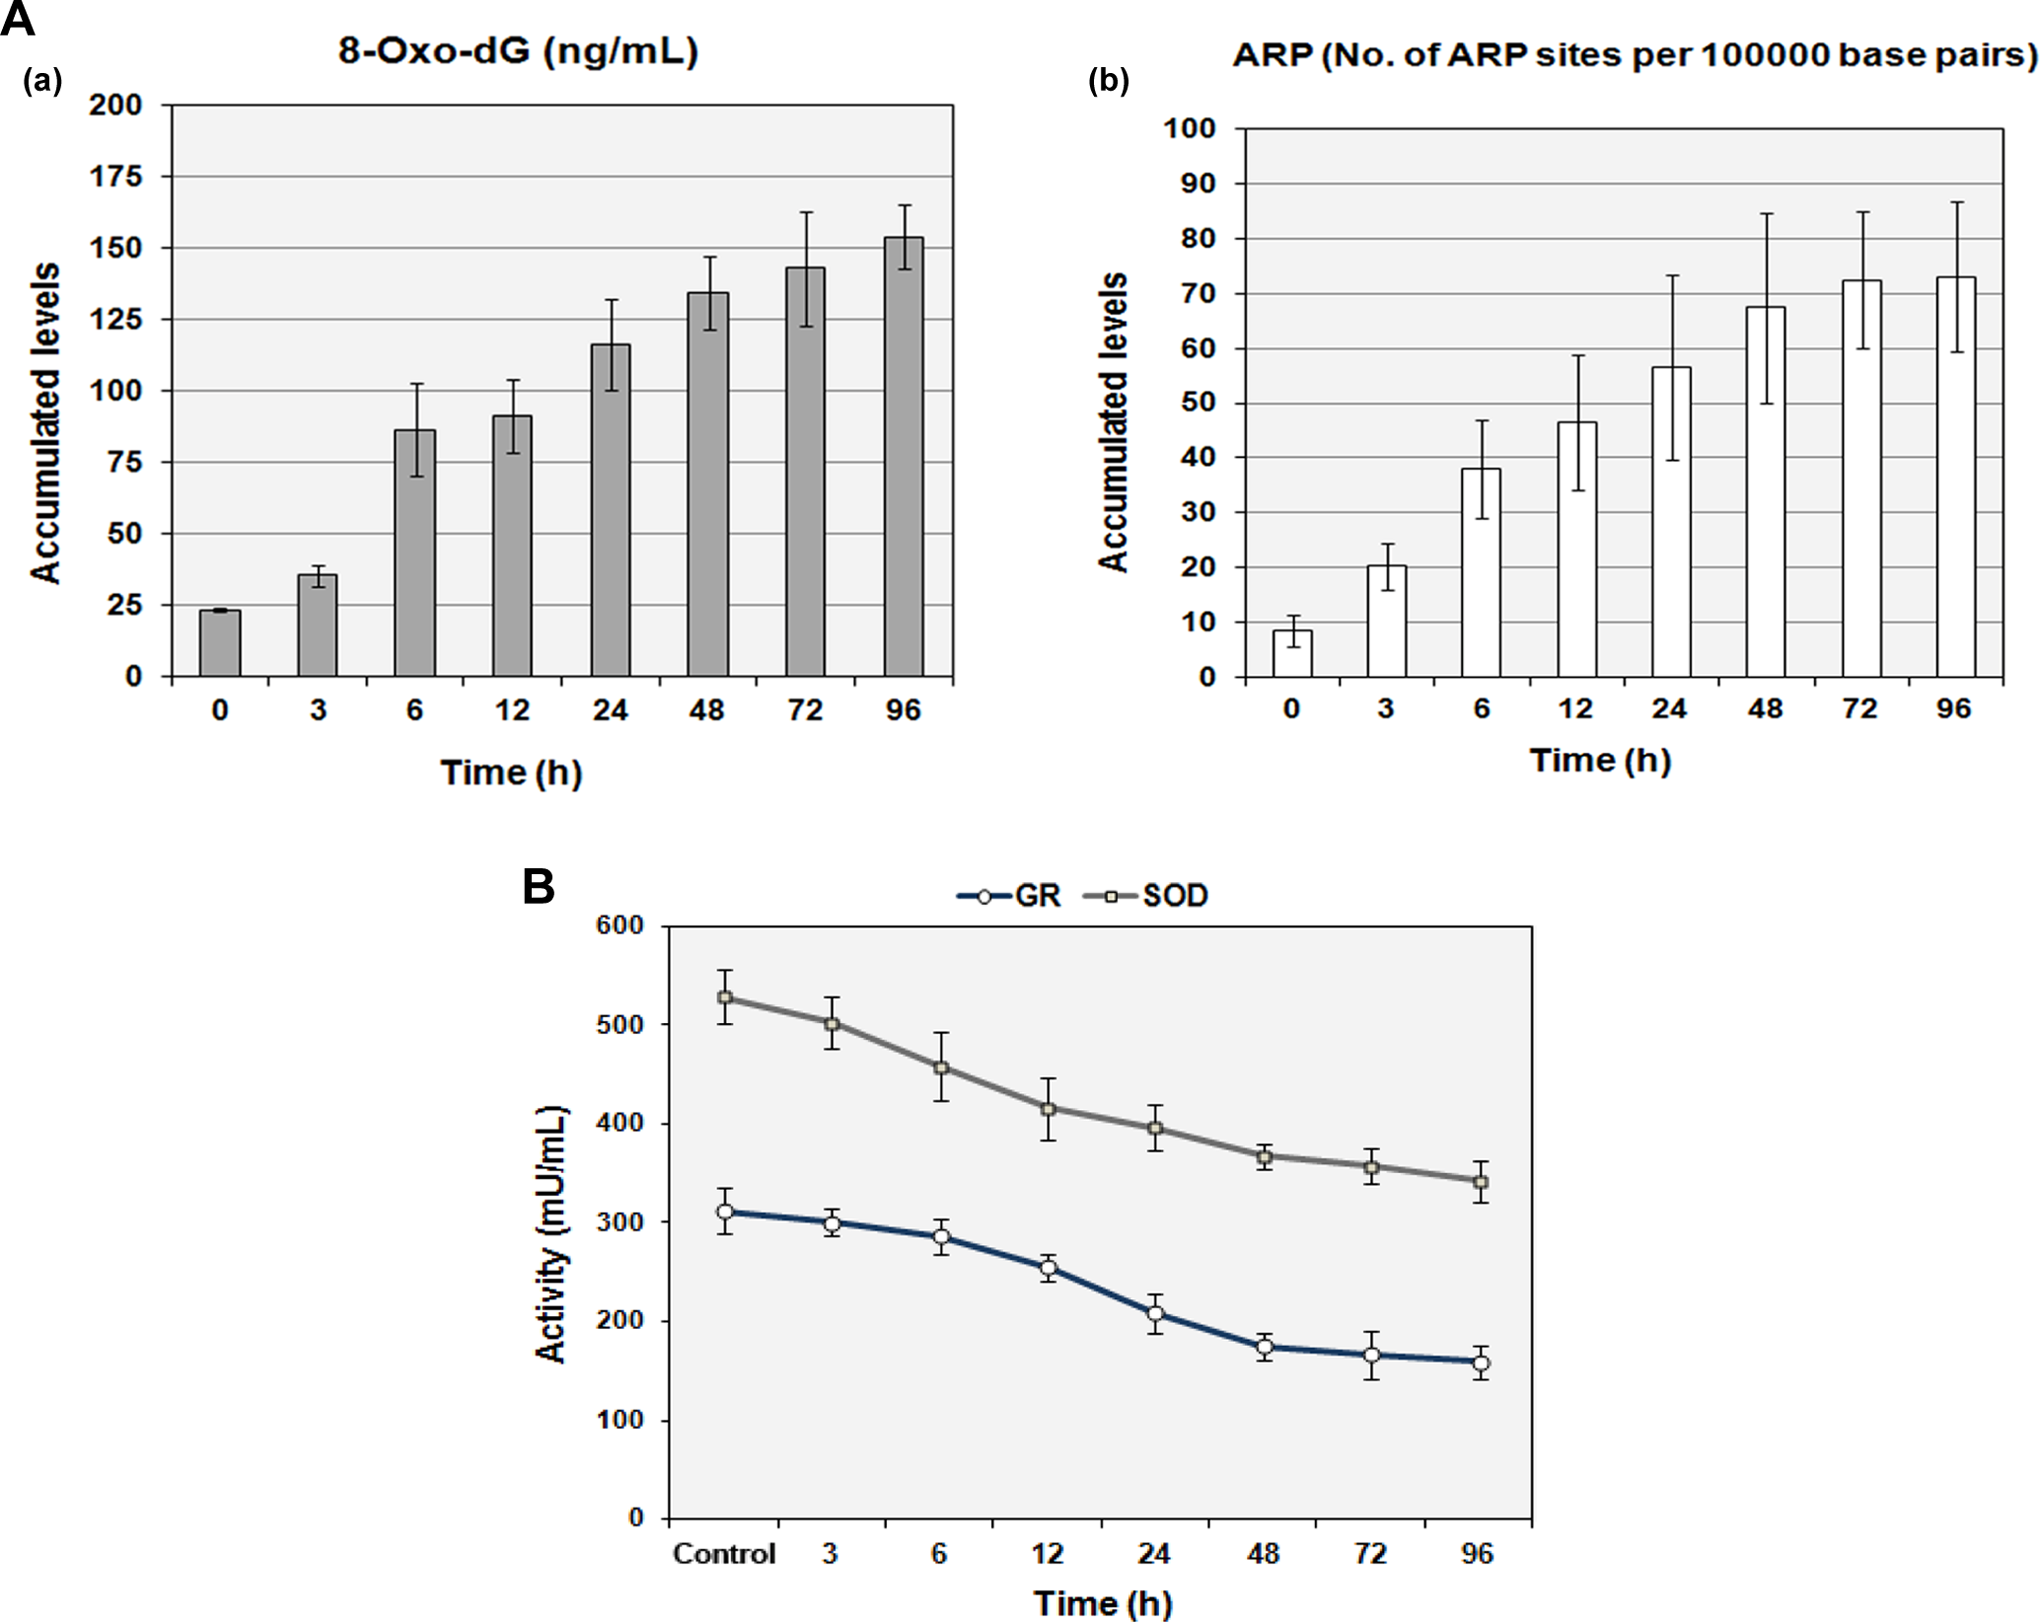
N-Succinimidyl N-methylcarbamate triggers oxidative DNA damage and depletion of antioxidant defense in treated cells. a, Representative histograms measuring oxidative damage by means of 8-oxo-dG (8-oxo-2′-deoxyguanosine) formation and increased binding of aldehyde reactive probe (ARP) to the apurinic/apyrimidinic (AP) sites. Values are expressed as mean ± SE (n = 3) for time-dependent response of human pancreatic ductal epithelial (HPDE-6) cells to oxidative damage observed from 3 to 96 hours posttreatment. b, Graphical representation of depleted antioxidant defense machinery enzymes, glutathione reductase (GR), and superoxide dismutase (SOD) levels in treated cells as compared to controls at different time points of 3, 6, 12, 24, 48, 72, and 96 hours. Bars represent mean ± SE (n = 3) values. SE indicates standard error.
Antioxidant Defense Enzymes
Decreased levels of SOD and GSH are considered as characteristic feature of oxidative damage in pancreatic disorders. 27 Simultaneous measurement of intracellular antioxidant defense system enzymes GR and SOD levels showed a gradual declining activity in treated cells with utmost suppression observed at 96 hours. The mean value for GR activity in the treated cells was 159.32 ± 17.02 mU/mL (96 hours), whereas for SOD it was 342.07 ± 20.94 mU/mL (96 hours). In contrast, values of GR and SOD activity in controls were 312.09 ± 23.01 and 528.58 ± 27.44 mU/mL, respectively (Figure 3B).
Mitochondrial DNA Content
Alterations in mtDNA are believed to play a role in carcinogenesis. 28,29 In the present study, mtDNA content, evaluated by a quantitative PCR approach, showed a gradual decline till 96 hours posttreatment with N-succinimidyl N-methylcarbamate. The mtDNA–nDNA ratio depleted from 0.56 ± 0.082 observed in controls to 0.26 ± 0.044 recorded at 96 hours following treatment (Figure 4).
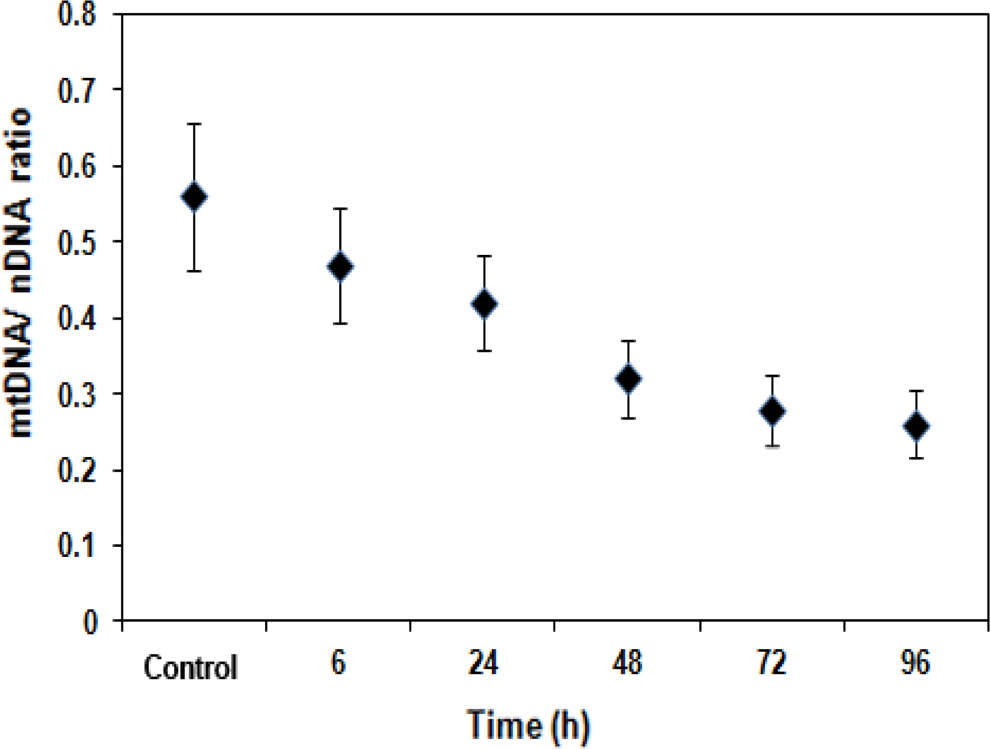
Reduction in mitochondrial DNA content in treated human pancreatic ductal epithelial (HPDE-6) cells. Evaluation of mtDNA/nucleosomal DNA (nDNA) ratio (n = 3) in control and treated HDPE-6 cells. The mtDNA content was quantitated as the ratio between mean mtDNA (ND1) and mean nuclear DNA value (β-actin) derived from triplicate measurements. Values are expressed as mean ± standard error (SE). mtDNA indicates mitochondrial DNA.
Mitochondrial Enzyme Activity
Mitochondria are thought to play a central role in cellular bioenergetic process. Measurement of individual enzymatic activities of complexes II, III, and IV of the mitochondrial respiratory chain in treated HPDE-6 cells displayed a significant decrease (P ≤ .001) in values, 69.46 ± 1.63 (complex II succinate ubiquinone reductase), 93.30 ± 1.70 (complex III ubiquinol–cytochrome c reductase), and 103.1 ± 1.2 (complex IV cytochrome c oxidase) nmol/min/mg protein versus 84.7 ± 0.92 (complex II succinate ubiquinone reductase), 126.4 ± 0.76 (complex III ubiquinol–cytochrome c reductase), and 134.0 ± 1.3 (complex IV cytochrome c oxidase) nmol/min/mg protein in controls, respectively, at 96 hours indicating an impaired electron transport chain with excessive generation of superoxide radicals (Table 1).
Mitochondrial Respiratory Chain Enzyme Levels in HPDE-6 Cells Prior to and Following Treatment With N-Succinimidyl N-methylcarbamate.a
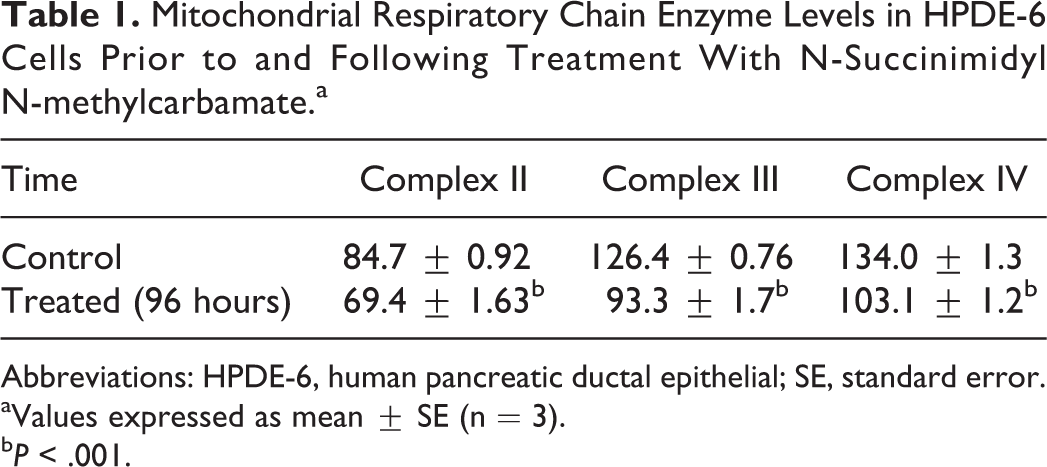
Abbreviations: HPDE-6, human pancreatic ductal epithelial; SE, standard error.
aValues expressed as mean ± SE (n = 3).
b P < .001.
Proinflammatory Cytokine Response
Nuclear translocation of NF-κB results in activation of proinflammatory cytokines thereby eliciting an inflammatory cascade. We observed an exponential rise in NF-κB expression in treated cells as early as 6 hours with maximum being at 96 hours in contrast to control. Early increase in the levels of other proinflammatory cytokines such as, IL-1, IL-6, and TNF in the treated cells suggested a NF-κB-mediated feed-forward loop in response to oxidative stress (Figure 5).
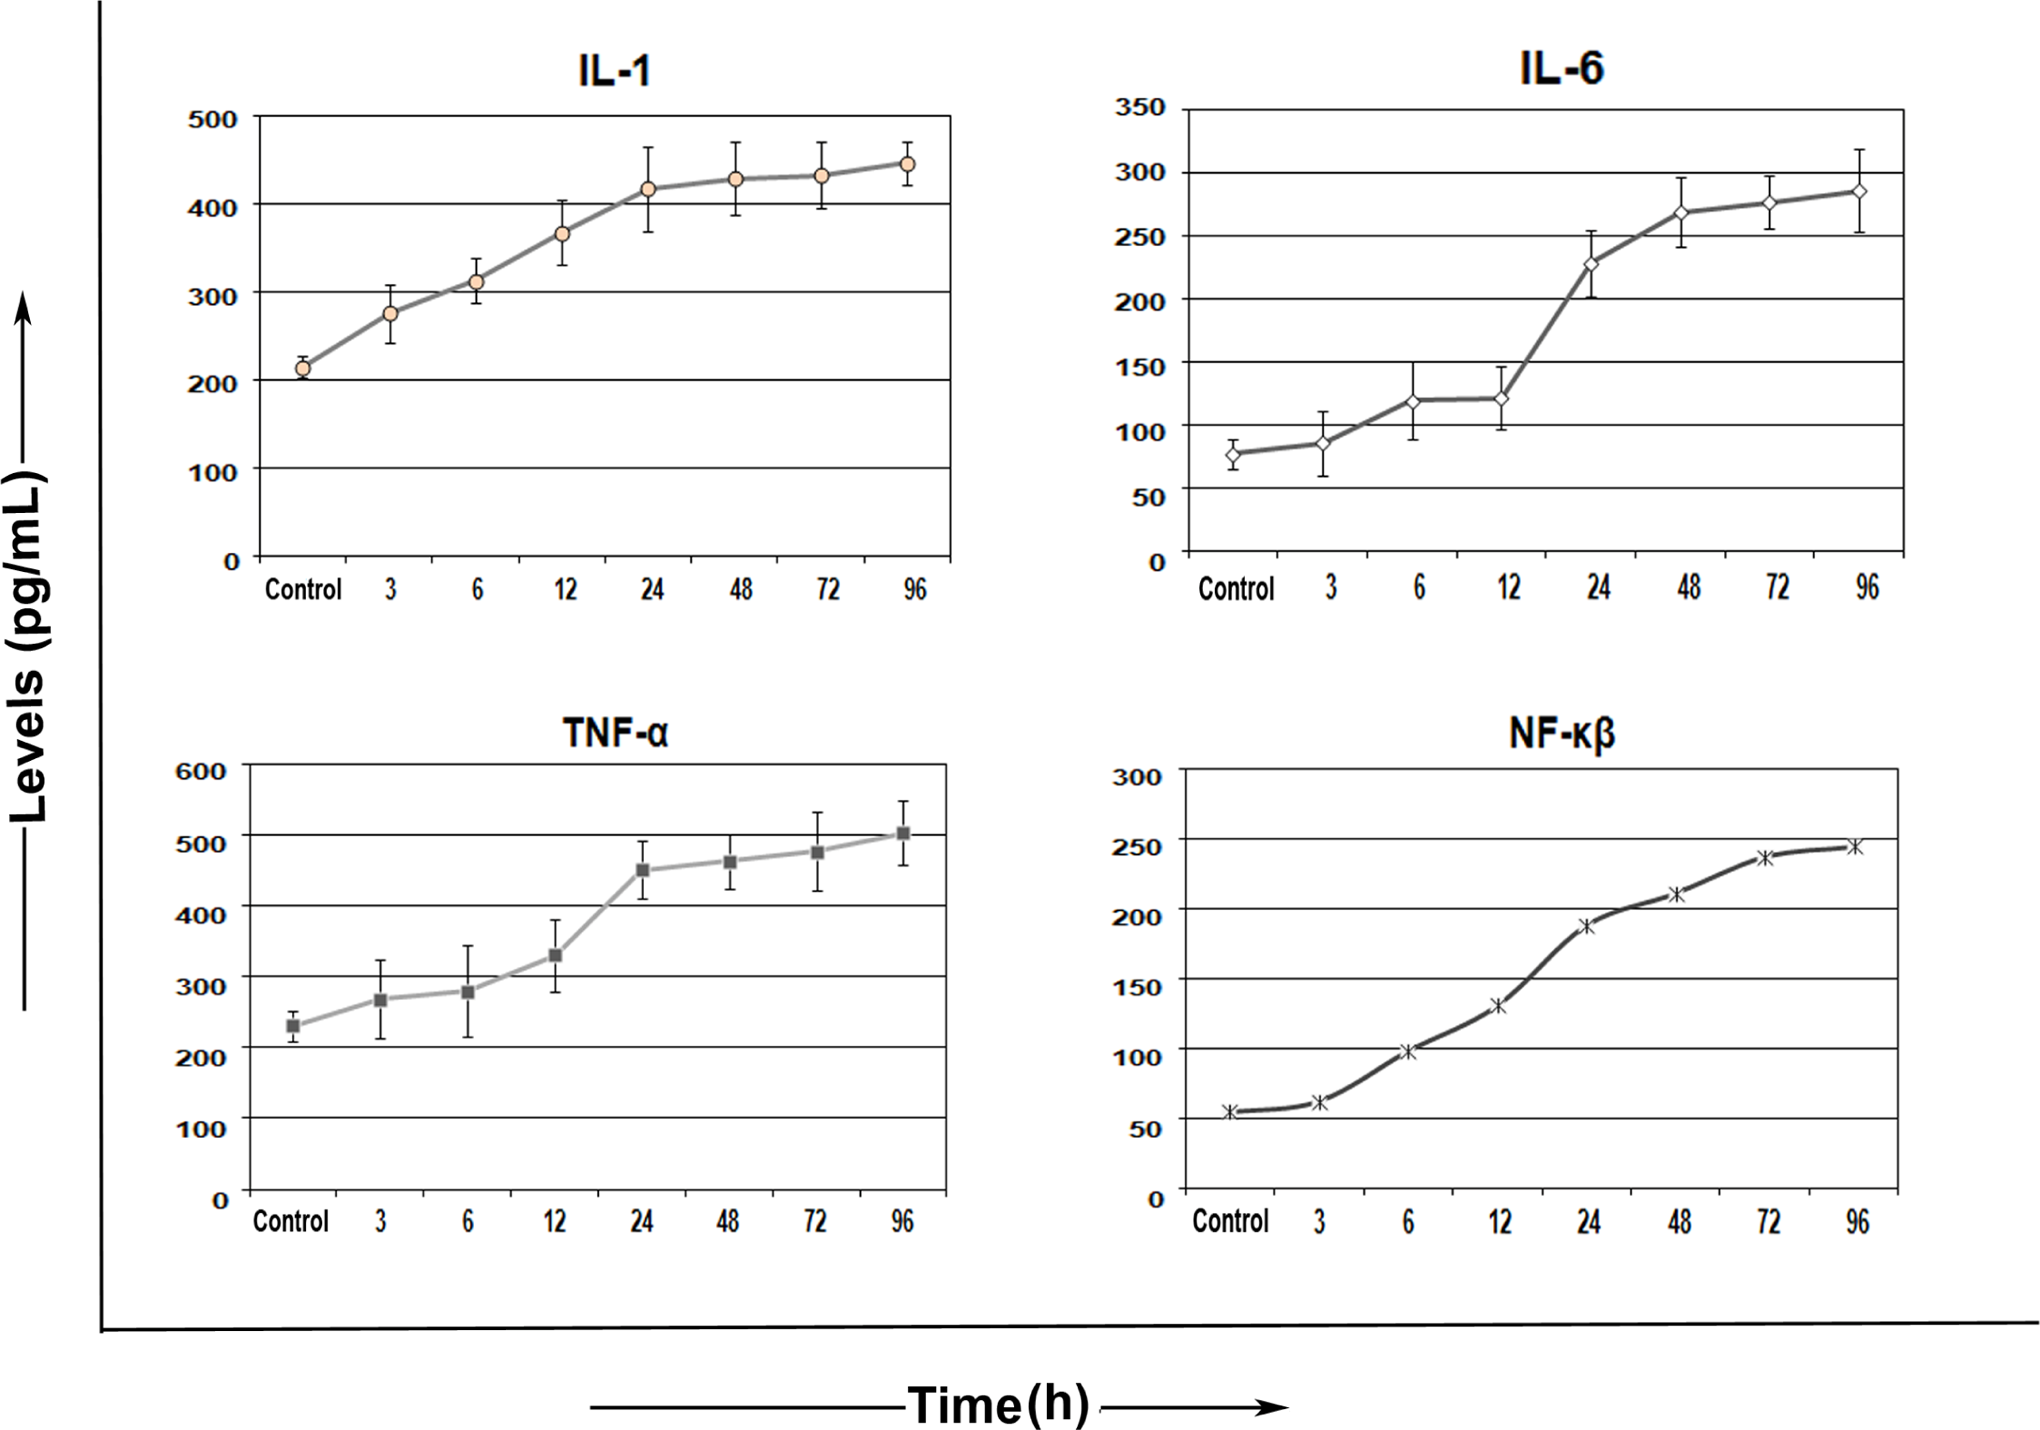
Flow cytometric evaluation of inflammatory cytokine response in HPDE-6 cells. Graph depicting time-dependent inflammatory cytokines IL-1, IL-6, tumor necrosis factor (TNF) response, and nuclear factor κB (NF-κB) response in HPDE-6 cells following treatment at 12, 24, 48, 72, and 96 hours, respectively. All data are presented as the mean ± standard error (SE; n = 3). HPDE-6 indicates human pancreatic ductal epithelial; IL, interleukin.
Aberrant Histone Modifications
To determine whether oxidative stress following N-succinimidyl N-methylcarbamate treatment alters the epigenetic marks on histones, we studied various posttranslational histone modifications in HPDE-6 cells.
Histone Phosphorylation
Indirect immunolocalization studies in N-succinimidyl N-methylcarbamate-treated cells revealed that histones H2AX and H3 underwent modifications in the form of phosphorylation at Ser 139 and Ser 10. In response to the resultant oxidative stress, we observed an increased accumulation of phospho-H2AX (γ-H2AX) foci as early as 1 hour (49.7% ± 1.26% cells; P < .001) while punctuated form of phospho-H3 foci (38.03 ± 2.07) were observed at 3 hours posttreatment in contrast to controls (P < .01; Figure 6A).
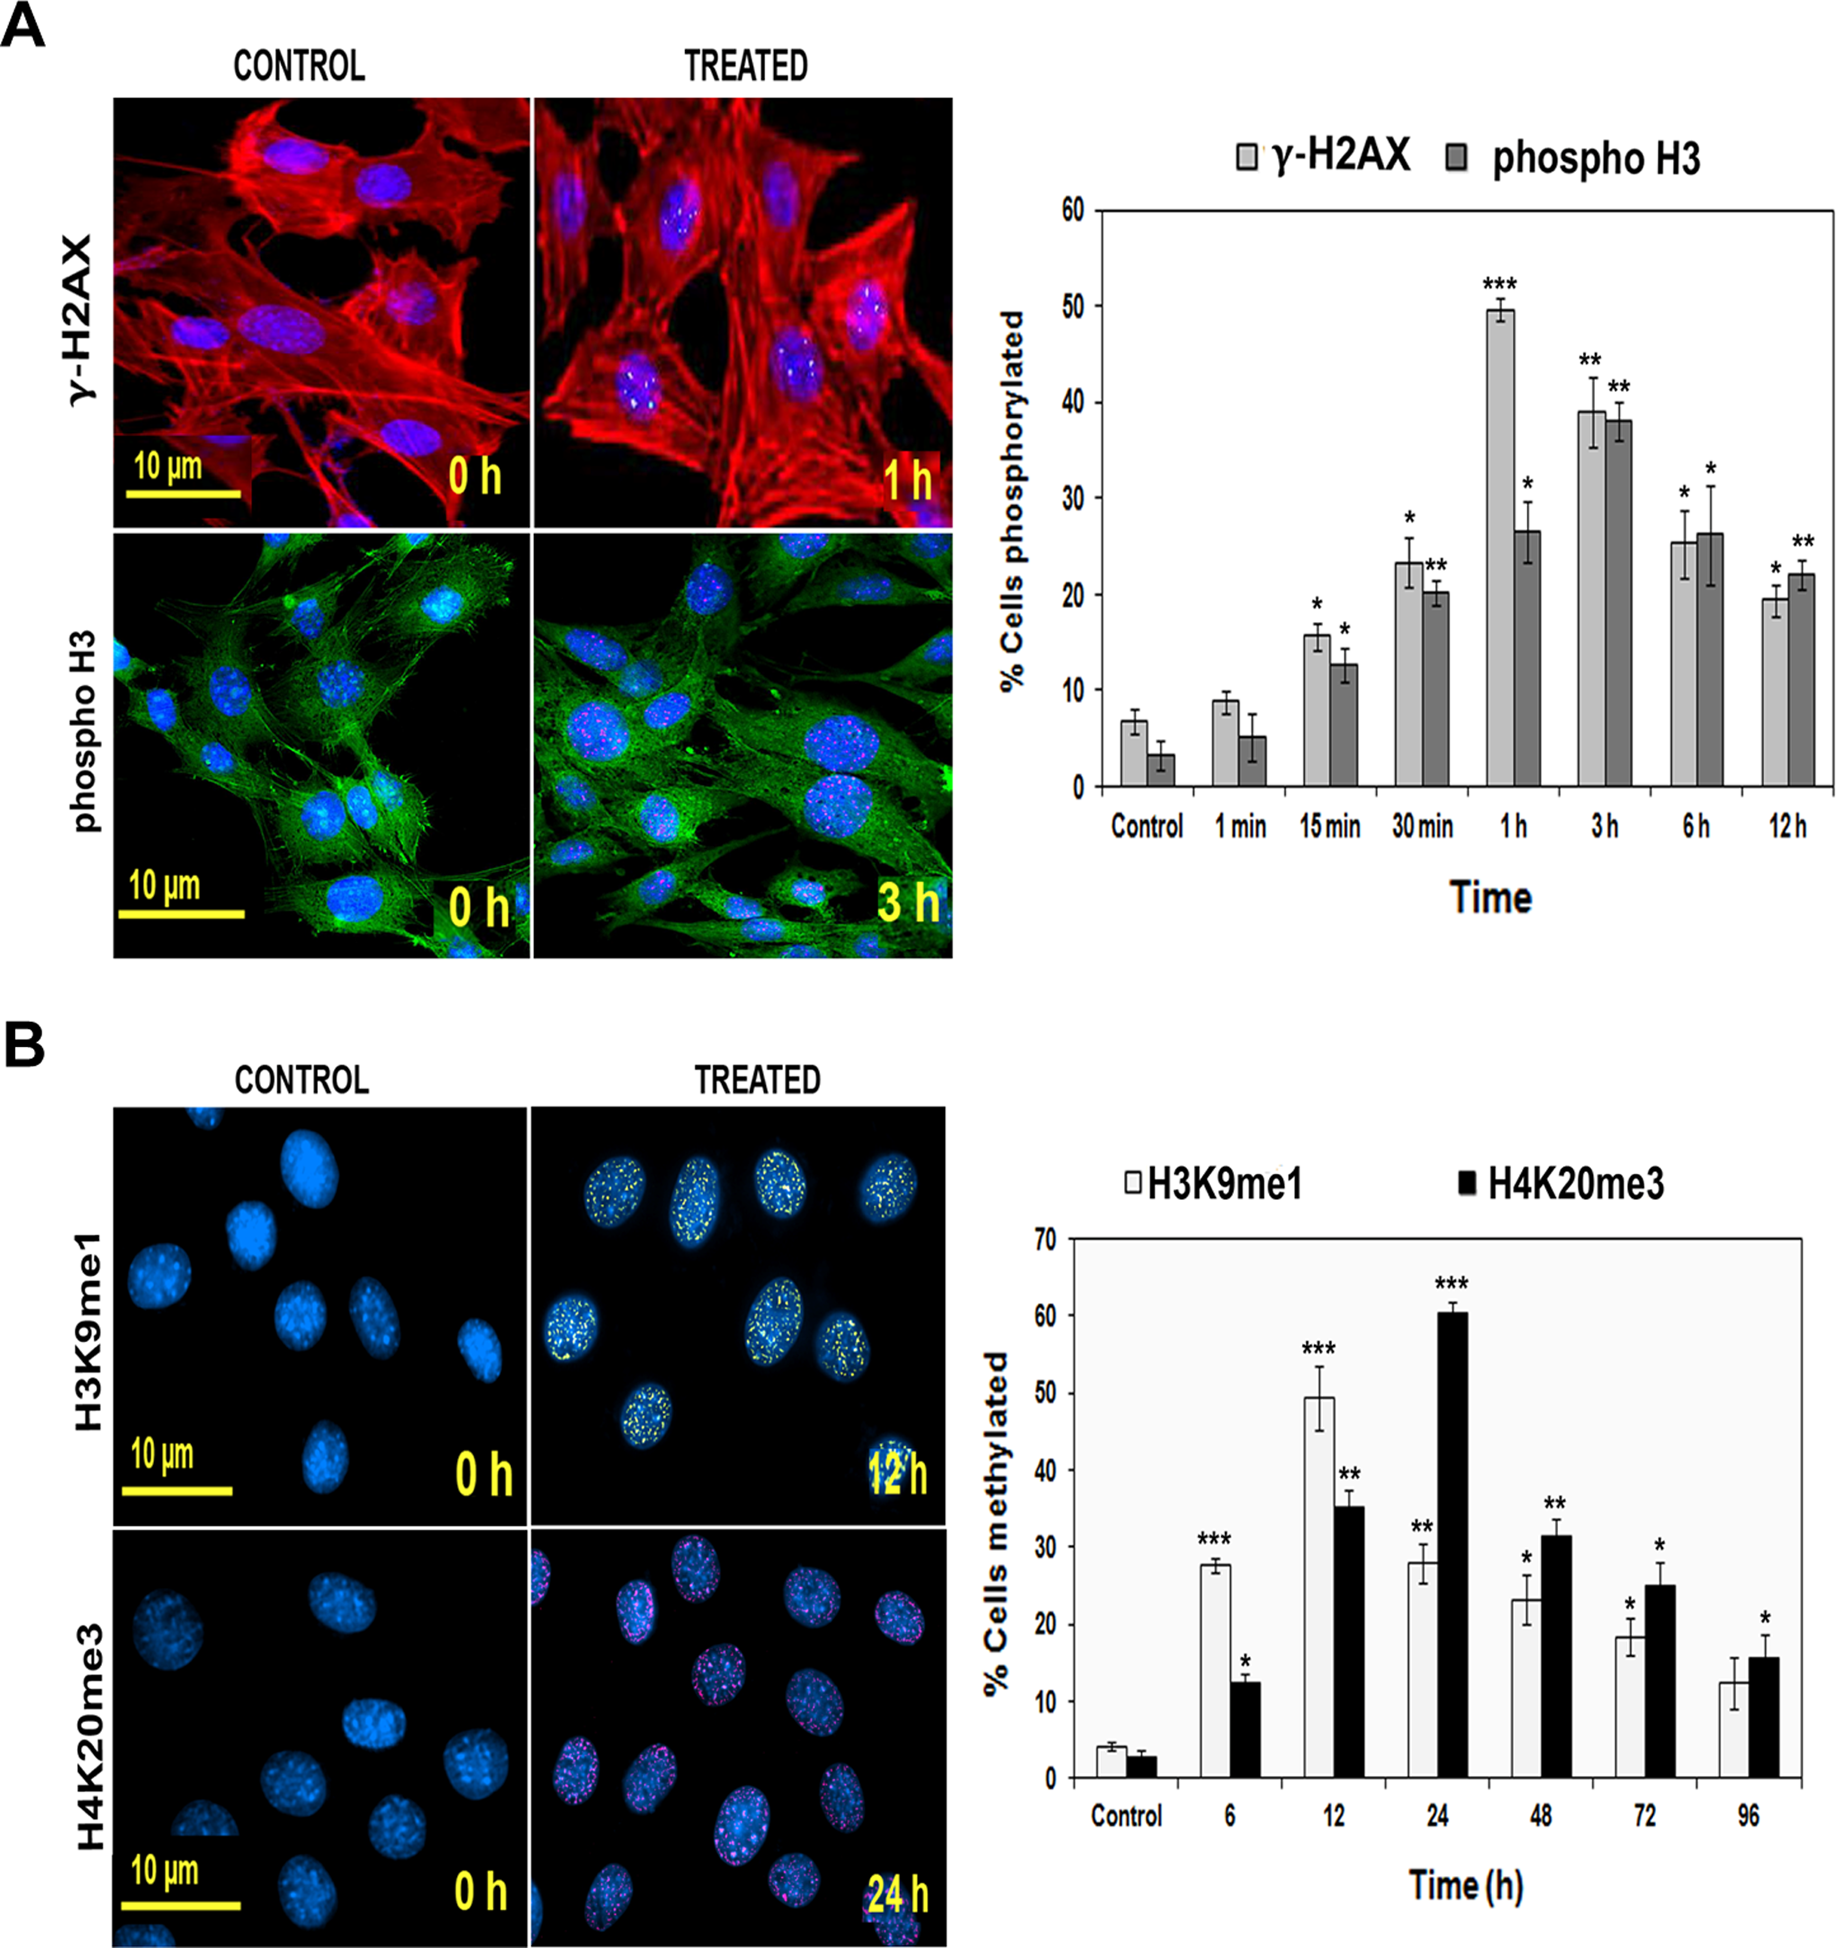
A, Histone phosphorylation in HPDE-6 cells prior to and following treatment with N-succinimidyl N-methylcarbamate. a, Microphotographs (×200) showing immunofluorescence analysis of histone H2AX phosphorylation (γ-H2AX, Ser 139) and H3 phosphorylation (phospho-H3, Ser10) states. Untreated (control) and cells treated for 1 and 3 hours were stained with antibody specific for γ-H2AX (fluorescein isothiocyanate [FITC] green signal]/histone phospho-H3 (Texas red signal). Cytoskeleton was stained with phalloidin (red for γ-H2AX and green for phospho-H3) and nucleus with 4′,6′-diamidino-2-phenylindole dihydrochloride (DAPI). Significant punctated nuclear patterns were observed in treated cells. b, Flow cytometric analysis showing percentage of cells phosphorylated in both cases (γ-H2AX and phospho-H3) along the time course of 1 minute to 12 hours. *P < .05; **P < .01; and ***P < .001. B, Histone methylation in control and treated HPDE-6 cells. a, Representative immunofluorescence microphotographs (×400) showing increased histone H3 monomethylation at lysine 9 (H3K9me1) and histone trimethylation at lysine 20 (H4K20me3) in HPDE-6 cells before (untreated control) and after treatment, respectively. A distinct interspersed pattern of H3K9me1 (Cy3 yellow) and H4K20me3 (rhodamine) foci was observed in the nuclei of all the treated cells in comparison to their corresponding untreated controls at 12 and 24 hours, respectively. Nuclei were counterstained with Hoechst 33258. b, Histograms illustrating significant percentage of cells positive for H3K9me1 and H4K20me3 at different time intervals of 6, 12, 48, 72, and 96 hours through FACS analysis. *P < .05; **P < .01; and ***P < .001. C, Oxidative stress causes increased histone ubiquitination in HPDE-6 cells. a, Immunofluroescence analysis through spectral imaging system showed treated HPDE-6 nucleus stained with 4′,6′-diamidino-2-phenylindole dihydrochloride (DAPI; blue) has punctuate pattern of ubiquitinated proteins uH2A (cyanine orange) and uH2B (fluorescein isothiocyanate [FITC] green) signals. b, Quantitative evaluation of percentage of cells ubiquitinated for H2A and H2B by flow cytometry showed time-dependent increase in uH2A and uH2B at 72 and 96 hours, receptively. *P < .05; **P < .01; and ***P < .001. HPDE-6 indicates human pancreatic ductal epithelial; uH, ubiquitinated histone.
Histone Methylation
Histone lysine methylation, depending on the specific site and degree (ie, mono-, di-, or tri-) of methylation within the histone sequence, has been shown to correlate with gene expression both positively and negatively. Thus, it was of interest to study the steady state levels of H3K9 monomethylation and trimethyl H4K20 in treated cells. The data shown in Figure 5 demonstrate that the treatment resulted in an aberrant expression of monomethylated H3K9 protein at 12 hours and trimethyl H4K20 at 24 hours in comparison to control cells. Flow cytometric analysis further showed the rise in the percentage of cells expressing monomethyl H3K9 and trimethyl H4K20 forms of histones utmost at 12 hours (P < .001) and 24 hours (P < .001; Figure 6B).
Histone Ubiquitination
Histone ubiquitination predominantly occurs on the K119 of H2A as ubiquitinated histone (uH) 2A and K120 of H2B as uH2B resulting in the binding of ubiquitin protein to carboxyl terminal chain of H2A and H2B. In treated cells, the levels of treatment induced uH2A and uH2B foci formation utmost at 72 hours (65.2% ± 6.2% cells) and 96 hours (52.4% ± 1.02% cells), respectively, as compared to controls (P < .001; Figure 6C).
Histone Acetylation
The acetylation and deacetylation status of histones is vital for the dynamics of chromatin remodeling and gene transcription, deregulation of which has a well-established link to cancer. In comparison to control cells, treated cells showed decrease in acetylation of histones H3 and H4 proteins with highest effect seen at 72 hours (P < .05; Figure 7).
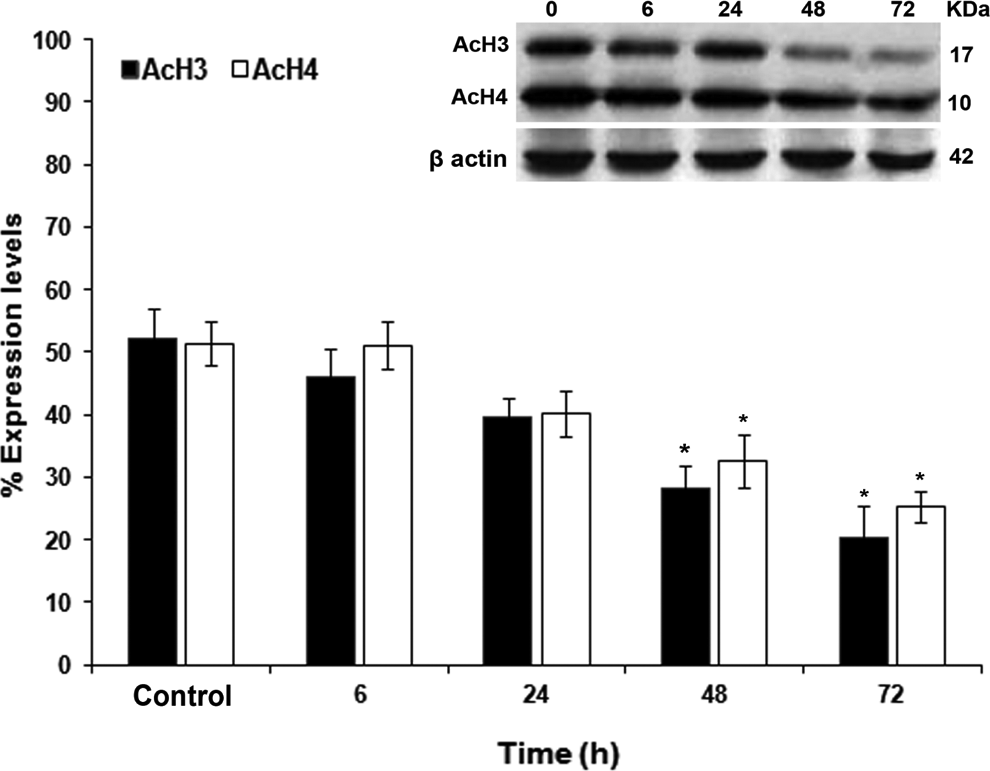
Histone acetylation in control and treated HPDE-6 cells. Oxidative stress-induced decreased acetylation of histones in HPDE-6 cells at 6, 24, 48, and 72 hours. Western blotting with antibodies against pan acetylated H3 (acH3) and pan acetylated H4 (acH4) showed diminution in their expression down the time points with maximum effect seen at 72 hours. Blots represent mean of 3 independent experiments (n = 3). The histograms values shown are quantitative results (percentage of expression levels) measured by QuantiOne Software band density analysis (Bio-Rad) and are expressed relative to the control. The cells were observed from 0 (control) to 72 hours, and blots were probed with β-actin as loading control. *P < .05. HPDE-6 indicates human pancreatic ductal epithelial.
Promoter CpG Islands Methylation
Promoter methylation status plays a key role in tumor suppression. Aberrant methylation of cytosine in dinulceotide CpG motif in promoter region is the best categorized epigenetic change for tumor suppressor gene inactivation. In the present study, we found aberrant hypermethylation of p16 and smad4 gene promoters at 96 and 120 hours of treatment (Figures 8 and 9). However, noticeable hypermethylation at 0 hours and demethylation at 96 hours posttreatment were not observed (data not shown). On the other hand, simultaneous assessment of the protein counterparts of p16 and SMAD4 showed decrease in the percentage of expression in treated cells. Treated cells yielded 6.2% ± 0.7% for p16 at 96 hours (P < .05) and 8.5% ± 0.4% for SMAD4 at 120 hours (P < .01) in comparison to corresponding controls with 15.2% ± 1.8% for p16 and 21.8% ± 0.8% for SMAD4 (Figures 8 and 9). These results implicate the hindering of transcriptional factors from accessing the target DNA stretches leading to transcriptional gene silencing.
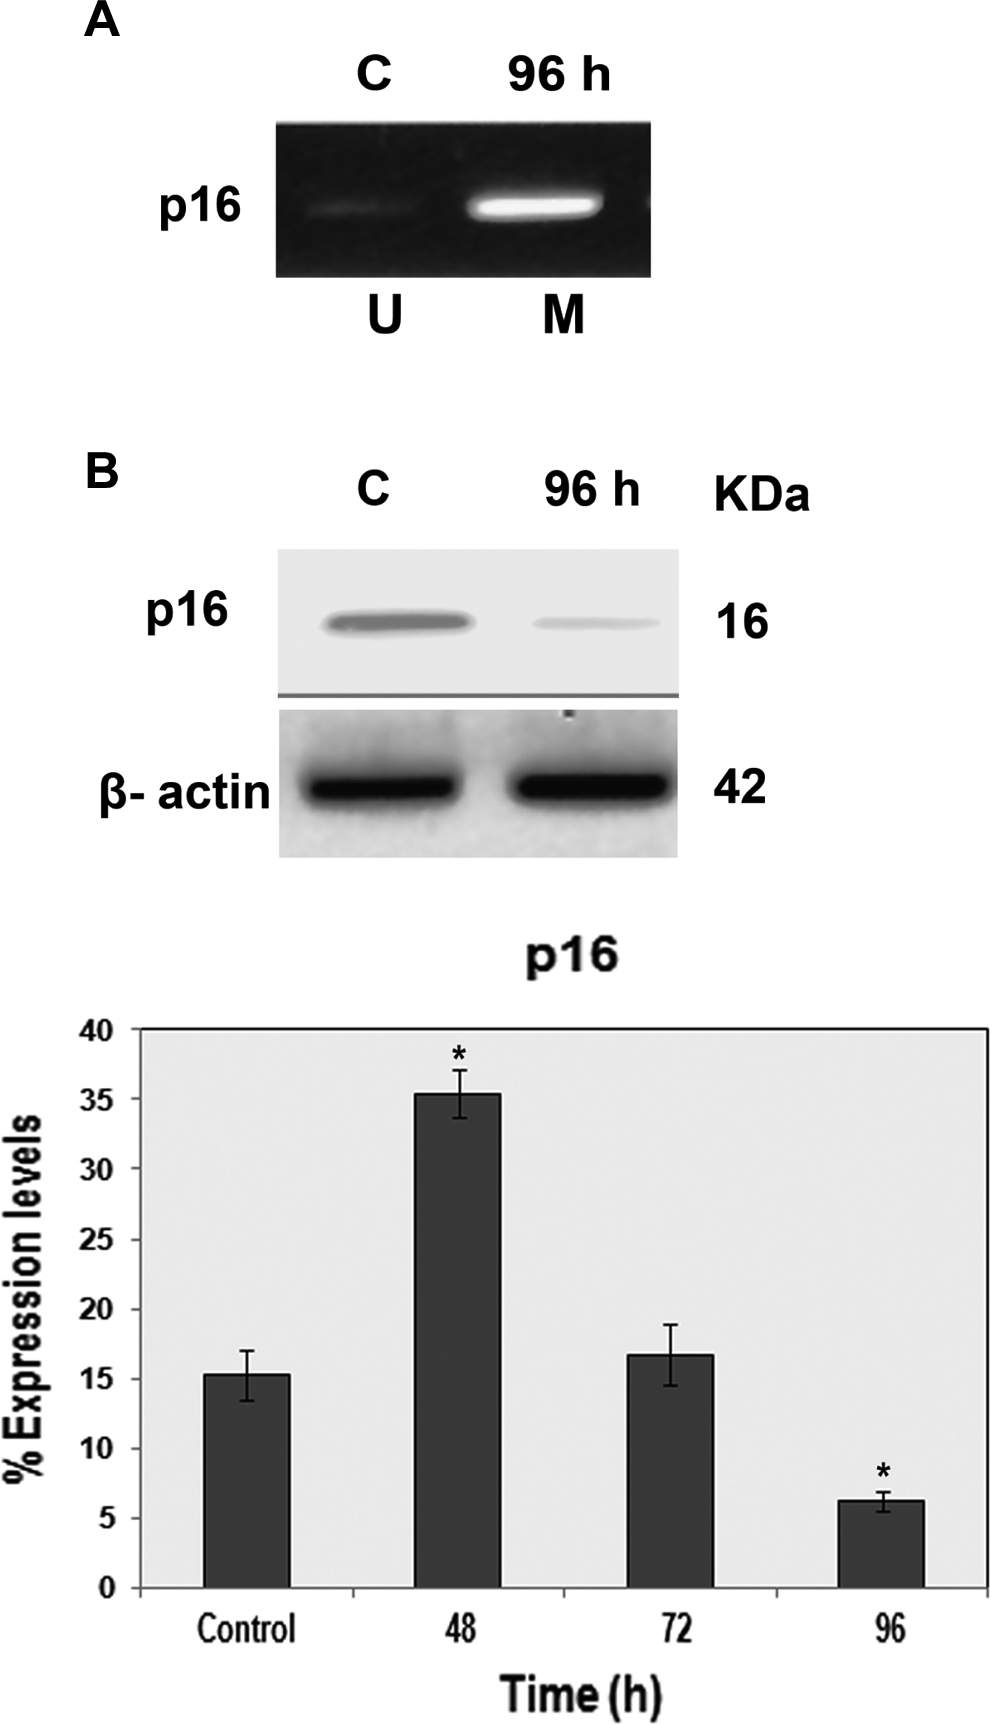
Analysis of CpG islands promoter methylation of p16 gene in HPDE-6 cells. A, For p16 promoter analysis, DNA of bisulfite-modified HPDE-6 cells was amplified in separate reactions using primers specific for unmethylated (U) or methylated (M) template (methylation-specific PCR [MSP]). PCR products were electrophoresed in an ethidium bromide stained agarose gel. Observed amplification was only in the methylated reaction. Presence of PCR product in methylated reactions of treated cells at 96 hours is indicative of hypermethylation at p16, while absence of PCR product indicated unmethylation at p16 in untreated controls. B, Concurrent western blot analysis showed significant decrease in p16 protein expression down the time course with utmost at 96 hours. *P < .05. HPDE-6 indicates human pancreatic ductal epithelial; PCR, polymerase chain reaction.
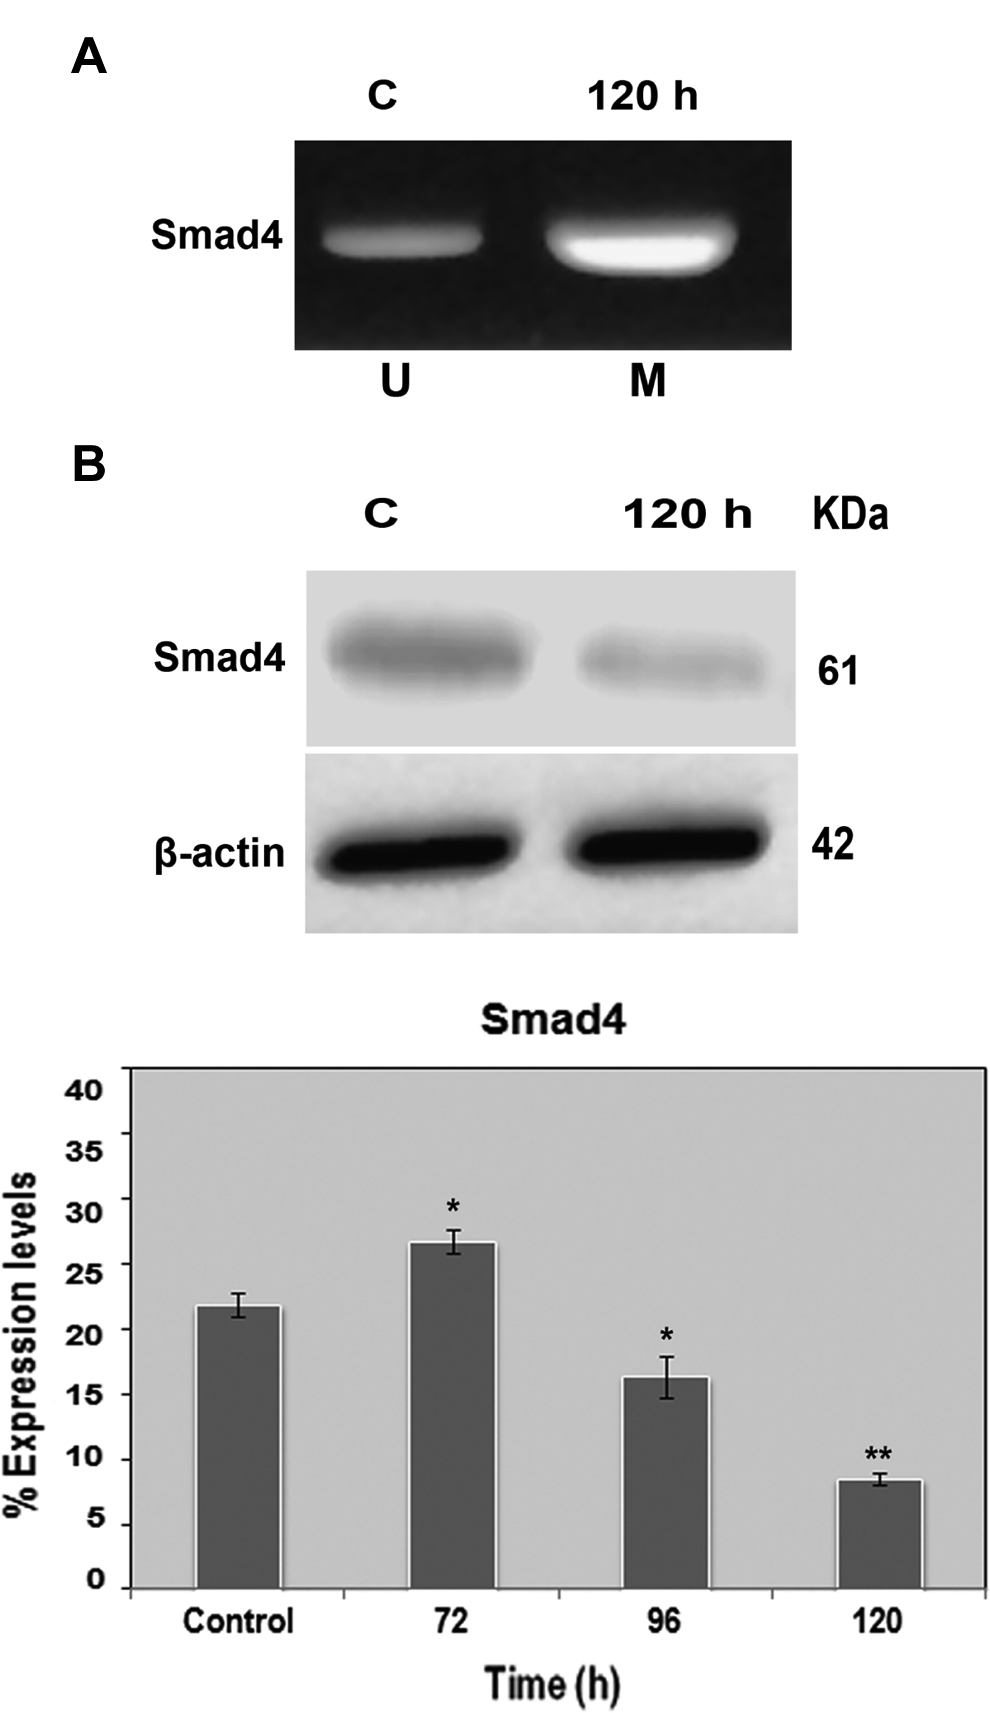
N-Succinimidyl N-methylcarbamate induces Smad4 methylation in HPDE-6 cells. A, Representative picture showing hypermethylation status of CpG islands promoter methylation of smad4 gene in HPDE-6 cells. For Smad4 promoter analysis, DNA of bisulfite-modified HPDE-6 cells was amplified in separate reactions using primers specific for unmethylated (U) or methylated (M) template (methylation-specific PCR [MSP]) followed by electrophoresis of PCR products in an ethidium bromide-stained agarose gel. Amplification was observed in the methylated reaction only. Presence of PCR product in methylated reactions of treated cells at 120 hours showed hypermethylation at Smad4, while absence of PCR product indicated unmethylation at Smad4 in controls. B, Simultaneous immunoblot analysis showed significant decline in SMAD4 protein expression at 120 hours. *P < .05; **P < .01. HPDE-6 indicates human pancreatic ductal epithelial; PCR, polymerase chain reaction.
Micro-RNA Analysis
Micro-RNAs represent a novel paradigm in gene regulation and homeostatic control that are postulated to have a central role in the development and progression of pancreatic cancer. Our investigation in HPDE-6 cells revealed the aberrant upregulation of 11 miRNAs (miR-21, miR-34a, miR-133a, miR-155, miR-196a, miR-196b, miR-217, miR-221, miR-222, miR-301, and miR-376a) in treated cells at passages 1 and 3; however, the highest changes in relative light units of these miRNAs were recorded at passage 5 in comparison with controls. In addition, downregulation of miR-216 was also noted along the passages 1, 3, and 5 when compared to controls (Figure 10).
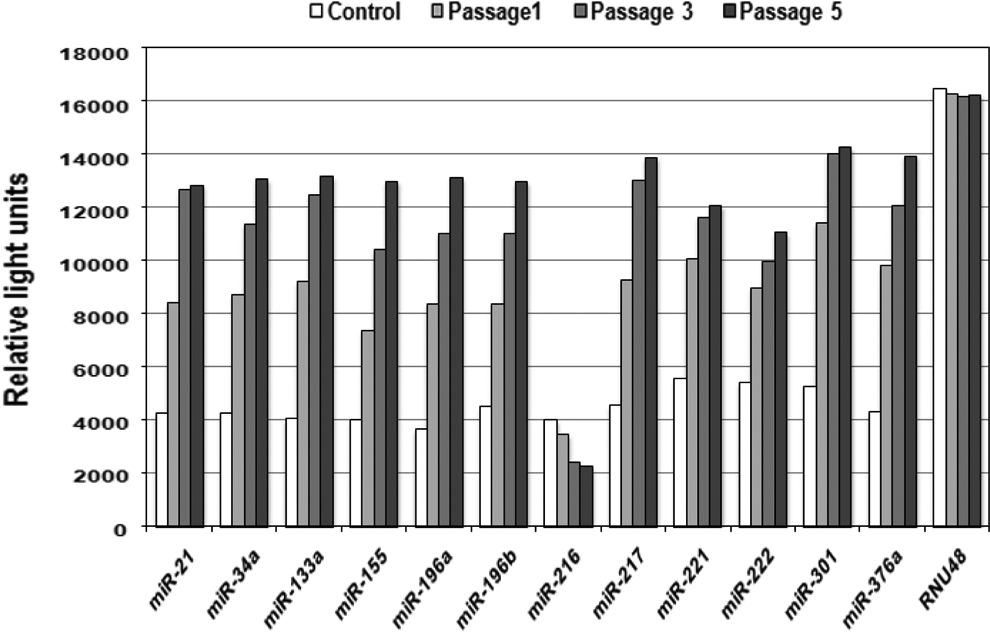
Mitochondrial oxidative stress causes aberrant miRNA expression in human pancreatic ductal epithelial (HPDE-6) cells. Graph showing differential expression of 12 miRNAs in treated cells during passages 1, 3, and 5. RNU48 was used as internal control. miRNA indicates micro-RNA.
Discussion
Chromatin remodeling, especially histone modifications and aberrant DNA methylation, is a critical event for increased cancer susceptibility. Although there has been a recent surge in understanding the involvement of oxygen radical injury, we do not yet know the precise signals that trigger these epigenetic modifications. In the present study, an attempt was made to gain insights of oxidative stress-induced epigenetic modifications following exposure to N-succinimidyl N-methylcarbamate (a surrogate for MIC) in the treated HPDE-6 cells. Methyl isocyanate, a reactive industrial by-product, is one of the most toxic isocyanates and is known to exert a detrimental effect on numerous organ systems and cellular organelles including the pancreas. 30 Earlier, we demonstrated that N-succinimidyl N-methylcarbamate is capable of causing DNA damage, oxidative stress, inflammation, and genomic instability in cultured mammalian cells. 17,21 –25 N-Succinimidyl N-methylcarbamate can diffuse into intracellular compartments, causing hypoxia and inhibiting mitochondrial respiration, that in turn perturbs the mitochondrial–nuclear cross talk. 13,23 In vitro exposure to N-succinimidyl N-methylcarbamate enhances oxidative stress, thereby eliciting oxidative DNA damage, failure to maintain regulatory gene mechanisms controlling the process of oxidative phosphorylation, and an imbalance of antioxidant defense system. 13
Consistent with our previous observations, 13 we herein demonstrate that prooxidant exposure resulted in significant decrease in mitochondrial metabolic function as marked by early signs of toxicity to mitochondria through ROS generation, increased AP sites, and 8-oxo-dG formation (Figures 1–3A). N-Succinimidyl N-methylcarbamate treatment induced gradual decline in GR and SOD activities (Figure 3B) and marked inhibition of mitochondrial respiratory chain enzymes, which further reaffirmed the involvement of perturbed mitochondrial machinery (Table 1). Once beyond threshold, oxidative stress significantly disturbs the mtDNA integrity, which might be due to the close proximity of mtDNA to ROS and lack of protective histones, chromatin structure, introns, and proofreading apparatus (Figure 4). Oxidative damage also resulted in a multitude of aberrant chromatin responses driven by hypermethylation of promoter DNA, posttranslational histone modifications, and altered miRNA expression simultaneously as epigenetic phenomena. Overproduction of ROS, the genesis for oxidative injury, differentially alters redox mechanism and also has been proposed as an important driver of epigenetic modifications. 31 In pancreatic adenocarcinoma, oxidative stress has been shown to trigger genetic cascades underlying the altered gene expression 7 but our study provides the first direct evidence to interrelate such ROS with epigenetic mechanisms.
In mammalian cells, both DNA methylation and chromatin structure are interconnected in specific ways that orchestrate either gene transcription or repression. Recent investigations have correlated oxidative damage and depletion of antioxidant enzymes with DNA hypermethylation-induced silencing involved in the development of human carcinogenesis. 32,33 Incidentally, in our study, increased 8-oxo-dG/repressed levels of GR and SOD and simultaneous hypermethylation of CpG island promoters for tumor suppressor p16 and smad4 genes (Figures 8 and 9) further validated the putative association of oxidative stress in laying an epigenetic pathway to neoplasticity. We speculate that sustained oxidative damage implicates promoter DNA hypermethylation, thereby increasing susceptibility of methylated forms toward genomic alteration. As altered methylated patterns in promoter regions affect the expression of a gene product, diminished expression levels of p16 and SMAD4 suggests that the oxidative damage interferes with regulation of p16 and smad4 expression through aberrant hypermethylation (Figures 8 and 9).
Promoter silencing might also result from oxidative damage-induced posttranslational histone modifications. A recent report has posited that promoter DNA methylation and histone modifications exert a cooperative effect on repressive gene transcription function. 34 Acetylation and methylation on histone 3 lysine 9 are 2 of the well-known modifications, which are thought to act in concert to regulate gene transcription. Although acetylation of histones is associated with open chromatin configuration permissive for active transcription, histone methylation in contrast facilitates repressed transcription. Recent studies have suggested that disruption of histone acetylation due to exogenous factors affects the normal expression of genes through hypoacetylation that contribute to a malignant phenotype. 35,36 Notably, we identified a unique redox-mediated cross talk between promoter DNA methylation and hypoacetylation of histones acetylated histone (AcH) 3 and AcH4 in the treated HPDE-6 cells in a time-dependent manner (Figure 7). We presume that such decrease in acetylation trend probably shuts down the scope of repair of oxidative damage through transcriptional inactivation. Additionally, we observed hypermethylation of H3K9me1 and H4K20me3 expression in treated cells with respect to controls (Figure 6B). Thus, our findings suggest that oxidative damage-mediated promoter DNA methylation that negatively impacts histone acetylation might in turn affect the levels of histone methylation, a previously unknown molecular paradigm.
Oxidative stress causes dynamic changes in surrounding chromatin, including changes in nucleosomes positioning and histone modifications. The best characterized oxidative stress-induced chromatin alteration is the phosphorylation of the histone variant H2AX (γ-H2AX) by DNA damage response protein kinases. 37 In agreement with previous observations, our data reaffirm oxidative stress-mediated γ-H2AX phosphorylation and phosphorylation of H3 at double-strand DNA damage sites as part of the chromatin disruption event (Figure 6A). In eukaryotic cells, the uH2A that comprises of about 5% to 15% of available H2A, is the most abundant histone modification reported with multiple functional and structural effects on chromatin regulation. 38 Following oxidative stress-induced DNA damage, uH2A foci accumulates at damage sites. 39 Previous work has provided a potential bridge between uH2A and uH2B to DNA damage and histone hypoacetylation/hypermethylation-associated repression of gene expression. 40,41 Histone ubiquitination has also been connected to neoplasticity as levels of uH2A were found highly upregulated in transformed human cells. 42 Our results imply that aberrantly regulated histone ubiquitination emanating from oxidative DNA damage (Figure 6C) might inactivate gene expression, affecting cellular state. This internal accumulation of histone modification might disturb the nucleosomal integrity and contribute to genomic instability through deregulated DNA replication. Our results are the first, to our knowledge, to describe the sequential steps involved in oxidative stress-induced histone modifications in pancreatic ductal epithelial cells.
It is clear from recent studies that miRNAs that participate in diverse biological regulatory events can act as both oncogenes and tumor suppressor genes within the molecular architecture of gene regulatory networks, thereby contributing to the development of cancer. 43 These conserved classes of nonprotein-coding small RNAs regulate gene and protein expression by binding to mRNA, leading to mRNA degradation or inhibition of translation. 44 Genome-wide studies have demonstrated that miRNA genes are frequently located at cancer-associated genomic regions or clustered in the regions of genomic instability or fragile sites, indicating their potential role in human malignancies including pancreatic cancer. 45,46 Among the differentially expressed miRNAs that we identified in our study (Figure 10), miR-21, miR-155, miR-217, and miR-376a are suggested to be abnormally expressed in invasive pancreatic cancers. 45 Such a pattern of expression is perhaps not surprising as studies have delineated oxidative stress-mediated altered regulation of miRNAs expression in the recent past.
Following exposure of cells to oxidative stress, intracellular signals shuttle between mitochondria and nuclei that lead to genome-wide effects and dynamic transcriptional changes. 46 –49 The event culminates with the altered regulation of several hundred of genes coordinating the release of proinflammatory cytokines. 50,51 Along with a number of protein-coding genes, several miRNA-producing transcripts also change expression during this process. Among these, miR-155 and miR-146a, originally identified as inflammatory response miRNAs, are upregulated by redox sensitive NF-κB. 52 Although miRNA expression during inflammation is controlled by transcriptional machinery, there is increasing evidence that protein regulators of the miRNA expression can also be affected during inflammatory responses. Among these, abnormal levels of p16 and SMAD4 during inflammatory responses might impact miRNA expression in selective settings like pancreatic cancers. 53 Our study elucidated cross talk of oxidative stress with amplification of the NF-κB-dependent proinflammatory cascade through aberrant miRNA expression is unreported (Figure 5).
Collectively, our results provide the first insights into epigenetic modulations induced by ROS in pancreatic ductal epithelial cells. It is apparent that a fine balance exists between cellular ROS levels and the 3 cardinal and interdependent epigenetic mechanisms: promoter DNA methylation, histone modifications, and miRNAs expression. The balance among these is essential for genome stability and, if perturbed, might result in loss of genomic integrity. Clearly, in vivo studies will be required to dissect the putative role of mitochondrial oxidative stress-induced epigenetic modifications in pancreatic adenocarcinoma. In addition, characterization of molecular switches that affect these epigenomic signatures and targets thereof will be imperative to understand the complex role of redox-regulatory network in pancreatic diseases.
Footnotes
Authors’ Note
PKM conceived and designed the study. GVR, DJ, NKK, and NP performed the experiments. PKM, SKJ, and NP analyzed the data. PKM and GVR wrote the article.
Declaration of Conflicting Interests
The author(s) declared no potential conflicts of interest with respect to the research, authorship, and/or publication of this article.
Funding
The author(s) disclosed receipt of the following financial support for the research, authorship, and/or publication of this article: This work was supported by a Young Investigator Award grant (to PKM) from Department of Biotechnology (DBT), Ministry of Science & Technology, Government of India, New Delhi, India. The authors received extramural funding support from Department of Biotechnology, Ministry of Science & Technology, Government of India (Grant no. BT/PR13133/GBD/27/201/2009).