
Abstract
Gold nanoparticles (AuNPs) have been widely used in many biological and biomedical applications. In this regard, their surface modification is of paramount importance in order to increase their cellular uptake, delivery capability, and optimize their distribution inside the body. The aim of this study was to examine the effects of AuNPs on cytotoxicity, oxidant/antioxidant parameters, and DNA damage in HepG2 cells and investigate the potential toxic effects of different surface modifications such as polyethylene glycol (PEG) and polyethyleneimine (PEI; molecular weights of 2,000 (low molecular weight [LMW]) and 25,000 (high molecular weight [HMW]). The study groups were determined as AuNPs, PEG-coated AuNPs (AuNPs/PEG), low-molecular weight polyethyleneimine-coated gold nanoparticles (AuNPs/PEI LMW), and high-molecular weight polyethyleneimine-coated gold nanoparticles (AuNPs/PEI HMW). After incubating HepG2 cells with different concentrations of nanoparticles for 24 hours, half maximal inhibitory concentrations (the concentration that kills 50% of the cells) were determined as 166.77, 257.73, and 198.44 µg/mL for AuNPs, AuNPs/PEG, and AuNPs/PEI LMW groups, respectively. Later, inhibitory concentration 30 (IC30, the concentration that kills 30% of the cells) doses were calculated, and further experiments were performed on cells that were exposed to IC30 doses. Although intracellular reactive oxygen species levels significantly increased in all nanoparticles, AuNPs as well as AuNPs/PEG did not cause any changes in oxidant/antioxidant parameters. However, AuNPs/PEI HMW particularly induced oxidative stress as evidence of alterations in lipid peroxidation and protein oxidation. These results suggest that at IC30 doses, AuNPs do not affect oxidative stress and DNA damage significantly. Polyethylene glycol coating does not have an impact on toxicity, however PEI coating (particularly HMW) can induce oxidative stress.
Keywords
Introduction
With the rapid development of nanotechnology and the widespread use of nanoparticles in the biomedical area, the toxicity of nanomaterials has begun to attract attention. Physicochemical characteristics of nanoparticles including chemical composition, size, shape, surface morphology, surface area, and surface energy generally influence the toxicity of these nanomaterials. Nanotoxicology has become an important branch of nanoscience in the recent years and it mainly investigates the relationship between the physicochemical parameters of nanomaterials and the occurrence of toxic effects in biological systems. Generally, toxicity originates from small size and high surface-to-volume ratio of nanomaterials. In comparison to similar materials with larger structures, the nanoparticles/nanomaterials can lead to higher intracellular reactive oxygen species (ROS) levels when biological systems are exposed. High ROS levels can cause cytotoxicity and genotoxicity. In addition, ROS originating from exposure to nanomaterials can cause mitochondrial damage, lipid peroxidation, protein modifications, and DNA damage. 1 -3
Although several noble metals have been used for therapy and diagnosis purposes, gold nanoparticles (AuNPs) are considered to be outstanding delivery systems in medicine due to their easy synthesis, rational stability, easy bioconjugation, and biocompatibility. 4 -6 To date, the Food and Drug Administration has not yet approved any gold-based nanodrugs. There are several AuNPs undergoing phase 2/3 clinical trials. 7,8 Gold nanoparticles are known as colloidal or clustered particles consisting of a gold core and a surface coating around the core. 9 They can be obtained in different forms such as nanospheres, nanorods, nanoshells, nanocages, nanostars, nanocubes, nanocrystals, and triangular bipyramids depending on the synthesis procedure and the experimental conditions. Among them, nanospheres, nanorods, nanoshells, and nanocages are the most frequently used forms in diagnosis and cancer therapy for the delivery of various drugs to tissues. 10 Electron–phonon and phonon–phonon interactions provide heat generation in AuNPs when exposed to near-infrared light (650-900 nm). For this reason, they can be used for tumor imaging and tumor ablation. 5,6 Traditional cancer treatments (chemotherapy, radiation therapy) are based on destroying rapidly growing cancer cells. However, other rapidly growing normal cells (blood, hair cells) are also damaged. With the use of AuNPs in drug delivery as chemotherapeutics, the desired dose can be delivered to the targeted region and therefore the risk of healthy tissue damage is minimized. 11 -13 For various biological applications, AuNPs are generally coated with different polymers such as heparin, hyaluronic acid, chitosan, dextran, pullulan, cellulose derivatives, gelatin, polyethylene glycol (PEG), polyethyleneimine (PEI), polyvinyl caprolactone, elastin-like polypeptide, and maltose. Shahbazi et al have shown that PEI-coated AuNPs (AuNPs/PEI) of 50 nm size range have a great potential of being used as theranostic nanoparticles for real-time imaging under confocal or 2-photon microscopes without any photobleaching effect. 14 In addition, they have shown the importance of AuNPs/PEI for enhanced small interfering RNA delivery and tumor site localization in triple negative breast cancer therapy. 15 -17
Polymeric ligands improve the long-term stability of AuNPs and increase hydrophilicity of the surface. Polymeric coatings are also used to target the drug molecule, extend the circulation life, and may be effective in decreasing the cytotoxicity. In addition, AuNPs size can be adjusted with polymer coating. 9 -13,17,18 Moreover, coating of AuNPs with PEG (PEGylation) reduces the reticuloendothelial system (RES) uptake, increases the circulation time effectively by preventing aggregation, and decreases the nonspecific protein adsorption in the biological environment due to its excellent hydrophilicity. 19 On the other hand, nonspherical nanoparticles are known to have a tendency to form aggregates due to anisotropic properties. It is known that high curvature and ligand structure on the surface is responsible for aggregate formation. Aggregation-related instability can be prevented by coating the AuNPs surface with these polymers. However, there are toxicity issues that are related to these nanoparticle systems or the use of different polymeric coatings. While some work has been done about the toxicity of AuNPs, there is inconsistent data about the effects of different coatings on their toxicity mechanism in the literature. 19,20
Considering all the knowledge given above, the objective of this work was to investigate the cytotoxicity; oxidant/antioxidant status parameters such as lipid peroxidation, protein oxidation, glutathione (GSH) levels, and antioxidant enzyme activities; and genotoxicity of AuNPs and AuNPs-coated with PEG and PEI in HepG2 cells.
Materials and Methods
Chemicals, Kits, Cells
All the chemicals used in the synthesis of AuNPs were obtained from Sigma-Aldrich. Penicillin/streptomycin was purchased from Biological Industries. Cell culture media were from Biowest. Cell culture chemicals and materials (including fetal bovine serum [FBS]), Tris, and protease inhibitor cocktail were also from Sigma-Aldrich. Intracellular ROS detection kit was from Sigma-Aldrich, while GSH, glutathione peroxidase (GPx), superoxide dismutase (SOD), catalase (CAT), lipid peroxidation, and protein oxidation kits were from Cayman. DNA Isolation Kit (Quick-DNA Miniprep Kit) was from Zymo Research. 8-Hydroxy-2′-deoxyguanosine (8-OHdG) EIA Kit was from Oxis International. The human hepatocellular carcinoma cells (HepG2 cells) were from the American Type Culture Collection (ATCC®HB-8065).
Synthesis, Characterization, and Surface Modifications of AuNPs
Gold nanoparticles were chemically synthesized by modified Turkevich Method. 21,22 Briefly, trisodium citrate dehydrate solution (3%, 1 mL) was added to hydrogen tetrachloroaurate (III) trihydrate (HAuCl4·3H2O) solution (0.25 mM, 100 mL) and vigorously stirred for 10 minutes under reflux system, and the solution was cooled to room temperature. Four different groups of AuNPs were synthesized. Seed nanoparticles were used to prepare AuNPs with the sizes ranging between 55 and 65 nm by seeding-growth method. 23 For this purpose, seed nanoparticles (2.5 mL) were added to HAuCl4·3H2O solution (0.25 mM, 100 mL) and mildly stirred. Then, trisodium citrate dehydrate solution (15 mM, 1 mL) was added while stirring. At the final step, hydroquinone solution (25 mM, 1 mL) was quickly added and stirred for 10 minutes at room temperature.
Polyethylene glycol (molecular weight [MW]: 6,000) and PEI (MW: 2,000; low MW [LMW] and MW: 25,000; high MW [HMW]) were used to modify the surface of AuNPs. A stock solution of PEI (2%, vol/vol) was prepared and added to AuNPs solution at 0.005% (vol/vol) concentration by stirring. Freshly synthesized AuNPs were coated with both low and HMW PEI solutions by stirring for 1 hour with PEI solution. In the final step, AuNPs/PEI were purified by centrifuging at 7,000 × g for 30 minutes and dispersed in deionized water. These nanoparticles were named as AuNPs/PEI LMW (for LMW) and AuNPs/PEI LMW (for HMW). 14,15 On the other hand, PEG (6,000 MW) was added to AuNPs at 0.02% (vol/vol) concentration by stirring. Polyethylene glycol-coated AuNPs (AuNPs/PEG) were purified by centrifuging at 7,000 × g for 30 minutes and dispersed in deionized water. These nanoparticles were named as AuNPs/PEG.
The hydrodynamic size and ζ-potential measurements of nanoparticles were performed using the Zetasizer Nano ZS analyzer (Malvern Instrument Ltd). The morphology and particle size distribution of nanoparticles were estimated by transmission electron microscopy (TEM, FEI Tecnai G2 Spirit BioTwin CTEM Microscope).
Cell Culture
The HepG2 cells were subcultured in a 75 cm2 flasks in Dulbecco modified Eagle medium supplemented with penicillin/ streptomycin (1%) and 10% FBS. The HepG2 cells were maintained in an incubator (Heraeus Instruments) at 37 °C and 5% CO2. Cultured HepG2 cells were used in following experiments.
Cytotoxicity Assay
Cell viability was determined using 3-(4,5-dimethylthiazol-2-yl)-2,5-diphenyltetrazolium bromide (MTT) assay. 24 The test is designed to spectrophotometrically quantify cell growth and viability. Briefly, HepG2 cells were cultured and seeded at a density of 1 × 10³ cells/well in a 96-well culture plate and incubated for 24 hours. After 24 hours, HepG2 cells were exposed to different concentrations (25, 50, 100, 200, 400 μg/mL) of AuNPs, AuNPs/PEG, AuNPs/PEI LMW, and AuNPs/PEI HMW, and incubated for 24 hours. Both untreated and vehicle-treated HepG2 cells were used as a control, and the results shown herein represent the results obtained from untreated controls as the vehicle was not cytotoxic. Then the media were discarded, and after the addition of 100 µL MTT dye (0.5 mg/mL), cells were incubated for 4 hours. Then, MTT dye was discarded. In order to dissolve the formazan precipitate, 150 µL of dimethyl sulfoxide (DMSO) was added to each well, and the plate incubated on a shaker for a few minutes. The absorbance was measured at 570 nm using a microplate reader (Spectramax M2, Molecular Devices). Control cells were accepted to have 100% cell viability. The results were expressed as the mean percentage of cell viability versus control group. Untreated cells were used as the control group. Inhibitory concentration 50 (IC50, concentration that causes 50% of cell viability loss) and inhibitory concentration 30 (IC30, concentration that causes 30% of cell viability loss) were later calculated. Experiments were repeated on 3 different days for 9 independent occasions. The mean of all the experiments were calculated.
Intracellular ROS Production
The intracellular ROS detection kit is based on the conversion of the nonfluorescent probe 5-(and 6-) chloromethyl-2′,7′-dichlorodihydrofluorescein diacetate to green-fluorescent chloromethyl-2′,7′-dichlorofluorescin (CM-DCF) by living cells. Reactive oxygen species reacts with a fluorogenic sensor contained in the cytoplasm to form a fluorometric product proportional to the amount of present ROS. Briefly, HepG2 cells (1 × 10³) were washed with 90 µL phosphate buffered saline (PBS). The ROS detection reagent stock solution was prepared by mixing 40 µL DMSO with the ROS detection reagent. The HepG2 cells were treated with 10 µL test compound solution (AuNPs, AuNPs/PEG, AuNPs/PEI LMW, AuNPs/PEI HMW) at IC30 doses. Determination of ROS, oxidant/antioxidant status parameters, and DNA damage were performed by using IC30 doses, as this dose would represent more realistic result, than IC50 dose. For control wells (untreated cells), only 10 µL PBS was added. To induce ROS production, 96-well culture plate was incubated in a 5% CO2, 37 °C incubator for 30 minutes. Master reaction mixture (20 µL stock solution, 10 µL assay buffer) was prepared and 100 µL of this mixture was immediately added to each well. The 96-well culture plate was incubated for 30 minutes. Fluorescence intensity was measured (λex = 640 nm, λem = 675 nm) by using a spectrofluorometer (Spectramax M2, Molecular Devices). Control cells were accepted to have 100% ROS production. Results were expressed as the mean percentage of ROS production versus control group.
Antioxidant and Oxidant Parameters
After specified incubation periods and trypsinization, the cell lysates were prepared by using Tris buffer (pH 7.4) with protease inhibitor cocktail. For GSH, lipid peroxidation and protein oxidation, cell lysates were centrifuged at 4,000 rpm, 4 °C, for 10 minutes. The supernatants were collected and kept at −80 °C until the experiments were performed. For antioxidant enzyme activities, cell lysates were centrifuged at 4,000 rpm, 4 °C, for 10 minutes. The supernatants were further centrifuged at 13,000 rpm, pellets were discarded, and the supernatants were collected and kept at −80 °C until the experiments were performed.
Glutathione Peroxidase Activity
Glutathione Peroxidase Assay Kit indirectly measures the GPx activity by a coupled reaction with glutathione reductase (GR). Oxidized glutathione upon reduction by a hydroperoxide (ie, cumene hydroperoxide) is later recycled to its reduced state by GR and by NADPH oxidation. The oxidation of NADPH to NADP+ is accompanied by a decrease in absorbance at 340 nm, and the decrease in the absorbance is directly proportional to the GPx activity within the erythrocyte sample. Absorbance was measured at 340 nm at 1 minute interval, and GPx activity was expressed as nmol/min/mg protein.
Superoxide Dismutase Activity
The total SOD activity was measured by a colorimetric assay using a commercial kit. This kit uses a radical detector, that is, tetrazolium salt solution namely 2- (4-iodophenyl)-3-(4-nitrophenyl)-5-(2,4-sulfophenyl)-2H-tetrazolium, monosodium salt, WST-1 formazan, that produces a water-soluble formazan dye upon reduction with a superoxide anion. Xantine oxidase (XO) causes superoxide ion production while converting xanthine and water to uric acid and H2O2. Superoxide can be dismutated by SOD to give oxygen and H2O2 in the same cycle. The reduction rate of superoxide was linearly associated with XO activity and this reduction to oxygen can be inhibited by SOD. The 50% inhibition activity of SOD was determined. Since the absorbance at 440 nm was proportional to the amount of superoxide anion, the inhibition of SOD activity was quantified by measuring the decrease in the color development at 440 nm. One unit of SOD is defined as the amount of enzyme needed to exhibit 50% dismutation of the superoxide radical. The SOD activity was expressed as U/mg protein.
Catalase Activity
The activity of CAT is measured by a commercial kit, which is based on the peroxidative potential of CAT. The method involves the enzymatic reaction of the H2O2 substrate with CAT and the resulting formaldehyde to form a colored compound with the chromogen (4-amino-3-hydrazino-5-mercapto-1,2,4-triazole, purpald). The absorbance values of the samples were measured at 540 nm, and CAT activity was expressed as nmol/min/mg protein.
Total Glutathione Levels
The method is based on the reaction of the sulfhydryl group of GSH with 5,5′-dithio-bis-[2-nitrobenzoic acid to produce a yellow colored 5-thio-2-nitrobenzoic acid (TNB) and in the same cycle GSH is simultaneously converted to GS-TNB. This disulfide is reduced by GR to recycle GSH and produce more TNB. The TNB produced is directly proportional to this recycling reaction and hence to the concentration of GSH in the sample. The absorbance values of the samples were measured at 414 nm. The results were expressed as nmol/mg protein.
Lipid Peroxidation
Plasma lipid peroxidation levels were quantified by using a thiobarbituric acid (TBA) reactive substances assay kit which measures the concentration of malondialdehyde (MDA), a naturally occurring product of lipid peroxidation. 23 Malondialdehyde forms a complex with TBA under high temperature (90 °C-100 °C) and acidic conditions, and the color intensity of MDA–TBA complex is measured at 530 nm spectrophotometrically. The calculation of the amount of MDA was made by using MDA standards (0, 0,5, 5, 10, 20, 30, and 50 µM), and the results were expressed as nmol/mg protein.
Protein Oxidation
The most common indication of protein oxidation is protein carbonyls. Redox cyclic cations such as Fe+2 and Cu+2 are bound to the cation binding sites on the proteins, and several amino acid side chain amine groups are converted to carbonyl with the aid of H2O2 or O2. Hydrazone is formed which can be analyzed spectrophotometrically from the reaction between 2,4-dinitrophenylhydrazine and protein carbonyls. The absorbance values of the samples were measured at 360 nm, and the results were expressed as nmol/mg protein.
Total Protein Levels
Bicinchoninic acid (BCA) is based on the formation of the Cu+2–protein complex under alkaline conditions followed by the reduction of Cu+2 to Cu+1. 25 The amount of reduction is proportional to the available protein. Total protein content of the cells was determined by BCA using a “protein assay kit.” 26,27 The absorbance values of the samples were measured at 562 nm, and the results were expressed as mg/mL.
DNA Base Damage
After specified incubation periods and trypsinization, total DNA was extracted using a DNA isolation kit, which uses a genomic lysis buffer and later spin columns for extraction. Later, 8-OHdG levels (as a marker of DNA base damage) were measured by a commercial kit that uses sandwich enzyme-linked immunosorbent assay method. The absorbance of the samples or standards was measured at 450 nm. Four-parameter logistic regression curve was used, and the plasma 8-OHdG levels within the samples were calculated using Spectramax computer program. Plasma 8-OHdG levels were expressed as ng/mL.
Statistical Analysis
The distributions were examined by the “Kolmogorov-Smirnov” test. Data were evaluated by 1-way analysis of variance. All data are reported as means ± standard deviation, and statistical analysis was performed using Student t test. The results were considered statistically significant when P < 0.05. In all statistical evaluations, Statistical Package for Social Sciences Program (SPSS Inc) version 20.0 was used.
Results
Properties of Modified AuNPs
Gold nanoparticles were synthesized in 3 different steps. Synthesized seed AuNPs were in the size range of 17 nm, and their polydispersity index (PDI) was 0.1. These seed nanoparticles were used in the following seeding growth of larger nanoparticles. Zeta potential, hydrodynamic diameter, and PDI values of AuNPs, AuNPs/PEG, AuNPs/PEI LMW, and AuNPs/PEI HMW nanoparticles are given in Table 1. The typical TEM images and size distribution of the nanoparticles are shown in Figure 1. After seeding-growth step, nanoparticles were in the size range of 45 nm and were highly monodisperse (PDI = 0.07). These nanoparticles had a negative ζ potential of −36 mV. Different surface modifications were carried out on these nanoparticles. After PEG surface modification, size of the nanoparticles changed to 65 nm and PDI was even better than unmodified nanoparticles (PDI = 0.04). However, ζ potential of the nanoparticles was close to a neutral charge range of −10 mV. On the other hand, PEI modifications with both PEI 2,000 and 25,000 MW increased the size of nanoparticles to 55 and 58 nm, respectively. Again, nanoparticles were highly monodispersed; however with PEI 25,000 the PDI was a bit higher (PDI = 1). Looking at TEM images, PEI coating can be clearly seen on the surface of nanoparticles.
Zeta Potential, Hydrodynamic Diameter, and PDI Values of Nanoparticles.
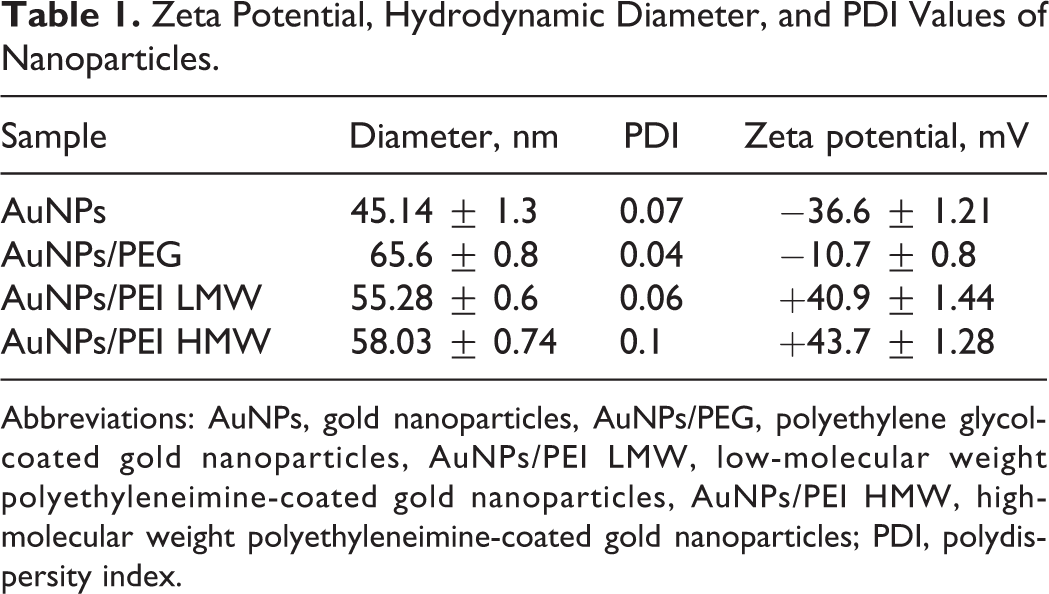
Abbreviations: AuNPs, gold nanoparticles, AuNPs/PEG, polyethylene glycol-coated gold nanoparticles, AuNPs/PEI LMW, low-molecular weight polyethyleneimine-coated gold nanoparticles, AuNPs/PEI HMW, high-molecular weight polyethyleneimine-coated gold nanoparticles; PDI, polydispersity index.
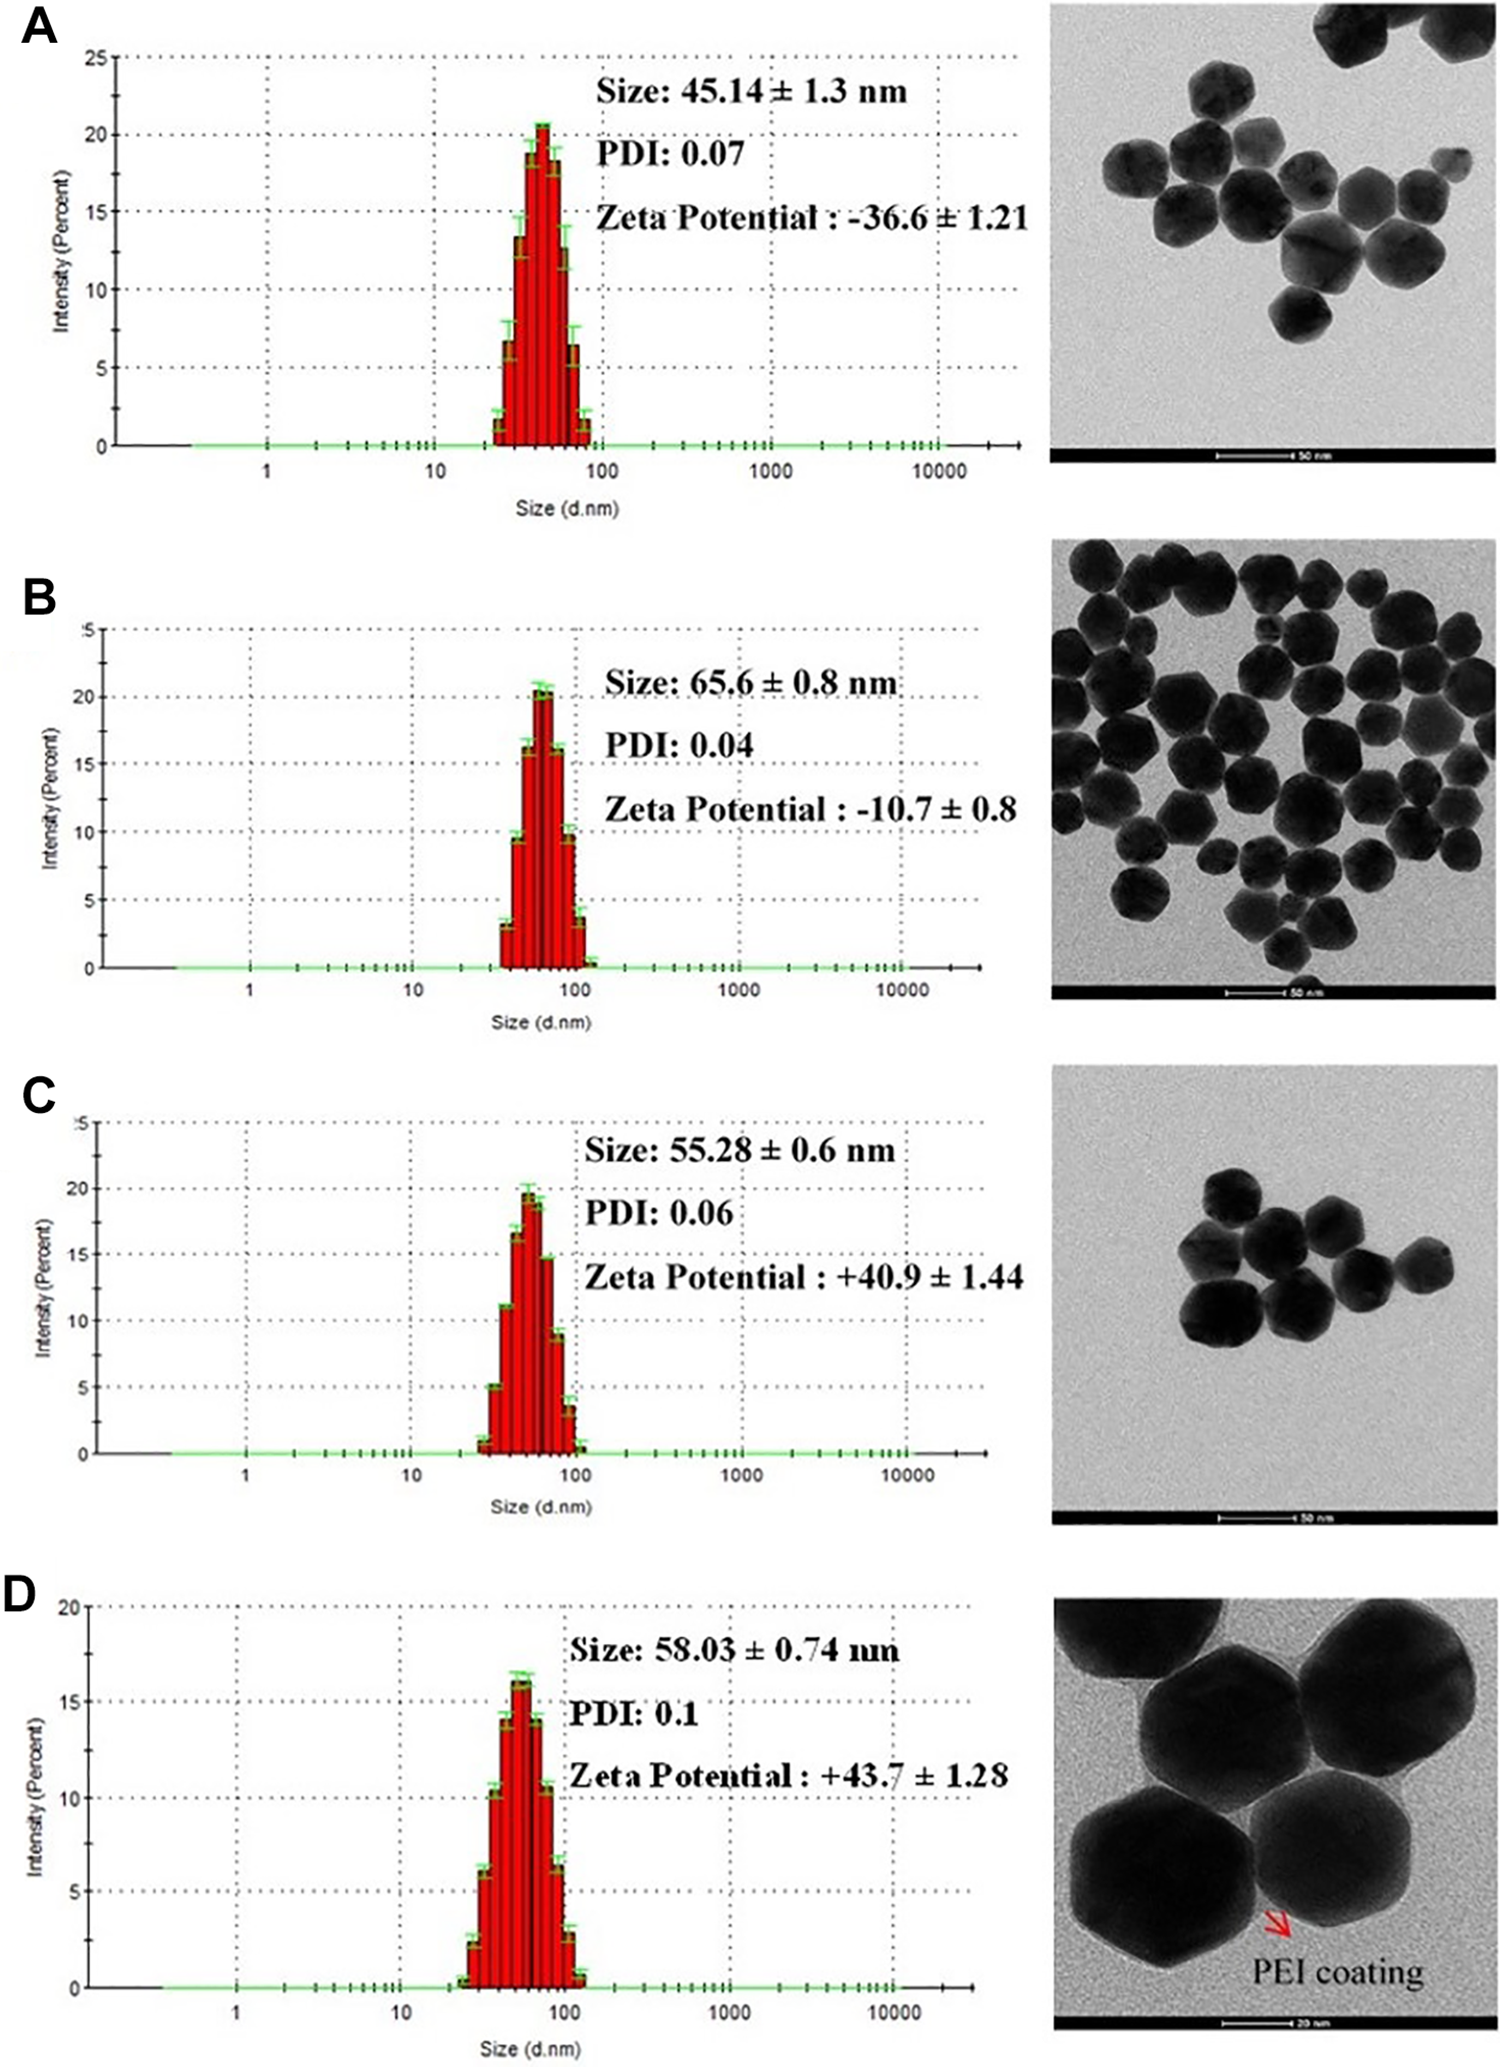
Transmission electron microscopy images and size distribution of gold nanoparticles. A, AuNPs; B, AuNPs/PEG; C, AuNPs/PEI LMW; and D, AuNPs/PEI HMW. AuNP indicates gold nanoparticle, AuNPs/PEG, polyethylene glycol-coated gold nanoparticles, AuNPs/PEI LMW, low-molecular weight polyethyleneimine-coated gold nanoparticles, AuNPs/PEI HMW, high-molecular weight polyethyleneimine-coated gold nanoparticles.
Cytotoxicity
The values of IC50 for Au, AuNPs/PEG, and AuNPs/PEI LMW calculated based on data from the MTT assays were 167 µg/mL, 257 µg/mL, and 198 µg/mL, respectively (Figure 2). Since the cell viability of the AuNPs/PEI HMW group did not exceed 20.44% compared to the control at the lowest concentration, the values for this group were not included in the table (Table 2).
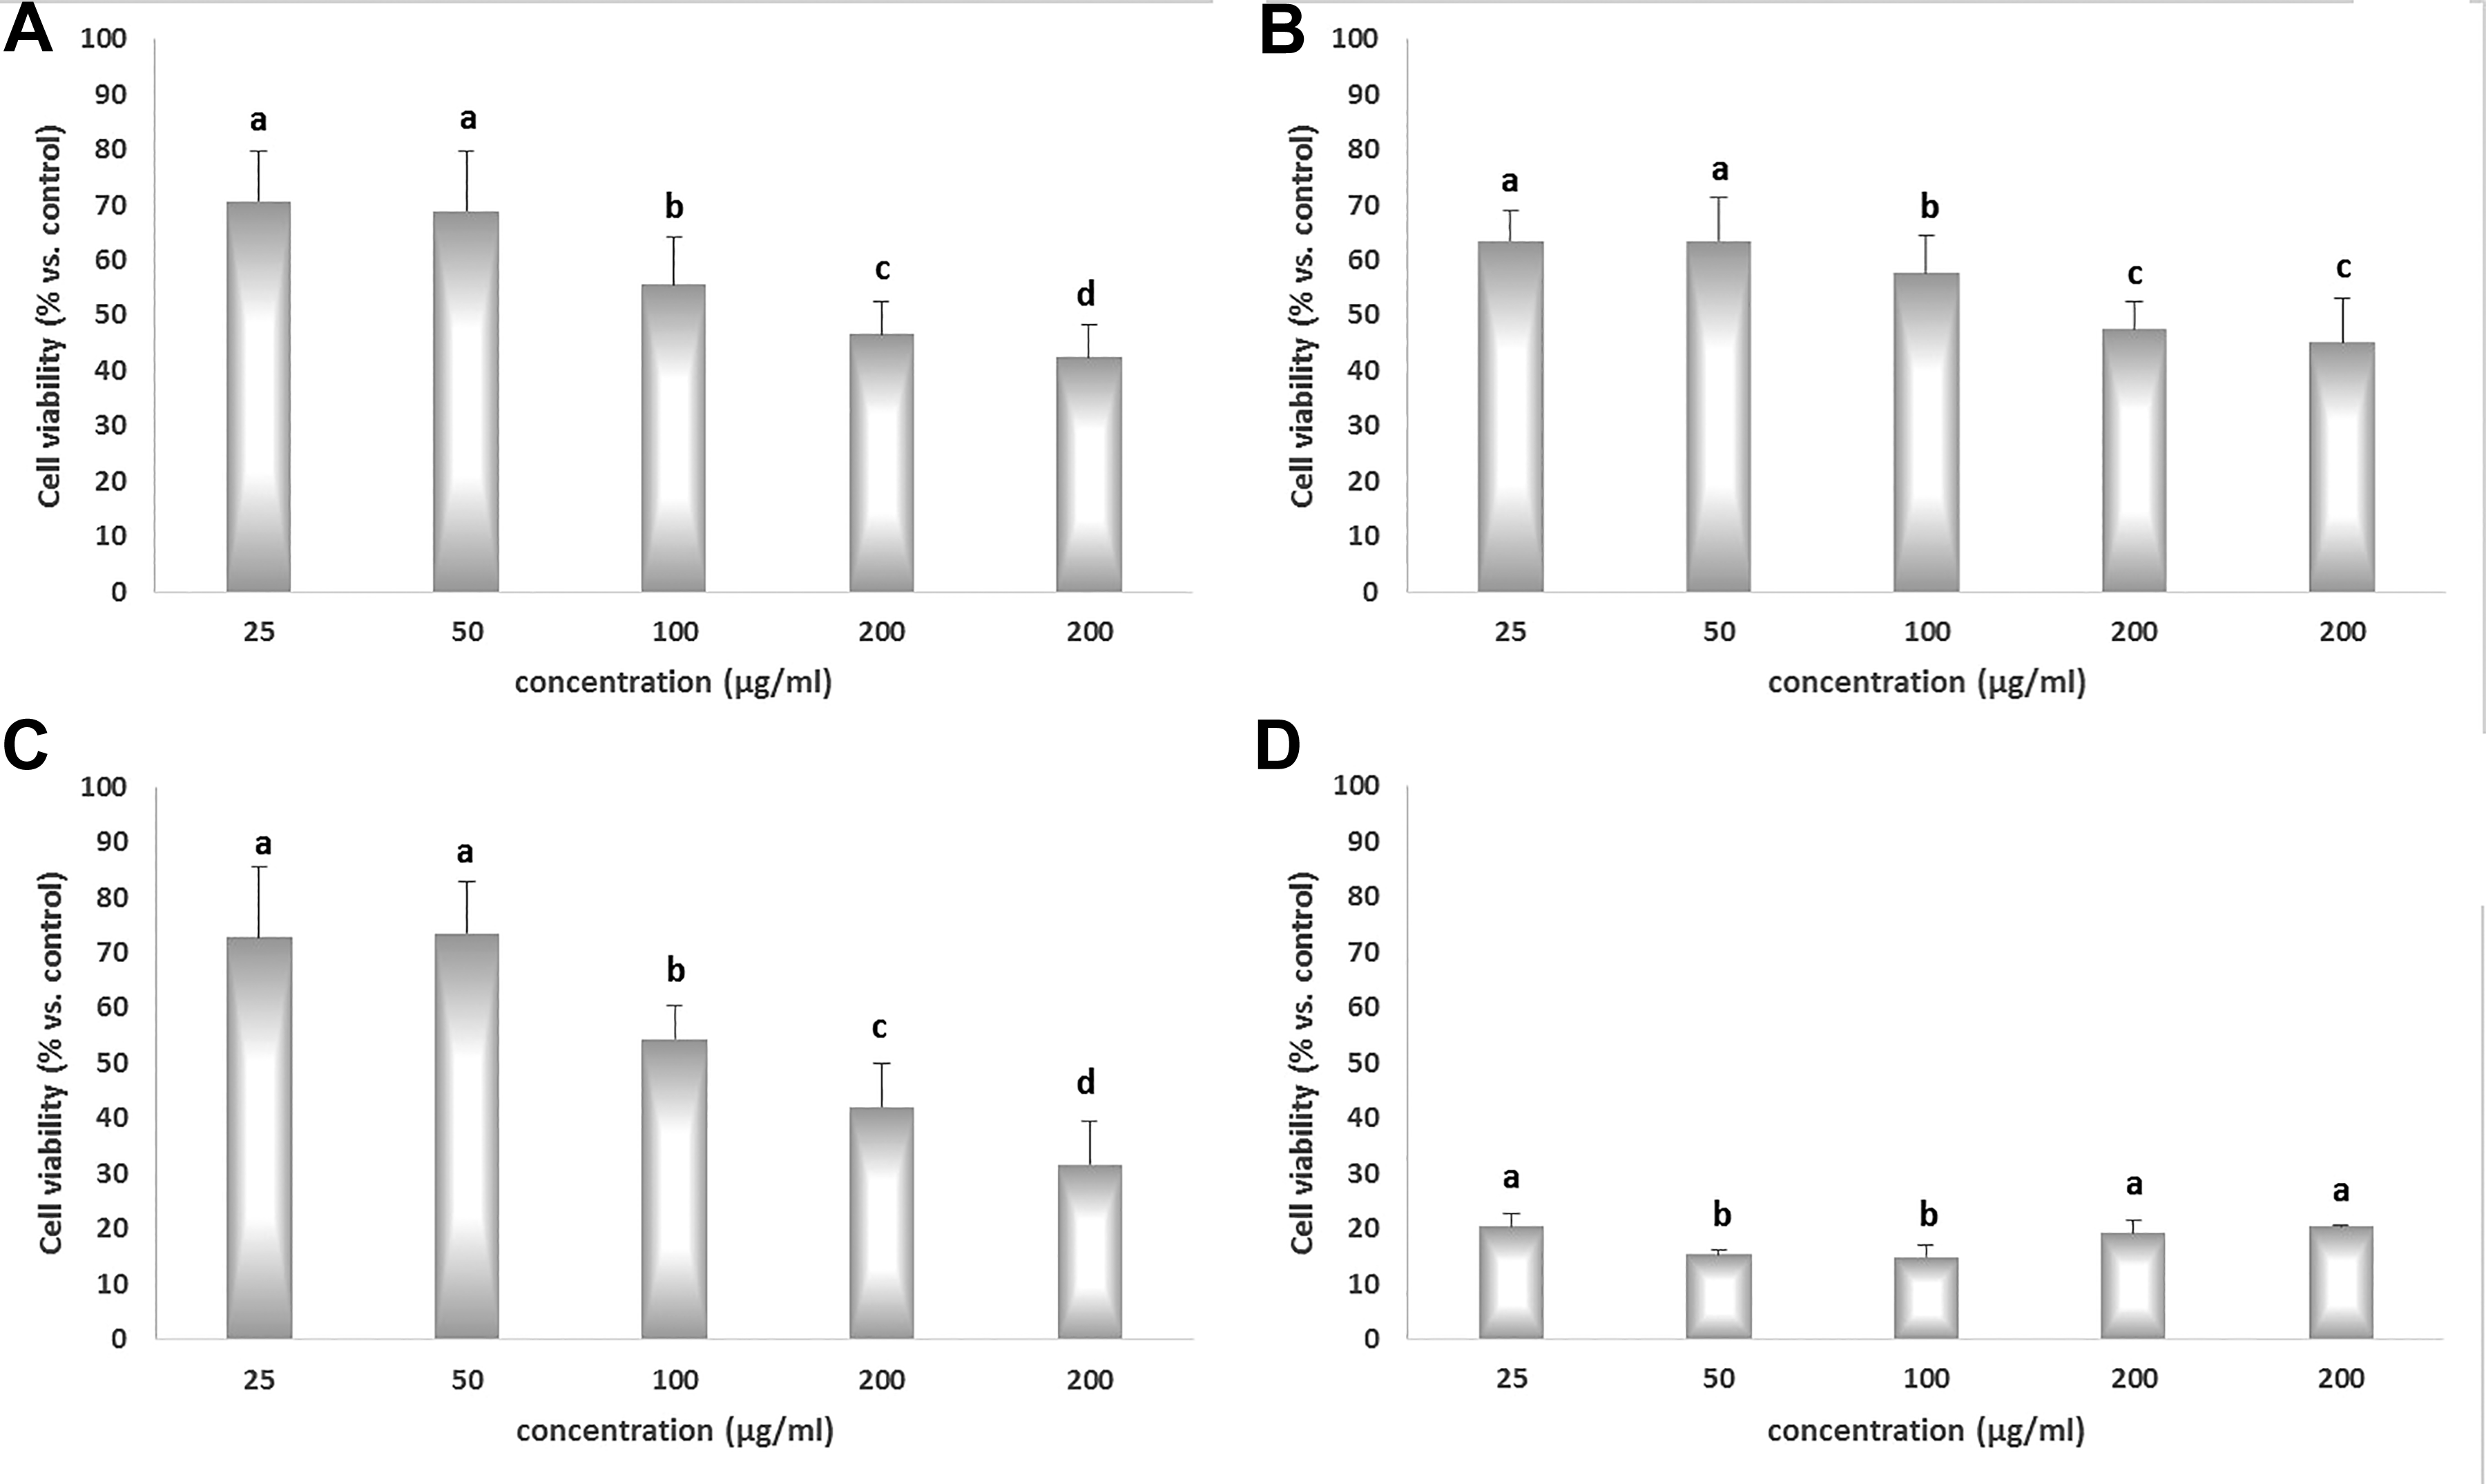
3-(4,5-Dimethylthiazol-2-yl)-2,5-diphenyltetrazolium bromide cell viability assay in HepG2 cell lines. Cells were exposed to different concentrations (25, 50, 100, 200, 400 µg/mL) of nanoparticles for 24 hours. A, AuNPs; B, AuNPs/PEG; C, AuNPs/PEI LMW; D, AuNPs/PEI HMW. AuNP indicates gold nanoparticle, AuNPs/PEG, polyethylene glycol-coated gold nanoparticles, AuNPs/PEI LMW, low-molecular weight polyethyleneimine-coated gold nanoparticles, AuNPs/PEI HMW, high-molecular weight polyethyleneimine-coated gold nanoparticles.
Inhibitory Concentration 30 and Inhibitory Concentration 50 Values of Nanoparticles.
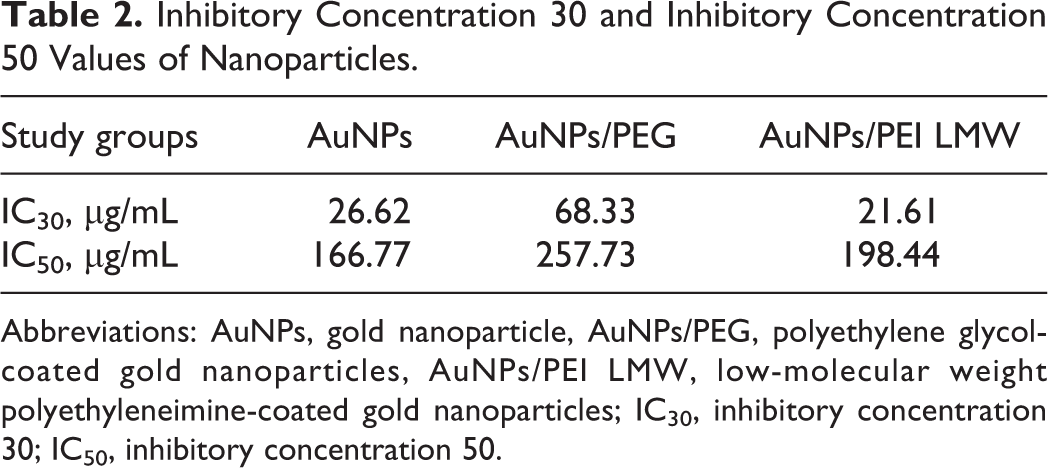
Abbreviations: AuNPs, gold nanoparticle, AuNPs/PEG, polyethylene glycol-coated gold nanoparticles, AuNPs/PEI LMW, low-molecular weight polyethyleneimine-coated gold nanoparticles; IC30, inhibitory concentration 30; IC50, inhibitory concentration 50.
Light Microscopy
Under light microscope, HepG2 cells had observed as adherent epithelial cells with significant nucleolus and round nuclei. The cytoplasm/nucleus ratio was in the favor of nuclei. Most cells were rapidly dividing and they were most probably in the metaphase or anaphase. In AuNP group (after IC30 dose was applied for 24 hours), apoptotic cell clusters were observed on the media. Cells had vacuoles and apoptotic bodies were observed. Remaining cells were adherent although loss of confluency was seen. In AuNPs/PEG group (after IC30 dose was applied for 24 hours), cells seemed more confluent and adherent and they were dividing. In AuNPs/PEI LMW group (after IC30 dose was applied for 24 hours), we observed cellular debris and degenerated cells. In AuNPs/PEI HMW group, we observed apoptotic bodies, cellular degeneration, cytoplasmic vacuoles, and cellular debris along with big apoptotic cell clusters in the media, even at the lowest applied dose (25 µM). Remaining cells were adherent but lost confluency.
Intracellular ROS Production
As shown in Figure 3, treatment of HepG2 cells with AuNPs, AuNPs/PEG, AuNPs/PEI LMW, and AuNPs/PEI HMW caused marked increases in intracellular ROS generation (6.02%, 17.91%, 18.96%, and 13.23%, respectively; P < 0.05). The reason why the expected increase in intracellular ROS in the AuNPs/PEI HMW group cannot be observed may be considered as the decrease in the number of cells with treatment followed by the decrease in ROS production.
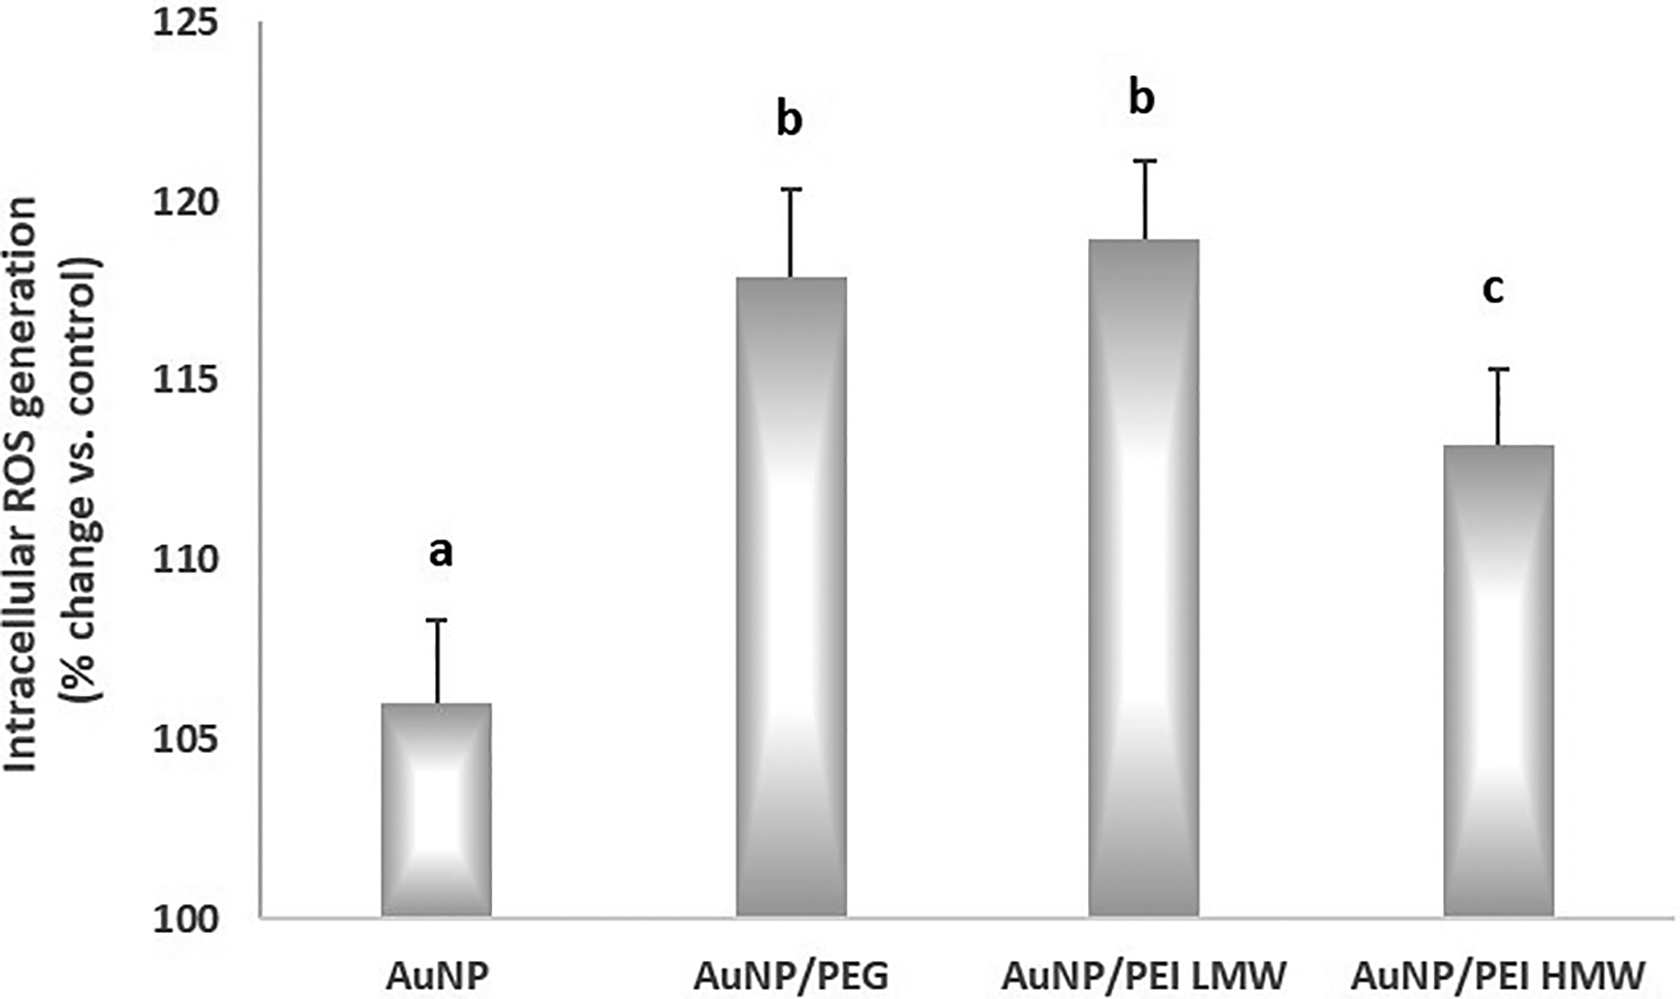
Intracellular ROS generation after exposure to nanoparticles in the study groups. Inhibitory concentration 30 (IC30) was used for the treatments of the study group. a,b,cBars that do not share same letters (superscripts) are significantly different from each other. ROS indicates reactive oxygen species.
Antioxidant Enzymes
Antioxidant enzyme activities in the study groups are given in Figure 4. The activities of GPx in the control, AuNPs, AuNPs/PEG, AuNPs/PEI LMW, and AuNPs/PEI HMW groups were 14.67 ± 3.57 nmol/min/mg protein, 17.39 ± 3.97 nmol/min /mg protein, 16.34 ± 1.42 nmol/min/mg protein, 6.66 ± 4.27 nmol/min/mg protein, and 32.96 ± 4.57 nmol/min/mg protein, respectively. There was no significant difference between the AuNPs and control as well as between the AuNPs/PEG group and control. The increase in GPx1 activity in AuNPs/PEI LMW (81.72%) and AuNPs/PEI HMW (124.60%) was significantly different than the control group (P < 0.05).
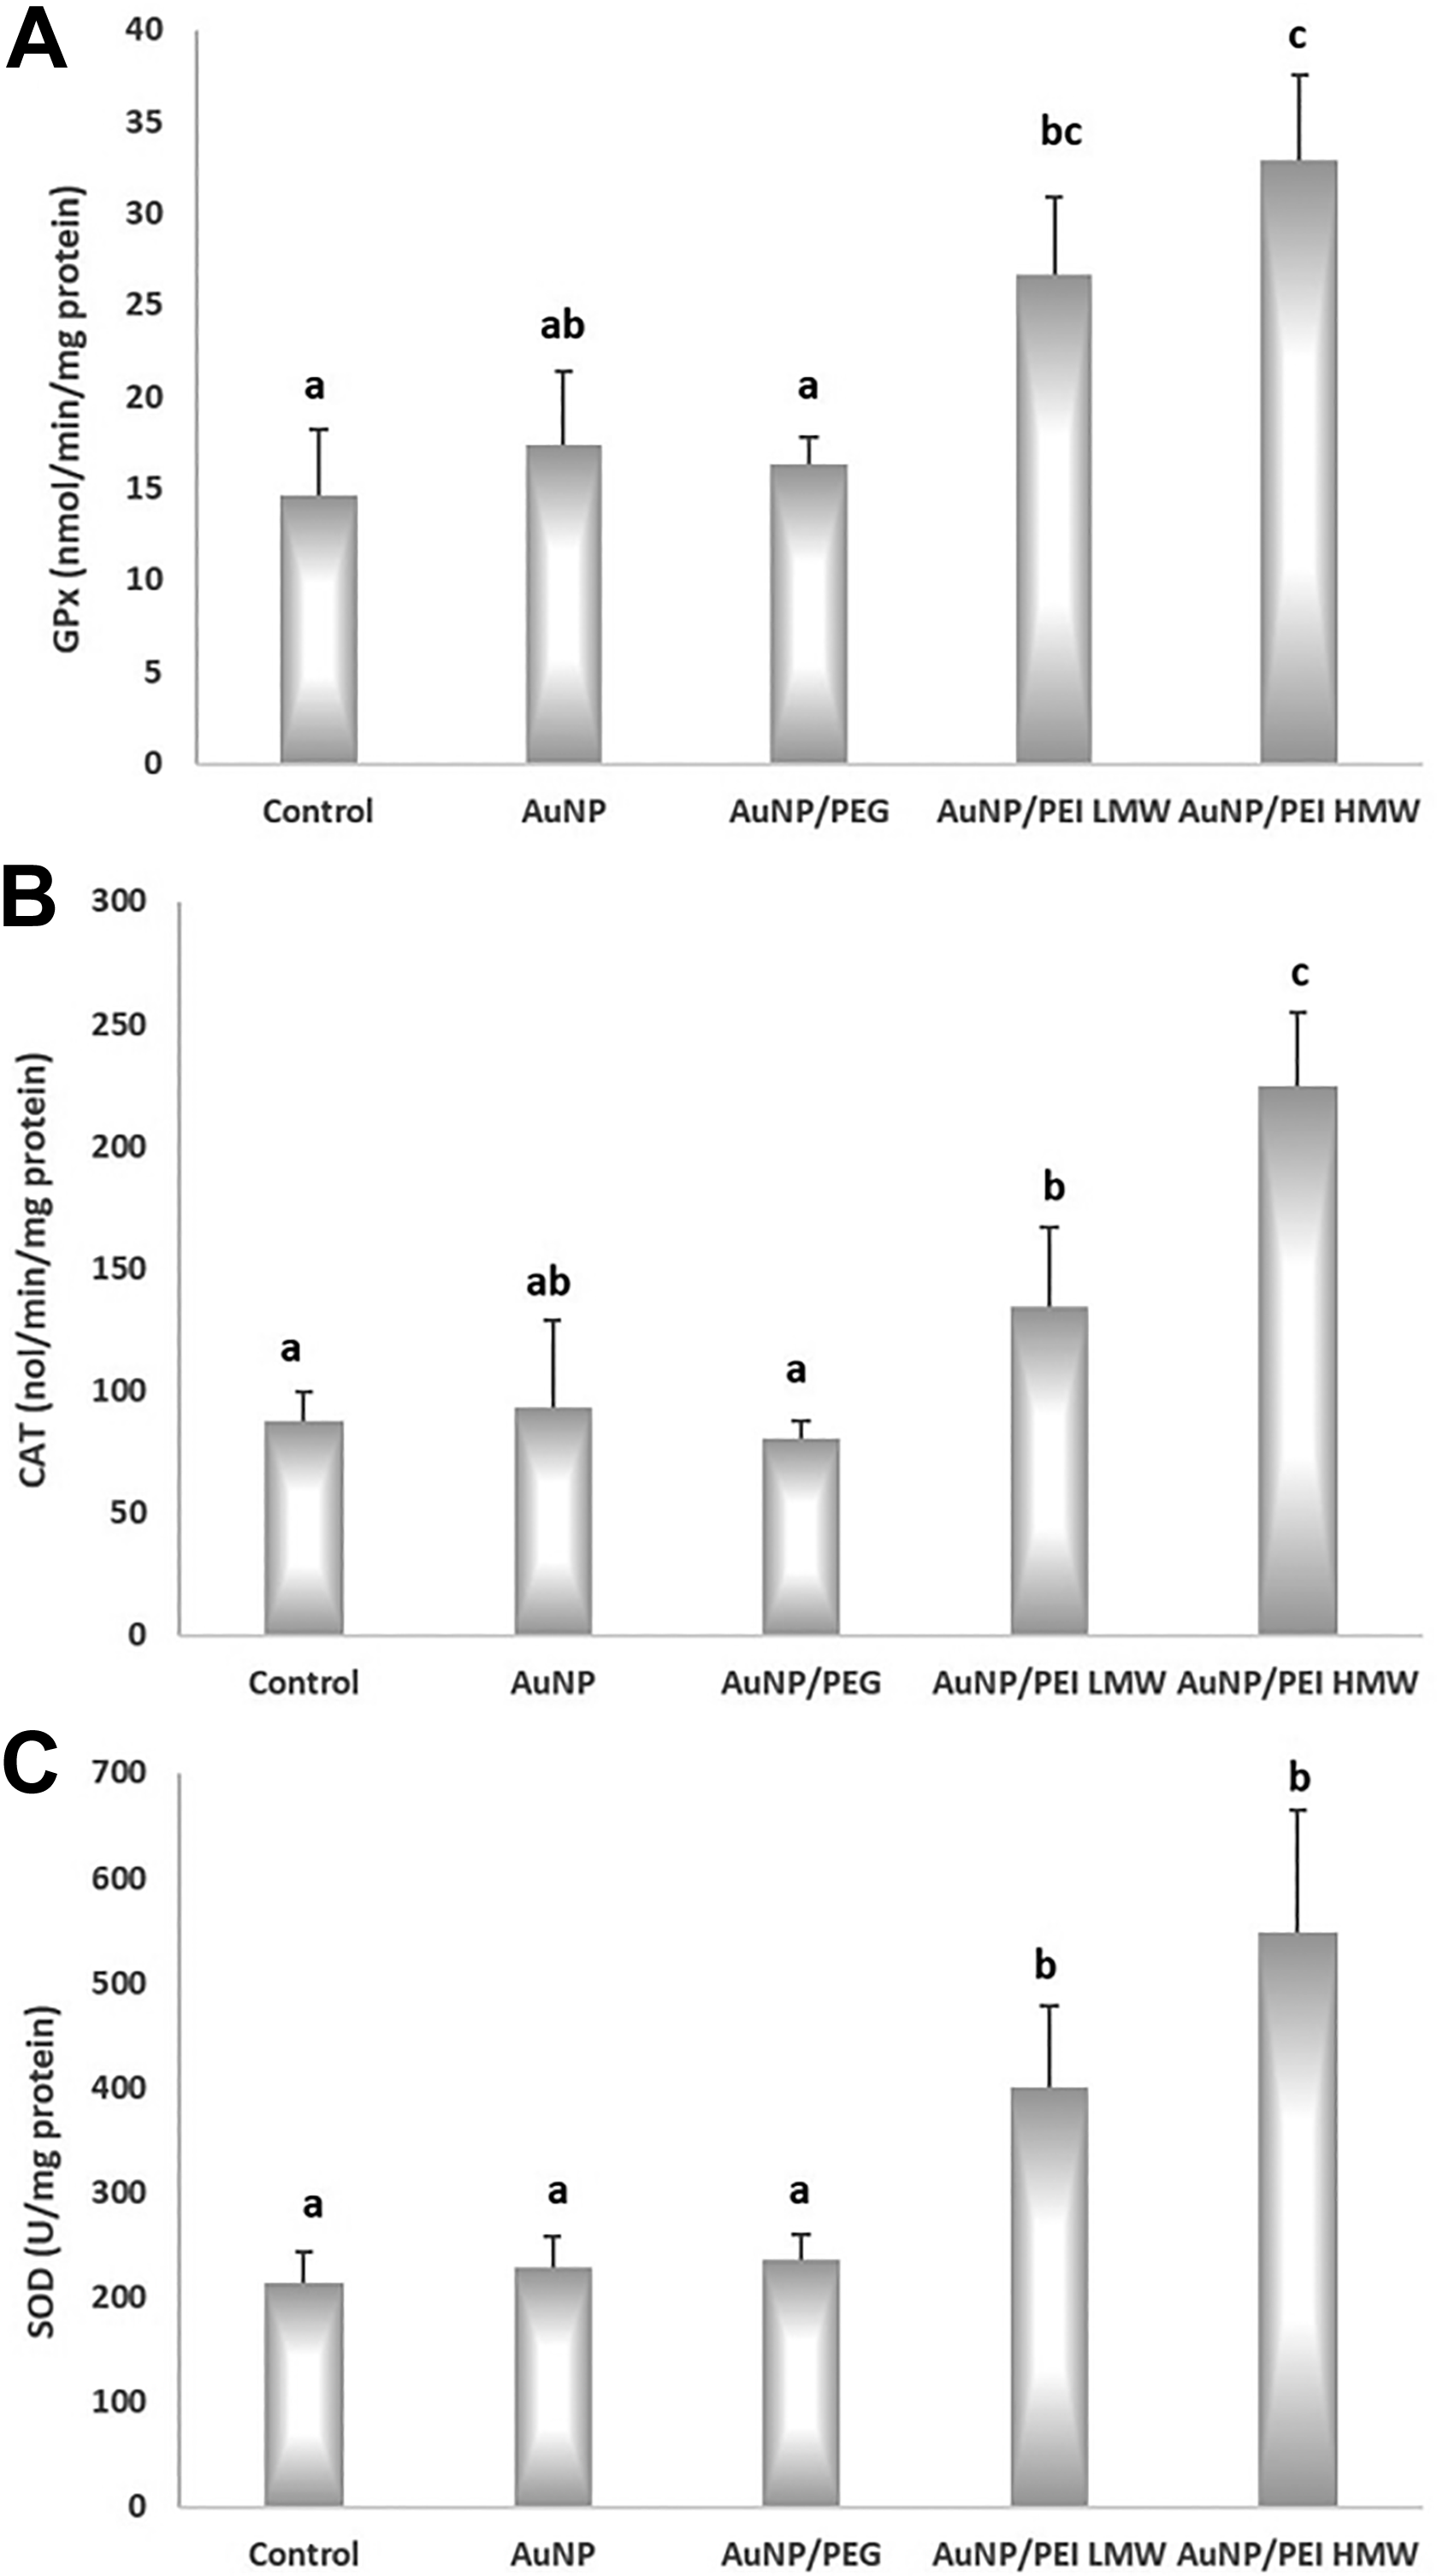
Glutathione peroxidase, catalase, and superoxide dismutase activity of nanoparticles in the study groups. A, GPx activity; B, CAT activity; C, SOD acitvity. All values are expressed as mean ± SD. P < 0.05 was considered statistically significant. a,b,cBars that do not share same letters (superscripts) are significantly different from each other. CAT indicates catalase; GPx, glutathione peroxidase; SD, standard deviation; SOD, superoxide dismutase.
The activities of CAT in the control, AuNPs, AuNPs/PEG, AuNPs/PEI LMW, and AuNPs/PEI HMW groups were 87.96 ± 11.91 nmol/min/mg protein, 93.29 ± 35.21 nmol/min/mg protein, 80.85 ± 6.63, 134.72 ± 32.20 nmol/min/mg protein, and 224.98 ± 29.87 nmol/min/mg protein, respectively. The AuNPs/PEI LMW treatment caused a 53.16% increase in CAT activity, while AuNPs/PEI HMW exposure led to 155.78% increase (both vs control; P < 0.05). In addition, the CAT activity in AuNPs/PEI HMW (141.71%) group was significantly higher than in the AuNP group (P < 0.05, both).
The SOD activities in the control, AuNPs, AuNPs/PEG, AuNPs/PEI LMW, and AuNPs/PEI HMW groups were 213.81 ± 29.96 U/mg protein, 229.36 ± 27.81 U/mg protein, 236.56 ± 23.69 U/mg protein, 401.25 ± 76.94 U/mg protein, and 547.44 ± 117.49 U/mg protein, respectively. The SOD activity in AuNPs/PEI LMW group was markedly higher than the control group (87.67%, P < 0.05). Moreover, the SOD activity in AuNPs/PEI HMW group was 156.04% higher than control (P < 0.05).
Total Glutathione, Lipid Peroxidation, and Protein Oxidation Levels
The total GSH, MDA, and protein oxidation levels in the study groups are given in Figure 5. Total GSH levels in the control, AuNPs, AuNPs/PEG, AuNPs/PEI LMW, and AuNPs/PEI HMW groups were 5.19 ± 0.83 nmol/mg protein, 5.86 ± 1.62 nmol/mg protein, 5.23 ± 0.22 nmol/mg protein, 7.74 ± 1.40 nmol/mg protein, and 9.63 ± 1.26 nmol/mg protein, respectively. Total GSH levels were 85.66% higher in AuNPs/PEI HMW group versus control (P > 0.05). The increase in total GSH levels of AuNPs/PEI HMW group compared to the Au group was statistically significant (64.17%, P < 0.05). In addition, total GSH levels in the AuNPs/PEI HMW group was significantly higher than the AuNPs/PEI LMW group (P < 0.05).
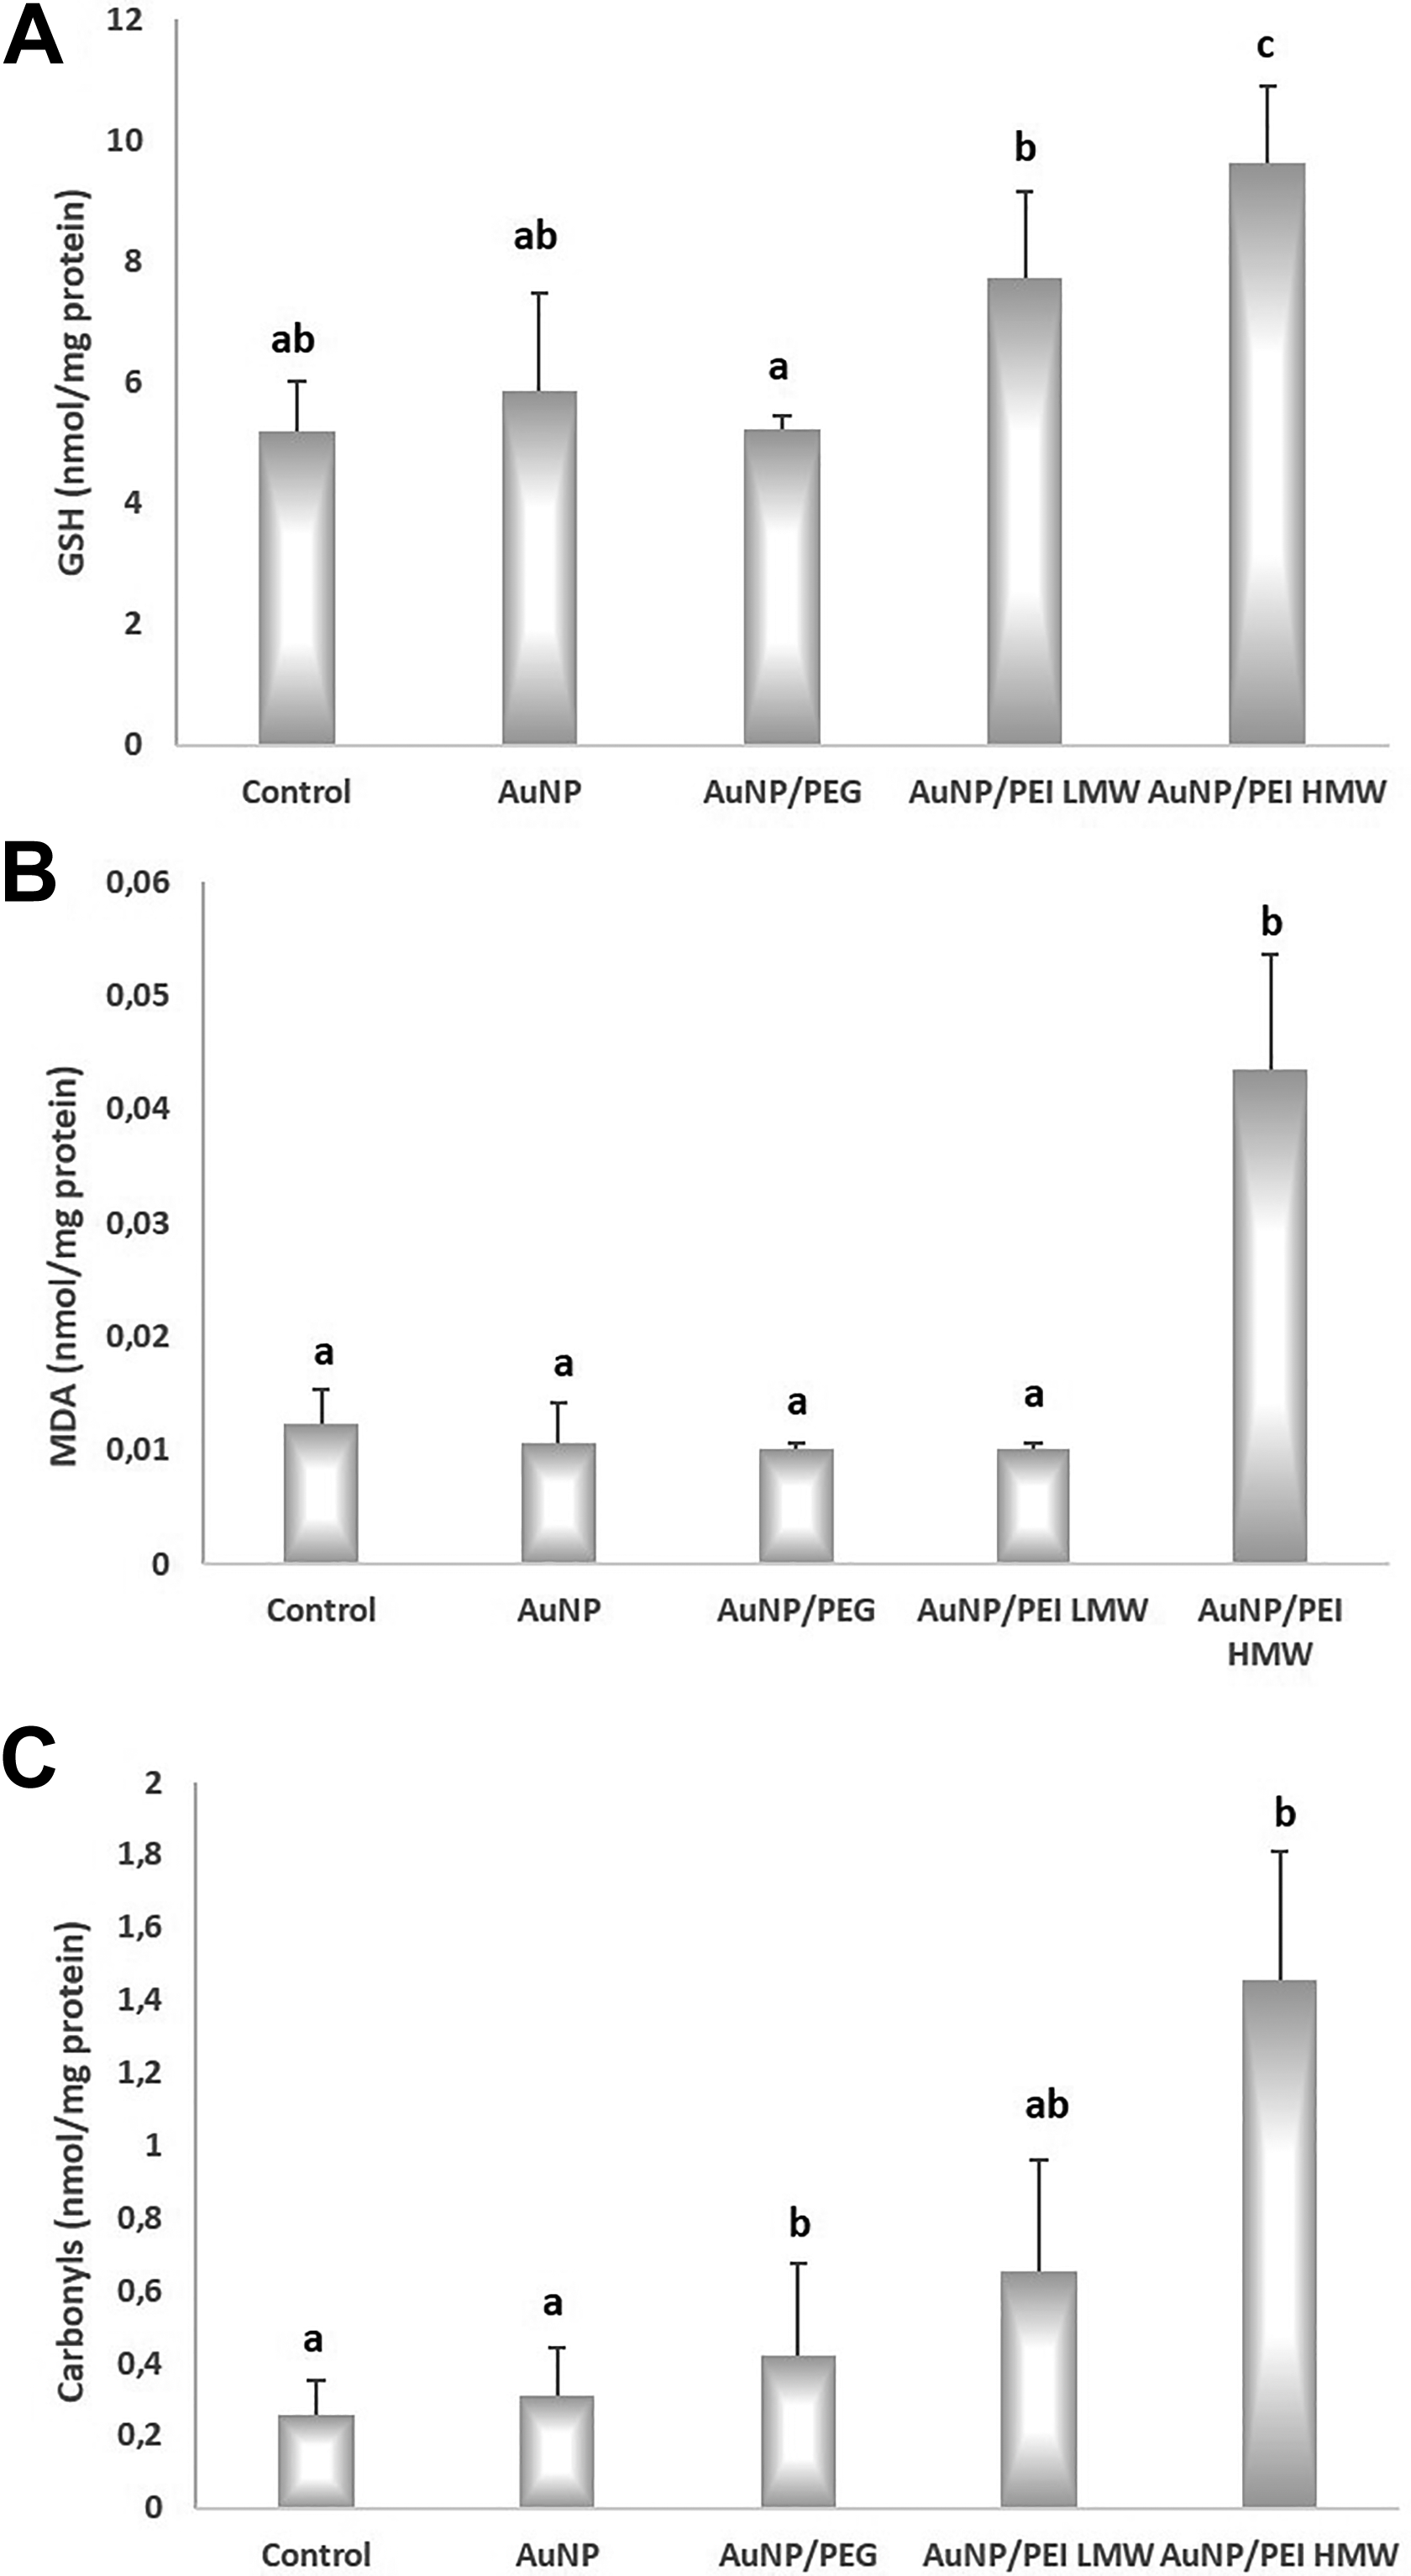
Glutathione, lipid peroxidation, and protein oxidation levels for nanoparticles in the study groups. A, GSH levels; B, MDA levels; C, carbonyl levels. MDA is measured as an indicator of lipid peroxidation while carbonyl levels were measured as an indicator of protein oxidation. All values are expressed as mean ± SD. P < .05 was considered statistically significant. a,b,cBars that do not share same letters (superscripts) are significantly different from each other. GSH indicates total glutathione; MDA, malondialdehyde; SD, standard deviation.
The MDA levels in the control, AuNPs, AuNPs/PEG, AuNPs/PEI LMW, and AuNPs/PEI HMW groups were 0.012 ± 0.003 nmol/mg protein, 0.011 ± 0.004 nmol/mg protein, 0.010 ± 0.000 nmol/mg protein, 0.010 ± 0.000 nmol/mg protein, and 0.044 ± 0.010 nmol/mg protein, respectively. In AuNPs/PEI HMW group, MDA levels were 253.53% higher than control group and 311.17% higher than AuNP group (P < 0.05, both).
Carbonyl levels in the control, AuNPs, AuNPs/PEG, AuNPs/PEI LMW, and AuNPs/PEI HMW groups were 0.26 ± 0.09 nmol/mg protein, 0.31 ± 0.13 nmol/mg protein, 0.42 ± 0.26 nmol/mg protein, 0.65 ± 0.31 nmol/mg protein, and 1.46 ± 0.35 nmol/mg protein, respectively. The increases in carbonyl levels in AuNPs/PEG and AuNPs/PEI HMW groups were found be significantly higher than control (61.67% and 462.41%, respectively; P < 0.05, both). The carbonyl levels measured in AuNPs/PEG and AuNPs/PEI HMW groups were also higher than AuNP group (33.97% and 366.07%, respectively; P < 0.05, both).
DNA Damage
The 8-OHDG levels in the study groups are given in Figure 6. The 8-OHDG levels in the control, AuNPs, AuNPs/PEG, AuNPs/PEI LMW, and AuNPs/PEI HMW groups were 0.90 ± 0.47 ng/mL, 1.34 ± 0.63 ng/mL protein, 0.64 ± 0.54 ng/mL, 0.80 ± 0.60 ng/mL, and 1.20 ± 0.60 ng/mL, respectively. The differences between the study groups were not statistically significant.
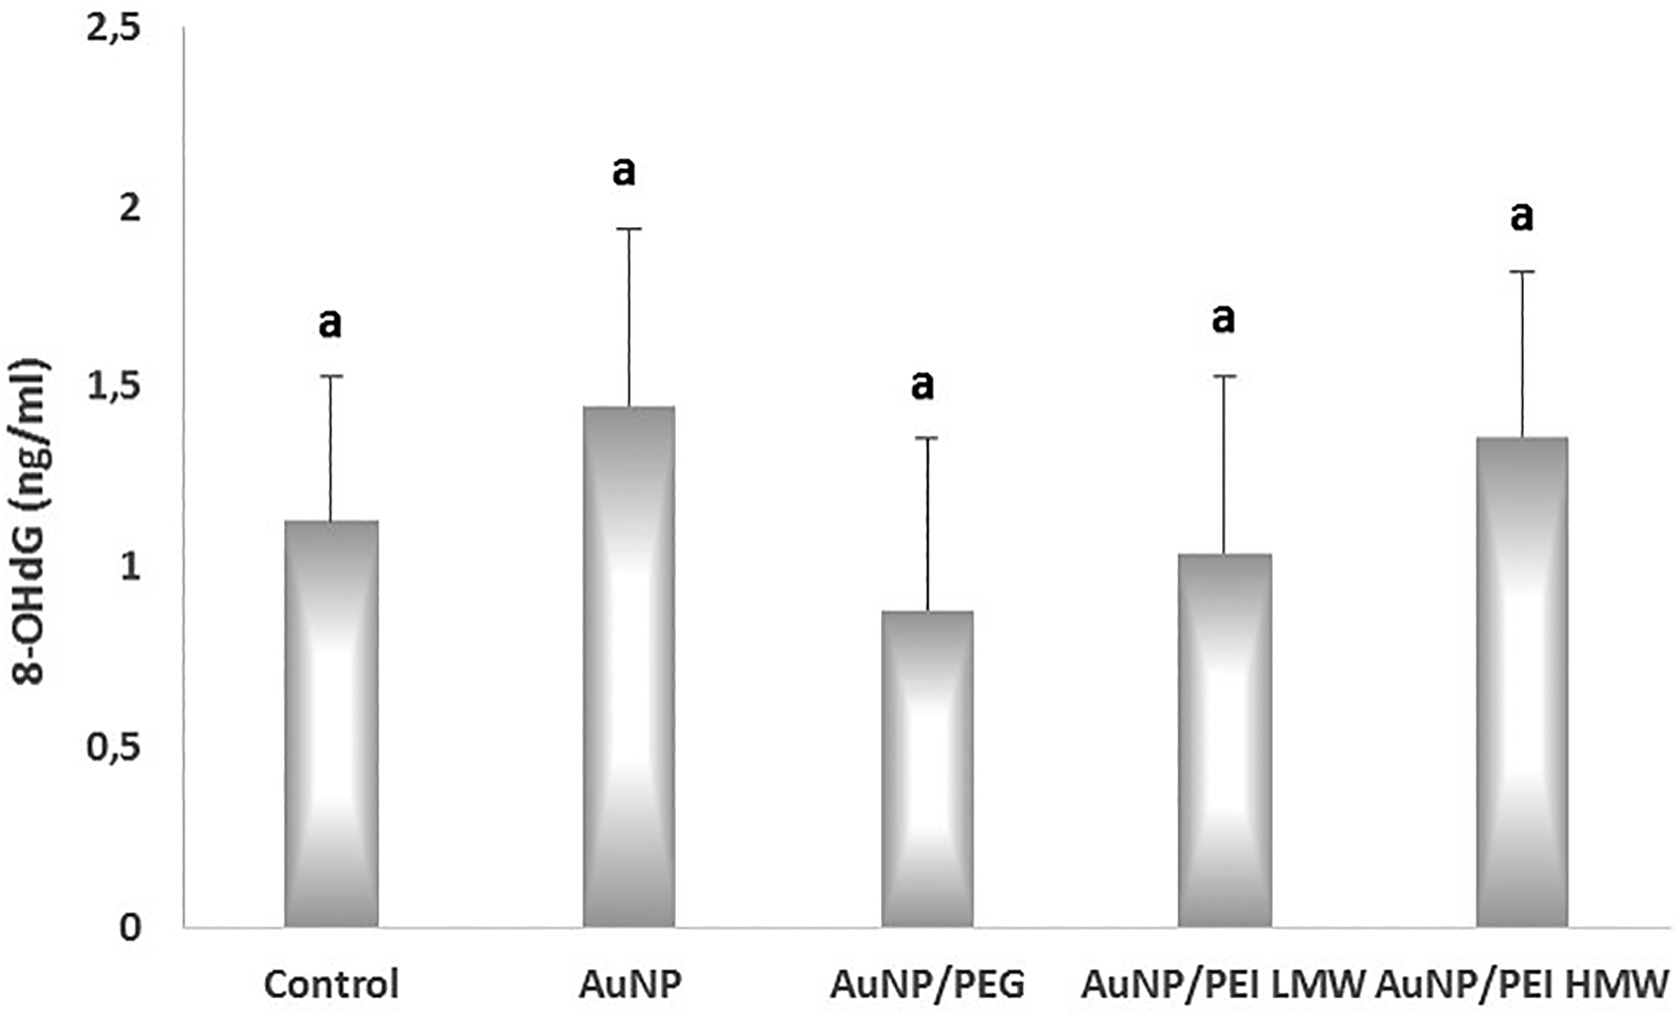
The effects of nanoparticles on DNA damage in the study groups. P < .05 was considered statistically significant. 8-OHdG indicates 8-hydroxy-2′-deoxyguanosine.
Discussion
Gold nanoparticles have been used in different areas such as medicine, biotechnology, and the food industry. 28 Therefore, evaluation of their safety is essential to determine their health risks. The toxicity mechanism of AuNPs was suggested to be due to the protein denaturation, membrane damage, DNA damage, and immunoreactivity. 28,29 Furthermore, oxidative stress is one of the mechanisms underlying the toxic effects of AuNPs, as also suggested for most of the nanoparticles in general. 30 -32
Gold nanoparticles can be coated with various biocompatible polymers. These polymers provide an appropriate surface chemistry and stability. Aggregation-related instability can be prevented by coating the AuNP surface with polymers. Polymers such as PEG and PEI are generally used in the surface coating of AuNPs. These polymeric ligands improve the long-term stability of AuNPs, increase the biocompatibility and hydrophilicity of the outer surface, and make the solubility adjustable. 30,32,33,34
In the current work, oxidative stress was assessed as one of the mechanisms underlying the possible toxicity of AuNPs. Moreover, this study also investigated how surface coating can change the oxidative potential of AuNPs. It has been suggested that nanoparticles can cause a wide variety of toxic effects on many organs/tissues in the biological systems. 1,30,31,32,35 When these particles are inhaled, the primary target organs are the lungs. Depending on their size, nanoparticles may accumulate in the alveolar regions. 36,37 Due to the association of the alveolar region with the endothelium, nanoparticles can reach the bloodstream and can be distributed to other organs such as liver and kidney. 38 In the current study, HepG2 cells have been chosen since liver is one of the main target organs. 39 Moreover, AuNPs are used for tumor imaging, tumor ablation, and targeted drug delivery for liver and other organs. 5,6,40
Gold nanoparticles are generally considered as nontoxic particles. 40 However, the results of different studies on their toxic effects are contradictory. 41 -44 It has been reported that their cytotoxic potential can vary not only depending on their shape, surface chemistry, or size but also the cell type, organism, application type, and period are important factors. When applied to in vitro systems, AuNPs exert different toxic properties and IC50 doses depending on the properties of cells used in the experiments. 35,41 -45 In the study by Mateo et al, the researchers evaluated the cytotoxicity and oxidative stress causing potentials of AuNPs (30, 50, and 90 nm) in human leukemia (HL-60) and HepG2 cell lines. Gold nanoparticles induced dose and time-dependent cytotoxicity with IC50 values greater than 15 μg/mL in both of the cell lines. The HL-60 cells were more sensitive to the cytotoxic response than HepG2 cells. Nanoparticle size slightly influenced the cytotoxic potentials of AuNPs. All particle sizes of AuNPs caused an almost 2-fold elevation in ROS production in both of the cell lines. In addition, the researchers pointed out that smaller NPs lead to more ROS formation. 35 There are also studies suggesting that ROS formation is independent from particle size for certain nanoparticles. 46 However, there are studies that report no changes in intracellular ROS levels of Caco-2 cells when treated with AuNPs. 47
In the study by Kang et al, researchers determined the possible genotoxic potential of AuNPs in vitro. Four different sizes of AuNPs (4, 15, 100, or 200 nm) were applied to L5178Y cells. Treatment with 4 nm AuNPs induced both dose- and time-dependent cytotoxicity, while other sizes did not cause a reduction in cell viability. However, in Comet assay, the treatment with 100 and 200 nm AuNPs caused marked increases in DNA damage versus control (P < 0.01). Moreover, after exposure of L5178Y cells to 100 and 200 nm AuNPs, researchers observed significant increases in tumor necrosis factor messenger RNA expressions compared to the control (P < 0.05 and P < 0.01, respectively). Researchers suggested that AuNP-induced DNA damage in L5178Y cells can be due to induction of oxidative stress. 48 Vijayakumar and Ganesan reported that citrate stabilized AuNPs with sizes of 3, 8, and 30 nm caused cell death within 24 hours, while noncoated AuNPs (5, 6, 10, 17, and 45 nm) did not cause any decrease in cell viability in both human breast cancer (MCF-7) and human prostate cancer (PC-3) cell lines, indicating the role of particle size in cytotoxic potentials of nanoparticles. 45 In another study by Chompoosor et al, 20 nm AuNPs were separated in 4 groups according to their hydrophobic alkyl chain length (AuNPs 1 to 4; with increasing side chains), and HeLa cells were exposed to those nanoparticles for 24 hours. Researchers determined that both acute cytotoxicity and genotoxicity of positively charged AuNPs depend on the hydrophobicity of the ligands attached. With the increasing hydrophobicity of the nanoparticles, a higher cytotoxicity was observed, along with increased intracellular ROS production. However, DNA damage decreased with increasing particle hydrophobicity. Therefore, surface modifications of nanoparticles may affect their cytotoxic and oxidative potentials. 49 In the study on the cytotoxicity of PEI-functionalized AuNPs, human embryonic kidney cells (HEK293), HeLa cells, human epithelial colorectal adenocarcinoma cells (Coco-2), and HepG2 cell lines were used; the efficacy of only PEI and AuNPs/PEI exposure on cell viability was assessed by MTT assay and compared to the control group. After 48 hours of incubation, maximum cell viability was determined as 95.4% for HEK293 cells, 94.9% for HeLa cells, 98.2% for HepG2 cells, and 76.7% for Caco-2 cells with AuNPs/PEI exposure. The HeLa and HepG2 cells showed more than 90% cell viability. 50
In the current study, we evaluated the effects of polymer coating on the cytotoxic potential of AuNPs (45 nm) in HepG2 cells for 24 hours. We observed that both PEG and PEI 2,000 coating of AuNPs provided a higher IC50 dose, therefore provided decreases in the cytotoxic potentials of AuNPs. However, surface modifications of AuNPs did not provide any decreases in the intracellular ROS production. Even if the same cell lines are used, conflicting results can be obtained while conducting cytotoxicity tests with nanoparticles. Therefore, for this purpose, National Institute of Standards and Technology (NIST) developed sterile, zero valent, 10, 30, and 60 nm sized AuNPs. In the study conducted with these AuNPs, their cytotoxic, oxidative, and DNA damaging potentials were evaluated in HepG2 cells. Cells were exposed to AuNPs for 3 hours at different concentrations (0.0002 μg/mL, 0.002 μg/ml, 0.02 μg/mL, or 0.2 μg/mL), AuNPs did not cause cell death, free radical production, and oxidative DNA damage at doses lower than 2 μg/mL. These results have shown that NIST AuNPs can be used as control materials for in vitro/in vivo genotoxicity studies. 51 However, NIST nanoparticles are not good reference materials as they do not induce oxidative DNA damage. Nelson et al suggested that NIST AuNPs could potentially serve as suitable negative-control nanoparticle reference materials for in vitro and in vivo genotoxicity studies. Thus, they may be substantial promising to improve the reproducibility and reliability of nanoparticle genotoxicity studies. 51
There are also conflicting results in the literature how AuNPs modify intracellular oxidative stress. While the decrease in SOD activities were dependent on the cell line, HepG2, but not HL-60 cells, exhibited a decrease of SOD activity. In our study, we did not observe any alterations in SOD activity after AuNPs were applied to HepG2 cells. However, SOD activity increased significantly after cells were exposed to PEI LMW and PEI HMW-coated AuNPs. These results suggest that coating with PEI (either 2,000 or 25,000) may increase superoxide formation within the cells, and SOD activity increases as an adaptive response. Moreover, the increases in GPx1 and CAT activities in AuNPs/PEI LMW and AuNPs/PEI HMW groups also point out to adaptive responses to oxidative insults.
In the study mentioned before by Mateo et al, researchers observed that in the both HL-60 and HepG2 cells, intracellular GSH content was drastically depleted after 72 hours of incubation with all of the particle sizes of AuNPs. 35 A similar finding was obtained in a study conducted by Gao et al. 4 Researchers reported that GSH levels in human hepatic cells were inversely correlated with the diameter of AuNPs. In our study, we observed that there was no significant difference in the total GSH levels between control group and AuNPs-applied group. Moreover, PEG and PEI LMW coatings also did not affect total GSH concentrations; however, there was a significant increase in GSH levels in PEI HMW-coated AuNP applied group.
Li et al observed an increase in lipid hydroperoxide and MDA levels after lung fibroblast cells were exposed to 20 nm sized AuNPs for 24 hours. Also, autophagosome formation and upregulation of autophagy proteins have been observed. Researchers emphasized that AuNPs created an oxidant environment and at the same time, these nanoparticles also affected the regulation of cellular stress response mechanisms while inducing the formation of autophagosomes. In the present work, we observed that AuNPs did not induce lipid peroxidation. However, coating AuNPs with PEI HMW caused a significant increase in MDA levels as well as in protein oxidation. 52
A limited number of in vitro studies conducted on different cell lines also showed conflicting results on the effects of AuNPs on DNA damage. In most of these studies, DNA damage was determined by using the Comet assay. Schneider et al did not observe any DNA damage after AuNPs were applied to colorectal adenocarcinoma cells (HT29) by using Comet assay. 53 In the study by Xia et al, 20 and 50 nm AuNPs did not induce obvious DNA damage in HepG2 cells at the tested concentrations, whereas 5 nm NPs induced a dose-dependent increment in DNA damage after 24-hour exposure in the Comet assay. Furthermore, 5 nm AuNPs induced cell cycle arrest in G1 phase in response to DNA damage and promoted the production of ROS. In the chromosomal aberration test, AuNPs exposure did not result in the increase of the frequency of chromosomal aberrations in Chinese hamster lung cells. 54 In another in vitro study, Fraqa et al observed that only citrate-coated AuNPs induced DNA damage in HepG2 cells, while 11-mercaptoundecanoic acid-coated AuNPs did not, indicating the role of specific coatings on DNA damage formation. In the in vivo study, 55 Cardoso et al showed that acute administration of AuNPs to adult rats presented higher levels of damage frequency and damage index in the cerebral cortex DNA versus control. Researchers also determined that AuNPs with 30 nm diameters presented higher levels of damage frequency and damage index in the DNA compared to the AuNPs with a diameter of 10 nm. After chronic administration of AuNPs of 10 and 30 nm, researchers observed that AuNPs caused DNA damage, however, there is no difference between the 10 and 30 nm groups in the levels of DNA damage for both parameters of the Comet assay. They concluded that AuNPs at both 10 and 30 nm diameters could lead to DNA damage after both acute and chronic treatments although a higher damage was observed after chronic administration. 56 In our study, despite an increase in ROS levels with both coated and uncoated AuNPs, 8-OHdG levels did not show any increase. These findings indicate that AuNPs at the IC30 doses did not lead to DNA base lesions in HepG2 cells. Moreover, we can suggest that as the treatment period is 24 hours, some of the base damage caused by the application of coated and uncoated AuNPs may have been repaired.
Cytotoxicity and oxidative stress can also be caused by different metal nanomaterials, including silver, copper, titanium, and iron nanoparticles. 57 -61 To overcome the apoptotic and oxidant effects, the coating of metal nanoparticles with different chemicals including PEG has been tested. Bastos et al observed that the apoptotic effects of silver nanoparticles can be decreased by PEG coating in HepG2 cells. In addition to decrease in apoptotic protein expressions, PEG-coated silver nanoparticles provided cell cycle regulation and improved cell dynamics. 62 Sun et al observed that PEG-coated titanium dioxide nanoparticles did not cause cytotoxic effects in HepG2 cells; indeed they increased cell proliferation. 63 Qu et al suggested that PEG-chitosan (PEG-CS) coating of iron oxide nanoparticles (with high saturated magnetization as carriers of 10-hydroxycamptothecin [HCPT]) lowered their cytotoxic effects, and HCPT-loaded PEG-CS-Fe3O4 may serve as a promising magnetic targeting therapy with dual therapeutic effects (hyperthermia combined with chemotherapy) for the treatment of tumor cells. 64
Although several researches are now conducted on different in vitro and in vivo systems in order to evaluate the toxic effects of nanoparticles, overcoming RES has long been a vital challenge to nanoparticles as drug carriers. Modification of nanoparticles with different coating, particularly with PEG, helps avoiding clearance by macrophages. However, this modification suppresses their internalization by target cells. The RES-specific blocking systems (like enzyme-resistant peptide ligands on liposomes or the codisposition of chitosan-based nanoparticles by macrophages) can utilize a “don’t-eat-us” strategy. 65,66 Moreover, another problem is that 30% to 99% of administered nanoparticles will accumulate and sequester in the liver after administration into the body. This phenomenon can cause reduced delivery to the targeted diseased tissue and potentially leads to increased toxicity at the hepatic cellular level. Reticuloendothelial system and liver accumulation are very important issues for AuNPs as well as for other metal nanoparticles. 67
In conclusion, we can state that AuNPs as well as PEG coating of AuNPs did not induce oxidative stress and DNA damage in HepG2 cells. However, we observed a disruption in oxidant/antioxidant balance with PEI coating, particularly by coating with PEI HMW. Our findings suggest that PEG coating AuNPs can be a better choice. However, more research should be conducted before using coated AuNPs in the biomedical applications and in the clinical practice.
Footnotes
Author Contributions
Gamze Tilbe Sen, Gizem Ozkemahli, and Reza Shahbazi contributed to acquisition, analysis, or interpretation of data and drafted the manuscript; Pinar Erkekoglu, Kezban Ulubayram, and Belma Kocer-Gumusel substantially contributed to conception or design, contributed to acquisition, analysis, or interpretation of data, and critically revised the manuscript for important intellectual content. All authors gave final approval and agree to be accountable for all aspects of the work in ensuring that questions relating to the accuracy or integrity of any part of the work are appropriately investigated and resolved.
Declaration of Conflicting Interests
The author(s) declared no potential conflicts of interest with respect to the research, authorship, and/or publication of this article.
Funding
The author(s) received no financial support for the research, authorship, and/or publication of this article.