
Abstract
As a powerful psychostimulant with high potential for abuse, methamphetamine (Meth) could cause long-lasting abnormalities in retinas. The purpose of this study was to investigate the effects of systemic administration of Meth at low dose on retinal damage and understand the underlying mechanisms of pathology. CD1 mice were treated with 0.5 mg/kg or 1 mg/kg Meth by intraperitoneal injection daily for 2 months, mice treated with saline were used as negative control. Electroretinography (ERG) reflects the mass response of photoreceptor cells and was used to test the outer retinal function after Meth treatment. Toluidine blue staining was used to show the retinal morphology and evaluate the photoreceptor cell loss. Inflammatory factors were measured by enzyme-linked immunosorbent assay to show the inflammatory response. Terminal deoxynucleotidyl transferase dUTP Nick end labeling assay was used to detect the apoptosis-positive cells. Real-time polymerase chain reaction and Western blot were applied to measure the gene and protein change to explore the underlying mechanisms. Results demonstrated that retinal damage was caused by Meth treatment after 2 months, evidenced by loss of rod photoreceptor cells; decreased ERG amplitude; increased apoptotic photoreceptor cells, cytochrome-c release, caspase-3 activity, caspase-9 activity, and apoptosis-related protein expression; increased malondialdehyde level as well as nicotinamide adenine dinucleotide phosphate oxidase 4 protein expression; decreased anti-oxidative agents glutathione as well as superoxide dismutase levels; and increased production and gene expression of inflammatory factors. Our study indicated that systemic administration of Meth caused neurotoxic effects on CD1 mouse retinas, providing the potential mechanisms for the retina damage caused by Meth abuse.
Introduction
As a highly addictive psychostimulant drug, methamphetamine (Meth) has wide-ranging effects on the central nervous system (CNS) through the nonexocytoxic mechanism releasing monoamine neurotransmitters. 1,2 About half a million individuals use Meth weekly, which produces brain damage and neuropsychiatric disorders. 3,4 Methamphetamine abuse is associated with many adverse psychiatric and medical consequences. Methamphetamine-induced ophthalmic complications are rarely discussed but include retinal vasculitis, endophthalmitis, episcleritis, panophthalmitis, scleritis, corneal ulceration, retinopathy, and transient visual losses. Moreover, there has been an increase in drug-induced complications in fetuses and newborn babies because of marked increase in the prevalence of its use among pregnant women. 5 Although much progress has been made in understanding the neurological consequences of Meth abuse, its toxic effects on the visual system have not been completely elucidated, specifically on the retina. 6,7 Thereafter, it is important to explore the underlying mechanisms.
At binge doses, Meth could cause a selective degeneration of dopaminergic terminals in the striatum. Dopamine transporter inhibitors and dopamine D2 receptor antagonists protect against neurotoxicity of Meth by decreasing intracellular dopamine content. 8 In a retinal ischemia model to study the recovery of retinal function, the ERG b-wave amplitude recovery increased after retinal ischemia by treating with dopamine antagonists to decrease dopamine and consequently dopamine autoxidation as well as production of reactive oxygen species, implying that any substance that alters the retinal dopaminergic system, such as Meth, could influence the retinal function. 8,9 Studies showed Meth-caused cytotoxicity involved an excessive production of oxygen-based free radicals, resulting in neuronal death through apoptosis. 10,11 Treating rats with Meth (5 mg/kg every 2 hours for a period of 6 hours daily for 10 days) repeatedly resulted in the imbalance of antioxidative/oxidative system in retinas, and the resultant increased oxidative stress may play a pivotal role in the pathophysiology of retinal degenerative events and impair the normal function of the visual system. 12
Meth induced neurotoxicity in animal models at high dose with short interval (mice were injected with Meth in 4 intraperitoneal [ip] doses of 5 mg/kg, with a 2-hour interval between each injection), which may be related to microglial activation. 13 Unfortunately, little is known about effects of systemic administration of Meth at low dose on retinas of adult mice. The inflammatory reaction accompanies all acute processes in the CNS (such as stroke or traumatic brain injury) and chronic neurodegenerative processes (such as Parkinson’s or Alzheimer’s disease) and contribute to restoration of the function through the stage of cleaning of damage tissue. However, studies have indicated neuroinflammation as an important mechanism relating to various diseases of the CNS because of an excessive vulnerability of the nervous tissue or impaired regulation. 14 Exposure to Meth (rats were intraperitoneally injected with Meth at 15 mg/kg for 8 times at 12-hour interval) causing the neuron damage was associated with activation of the innate neuroinflammatory response, including some of the cellular elements involved (microglia, astrocytes, and vascular endothelial cells), key receptor pathways, and primary inflammatory cytokines (interleukin [IL]-1β, IL-6, and tumor necrosis factor α [TNF-α]). 15,16 Meth has been demonstrated to promote macrophage polarization to M1 stage and produce proinflammatory cytokines to cause photoreceptor cell damage at low concentration in vitro. 17
This study was performed to investigate whether long-term systemic administration of Meth at low dose would result in toxic effects on CD1 mouse retinas, providing the potential mechanisms for the retina damage caused by Meth abuse.
Materials and Methods
Mouse Treatment
Six-week-old CD1 mice were purchased from Charles River Laboratory (Beijing, China) and maintained under specific pathogen-free conditions. Mice had free access to food and water during the whole experimental period. All animal procedures were performed in strict accordance with the regulation of the Use of Animals in Ophthalmic and Vision Research and were approved by the Ethical Committee on Animal Care and Use of Anhui Medical University. CD1 mice have been shown to be susceptible to Meth and are considered as the most sensitive model for investigating Meth toxicity. 18 CD1 mice were divided into 3 groups (n = 10), receiving daily ip injection of saline, 0.5 mg/kg Meth, or 1 mg/kg Meth for 2 months. Electroretinography (ERG) was recorded after 1- and 2-month treatment. At the end of the experiment, mice were sacrificed, and their retina tissues were harvested for a variety of assays.
Electroretinography
Mice were anesthetized with a mixture of ketamine (80 mg/kg) and xylazine (16 mg/kg) after overnight dark adaptation. The pupils were dilated with eye drops (2.5% phenylephrine HCl, 1% cyclopentolate HCl, and 1% mydriacyl), and the corneal surface was anesthetized with 0.5% proparacaine HCl. The ERG test was conducted from the corneal surface with a series of stimulus intensities. In light-adapted session, 30 lux background light adapted the retina, and the flash luminance ranged from –0.8 to 1.9 log cd s/m2. In dark-adapted session, the flash luminance ranged from –2.4 to 2.1 log cd s/m2. The ERG was recorded by an Electrophysiology System (UTAS-E3000; LKC Technologies, Gaithersburg, Maryland). 19
Terminal deoxynucleotidyl transferase dUTP nick end labeling Assay
Apoptosis of photoreceptor cells was detected by the In Situ Cell Death Detection Kit (Roche Applied Science, Indianapolis, Indiana). After sacrifice with inhaling CO2, mouse eye balls were fixed with 4% paraformaldehyde for 4 hours and then dehydrated by graded sucrose solution. Eye balls were embedded in OCT compound, and 10-µm frozen sections were cut passing through the optic nerve head sagittally. After permeabilization for 2 minutes on ice, frozen sections were incubated with the terminal deoxynucleotidyl transferase dUTP nick end labeling (TUNEL) reaction mixture for 60 minutes at 37°C and rinsed with phosphate-buffered saline. After adding 4’,6-diamidino-2-phenylindole, the sections were sealed and visualized under the fluorescence microscope. 20
Toluidine Blue Staining
Toluidine blue is a basic thiazine metachromatic dye with high affinity for acidic tissue components. It stains nucleic acids blue and also increases the sharpness of histology slide images. After sacrifice with inhaling CO2, mouse eye balls were fixed in Karnovsky’s fixative, followed by 1% osmium tetroxide, graded ethanol, and then propylene oxide. Eye balls were then embedded in the plastic resin mixture. Sections were cut with 1-µm thickness sagittally, stained with 1% toluidine blue for 20 seconds, and washed for 5 minutes with running distilled water. Washing was repeated 3 times until the water is clean. An Olympus BX 60 microscope (Olympus, Shinjuku, Japan) was used to take photographs at 200 µm from the optic disk edge.
Superoxide Dismutase Activity, Malondialdehyde, and Glutathione Content Measurement
After sacrifice with inhaling CO2, the retinas were ground with ReadyPrep Mini Grinders in lysis buffer (ReadyPrep Protein Extraction Kit; Bio-Rad, Hercules, California). Cell lysate was used to determine the malondialdehyde (MDA) as well as glutathione (GSH) levels and superoxide dismutase (SOD) activity by enzyme-linked immunosorbent assay (ELISA) kits according to the manufacturers’ instruction.
Cytochrome C Assay
Retinas were harvested after sacrificing the mice. Cell lysate was obtained as described earlier. The concentration of cytochrome C was determined by the mouse cytochrome C immunoassay kit (R&D Systems, Minneapolis, Minnesota). Briefly, the monoclonal antibody specific for mouse cytochrome C was precoated onto the microplate. Conjugate of 75 μL (containing monoclonal antibody specific for cytochrome-c conjugated to horseradish peroxidase) and 50 μL of cell lysate were added to each well of the microplate. After 2 hours of incubation, the substrate solution (100 μL) was added to each well and incubated for 30 minutes. Then, the stop solution was added to each well. The optical density of each well was determined with a microplate spectrophotometer at 490 nm.
Caspase Activity Measurement
Retinas were harvested after sacrificing the mice. Cell lysate was obtained as described earlier. The caspase activities in retinas were determined using the fluorescent assay kit (R&D systems) by a microplate reader, respectively, according to the manufacturer’s instruction.
Cytokine Assays
Retinas were harvested after sacrificing the mice. Cell lysate was obtained as described earlier to detect the cytokine levels. IL-1β, IL-6, IL-18, interferon γ (INFγ), and TNFα levels were measured by ELISA kits according to the manufacturer’s instruction. Nitric oxide (NO) was measured by Griess assay.
Real-Time Polymerase Chain Reaction
After sacrifice with inhaling CO2, RNA was extracted from retinas with the Qiagen RNeasy reagents following manufacturer’s protocol, and messenger RNA (mRNA) was transcribed into complementart DNA with SuperScript master mix (Biorad). Quantitative polymerase chain reaction (qPCR) was run on StepOne systems (Thermo Fisher, Waltham, MA, USA) using SYBR green Supermix (Thermo Fisher, Waltham, MA, USA) with comparative C t value method. The mRNA levels were normalized by β-actin.
Western Blot
After sacrifice with inhaling CO2, retinas were lysed with Radioimmunoprecipitation assay (RIPA) buffer (Sigma, St. Louis, MO, USA), supplemented with protease inhibitors (Roche, Basel, Switzerland), phosphatase inhibitors (Thermo Scientific, Waltham, MA, USA), 1 mmol/L EDTA and 1 mmol/L PMSF (phenylmethylsulfonyl fluoride) (Sigma, St. Louis, MO, USA). Protein concentration was determined by Bradford method. After boiling, 40 μg of sample protein was subjected to sodium dodecyl sulfate polyacrylamide gel electrophoresis with 4% to 12% gel. Protein was then transferred to polyvinylidene fluoride membranes. After blocking for 1 hour with 1% bovine serum albumin, membranes were incubated with primary antibodies overnight at 4°C. After washing 3 times, the membranes were incubated with the corresponding secondary antibodies for 1 hour. The membrane was washed 3 times and visualized by the enhanced chemiluminescence system.
Statistical Analysis
Data were presented as mean ± standard deviation (SD) and analyzed with the SAS 9.1 software (SAS Institute, Cary, North Carolina). The ERG data were analyzed by 2-way repeated analysis of variance (ANOVA). The power analysis was conducted by the F-test of 1-way ANOVA, where numbers were considered as outcome and groups as the factor. All other comparisons were made by 1-way ANOVA. The experimental group and the control group were compared by Dunnett t test. P < .05 was considered as significant difference.
Results
Treatment With Meth Caused Retina Damage and Dysfunction in CD1 Mice
Electroretinography, a widely accepted method to evaluate the outer retinal functions and potential disease progression, measures the electrical activity generated by neural and nonneural retinal cells in response to a light stimulus. Our results showed that treatment of mice with Meth for 1 month had modest effects on ERG (maximal amplitude for dark-adapted a wave, saline 565.56 ± 51.62); 0.5 mg/kg Meth 515.78 ± 49.61[P = 0.15 vs saline]; 1 mg/kg Meth 486.31 ± 46.39 [P = 0.035 vs saline]; maximal amplitude for dark-adapted b wave, saline 889.06 ± 80.25; 0.5 mg/kg Meth 855.25 ± 77.60 [P = 0.19 vs saline]; 1 mg/kg Meth 811.76 ± 75.15 [P = 0.043 vs saline]; maximal amplitude for light-adapted b wave, saline 256.88 ± 25.43; 0.5 mg/kg Meth 239.06 ± 24.60 [P = 0.09 vs saline]; and 1 mg/kg Meth 209.37 ± 22.38 [P = 0.038 vs saline]). However, the amplitude dramatically decreased after 2-month treatment with Meth (maximal amplitude for dark-adapted a wave, saline 535.85 ± 53.60; 0.5 mg/kg Meth 452.31 ± 40.39 [P = 0.032 vs saline]; 1 mg/kg Meth 385.78 ± 39.61 [P = 0.008 vs saline]; maximal amplitude for dark-adapted b wave, saline 922.90 ± 81.55; 0.5 mg/kg Meth 805.25 ± 63.60 [P = 0.041 vs saline]; 1 mg/kg Meth 695.39 ± 58.33 [P = 0.006 vs saline]; maximal amplitude for light-adapted b wave, saline 275.88 ± 24.41; 0.5 mg/kg Meth 179.02 ± 17.50 [P = 0.028 vs saline]; and 1 mg/kg Meth 129.06 ± 14.60 [P = 0.005 vs saline]), indicating Meth treatment caused retinal dysfunction. The thickness of outer nuclear layer (ONL) significantly decreased after 2-month Meth treatment (saline 41.47 ± 1.92; 0.5 mg/kg Meth 37.27 ± 1.79 [P = 0.002 vs saline]; and 1 mg/kg Meth 31.43 ± 2.23 [P = 0.001 vs saline]), suggesting Meth treatment caused loss of photoreceptor cells (Figure 1).
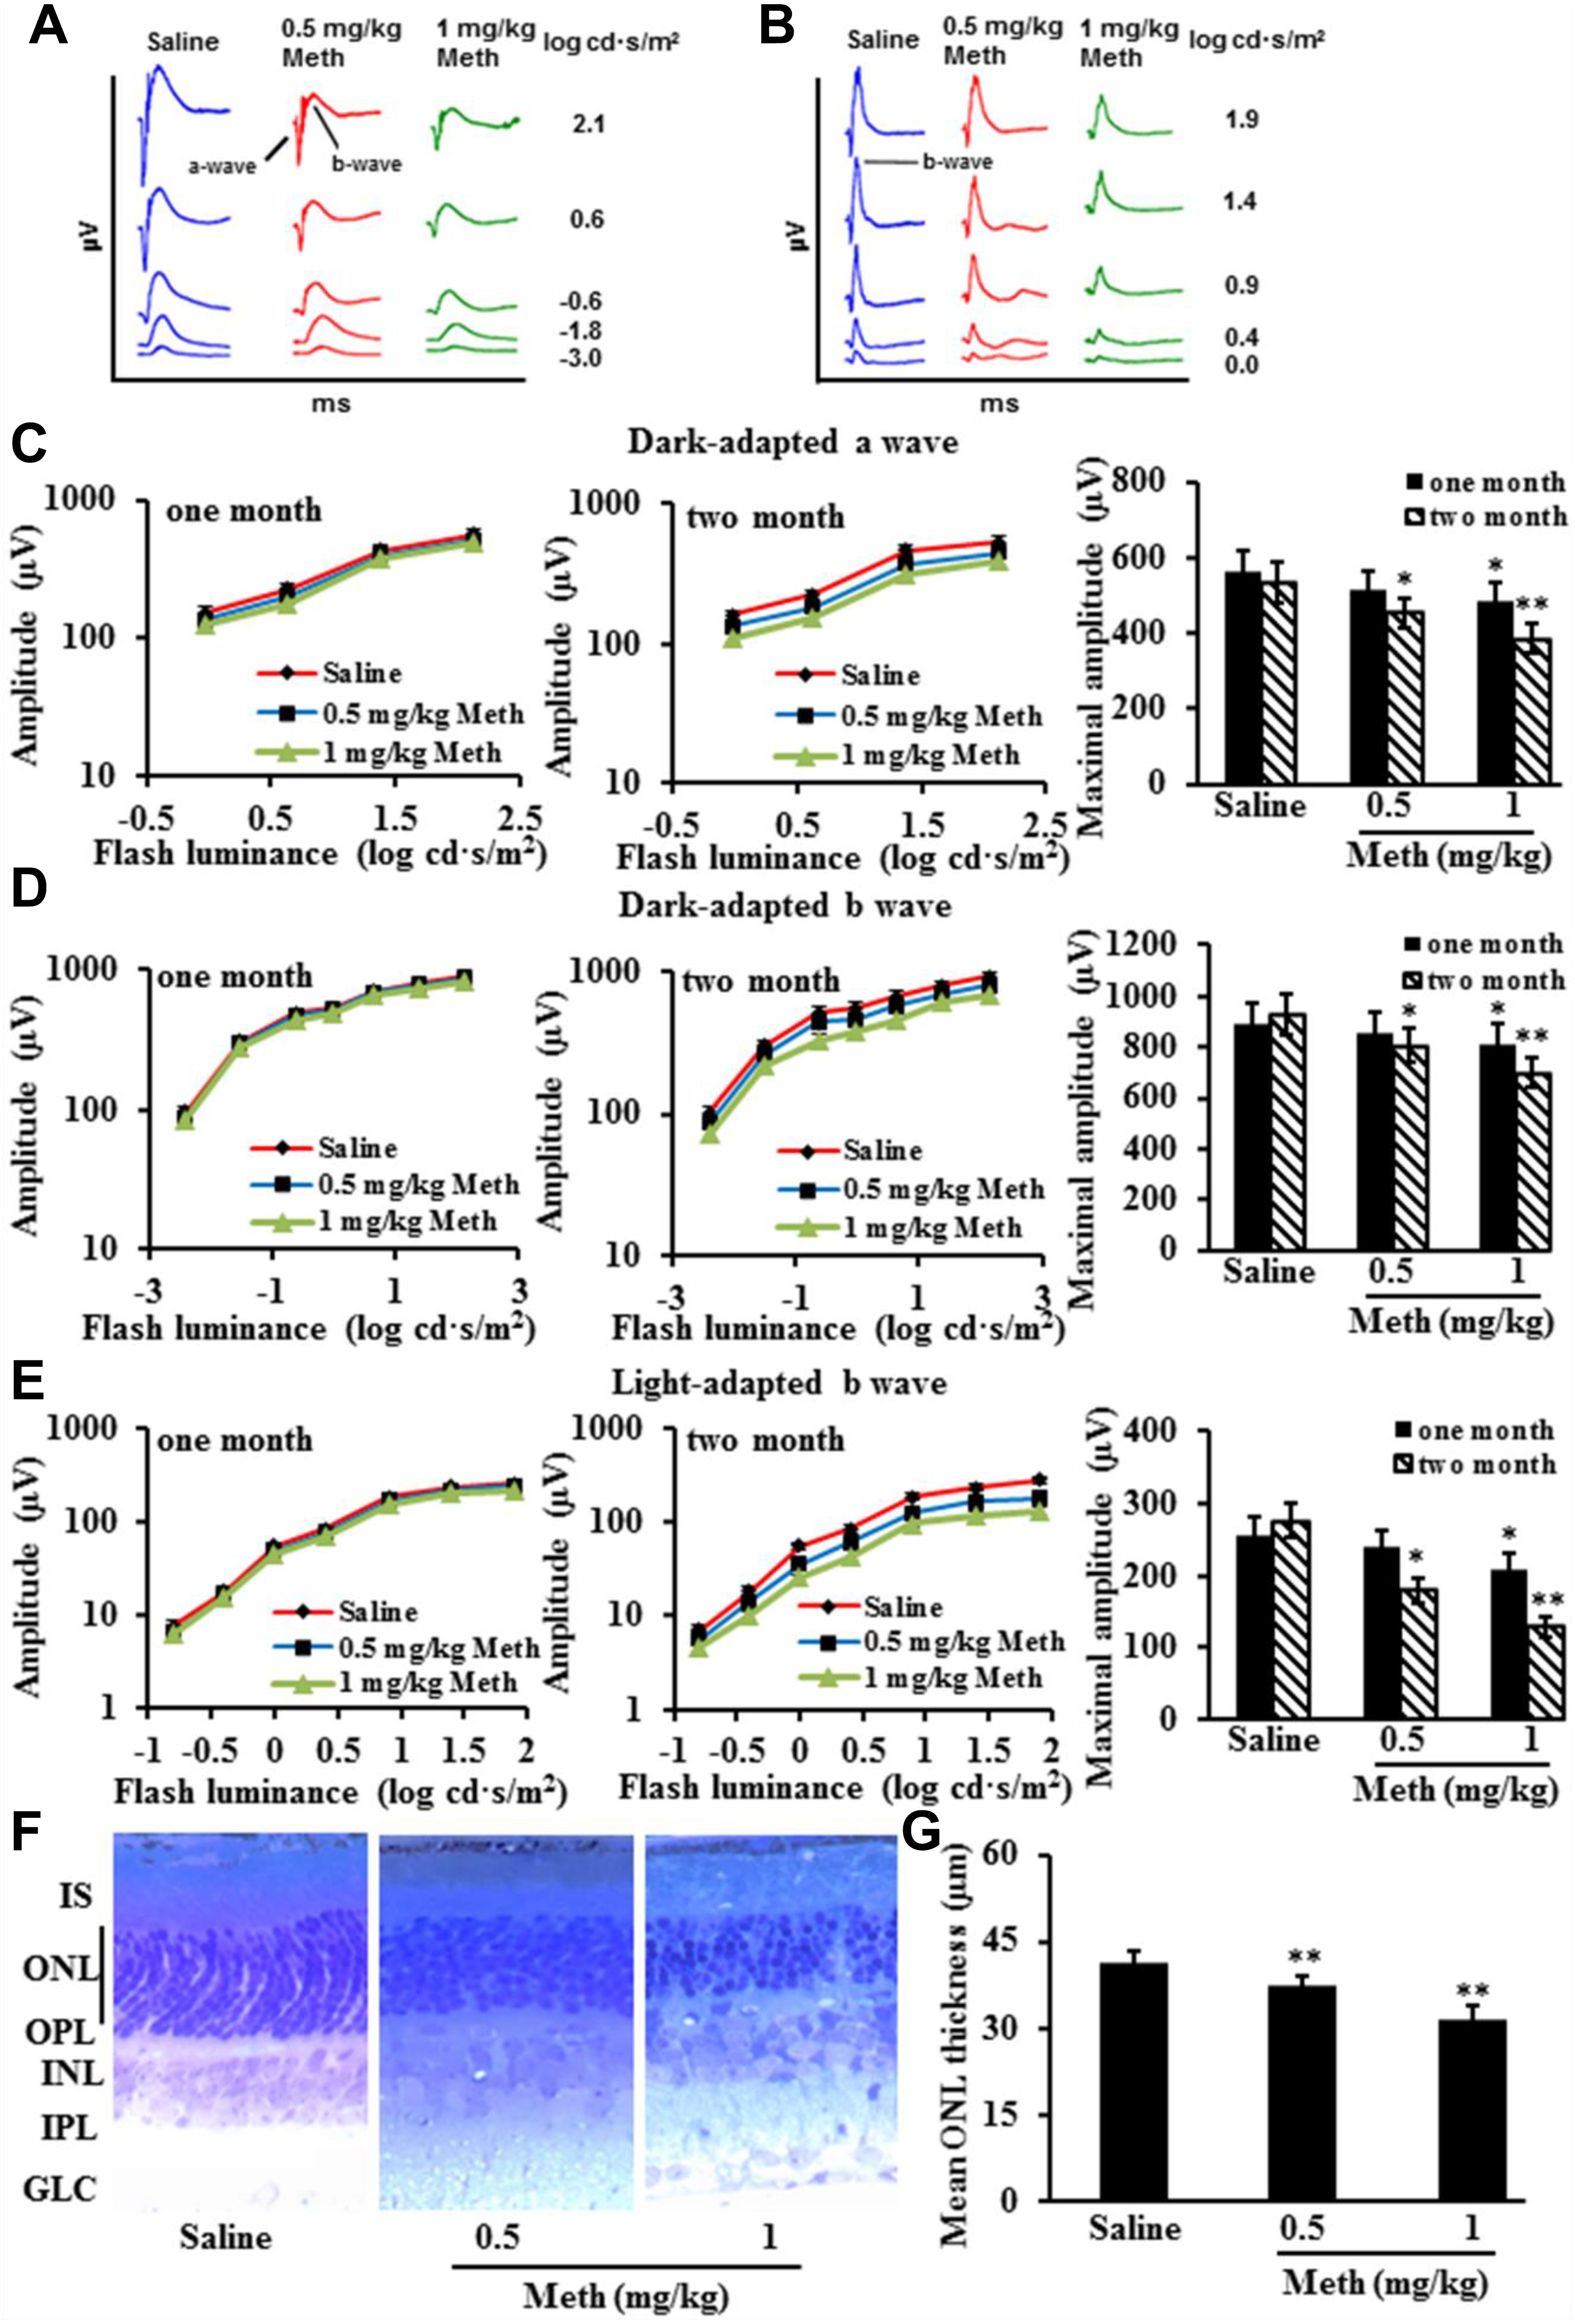
Methamphetamine (Meth) treatment caused retina damage and dysfunction. Electroretinography (ERG) response was obtained from CD1 mice treated with Meth (n = 10) or saline (n = 10), shown by typical dark-adapted ERG waveforms (A) and typical light-adapted ERG waveforms (A). Meth treatment decreased the intensity response of dark-adapted ERG A wave (C), intensity response of dark-adapted ERG B wave (D), and intensity response of light-adapted ERG B wave (E). Representative images (×20) of retina cross-sections with Toluidine blue staining from CD1 mice treated with Meth or saline after 2 months were presented (F). The outer nuclear layer (ONL) was significantly thinner after 2-month Meth treatment (G). Data were expressed as mean ± standard deviation (SD). *P < 0.05, **P < 0.01 versus Saline group.
Treatment With Meth Caused Apoptosis of Photoreceptor Cells
Meth treatment significantly increased apoptotic cells in CD1 mouse retinas (saline 0.6 ± 0.55; 0.5 mg/kg Meth 7.6 ± 2.30 [P = 0.001 vs saline]; 1 mg/kg Meth 15.2 ± 4.21 [P = 0.001 vs saline]), together with significant increase in caspase activities (caspase-3: saline 100.35 ± 4.51; 0.5 mg/kg Meth 119 ± 6.0 [P = 0.013 vs saline]; 1 mg/kg Meth 137 ± 7.55 [P = 0.002 vs saline]; caspase-9: saline 99.5 ± 4.77; 0.5 mg/kg Meth 112.35 ± 5.86 [P = 0.042 vs saline]; 1 mg/kg Meth 126.5 ± 7.02 [P = 0.005 vs saline]) and cytochrome-c release (saline 100.65 ± 5.03; 0.5 mg/kg Meth 116.62 ± 5.86 [P = 0.023 vs saline]; 1 mg/kg Meth 136.35 ± 8.08 [P = 0.003 vs saline]). Proapoptotic protein Bax and Caspase expression significantly increased, while antiapoptotic protein Bcl-2 decreased after Meth treatment (Figure 2).
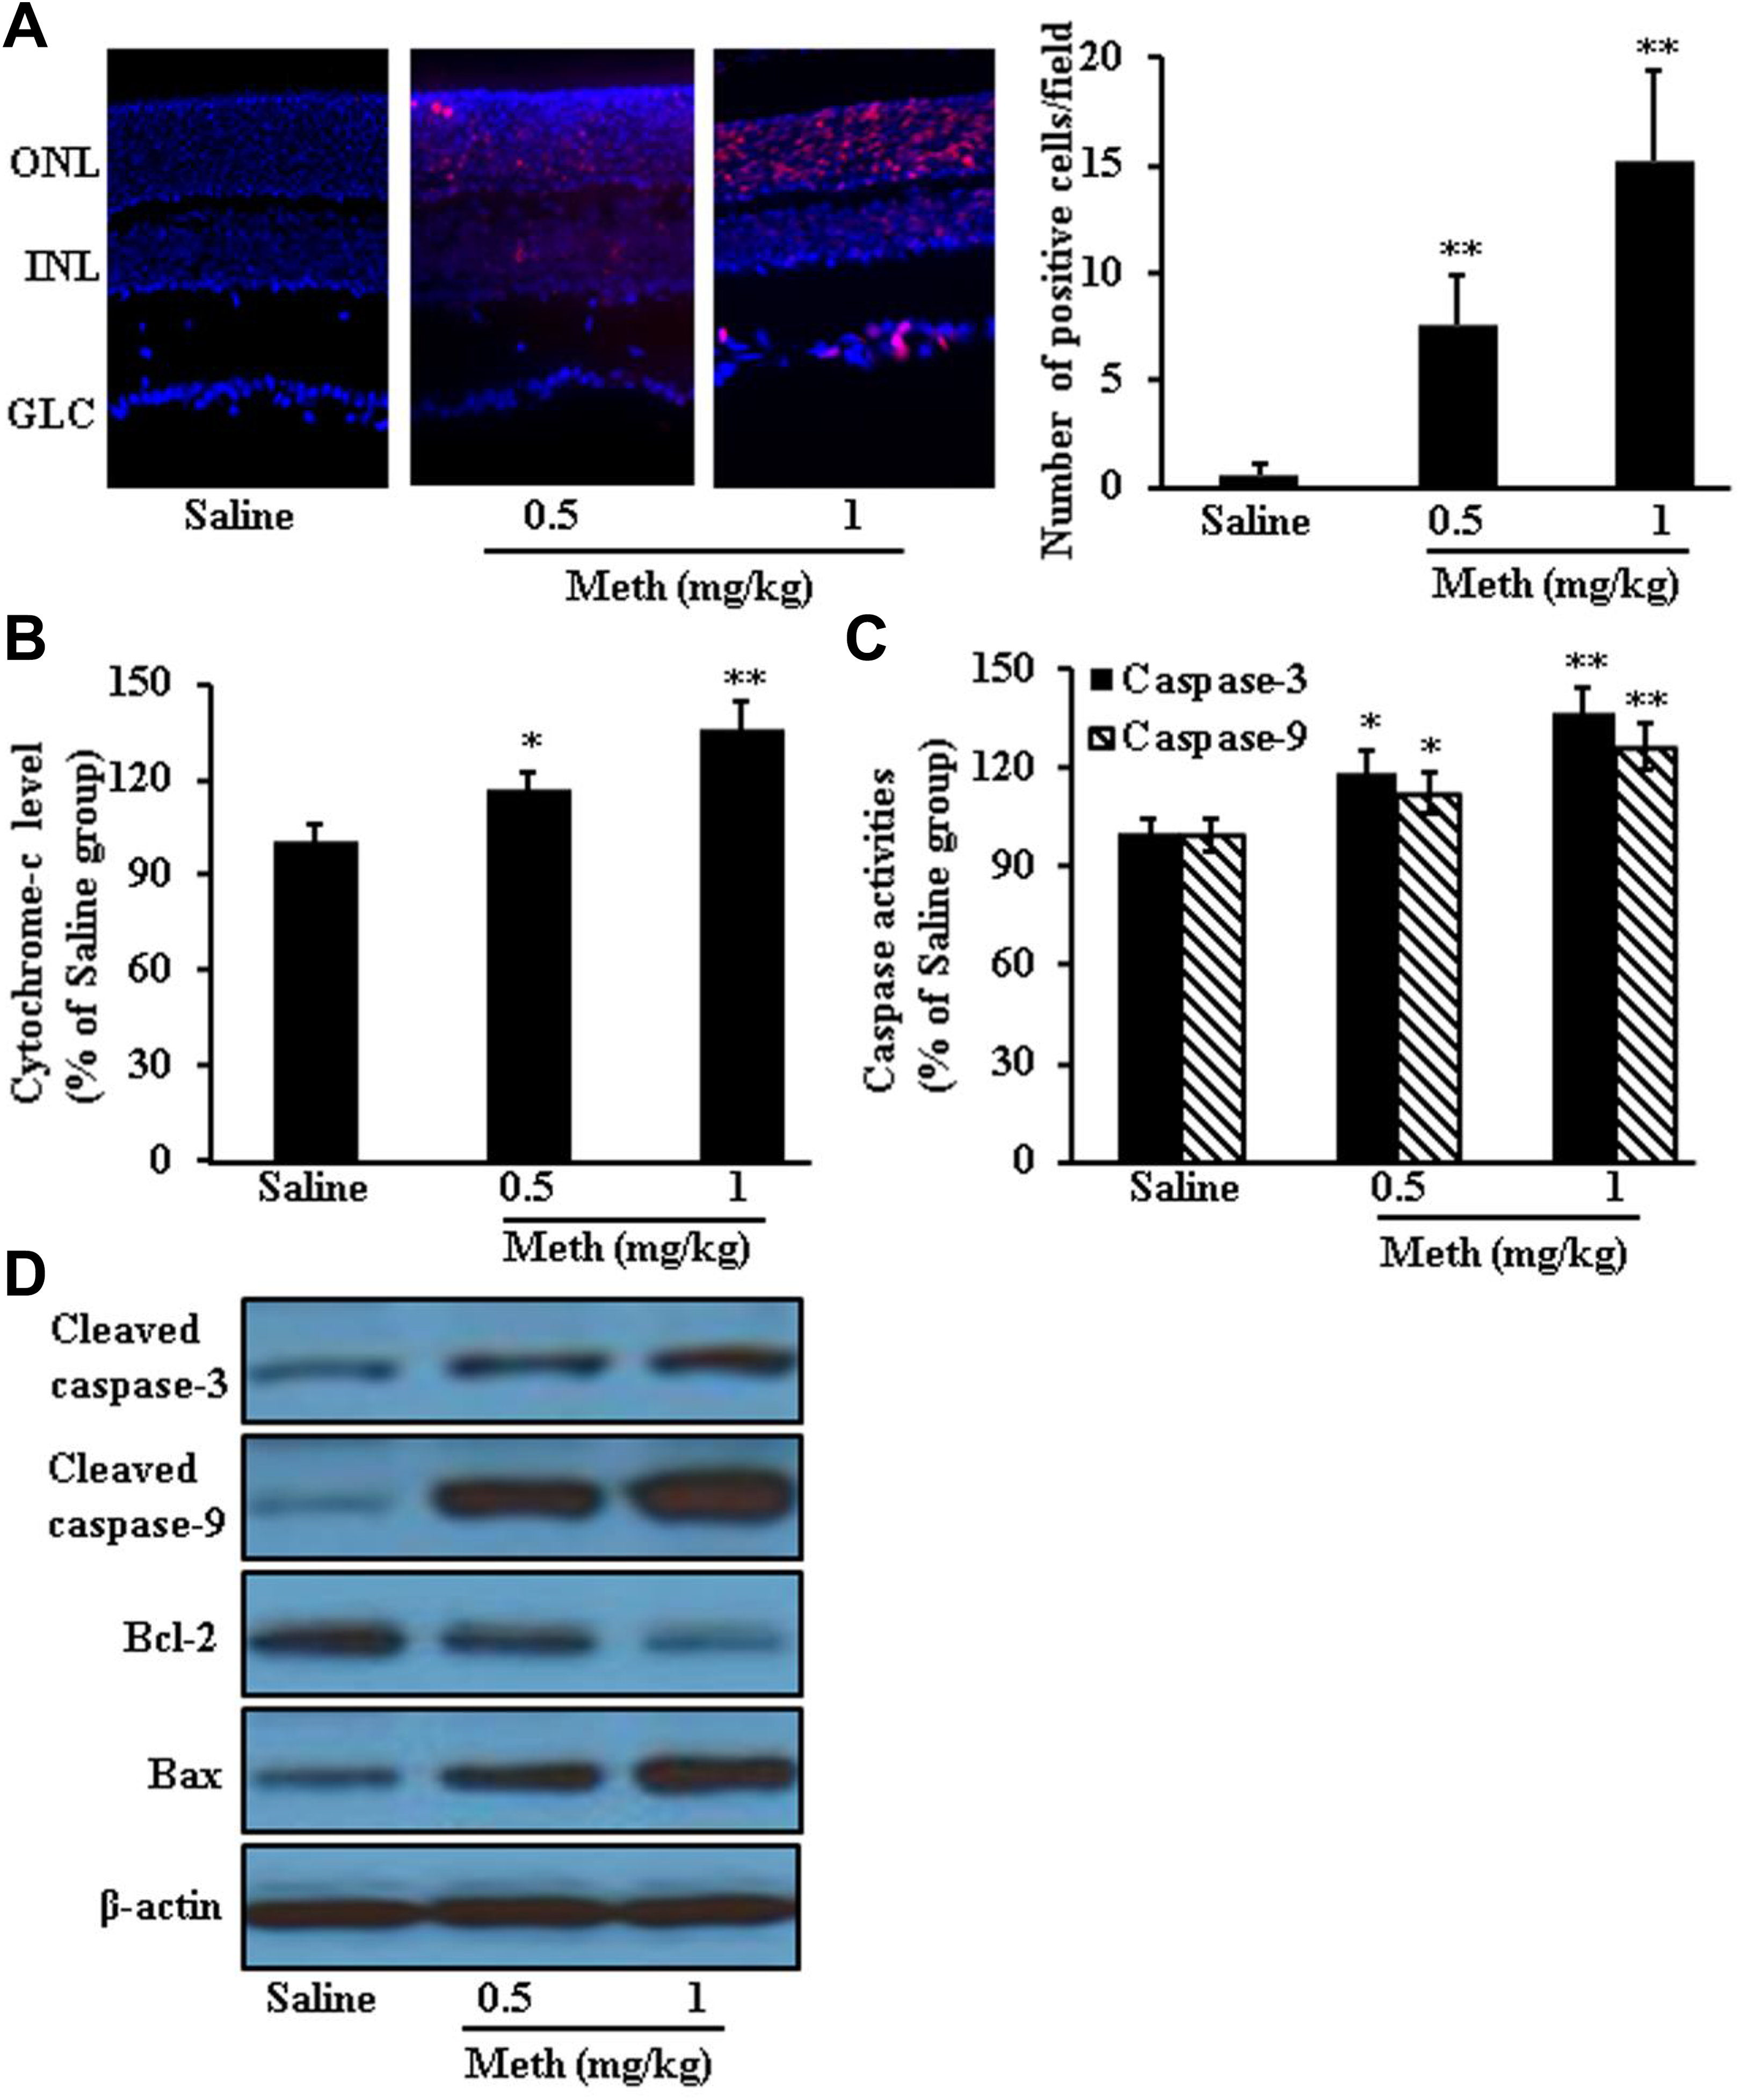
Two-month methamphetamine (Meth) treatment caused photoreceptor cell apoptosis. The red spots indicated the TUNEL-positive cells (×20; A). Meth treatment significantly increased DNA damage (A), cytochrome-c release (B), and caspase activities (C). Meth treatment also decreased antiapoptotic protein Bcl-2, while increased proapoptotic protein Bax and caspase expression (D). Data were expressed as mean ± standard deviation (SD). *P < 0.05, **P < 0.01 versus saline group.
Treatment With Meth Increased the Oxidative Stress in CD1 Mouse Retinas
From the retinal lysate, we measured several intracellular oxidative and antioxidative agents with ELISA and gene as well as protein expression. Specifically, we found a decrease in the SOD, GSH, and catalase. Consistently, we also observed an increase in MDA and nicotinamide adenine dinucleotide phosphate (NADPH) oxidase 4 after 2-month Meth treatment, compared to saline control (MDA: saline 100.5 ± 3.52; 0.5 mg/kg Meth 118.3 ± 7.02 [P = 0.017 vs saline]; 1 mg/kg Meth 139 ± 8.54 [P = 0.002 vs saline]; GSH: saline 100.6 ± 4.04; 0.5 mg/kg Meth 86 ± 5.57 [P = 0.021 vs saline]; 1 mg/kg Meth 74 ± 6.56 [P = 0.004 vs saline]; SOD: saline 101.3 ± 4.16; 0.5 mg/kg Meth 86.5 ± 6.03 [P = 0.024 vs saline]; 1 mg/kg Meth 69 ± 7.09 [P = 0.003 vs saline]; Sod gene expression: saline 1.02 ± 0.1; 0.5 mg/kg Meth 0.74 ± 0.07 [P = 0.015 vs saline]; 1 mg/kg Meth 0.64 ± 0.06 [P = 0.005 vs saline]; Catalase gene expression: saline 1.0 ± 0.13; 0.5 mg/kg Meth 0.73 ± 0.06 [P = 0.025 vs saline]; 1 mg/kg Meth 0.6 ± 0.05 [P = 0.006 vs saline]), indicating Meth caused retina damage through increasing the oxidative stress (Figure 3).
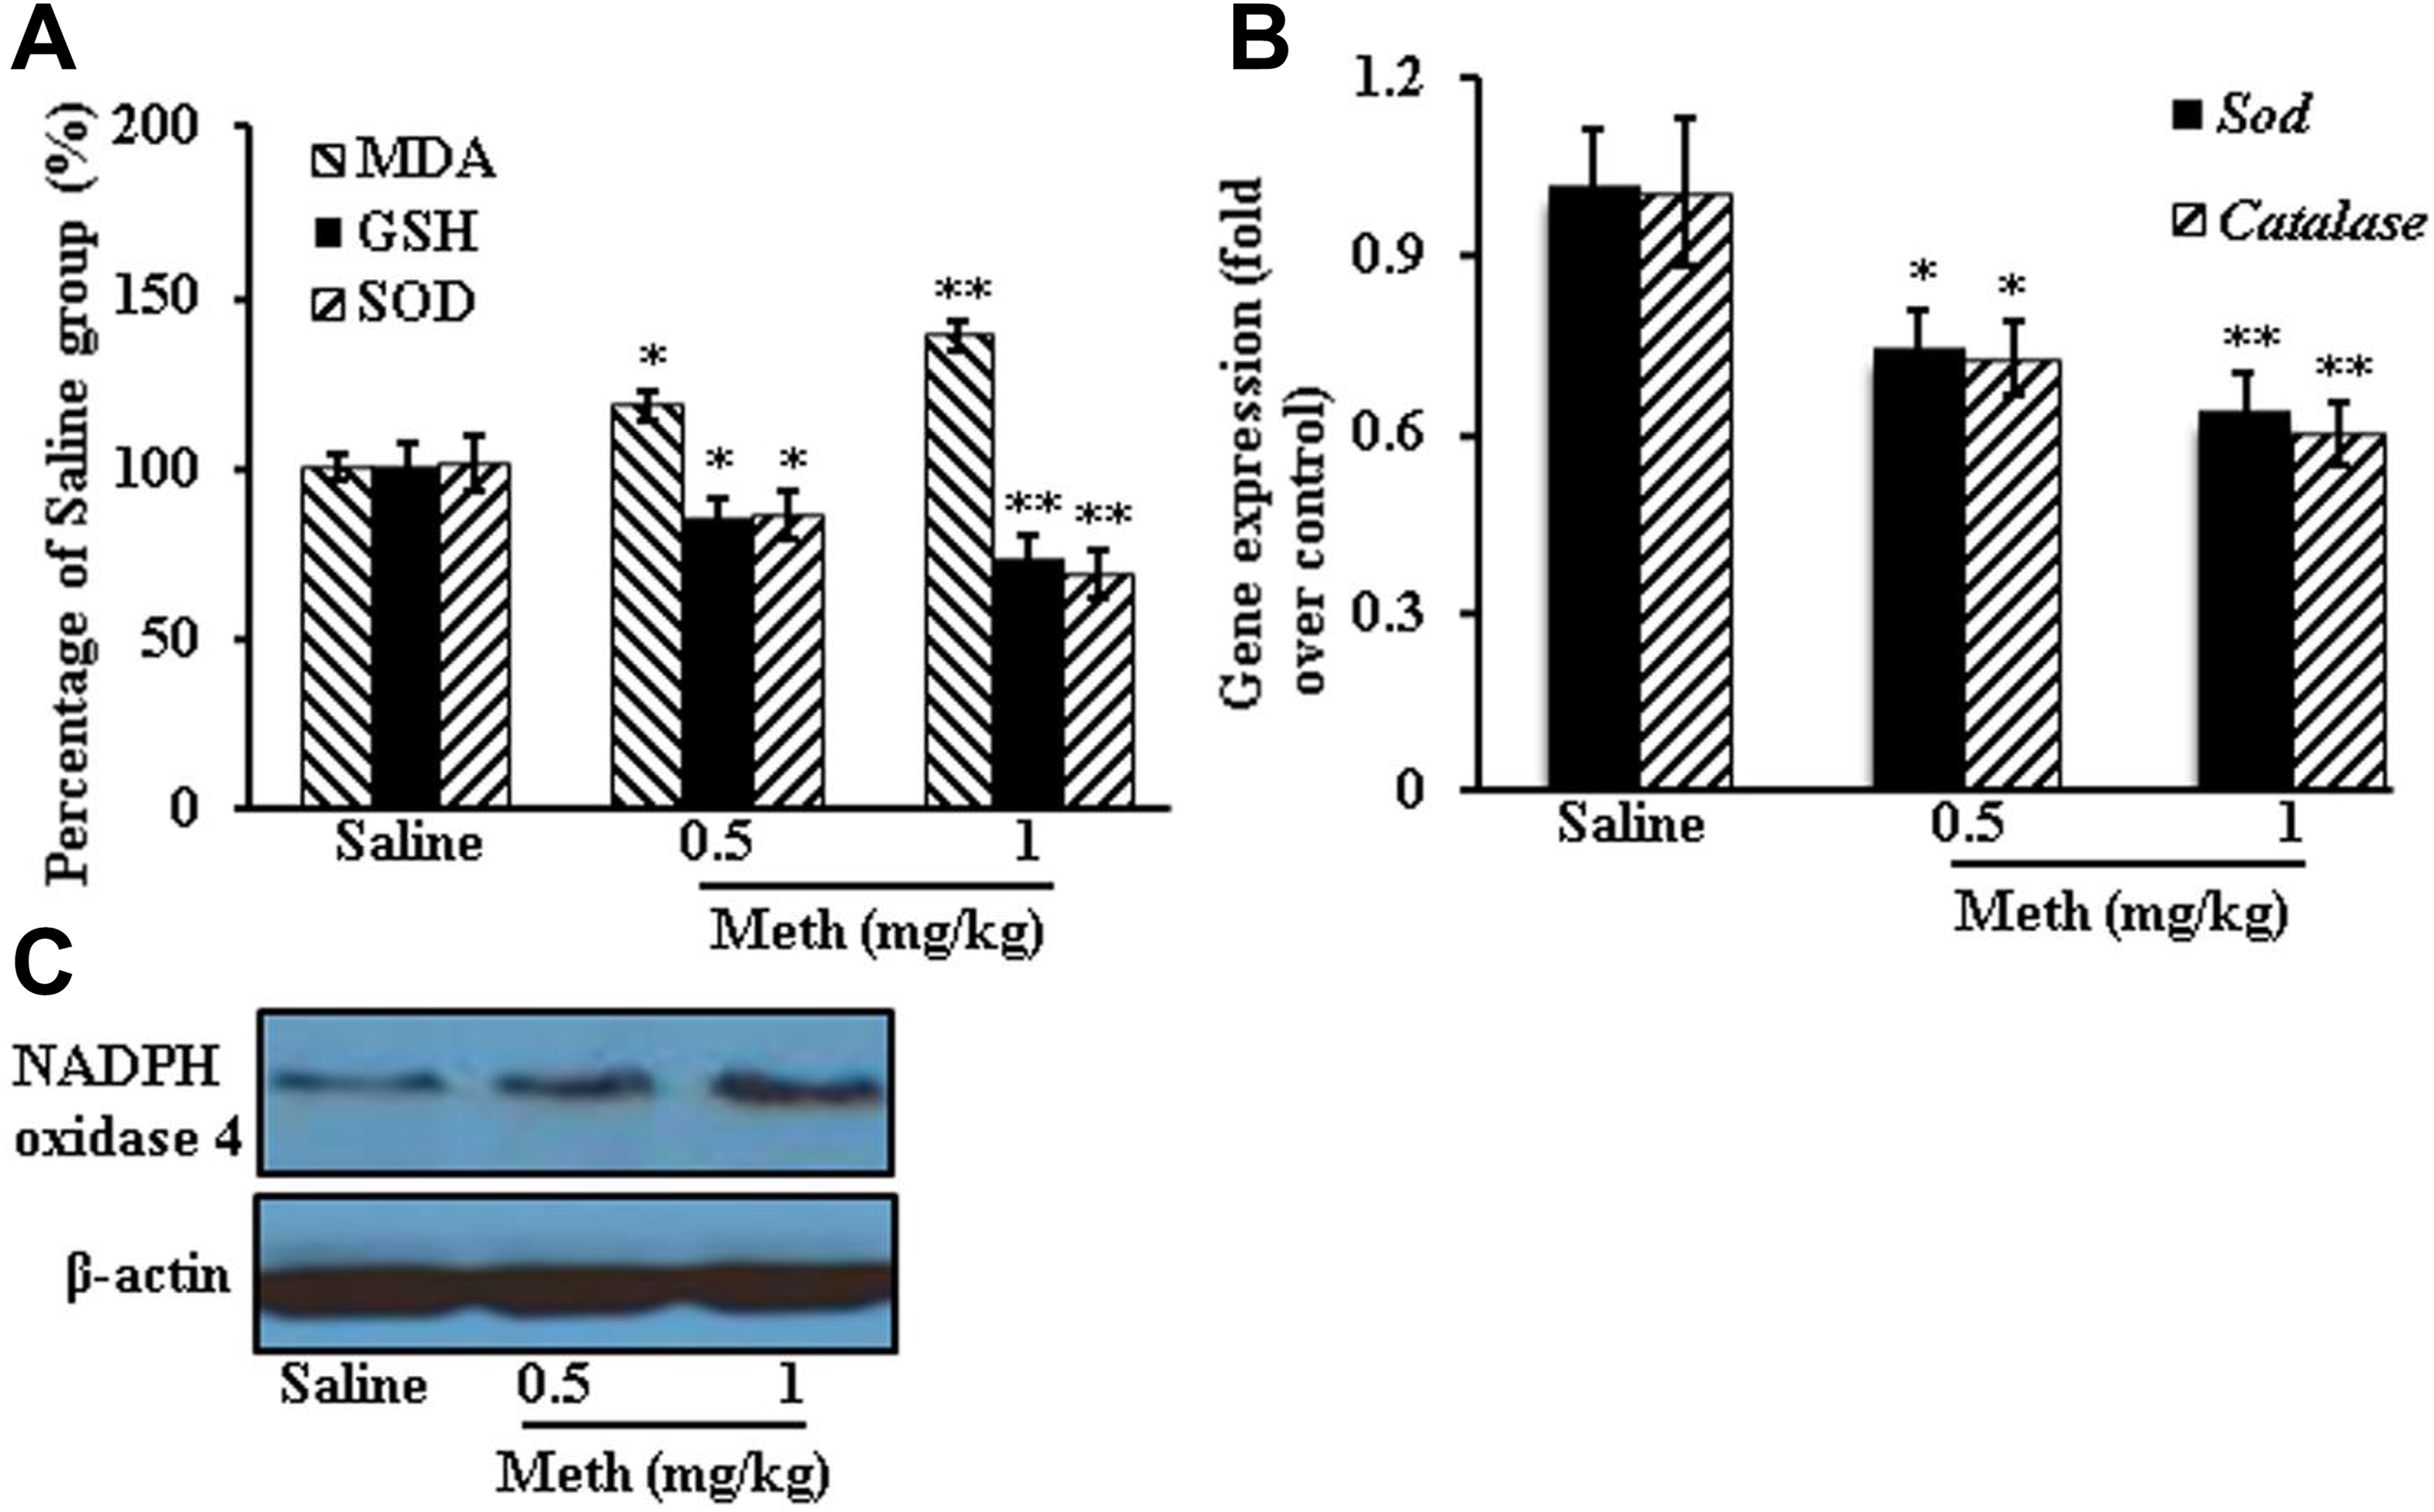
Two-month methamphetamine (Meth) treatment increased oxidative stress in CD1 mouse retinas. Retinas were harvested to measure the oxidative stress: malondialdehyde (MDA) content, glutathione (GSH) levels, and superoxide dismutase (SOD) activity (A); gene expression of Sod and Catalase (B); and oxidative stress-related protein expression (C). Data were expressed as mean ± standard deviation (SD). *P < 0.05, **P < 0.01 versus saline group.
Treatment With Meth Induced Inflammatory Response
Production of NO and IL-1β, IL-6, IL-18, INFγ as well as TNFα in the retinas significantly increased after 2-month Meth treatment (NO: saline 100.7 ± 3.06; 0.5 mg/kg Meth 116.5 ± 5.86 [P = 0.014 vs saline]; 1 mg/kg Meth 129.7 ± 8.02 [P = 0.004 vs saline]; IL-1β: saline 99.6 ± 2.52; 0.5 mg/kg Meth 113.3 ± 6.81 [P = 0.031 vs saline]; 1 mg/kg Meth 123.7 ± 8.08 [P = 0.008 vs saline]; IL-6: saline 100.0 ± 3.0; 0.5 mg/kg Meth 114.3 ± 6.11 [P = 0.022 vs saline]; 1 mg/kg Meth 125.6 ± 7.02 [P = 0.004 vs saline]; IL-18: saline 100.5 ± 3.51; 0.5 mg/kg Meth 118.7 ± 7.77 [P = 0.02 vs saline]; 1 mg/kg Meth 128.6 ± 8.62 [P = 0.006 vs saline]; INFγ: saline 100.2 ± 2.52; 0.5 mg/kg Meth 113.5 ± 7.09 [P = 0.04 vs saline]; 1 mg/kg Meth 122.0 ± 6.56 [P = 0.006 vs saline]; TNFα: saline 100.6 ± 2.08; 0.5 mg/kg Meth 113.0 ± 7.21 [P = 0.047 vs saline]; 1 mg/kg Meth 125.2 ± 8.51 [P = 0.008 vs saline]). Gene expression of Nos, Il-1β, Il-6, Il-18, and Tnfα and protein expression of NF-κB in the CD1 mouse retinas also significantly increased after 2-month Meth treatment (Nos gene expression: saline 1.0 ± 0.09; 0.5 mg/kg Meth 1.5 ± 0.25 [P = 0.041 vs saline]; 1 mg/kg Meth 2.5 ± 0.4 [P = 0.003 vs saline]; Il-1β gene expression: saline 1.02 ± 0.08; 0.5 mg/kg Meth 1.57 ± 0.31 [P = 0.039 vs saline]; 1 mg/kg Meth 2.7 ± 0.5 [P = 0.004 vs saline]; Il-6 gene expression: saline 1.02 ± 0.1; 0.5 mg/kg Meth 1.8 ± 0.31 [P = 0.016 vs saline]; 1 mg/kg Meth 2.2 ± 0.41 [P = 0.008 vs saline]; Il-18 gene expression: saline 0.99 ± 0.11; 0.5 mg/kg Meth 1.8 ± 0.3 [P = 0.012 vs saline]; 1 mg/kg Meth 2.1 ± 0.36 [P = 0.007 vs saline]; Tnfα gene expression: saline 1.04 ± 0.10; 0.5 mg/kg Meth 2.1 ± 0.46 [P = 0.017 vs saline]; 1 mg/kg Meth 3.23 ± 0.55 [P = 0.002 vs saline]; Figure 4).
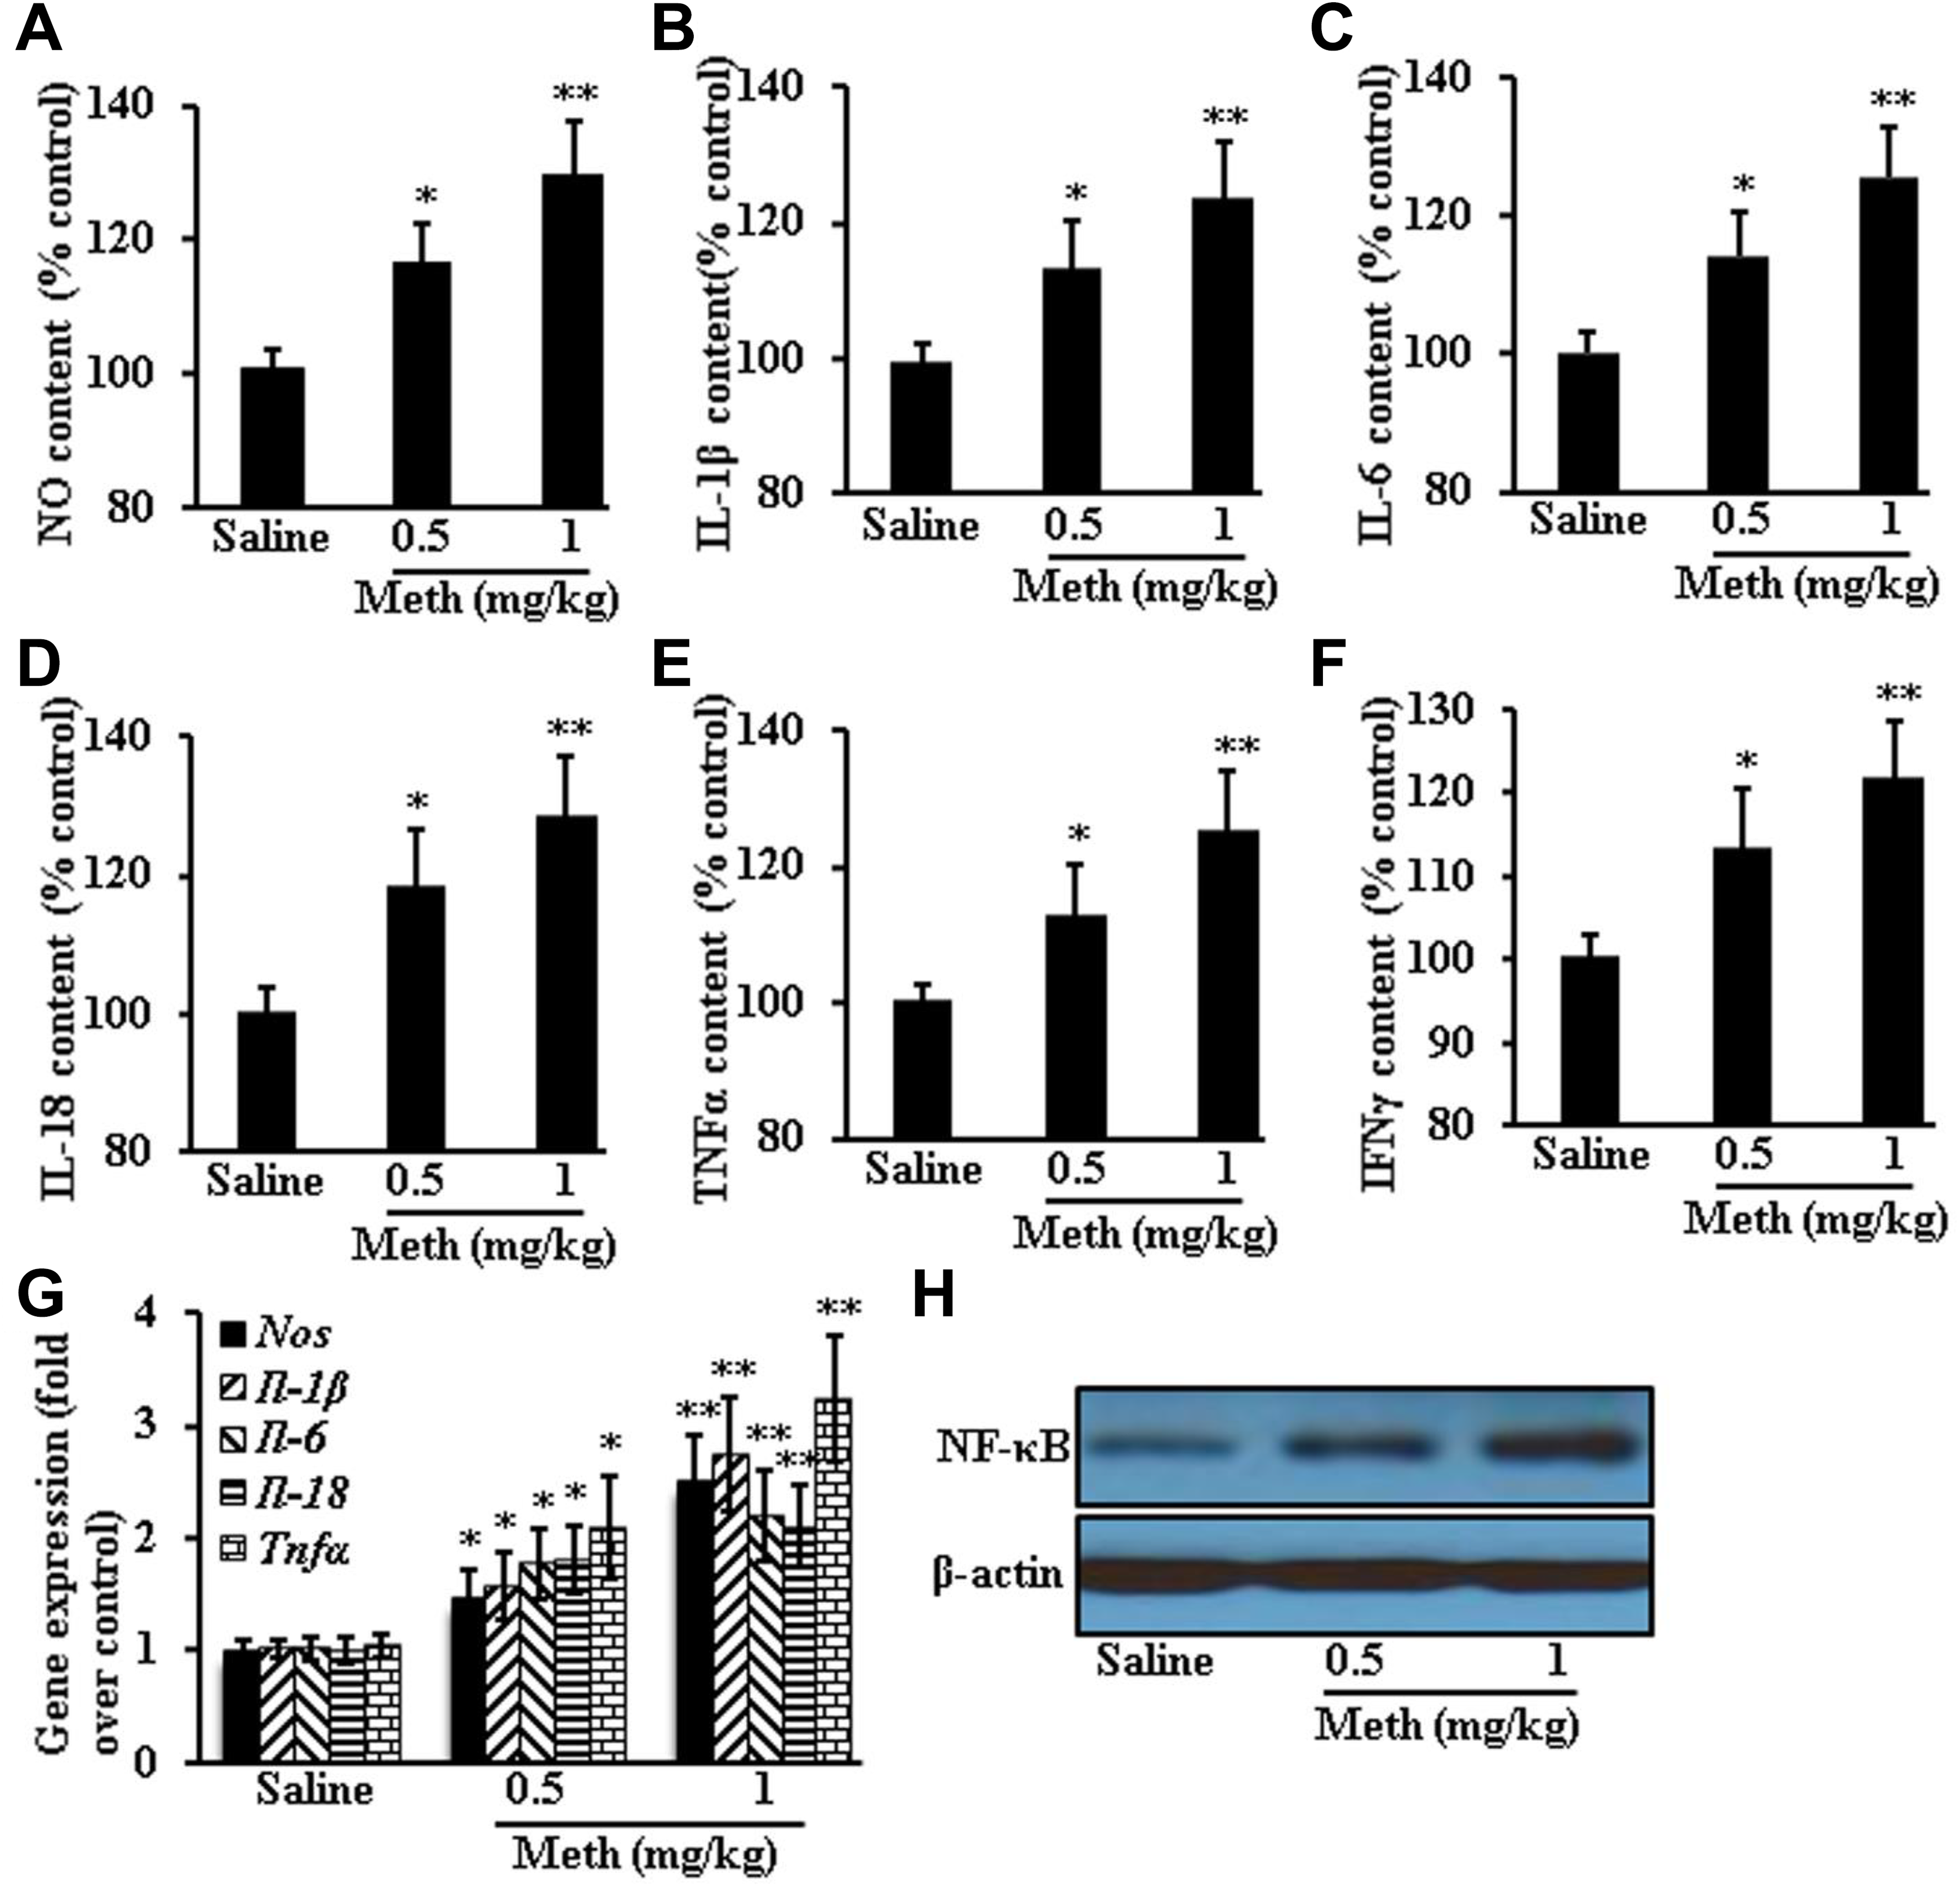
Two-month methamphetamine (Meth) treatment induced inflammatory response in retinas of CD1 mice. Pro-inflammatory factors were measured by: nitric oxide (NO; A); interleukin (IL)-1β (B); IL-6 (C); IL-18 (D); tumor necrosis factor (TNF)α (E) and interferon γ (IFNγ; F). Meth treatment increased gene expression of proinflammatory factors (G) and the protein expression of nuclear factor κB (NF-κB; H). Data were expressed as mean ± standard deviation (SD). *P < 0.05, **P < 0.01 versus saline group.
Discussion
Although researchers have devoted much efforts toward the pathology of Meth abuse, the mechanism by which it damages retina is far from elucidated. Even little is known about the chronic neurotoxicity caused by Meth abuse, and no efficacious therapy is available for this injury. 21,22 The usual doses for drug abuser of Meth are from 10 to 50 mg (0.2-1 mg/kg body). In previous studies, 12,23 researchers have adopted unrealistic Meth doses (40 mg/kg) and the frequency of administration (up to 4 doses at 10 mg/kg) attempting to model the retina damage, rendering the results unsound. For the first time, we have carried out the study with dosing and administration frequency that reflect the Meth abuse situations.
Based on our preliminary study, CD1 mice were treated with a daily ip injection of 0.5 or 1 mg/kg of Meth or saline for 2 months. The ERG was recorded after 1 and 2-month treatment. Modest difference was observed after 1 month; however, after 2-month treatment, a significant decrease in ERG amplitude was observed in the Meth-treated mice in a dose-dependent manner. Since a decrease in ERG amplitude normally indicates the functional loss of retinal photoreceptor cells, our results showed that it took over 30 days of low dosage of Meth for a retinal damage to occur. We have thus clearly characterized the disease progression kinetics of Meth-induced retina damage and developed an animal model for the future analysis of potential therapies.
At the end of the experiment, we sacrificed mice and collected the retina tissues for a comprehensive characterization. The analysis has been focused on 3 prominent pathways, the apoptosis, the oxidative stress, and the inflammation, which have been previously reported to contribute to the retinal damage caused by Meth. 12,15 -17
We incorporated multiple assays and markers to demonstrate the retinal apoptosis, including TUNEL staining, and the measurement of proapoptotic markers (cytochrome c, caspase-3, caspase-9, and Bax) as well as the antiapoptotic marker, Bcl-2. 24 -27 Not surprisingly, the Meth-treated mice showed an elevated retinal apoptosis in a dose-dependent manner. The results have been supplemented with the fact that Meth treatment reduced the thickness of the retina ONL. While the results are in agreement with the previous reports, we have confirmed that low doses of Meth, when administrated chronically, indeed caused retinal apoptosis.
Oxidative stress plays an important role in the mode of action of “ecstasy” in the brain, which affects a variety of biological macromolecules and impairs cellular function. 28,29 Studies showed that treating mice with Meth disturbed the balance of antioxidative/oxidative system in retinas and the increased oxidants interfered with the normal function of visual system. 30 To validate whether this mechanism plays a role in the low-dose, long-term retinal Meth exposure, we measured the expression and activities of multiple oxidative and antioxidative agents. Upon Meth treatment, we observed a decrease in the expression of 2 intracellular antioxidative enzymes (catalase and SOD) and as well the amount of GSH, an important antioxidant. Meanwhile, marked increase was observed in MDA and protein expression of NADPH oxidase 4 in retinas of mice after Meth administration. In combination, it is clear that low-dose, long-term exposure to Meth generated a more oxidative environment in the retinas.
Inflammation has also been frequently reported to induce apoptosis. Overproduction of proinflammatory factors such as NO, TNFα, IL-1β and IL-6, and so on can stimulate the production of oxidants with subsequent peroxidative damage to biological macromolecules, causing intracellular toxic events by activating apoptotic proteins and finally leading to cell death. 31 Clinical studies have suggested inflammatory response as a possible factor in the pathogenesis of retinal degeneration. In the mouse model, the levels of proinflammatory cytokines and chemokines are substantially increased in the retinas of retina-degenerated mice, and these events precede the photoreceptor cell loss. Treatment inhibiting the production of proinflammatory cytokines could effectively ameliorate the photoreceptor cell apoptosis in retina-degenerated mice. 32,33 We performed a thorough characterization on the cytokine patterns of the normal and Meth-exposed retinas through both ELISA and qPCR. A set of inflammatory factors increased, including NO, IFNγ, TNFα, IL-1β, IL-6, and IL-18. We have further investigated the prototypical proinflammatory factor, NF-κB, 34 which was upregulated in Meth-exposed retinas. These results were consistent with the in vitro study in which Meth caused damage of photoreceptor cells through inducing inflammatory response in the coculturing system with macrophage. 17
In conclusion, we applied a mouse model to study the retinal damage caused by the systemic treatment of low-dose Meth. In comparison to previous studies, our study better reflects the effects of Meth on retinal exposure to the drug based on dosing and administration frequency. We are by far unclear whether the inflammation and the oxidative stress, in parallel or in series, cause the apoptosis of retinal cells. Nonetheless, we hypothesize that by preventing either or both, apoptosis can be inhibited and damage may be reversed.
Footnotes
Author Contributions
Yang, H. J. contributed to design, contributed to acquisition and analysis, drafted manuscript, and critically revised manuscript; Tao, L. M. contributed to conception and design, contributed to interpretation, drafted manuscript, and critically revised manuscript; Li, L. contributed to design, contributed to acquisition, and drafted manuscript. All authors gave final approval and agree to be accountable for all aspects of work ensuring integrity and accuracy.
Declaration of Conflicting Interests
The author(s) declared no potential conflicts of interest with respect to the research, authorship, and/or publication of this article.
Funding
The author(s) received no financial support for the research, authorship, and/or publication of this article.