
Abstract
Worldwide researchers have rising concerns about magnesium-based materials, especially magnesium oxide (MgO) nanaoparticles, due to increasing usage as promising structural materials in various fields including cancer treatment. However, there is a serious lack of information about their toxicity at the cellular and molecular levels. In this study, the toxic potentials of MgO nanoparticles were investigated on liver (HepG2), kidney (NRK-52E), intestine (Caco-2), and lung (A549) cell lines. For the toxicological assessment, the following assays were used: the particle characterization by transmission electron microscopy, the determination of cellular uptake by inductively coupled plasma-mass spectrometry, MTT and neutral red uptake assays for cytotoxicity, comet assay for genotoxicity, and the determination of malondialdehyde (MDA), 8-hydroxydeoxyguanosine, protein carbonyl, and glutathione levels by enzyme-linked immune sorbent assays for the potential of oxidative damage and annexin V-fluorescein isothiocyanate (FITC) apoptosis detection assay with propidium iodide (PI) for apoptosis. Magnesium oxide nanoparticles were taken up by the cells depending on their concentration and agglomeration/aggregation potentials. Magnesium oxide nanoparticles induced DNA (≤14.27 fold) and oxidative damage. At a concentration of ≥323.39 µg/mL, MgO nanoparticles caused 50% inhibition in cell viability by 2 different cytotoxicity assays. The cell sensitivity to cytotoxic and genotoxic damage induced by MgO nanoparticles was ranked as HepG2 < A549 < Caco-2 < NRK-52E. Although it was observed that MgO nanoparticles induced apoptotic effects on the cells, apoptosis was not the main cell death. DNA damage, cell death, and oxidative damage effects of MgO nanoparticles should raise concern about the safety associated with their applications in consumer products.
Introduction
Human exposure to nanoparticles, especially metal-based nanoparticles, increases dramatically due to existing as a contaminant in water, air, and food products as outputs of natural phenomena or due to increasing activity in the anthropogenic factors. 1,2 As one of the metal-based nanoparticles, MgO nanoparticles are widely used as catalyzer, redactor, humidity sensor, antibacterial agent and destructive sorbent for toxins, fluoride, and so on and in improving luminous efficiency for ultraviolet emission. 3,4 Recently, MgO-based magnetic tunnel junction sensor together with magnetic nanoparticles is being used as biosensors for liver cancer immunoassay, 5 and MgO nanoparticles have been informed as a promising material in nano-cryosurgery for tumor treatment. 4 –6
Previous researches have shown that nanoparticles could be absorbed through the respiratory, digestive, or dermal route into the bloodstream and then could reach to secondary organs such as brain, heart, and liver. 7 Moreover, nanoparticles have been reported to frequently affect cellular molecules and have toxic effects such as oxidative damage, DNA damage, cell death, and morphological changes in the exposed organs or systems. 8 –13 However, there is no sufficient study that provides to make an extensive toxicity assessment about nanoparticles. 8 –12 Similarly, despite the wide applications of MgO nanoparticles, there is serious lack of knowledge related to their impact on human health and environment. The nanoparticle toxicity is controversial and dependent on the sensitivity of the cell type, route of exposure, and condition as well as the characteristics of the nanoparticles. 14,15 Therefore, we aimed to investigate the toxic effects of MgO nanoparticles on liver (HepG2), kidney (NRK-52E), colon (Caco-2), and lung (A549) cell lines by various toxicological end points, including cytotoxicity, genotoxicity, oxidative damage, and apoptosis, after determination of size and cellular uptake of the nanoparticles in vitro. The preferred cell lines and assays in this study are both widely used for nanoparticle toxicity studies and reflect different possible routes and outcomes of in vivo exposure.
Methods
Chemicals
The MgO nanoparticles (Cat. No. 549649), neutral red dye, triton X-100, EDTA, and 3-[4,5-dimethylthiazol-2-yl]-2,5-diphenyl-tetrazolium bromide (MTT) were obtained from Sigma (St Louis, Missouri). Cell culture mediums (Eagle minimum essential medium [EMEM], Dulbecco modified eagle medium [DMEM], F-12, and all other supplements were purchased from Multicell Wisent (Quebec, Canada). Glutathione (GSH) , 8-hydroxydeoxyguanosine (8-OHdG), MDA and protein carbonyl (PC) Enzyme-linked immune sorbent assay (ELISA) kits were purchased from Yehua Biological Technology (Shanghai, China). Annexin V-FITC apoptosis detection kit with PI and protein assay dye reagent were obtained from Biolegend (California) and Bio-rad (Munich, Germany), respectively. All other chemicals were obtained from Merck (New Jersey).
Particle Size Characterization
Magnesium oxide nanoparticles were suspended in milli-Q water and cell culture medium with 10% fetal bovine serum (FBS). The suspensions were sonicated for 10 minutes and then dropped on carbon-coated 200-mesh cupper grid and allowed to dry prior to measurement. Transmission electron microscopy (TEM; JEM-2100 HR, JEOL, MA, USA) with attached digital camera (Olympus-Veleta TEM Camera; Olympus-Veleta, Tokyo, Japan) were performed in TUBITAK Laboratory (Istanbul, Turkey). The average diameters in both milli-Q water and cell medium were separately calculated for measuring over 100 particles in random fields of TEM view.
Cell Cultures and Exposure Conditions
We used the following cell lines: HepG2 human hepatocarcinoma cells (HB-8065; American Type Culture Collection [ATCC], Rockville, Maryland), NRK-52E rat kidney proximal tubular epithelial cells (CRL-1571; ATCC), Caco-2 human colorectal adenocarcinoma cells (HTB-37; ATCC), and A549 human lung carcinoma cells (CCL-185; ATCC). The cells were incubated in a suitable medium supplemented with FBS (10% in EMEM for HepG2, 10% in DMEM-F12 for NRK-52E, 20% in EMEM for Caco-2, and 10% in high glucose DMEM for A549) and antibiotics (100 units/mL of penicillin and 100 µg/mL of streptomycin) at 5% CO2, 90% humidity, and 37°C for 24 hours (60%-80% confluence). The cell densities were 1 × 10⁴ cells/mL for cytotoxicity assays, 1 × 10⁵ cells/mL for comet assay and cellular uptake, and 1 × 10⁷ cells/mL for uptake by Inductively Coupled Plasma-Mass Spectrometry (Xseries 2 ICP-MS, Thermo Scientific, MA, USA), which was adjusted to 1 × 10⁶ cells/mL for both apoptosis/necrosis and oxidative damage assays. Magnesium oxide nanoparticles were freshly suspended at a concentration of 1 mg/mL in cell culture medium with 10% FBS and sonicated at room temperature for 5 minutes to avoid the aggregation/agglomeration of nanoparticles before exposure. The cells were exposed to final concentrations of 50 µg/mL to 500 µg/mL in the cytotoxicity assays, 10 µg/mL to 300 µg/mL in the comet assay, 50 µg/mL to 300 µg/mL in the apoptosis/necrosis assay, 150 µg/mL and 300 µg/mL in the oxidative damage assays, 100 µg/mL in the cellular uptake assay by ICP-MS, and morphological examinations by TEM. The exposure time to the particle suspensions was 24 hours.
Cellular Uptake and Morphological Examinations
The nanoparticle uptake from the cells was studied using the ICP-MS method. After exposure to particle suspension at 100 µg/mL, the cells were washed several times with equal volumes of phosphate-buffered saline (PBS) and counted by a Luna cell counter (Virginia). The cells were resuspended in 6 mol/L nitric acid and incubated at room temperature for 1 hour and then stored at −20ºC until analysis. The acid-digested samples were assayed for Mg amount with ICP-MS. Also, the Mg content of the unexposed cells for every cell line was measured. Every assay was repeated 4 times.
The morphological examinations were performed by TEM (JEM-2100 HR; JEOL) with attached digital camera (Olympus-Veleta TEM Camera) in TUBITAK Laboratory (Istanbul, Turkey). In TEM analysis, the exposed cells were washed several times with equal volumes of PBS and fixed in 2.5% glutaraldehyde in Millonig buffer (pH 7.4) for 2 hours at room temperature. After centrifugation at 1200 rpm for 10 minutes, the pellets were resuspended in Millonig buffer, and this washing step was repeated 2 times. The cells were postfixed in 1% osmium tetroxide in Millonig buffer for 30 minutes at room temperature and washed 1 time as described earlier. The cells were blocked in 2% agarose gel and dehydrated in increasing grade of ethanol series followed by embedding in araldite. Semithin sections from the polymerized blocks were stained with toluidine blue. Ultrathin sections (50-60 nm) were cut by an ultramicrotome (Reichert UM 3; Reichert, Austria), placed on copper grids, and stained with uranyl acetate and lead citrate. Sections were analyzed and photographed using a TEM with attached digital camera.
Cytotoxicity Assays
Cytotoxic activities of the MgO nanoparticles were determined by MTT and neutral red uptake (NRU) assays based on different cellular mechanisms depending on the damaged region. 16,17 In all assays, the unexposed cells were evaluated as the negative control. Optical densities (ODs) were read using a microplate spectrophotometer system (Epoch, Germany) at 540 nm to 590 nm. The inhibition of enzyme activity in exposed cells was calculated and compared to that of unexposed cells (negative control). Then, the half maximal inhibitory concentration (IC50) was expressed as the sample concentration that caused an inhibition of 50% in enzyme activities in cells. The results were expressed as the cell death (%) compared to the negative control.
Genotoxicity Assay
Genotoxic activities of the MgO nanoparticles were determined by comet assay with minor modifications. 18,19 Hydrogen peroxide (H2O2; 100 µmol/L) and PBS were used as positive and negative controls, respectively. The number of DNA breaks was scored under a fluorescent microscope (Olympus BX53; Olympus, Tokyo, Japan) at 400× magnification using an automated image analysis system (Comet Assay IV, Perceptive Instruments, Suffolk, United Kingdom). DNA damage to individual cells was expressed as a percentage of DNA in the comet tail (tail intensity %).
Oxidative Damage Assays
To estimate the oxidative damage effects of MgO nanoparticles in the cell lines, different end points were measured by ELISA kits according to the manufacturer’s instructions. The assays are based on biotin double antibody sandwich technology to evaluate GSH, MDA, 8-OHdG, or PC levels spectrophotometrically at 450 nm. In every assay, the unexposed cells were evaluated as a negative control. After 24 hours of exposure, the cells were washed twice with cold PBS and trypsinized. The cell suspension was centrifuged and diluted with PBS to a cell concentration of approximately 106/mL. Then, the cells were immediately disrupted by a repeated freeze-thaw process for 3 times. The amount of protein in 106 cells was measured according to Bradford 20 and then the protein amount was calculated for 4 × 10⁴ cells. Results were expressed as µmol, µmol, µg, and µg/g protein for GSH, MDA, 8-OHdG, and PC, respectively, using a standard calibration curve.
Apoptosis Assay
To determine cellular apoptosis, an Annexin V-FITC apoptosis detection kit with PI was used. The kit is based on observation of the translocation of the membrane phosphatidylserine from the inner side of the plasma membrane to the cell surface, which can be easily detected by staining with Annexin V fluorescent dye, a protein that has a high affinity for phosphatidylserine, conjugated to FITC. The assay was enabled so that viable (Annexin V-FITC-negative; PI-negative), apoptotic (Annexin V-FITC-positive; PI-negative), and necrotic/nonapoptotic (Annexin V-FITC-negative; PI-positive) cells be distinguished. The cells were exposed for 24 hours with different final concentrations of nanoparticles equivalent to 25%, 50%, and 75% cell death, respectively. The exposure concentrations were 50, 150, and 300 mg/mL for HepG2, NRK-52E, Caco-2, and A549 cells. In every assay, the unexposed cells were evaluated as a negative control. The cells were washed with PBS and trypsinized before centrifugation at 1200 rpm for 3 minutes. In all, 104 cells in 100 µL of PBS were incubated with 5 µL of Annexin V-FITC and 10 µL of PI at room temperature in the dark. After 15 minutes, the apoptotic or necrotic cells distributed on the slides were immediately counted under a phase-contrast fluorescent microscope (Olympus BX53; Olympus). The results were expressed as the percentage of the total cell amount.
Statistical Analysis
All experiments were done in triplicates, and each assay was repeated 4 times. Data were expressed as mean ± standard deviation (SD). The significance of differences between cells unexposed and exposed to nanoparticles was calculated by 1-way analysis of variance Dunnett t test using SPSS version 17.0 for Windows (SPSS Inc, Chicago, Illinois). P values less than .05 were selected as the levels of significance.
Results
Particle Size Characterization
The particle size and size distribution of MgO nanoparticles were analyzed with TEM images. The average size was 43.9 nm (range: 21.42-70.38 nm) in water with a narrow size distribution. The size distribution of nanoparticles was also evaluated in the culture medium. The average size increased to 45.1 nm (range 23.87-256.3 nm). Magnesium oxide nanoparticles were slightly agglomerated after dissolution in culture medium. About 14% of the particles were found to have size more than 60 nm. The average size of these particles was 200.3± 56 nm. However, the particles with size more than 60 nm were 9% and their average size was 66.2± 4 nm after dissolution in water (Figure 1).
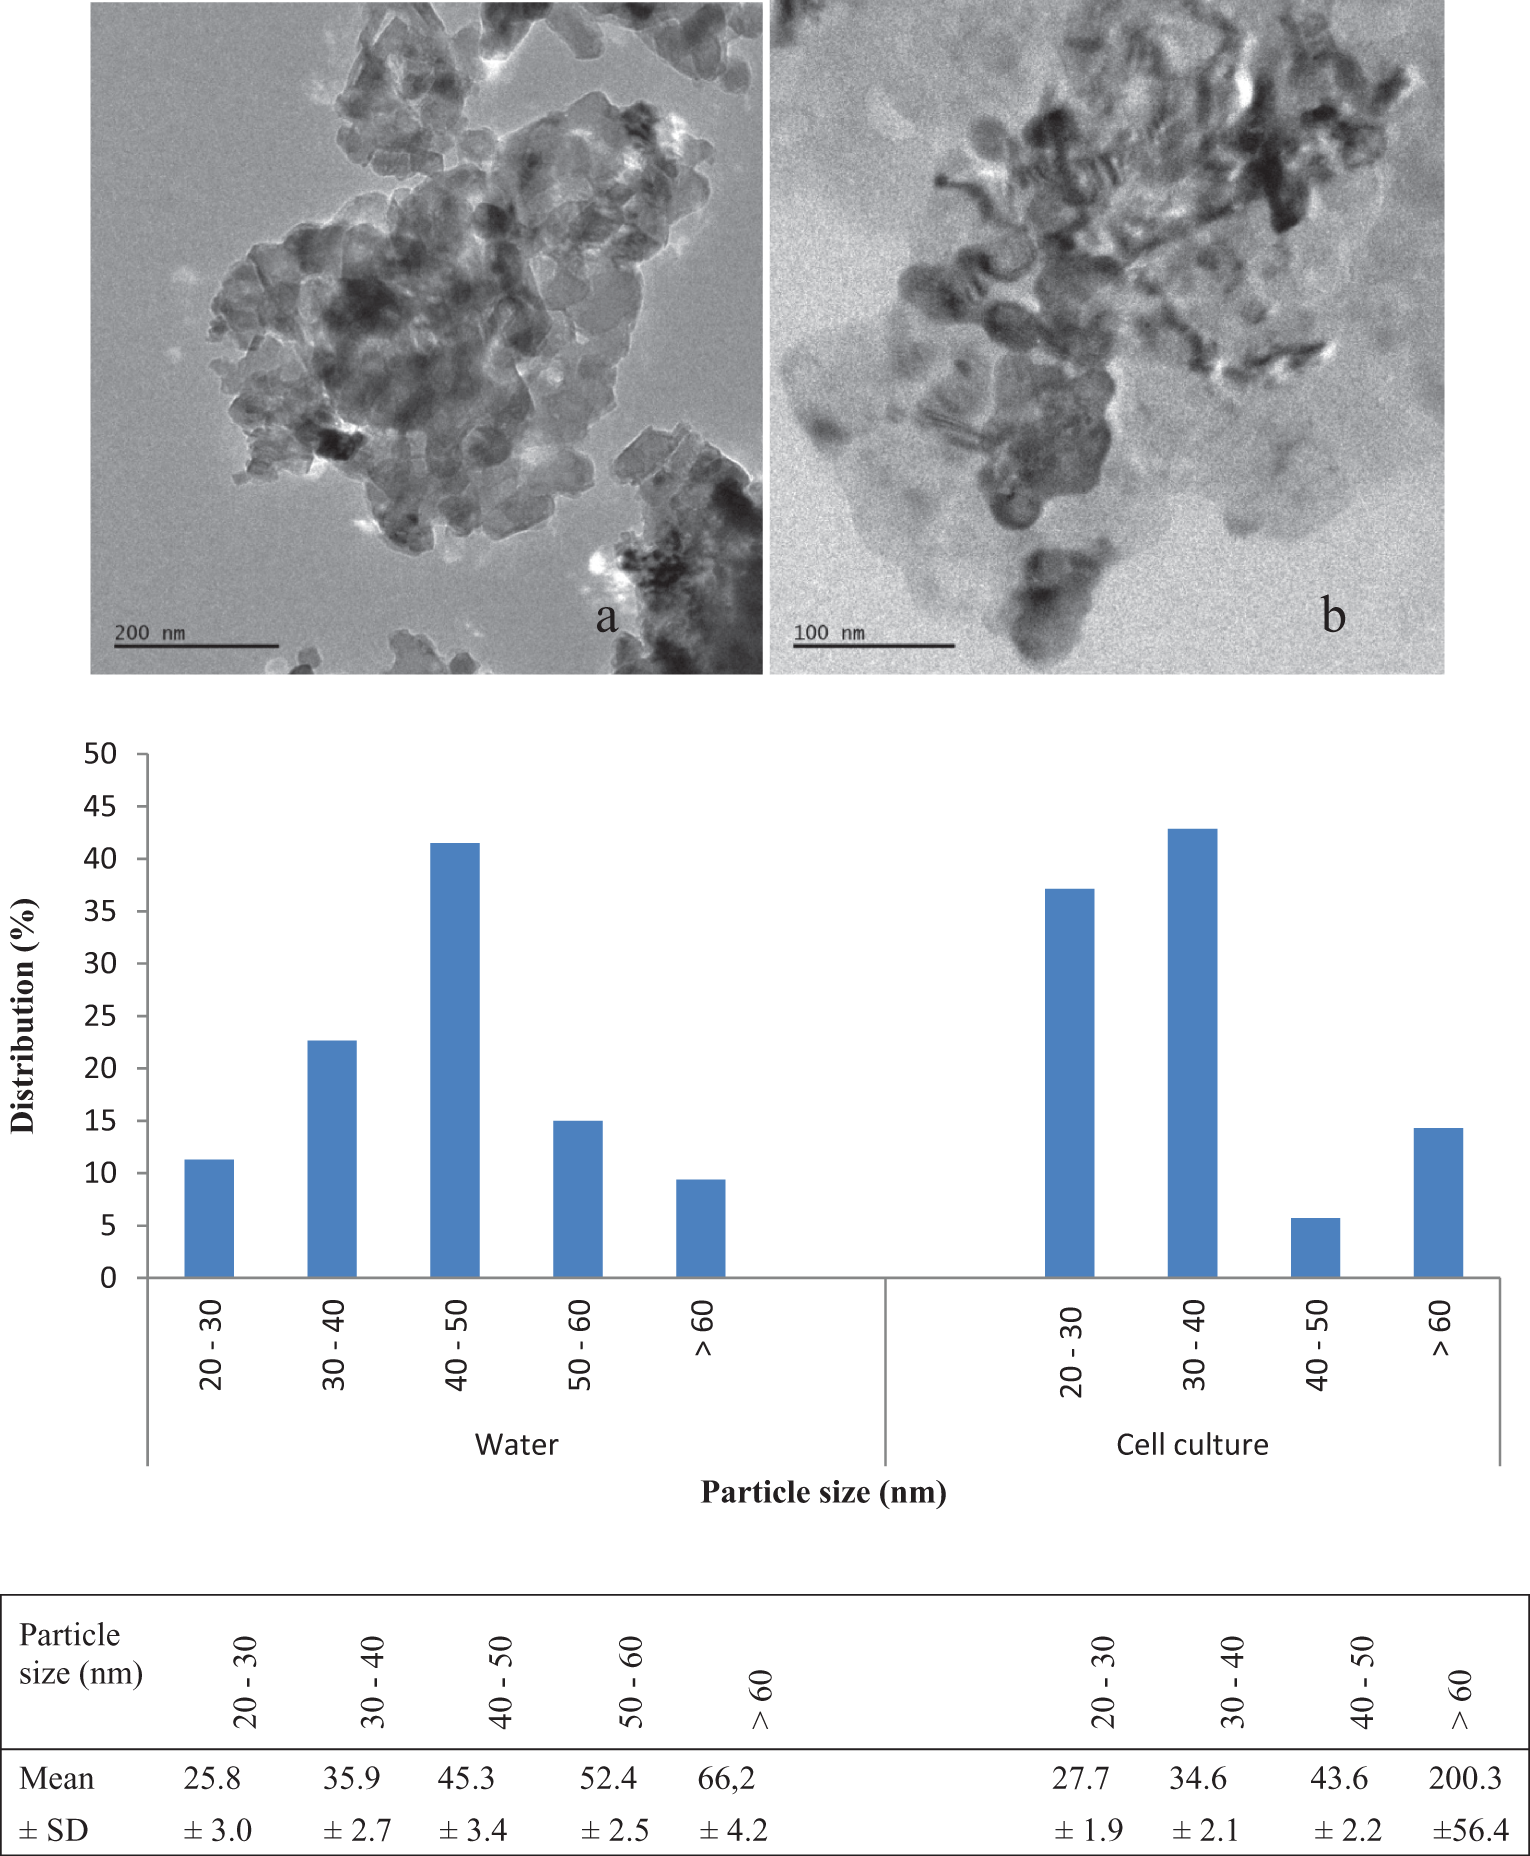
The images and size distributions of MgO nanoparticles after distribution in water (A) and cell culture medium (B) by TEM. MgO indicates magnesium oxide; TEM, transmission electron microscopy.
Cellular Uptake and Morphological Examinations
The ICP-MS revealed that MgO nanoparticles were taken up in the range of 3.348 (±0.323), 3.405 (±0.250), 1.926 (±0.114) and 5.242 (±0.425) μg/105 cells by HepG2, NRK-52E, Caco-2, and A549 cells, respectively, following MgO nanoparticles exposure at concentrations 100 µg/mL for 24 hours. The Mg content of the negative controls was in the range of 0.1259 to 0.1975 μg/105 cells for all cell lines. Based on the Mg amounts in intracellular fluid, the cellular uptake potentials of MgO nanoparticles could be graded as A549>HepG2∼NRK-52E>Caco-2 cells. The morphological examinations by TEM show MgO nanoparticles were taken by all the cells. The particles were observed in the cytoplasmic vacuoles. Mitochondria were visible in few of the cells exposed to 100 µg/mL MgO nanoparticles. Some cells revealed nuclear fragmentation. The electron-lucent cytoplasmic vacuoles lead to complete disruption of the cytoplasm in few of the cells (Figure 2).
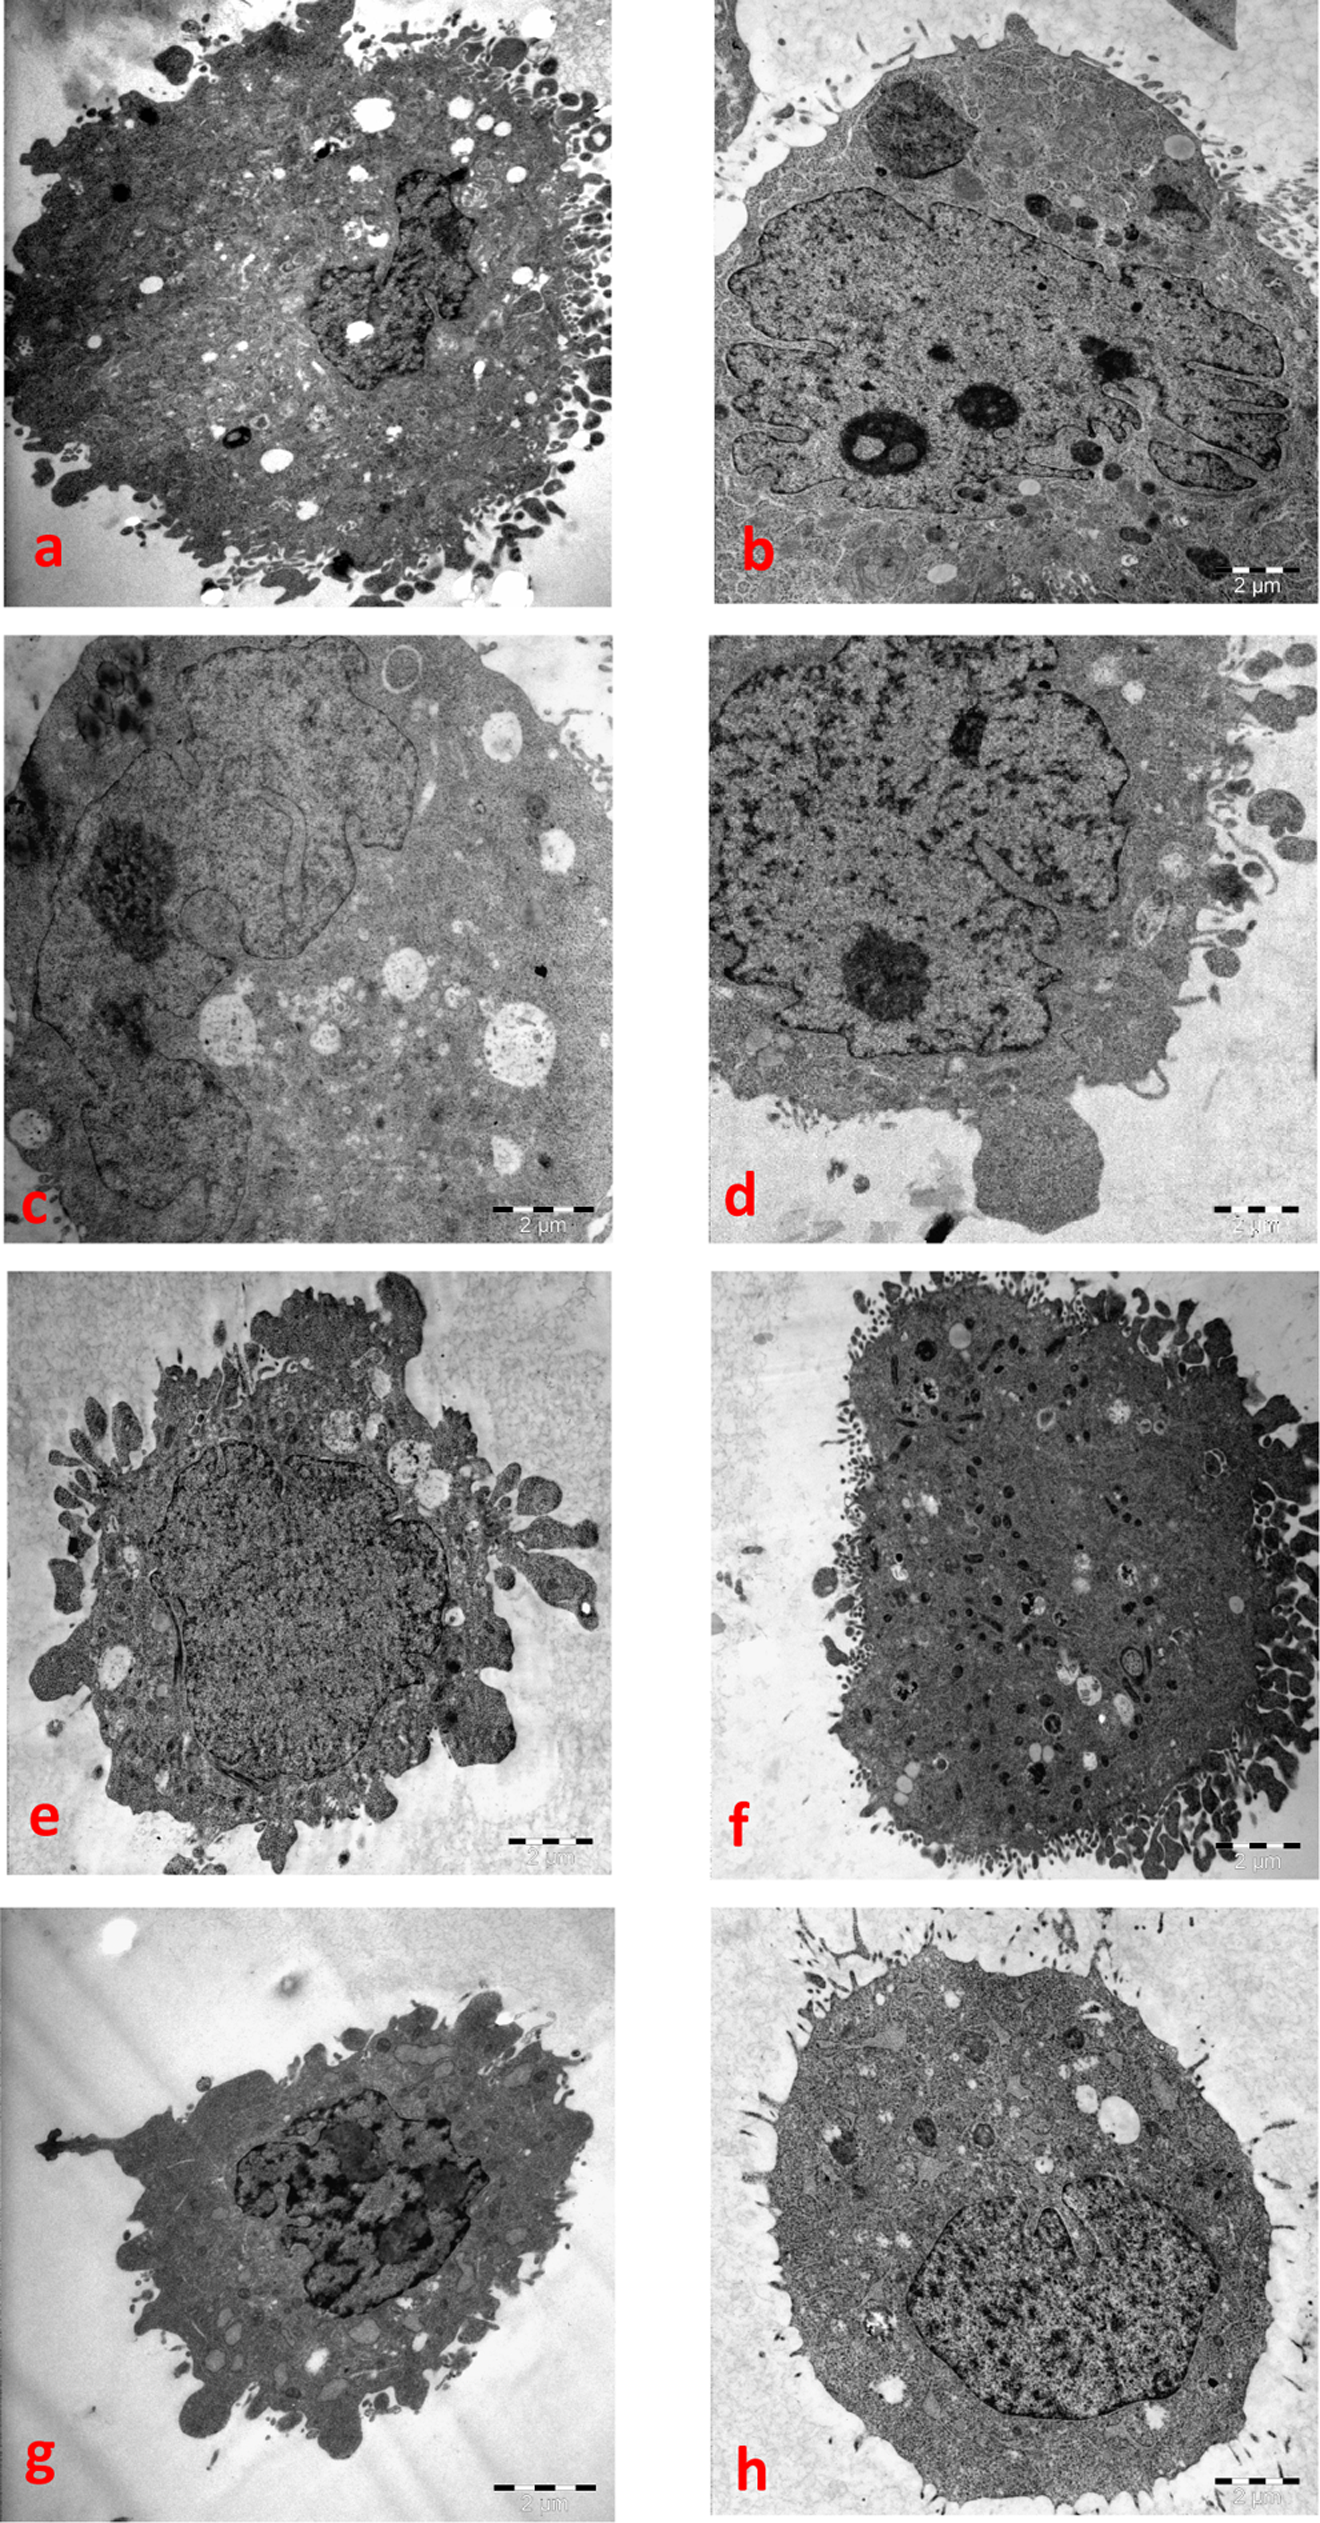
The TEM observations after exposure to 100 µg/mL of MgO nanoparticles for 24 hours. The magnification of all images was ×10 000. (A) Caco-2 unexposed cell (negative control); (B) Caco-2 exposed cell; (C) HepG2 unexposed cell; (D) HepG2 exposed cell; (E) NRK-52E unexposed cell; (F) NRK-52E exposed cell; (G) A549 unexposed cell; (H) A549 exposed cell. TEM indicates transmission electron microscopy; MgO, magnesium oxide.
Cytotoxicity Assays
The cytotoxic potentials were evaluated in HepG2, NRK-52E, Caco-2, and A549 cells exposed to MgO nanoparticles in the concentration range of 50 to 500 µg/mL for 24 hours (Figure 3). The MgO nanoparticles decreased the cell metabolic activity assessed by the decrease in mitochondrial and lysosomal functions with MTT and NRU assays, respectively. The dose-dependent reduction in cell metabolic activity could be related to an increase in cell death. The IC50 values of MgO nanoparticles in HepG2, NRK-52E, and Caco-2 cells were 498.38, 323.39, and 415.76 µg/mL by MTT assay, 502.14, 354.62, and 385.90 µg/mL by NRU assay, respectively. The IC50 level was not reached in A549 cells by MTT assay. The maximum cell death (14.8%) was shown even at the highest concentration (500 µg/mL). However, it was observed by NRU assay that the IC50 level of A549 was 371.24 µg/mL. The reduction in cell viability for all cells was concentration dependent. Figure 2 shows that the cell sensitivities ranked as NRK-52E>Caco-2>HepG2>A549 cells and NRK-52E∼Caco-2>A549>HepG2 cells when compared to mitochondrial and lysosomal damage, respectively. The NRK-52E cells were observed as the most sensitive cell line to cytotoxic damage in all other cells studied.
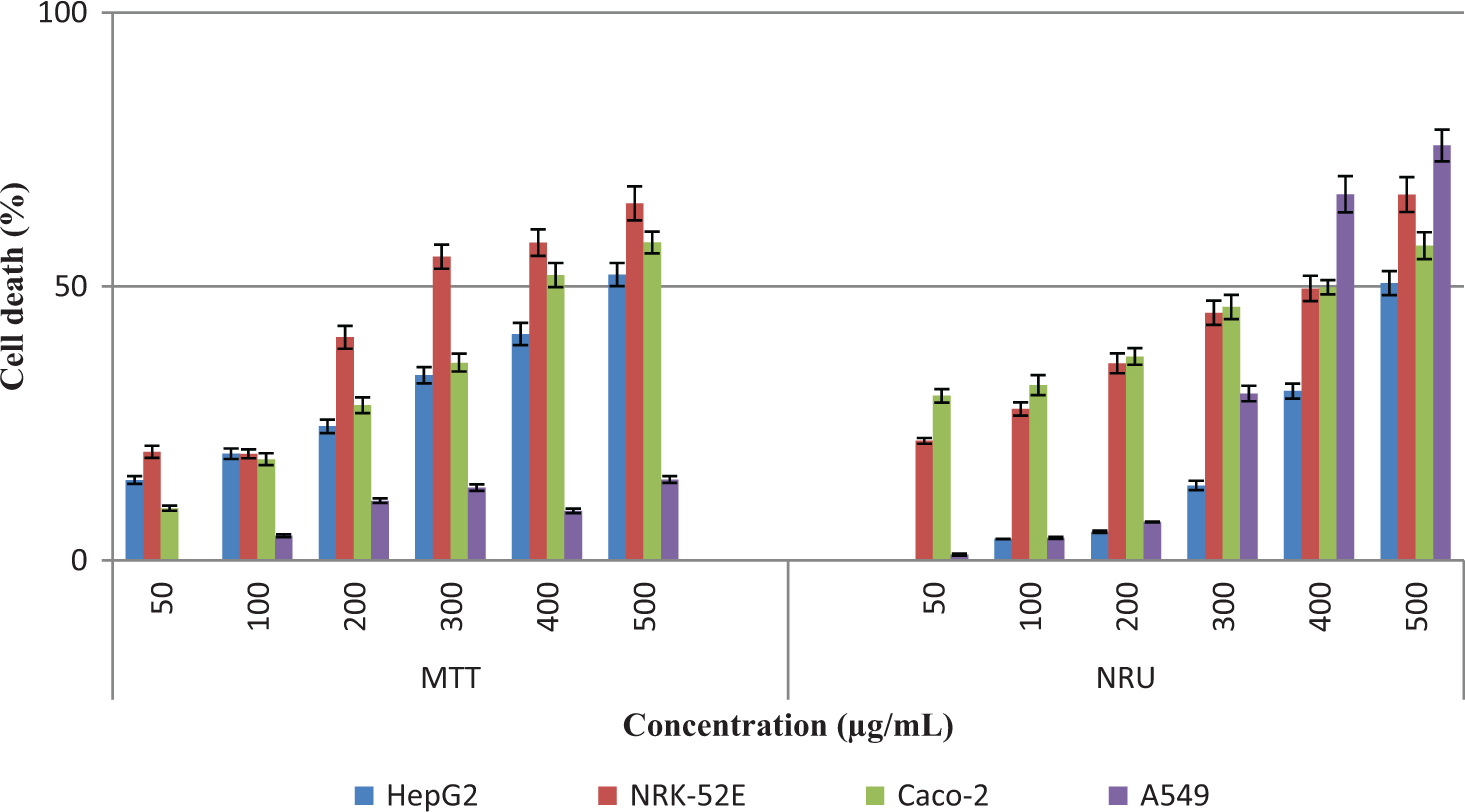
Effects of the MgO nanoparticles on cell viability by MTT and NRU. Cytotoxicity was evaluated in different cell lines: HepG2, NRK-52E, Caco-2, and A549. The cells exposed to nanoparticles at 50 to 500 μg/mL for 24 hours. The results were expressed as the cell death (%) compared to negative control. MgO indicates magnesium oxide; NRU, neutral red uptake; SD, standard deviation. All experiments were done in triplicates, and each assay was repeated 4 times. Data were expressed as mean ± SD.
Genotoxicity Assay
The genotoxic potentials of MgO nanoparticles were investigated by comet assay in HepG2, NRK-52E, Caco-2, and A549 cells at concentrations of 10-300 µg/mL (Figure 4). In positive controls (100 µmol/L H2O2), the tail intensity ranged from 33.15% to 43.26% in the cells. The results revealed that MgO nanoparticles significantly highly induced DNA damage in NRK-52E, Caco-2, and A549 cells in the range of 1.76- to 27.54-fold (P ≤ .05) while slightly induced in HepG2 cells (≤1.28-fold). The tail intensities were ≤3.33%, 27.54%, 23.46%, and 12.45% in HepG2, NRK-52E, Caco-2, and A549 cells, respectively, with ≤ 40% of the cell deaths. Tail intensities decreased in NRK-52E and A549 cells exposed to MgO nanoparticles at the higher concentrations (150 µg/mL and 300 µg/mL) due to decrease in the cell viability. The cell sensitivity to genotoxic damage induced by MgO nanoparticles ranked as NRK-52E>Caco-2>A549>HepG2 (Figure 4).
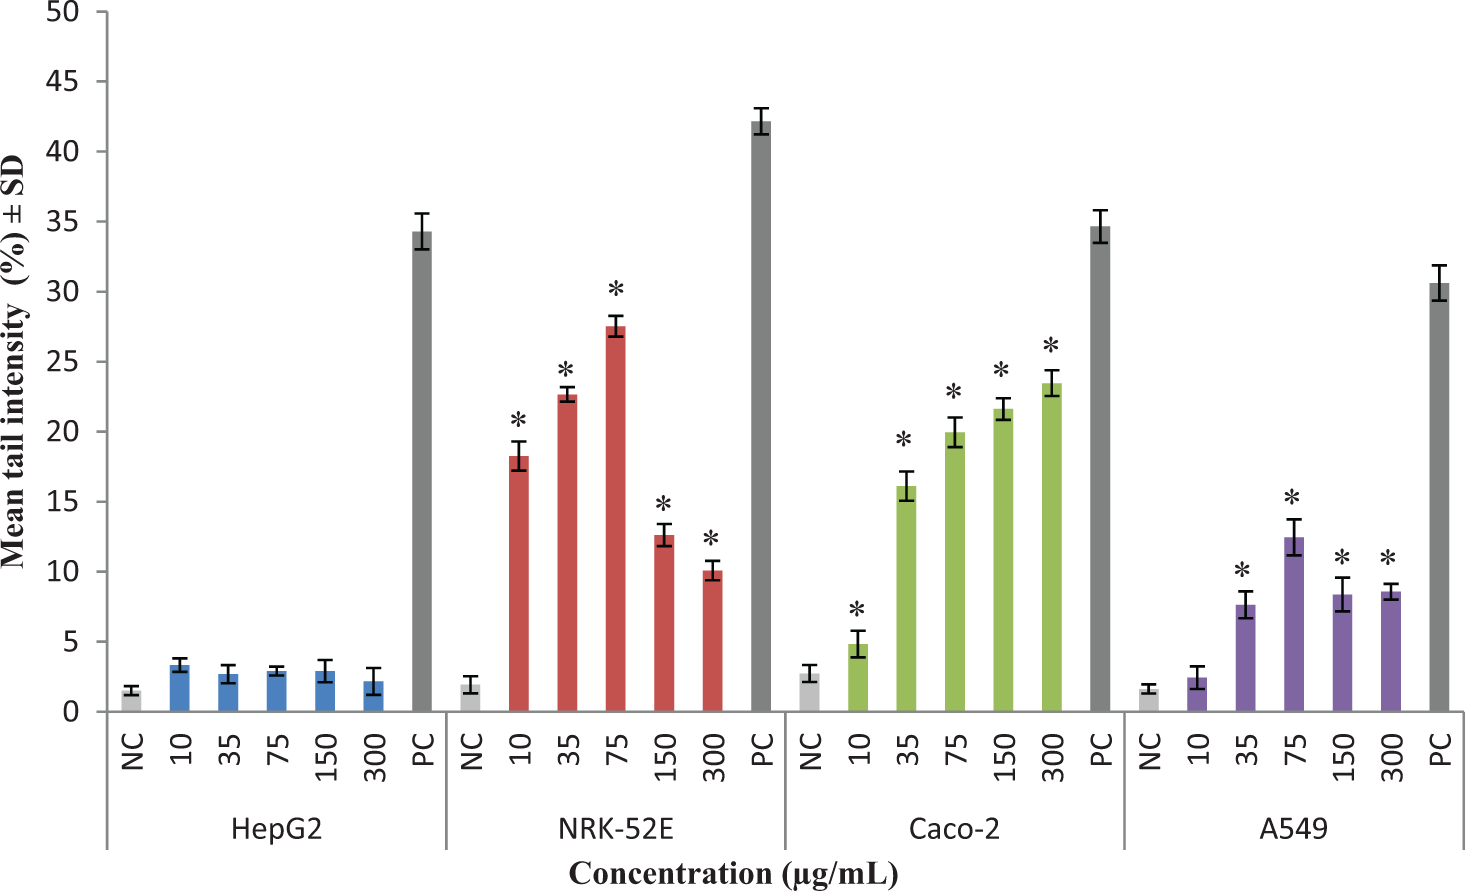
Evaluation of DNA damage potentials of MgO nanoparticles assayed by comet assay. Genotoxicity was evaluated in HepG2, NRK-52E, Caco-2, and A549. The cells exposed to MgO nanoparticles at 10 to 300 µg/mL for 24 hours. The results were presented as mean tail intensity (%) with ± SD. All experiments were done in triplicates and each assay was repeated 4 times. The results were presented as mean tail intensity (%) with ±SD. .
Oxidative Damage Assays
The potentials of MgO nanoparticles to induce oxidative damage in HepG2, NRK-52E, Caco-2, and A549 cells were evaluated at concentrations of 150 µg/mL and 300 µg/mL by measuring the levels of widely used oxidative damage parameters GSH, MDA, 8-OHdG, and PC. The MgO nanoparticles caused increase in the levels of MDA (≤1.72 fold) and decrease in the levels of GSH (≤68.82%) in HepG2, NRK-52E, Caco-2, and A549. The 8-OHdG and PC levels, biomarkers of DNA, and protein oxidative damage did not change in NRK-52E, Caco-2, and A549 cells; however, both the 8-OHdG and PC levels increased in HepG2 cells. All the changes in oxidative damage biomarkers in only HepG2 cells were dependent on the concentration and statistically significant compared to the control (P ≤ .05). For all cells, a statistically significant GSH depletion was also observed(P ≤ .05). As a result, HepG2 cells were observed as the most sensitive cell line to oxidative damage in all other cells that were studied (Table 1).
Evaluation of Oxidative Damage Potentials of MgO Nanoparticles in the Cell Lines Assayed With Measuring the Levels of GSH, MDA, 8-OHdG, and PC by ELISA.a,b
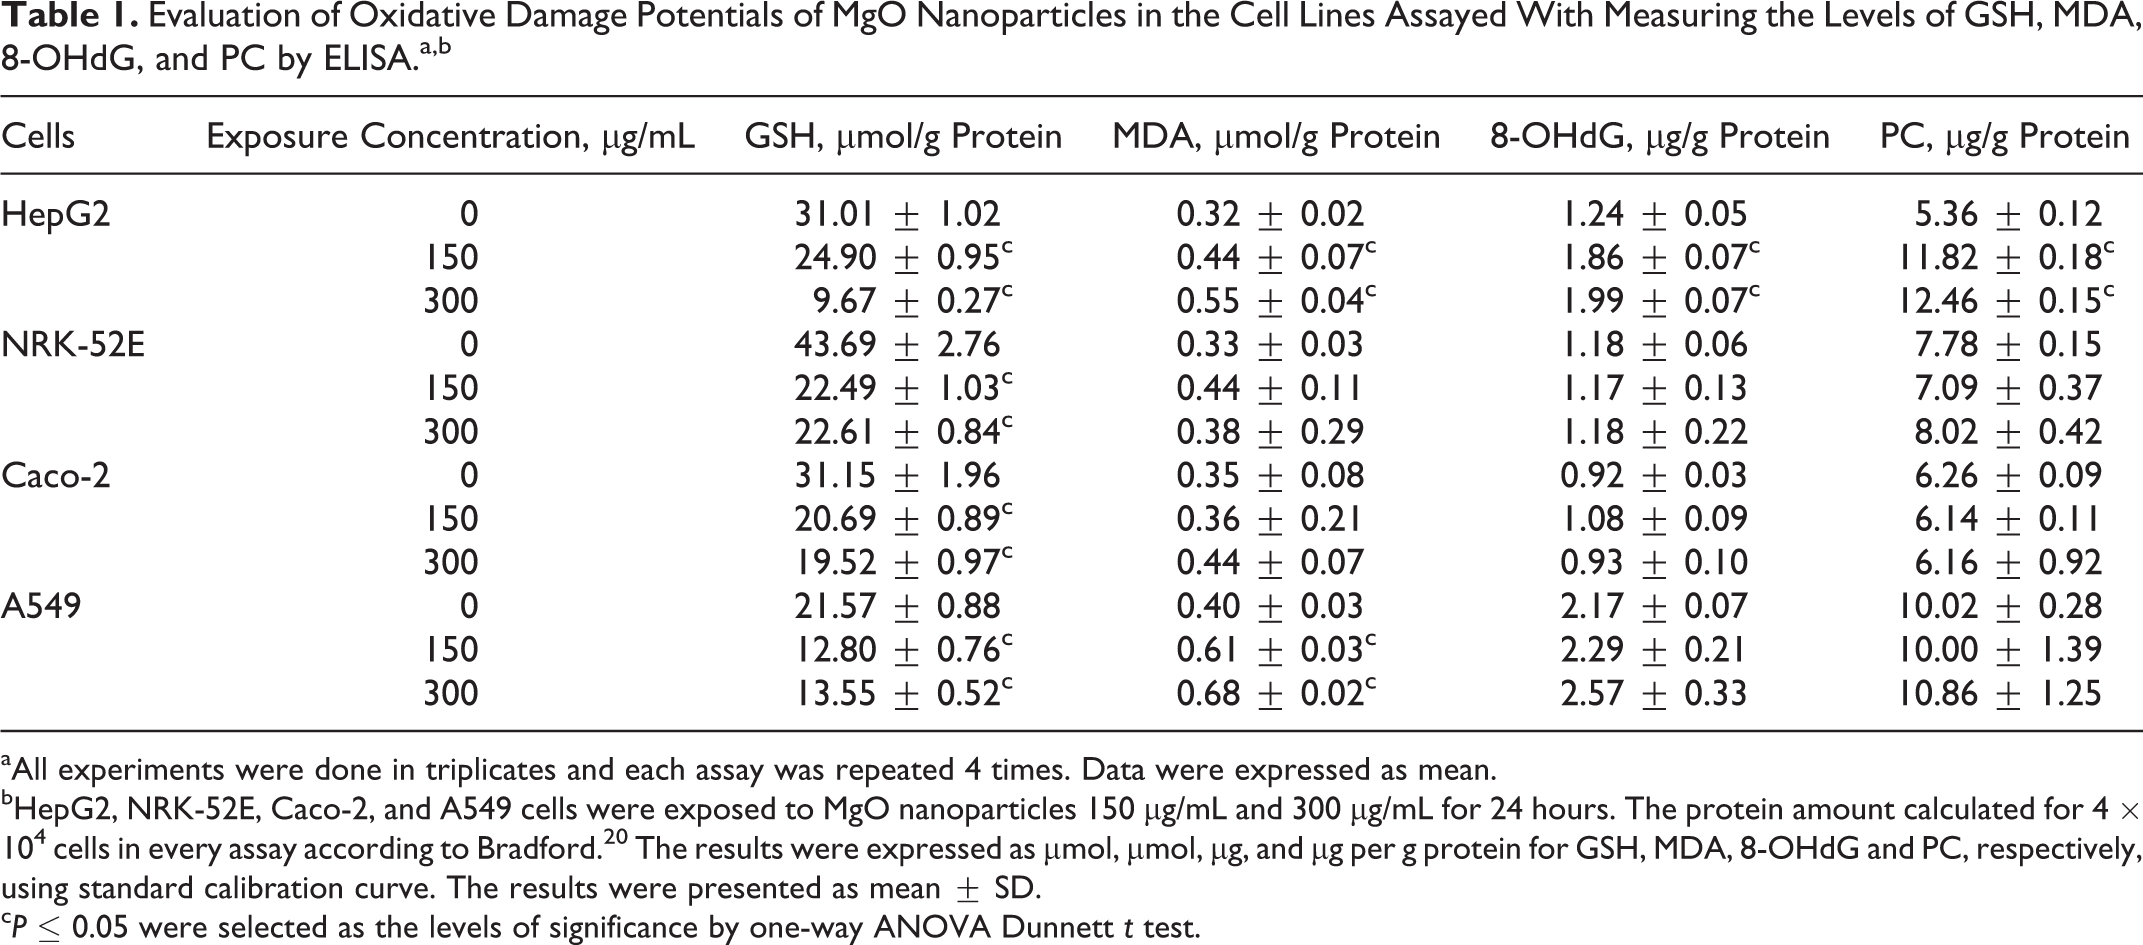
aAll experiments were done in triplicates and each assay was repeated 4 times. Data were expressed as mean.
bHepG2, NRK-52E, Caco-2, and A549 cells were exposed to MgO nanoparticles 150 µg/mL and 300 µg/mL for 24 hours. The protein amount calculated for 4 × 10⁴ cells in every assay according to Bradford. 20 The results were expressed as µmol, µmol, µg, and µg per g protein for GSH, MDA, 8-OHdG and PC, respectively, using standard calibration curve. The results were presented as mean ± SD.
c P ≤ 0.05 were selected as the levels of significance by one-way ANOVA Dunnett t test.
Apoptosis Assay
The cell death via apoptosis was assessed by Annexin V-FITC with PI apoptosis detection assay with HepG2, NRK-52E, Caco-2, and A549 cells at 50 to 300 µg/mL (Figure 5). Although apoptotic cells were noticed in exposed Caco-2 and NRK-52E cell lines, the main cell death pathway was not apoptosis since the proportion of necrotic/nonapoptotic cells was higher than apoptotic cells. The results of Annexin V-FITC with PI agree with the results of cytotoxicity assays (MTT and NRU) since the highest cell death was found to be at NRK-52E cell line and the least 1 was at A549 cell line (Figure 5).
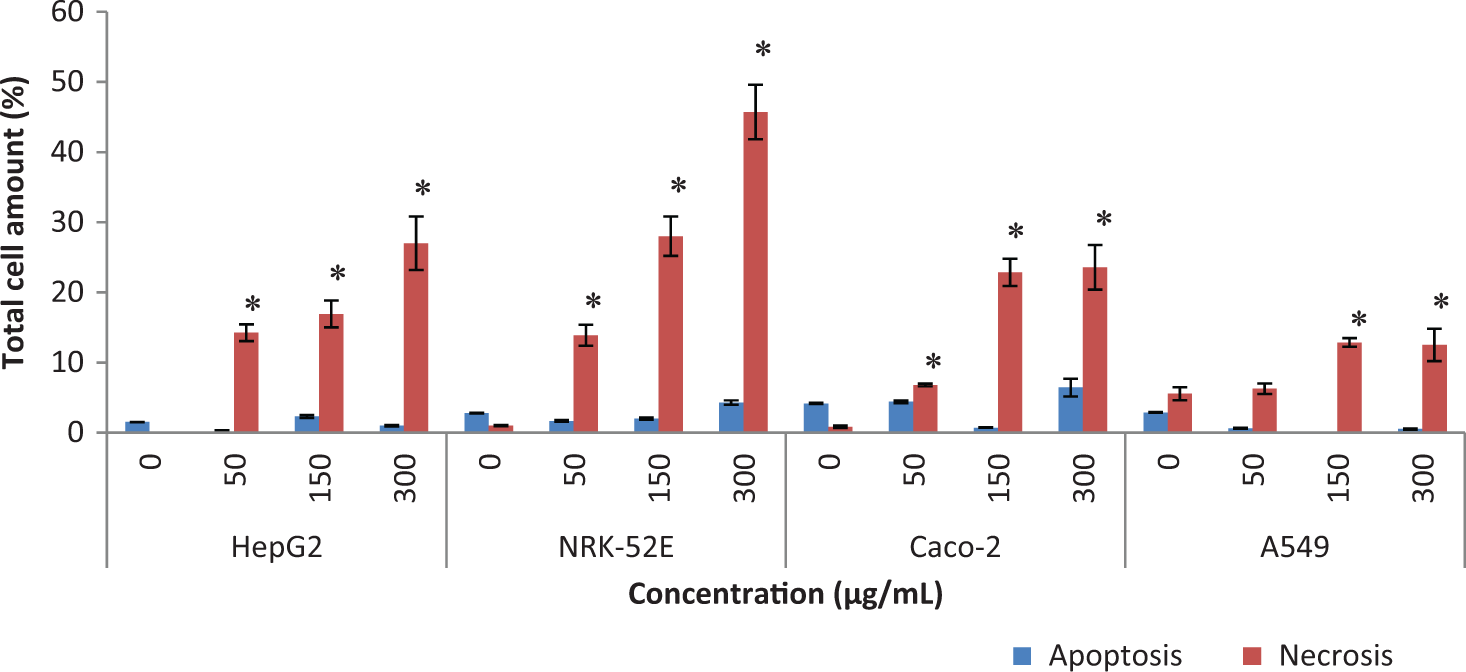
Evaluation on the apoptosis- and necrosis-inducing potentials of MgO nanoparticles assayed by Annexin V-FTIC with PI apoptosis detection assay. The assay was evaluated in HepG2, NRK-52E, and Caco-2 cells exposed to the nanoparticles at 50 to 300 µg/mL for 24 hours. The results were presented as percentage of the total cell amount. All experiments were done in triplicates, and each assay was repeated 4 times. *P ≤ .05 were selected as the levels of significance by 1-way ANOVA Dunnett t test. MgO indicates magnesium oxide; PI, propidium iodide; ANOVA, analysis of variance.
Discussion
The aim of the present study was to evaluate the toxic profiles of MgO nanoparticles on liver (HepG2), kidney (NRK-52E), intestine (Caco-2), and lung (A549) cells, reflecting different in vivo exposure routes, using various toxicological end points.
Several studies showed that MgO nanoparticles reduced the cell activity in human cardiac microvascular endothelial cells (at 100 μg/mL for 12 hours and 50 μg/mL for 24 hours), 21 slightly in human astrocyte-like astrocytoma U87 cells (≤35% at 100 μg/mL for 48 hours), 22 and in human umbilical vein endothelial cells (≤500 μg/mL). 23 Krishnamoorthy et al 24 observed there was no obvious effect against normal human lung fibroblast (CCD-25Lu) cells even at 300 μg/mL, while MgO nanoparticles effectively killed the several types of cancer cells including HeLa, SNU-16, and AGS cells in a dose-dependent manner in 24 hours. The IC50 values of MgO nanoparticles in HeLa, SNU-16, and AGS cell lines were found to be 174.0, 240.0, and 223.3 μg/mL, respectively, at 72 hours exposure and only a little difference in toxicity between 24-hour and 72-hour exposures. Similarly, no significant cytotoxicity was found in human intestinal INT407 and human cervical cancer SiHa cell lines at ≤300 μg/mL of MgO nanoparticles; however, at >300 μg/mL, the relative growth rate was lower than the control in cancerous cells. 25 The LC50 values of MgO nanoparticles were reported as 428 μg/mL and >1600 μg/mL in zebrafish embryos (Danio rerio). 26,27 In the present study, MgO nanoparticles showed cytotoxicity through decreased cell metabolic activity which was assessed by the determination of functional changes in mitochondrial and lysosomal functions. The IC50 values were in the range of 323.39 to 502.14 µg/mL for HepG2, NRK-52E, Caco-2, and A549 cells. However, the IC50 level was not reached for A549 by MTT assay. The reason why the different results were observed in both cytotoxicity assays might be because the particles were localized into the lysosomes of the A549 cells. As it is reported in many articles, some factors such as surface charge and hydrophobicity can influence the toxic potentials of the nanoparticles. 8,13 Also, nanoparticles can accumulate or attack different organelles in different cell types due to intrinsic cellular factors such as existing enzymes, surface groups in the membranes. Therefore, further investigation should be needed to better understand the underlying mechanisms on sensitivity in lysosomal activity of A549 cells against MgO nanoparticles.
Nanoparticles could cause DNA damage directly or by inducing oxidative damage and inflammatory responses in the cells. 13 Oxidative stress has been implicated as main mechanisms behind nanoparticles toxicity. 28 Recent studies reported that nanoparticles-induced oxidative damage was determined by increasing membrane lipid peroxidation, reactive oxygen species (ROS), decreasing intracellular GSH, and so on. 29 –31 In the present study, it was observed that MgO nanoparticles significantly highly induced DNA damage in NRK-52E, Caco-2, and A549 cells (P ≤ .05) and however slightly induced in HepG2 cells. According to the results of the oxidative damage assays, MgO nanoparticles induced oxidative damage with increase in the levels of MDA and decrease in the levels of GSH in HepG2, NRK-52E, Caco-2, and A549 cells.
There are some results supporting our data in the literature. Krishnamoorthy et al 24 observed that MgO nanoparticles enhanced lipid peroxidation by 154% and 129% after Escherichia coli and Pseudomonas aeruginosa exposed to 100 µg/mL and 50 µg/mL, respectively (P ≤ .05). They indicated that sequential oxidation–reduction reactions might occur at the MgO nanoparticle surface to produce ROS such as superoxide radical (O2 −), H2O2, and hydroxyl radical (OH). Similarly, it was indicated that MgO nanoparticles and their halogenated adducts exhibited strong antibacterial activity through membrane disruption, and the antibacterial activity of MgO is attributed to the generation of ROS. 32 The intratracheal instillation of MgO nanoparticles caused a significant dose-dependent reduction in the antioxidant defence capacity in rats. 28 Gelli et al 33 observed that MgO nanoparticles increased the formation of ROS through mitochondria dysfunction and/or depletion or inhibition of the antioxidant systems in rats following intratracheal instillation at the range of 1 to 5 mg/kg into rat lungs. Glutathione-S-transferase and catalase gene expressions were maximized in HepG2 cells at 150 μg/mL nanoparticle treatment with 48-hour incubation. 33 The oxidative damage-induced MgO nanoparticles was also observed in human cardiac microvascular endothelial cells. 21
As it is well known, apoptosis has been implicated as a major mechanism of cell death caused by nanoparticle-induced oxidative stress. Among the different apoptotic pathways, the intrinsic mitochondrial apoptotic pathway plays a major role in metal oxide nanoparticle-induced cell death, since mitochondria are 1 of the major target organelles for nanoparticle-induced oxidative stress. 34 –38 Ghobadian et al 26 reported MgO nanoparticles induced cellular apoptosis and intracellular ROS in zebrafish embryos. However, in the present study, MgO nanoparticles caused cell death through the other pathways than apoptosis.
In conclusion, cell death, DNA, and oxidative damage effects of MgO nanoparticles should raise concern about the safety associated with their applications in consumer products. However, this is the first comprehensive toxicity study of MgO nanoparticles. Therefore, further studies should be conducted to better understand the molecular mechanisms involved in the toxicity of MgO nanoparticles for its safer and proper utilization.
Footnotes
Author Contributions
Abudayyak, M. contributed to conception and design, acquisition, analysis, and interpretation; drafted manuscript; and critically revised manuscript. Öztaş, E contributed to design, acquisition, and analysis and drafted manuscript. Arici, M. contributed to design, acquisition and analysis and drafted the manuscript. Özhan, G contributed to conception and design, acquisition, analysis, and interpretation; drafted manuscript; and critically revised manuscript. All authors gave final approval and agreed to be accountable for all aspects of work ensuring integrity and accuracy.
Declaration of Conflicting Interests
The author(s) declared no potential conflicts of interest with respect to the research, authorship, and/or publication of this article.
Funding
The author(s) disclosed receipt of the following financial support for the research, authorship, and/or publication of this article: This work was supported by the Research Fund of Istanbul University (Project No: 52253).