
Abstract
Organophosphorus (OP) pesticides are known to induce pulmonary toxicity in both humans and experimental animals. To elucidate the mechanism of OP-induced cytotoxicity, we examined the effects of parathion and malathion and their respective metabolites, paraoxon and malaoxon, on primary cultured human large and small airway cells. Exposure to paraoxon and malaoxon produced a dose-dependent increase in cytotoxicity following a 24-hour exposure, while treatment with parathion or malathion produced no effects at clinically relevant concentrations. Exposure to paraoxon-induced caspase activation, but malaoxon failed to induce this response. Since caspases have a major role in the regulation of apoptosis and cell death, we evaluated OP-induced cell death in the presence of a caspase inhibitor. Pharmacological caspase inhibition protected against paraoxon-induced cell death but not malaoxon-induced cell death. These data suggest that caspase activation is a key signaling element in paraoxon-induced cell death, but not malaoxon-induced cellular death in the pulmonary epithelium.
Introduction
Many organophosphorus (OP) chemicals are implicated in the development of pulmonary injury in both humans and experimental animals 1 –14 (for review see Angelini et al 15 ). The pesticides, parathion, and malathion as well as their respective metabolites, paraoxon and malaoxon, are easily absorbed through the skin and mucous membranes. Traditionally, these compounds are thought to act by “irreversibly” binding to acetylcholinesterase (AChE) thereby inducing cholinergic hyperstimulation. The World Health Organization has classified parathion as a Class Ia cholinesterase-inhibiting pesticide, 16,17 and malathion has been identified as the causal agent in many occupational poisonings. 18 Clinical signs and symptoms are mediated largely by cholinergic effects in the periphery and central nervous system, which usually occur within 12 hours of exposure. 19
Most studies involving the toxicity of OP chemicals have focused on the effect of these compounds on AChE activity, but this pathway is not always exclusively involved in regulating OP-induced toxicity. 20 Several experimental and clinical studies of these chemicals have shown that multiple exposure routes including inhalation, 1,2 dermal contact, 21 ingestion, 5,6 and even intravenous 4,13 can result in pulmonary toxicity/injury. It is possible that these chemicals are directly affecting the viability of the pulmonary epithelium resulting in respiratory distress. The toxic effects of many OP pesticides, including parathion and malathion, depend primarily on their bioactivation to the –oxon toxic metabolites (ie, paraoxon and malaoxon, respectively). 22 –24 The parent compounds and/or toxic metabolites could directly impact the lungs, and this may explain how ingested pesticides can induce pulmonary injury in clinical situations. 5,6 Also, it is also possible that active P450 enzymes located within the lungs themselves are converting directly inhaled compounds into more toxic substances, 25 thereby resulting in pulmonary injury.
Pulmonary effects have been observed which contribute substantially to the clinical outcome. These changes include, but are not limited to, pulmonary endothelial permeability resulting in pulmonary edema 4 and induction of alveolar macrophage expression of tumor necrosis factor α (TNF-α), causing bronchoconstriction with consequent increases in airway resistance. 26 Clinical autopsy findings associated with acute parathion toxicity include acute emphysema with alveolar endothelial cell morphological changes and significant alveolar endothelial cell death. 27 Histopathological evaluation of these tissues has shown similar morphology to progressive idiopathic pulmonary fibrosis (PIPF) observed with chronic parathion toxicity. 28 PIPF is preceded by rapid development of alveolitis followed by pulmonary fibrosis. In addition to inducing bronchospasm, parathion exposure at doses lower than those inducing AChE effects also induced pulmonary macrophage activation and the expression of the proinflammatory cytokines TNF-α and interleukin 1β. Paraoxon administration does not induce these effects. 26 Studies have also found a positive association between parathion exposure and atopic asthma, a chronic airway inflammatory disease. 29,30 These effects are likely not due to the strong AChE effects principally associated with these compounds and may be due to another unknown mechanism.
In the current study, we demonstrate the direct toxic effects of commonly used pesticides on cultured human pulmonary epithelium. We evaluated viability of both primary small and large airway epithelial cells following exposure to parathion and malathion as well as their metabolites paraoxon and malaoxon. In this study, both parathion and malathion failed to reduce cellular viability at concentrations known to cause toxicity in vivo following a 24-hour treatment in either large or small airway cells, although malathion was toxic at higher concentrations. However, both paraoxon and malaoxon treatment induced dose-dependent decreases in cellular viability. Exposure to paraoxon induced caspase activation but malaoxon failed to induce this response. Since caspases have a major role in the regulation of apoptosis and cell death, we evaluated paraoxon- and malaoxon-induced cell death in the presence of the cell-permeable pan-caspase inhibitor N-benzyloxycarbonyl-Val-Ala-Asp-fluoromethylketone (Z-VAD-FMK). 31 Pharmacological caspase inhibition protected against paraoxon-induced cellular death in both primary normal human bronchial epithelial cells (NHBECs) and human small airway epithelial cells (SAECs), whereas this effect was not observed in malaoxon-induced cellular death. These data suggest that caspase activation is a key signaling element in paraoxon-, but not malaoxon-, induced cellular death in the pulmonary epithelium.
Materials and Methods
Experimental Chemicals
The compounds parathion, paraoxon, malathion, and malaoxon were all purchased from Sigma-Aldrich (St Louis, Missouri). Stock solutions were prepared in 100% denatured ethanol (EtOH) and stored at 4°C until use. Z-VAD-FMK was purchased from EMD Millipore (Billerica, Massachusetts). Stock solutions of Z-VAD-FMK were prepared in dimethyl sulfoxide (DMSO) to a concentration of 10 mmol/L and stored at −20°C until use.
Human Cell Culture
Primary NHBECs (Lonza; Walkersville, Maryland) were cultured in bronchial epithelial growth medium (Lonza) supplemented with bovine pituitary extract, hydrocortisone, human epithelial growth factor (hEGF), epinephrine, transferrin, insulin, retinoic acid, triiodothyronine, gentamicin, and amphotericin B. To ensure cells as closely as possible recapitulated normal in vivo biology and that the cells would not change (genetically or morphologically) over time, NHBECs from passages 5 to 9 were used. Primary human SAECs (Lonza) were cultured in small airway growth medium (Lonza) supplemented with fatty acid-free bovine serum albumin, bovine pituitary extract, hydrocortisone, hEGF, epinephrine, transferrin insulin, retinoic acid, tri-iodothyronine, gentamicin, and amphotericin B. Only SAECs from passages 5 to 9 were used.
Evaluation of Cellular Viability
The NHBECs or SAECs were plated in 96-well tissue culture plates at a cellular density of 3 × 10⁴ cells/well and allowed to attach for 24 hours. The cells were then treated for 24 hours with increasing concentrations of parathion, paraoxon, malathion, or malaoxon, (0.25, 0.5, 1, 2, 4, 5, or 10 mmol/L) or equivalent amounts of vehicle control (EtOH). Following each 24-hour exposure, an MTT Cell Viability Assay (Roche Applied Science; Indianapolis, Indiana) was performed according to the manufacturer’s instructions. Results were read on a SpectraMax Plate Reader (Molecular Devices; Sunnyvale, California) and expressed as percentage of relative viability.
Evaluation of Necrotic Cell Death
The NHBECs or SAECs were placed in 96-well tissue culture plates at a cellular density of 3 × 10⁴ cells/well and allowed to attach overnight. The cells were then treated for 24 hours with increasing concentrations of paraoxon or malaoxon (0.5, 1, 2, 3, 4, or 5 mmol/L) or equivalent amounts of vehicle control (EtOH). Lactate dehydrogenase (LDH) release was then measured using the Cytotoxicity Detection kit (Roche Applied Science) according to the manufacturer’s recommendations. Results were read on a SpectraMax Plate Reader and expressed as percentage of relative cytotoxicity.
Evaluation of OP-Induced Cell Morphology Changes
The NHBECs or SAECs were plated in 6-well tissue culture plates at a cellular density of 1 × 10⁵ cells/well and allowed to attach overnight. The cells were then treated with paraoxon (0.5 mmol/L), malaoxon (1 mmol/L), equivalent amounts of vehicle control (EtOH), or media alone for 24 hours. Following treatment, the cells were visualized with a Zeiss Axiovert 200 (Zeiss LD A-Plan 20× objective, 0.3 numerical aperture), and digital images were captured with a Nikon digital camera.
Evaluation of Caspase Activity
The NHBECs or SAECs were plated in 96-well tissue culture plates at a cellular density of 2 × 10⁴ cells/well and allowed to attach overnight. The cells were then treated with paraoxon (0.5 mmol/L), malaoxon (1 or 2 mmol/L), vehicle (EtOH), or media alone for 24 hours. Following exposure, caspase activity was measure using the Caspase-Glo 3/7 Assay (Promega; Madison, Wisconsin) according to the manufacturer’s instructions. Results were read on a GloMax Luminometer (Promega) and reported as fold-increase versus media control.
Inhibition of Caspase Activity
To determine whether paraoxon- and/or malaoxon-induced cell death was caspase dependent, NHBECs or SAECs that were prepared for MTT assay evaluation as stated earlier were coincubated with either increasing concentrations of paraoxon (0.25, 0.5, 1, or 2 mmol/L) or malaoxon (0.5, 1, 2, or 5 mmol/L) and Z-VAD-FMK (10 µmol/L) for 24 hours. A concentration of 10 µmol/L was chosen for its demonstrated ability to inhibit caspases at this concentration. 31,32 In order to control for the Z-VAD-FMK diluent, DMSO, vehicle, and chemical exposures were performed with media containing 0.01% DMSO. Following this exposure, a 3-[4,5-dimethylthiazol-2-yl]-2,5 diphenyl tetrazolium bromide (MTT) assay was performed, and results were reported as stated earlier.
Statistical Analysis
Statistical analysis and calculation of half maximal inhibitory concentration IC50 values were performed using GraphPad Prism 5 software (GraphPad Software, Inc; La Jolla, California). A 2-way analysis of variance was used to compare the mean responses among the experimental and control groups. The Bonferroni post-test was used to determine whether significant differences between groups existed. A P value of less than 0.05 was considered significant.
Results
Effects of OP Pesticides on Pulmonary Cellular Viability
At 24 hours, paraoxon and malaoxon induced a dose-dependent decrease in cell viability in both NHBECs and SAECs (Figure 1). The minimum paraoxon concentration that induced a significant cell viability decrease was 0.25 mmol/L, and the concentration that induced maximal viability loss was ∼2 mmol/L in both pulmonary cell types (Figure 1A and C). The calculated IC50 values for paraoxon were 0.50 mmol/L in NHBECs and 0.58 mmol/L in SAECs, respectively. Parathion was not significantly toxic in either NHBECs or SAECs at the concentrations tested (Figure 1A and C). The minimum malaoxon concentration that induced a significant cell viability decrease was 1 mmol/L, and the concentration that induced maximal viability loss was ≥10 mmol/L in both NHBECs and SAECs (Figure 1B and D). The calculated IC50 values for malaoxon in these systems were 0.74 mmol/L in NHBECs and 1.83 mmol/L in SAECs. Dose-dependent effects in both NHBECs and SAECs were observed when they were exposed to malathion; malathion concentrations of ≥5 mmol/L and ≥0.5 mmol/L were required to induce cell death in NHBECs (Figure 1B) and SAECs (Figure 1D), respectively. Although malathion induced statistically significant cell viability losses in SAECs at both 0.5 mmol/L and 1 mmol/L concentrations, actual cell death was minimal (∼10%).
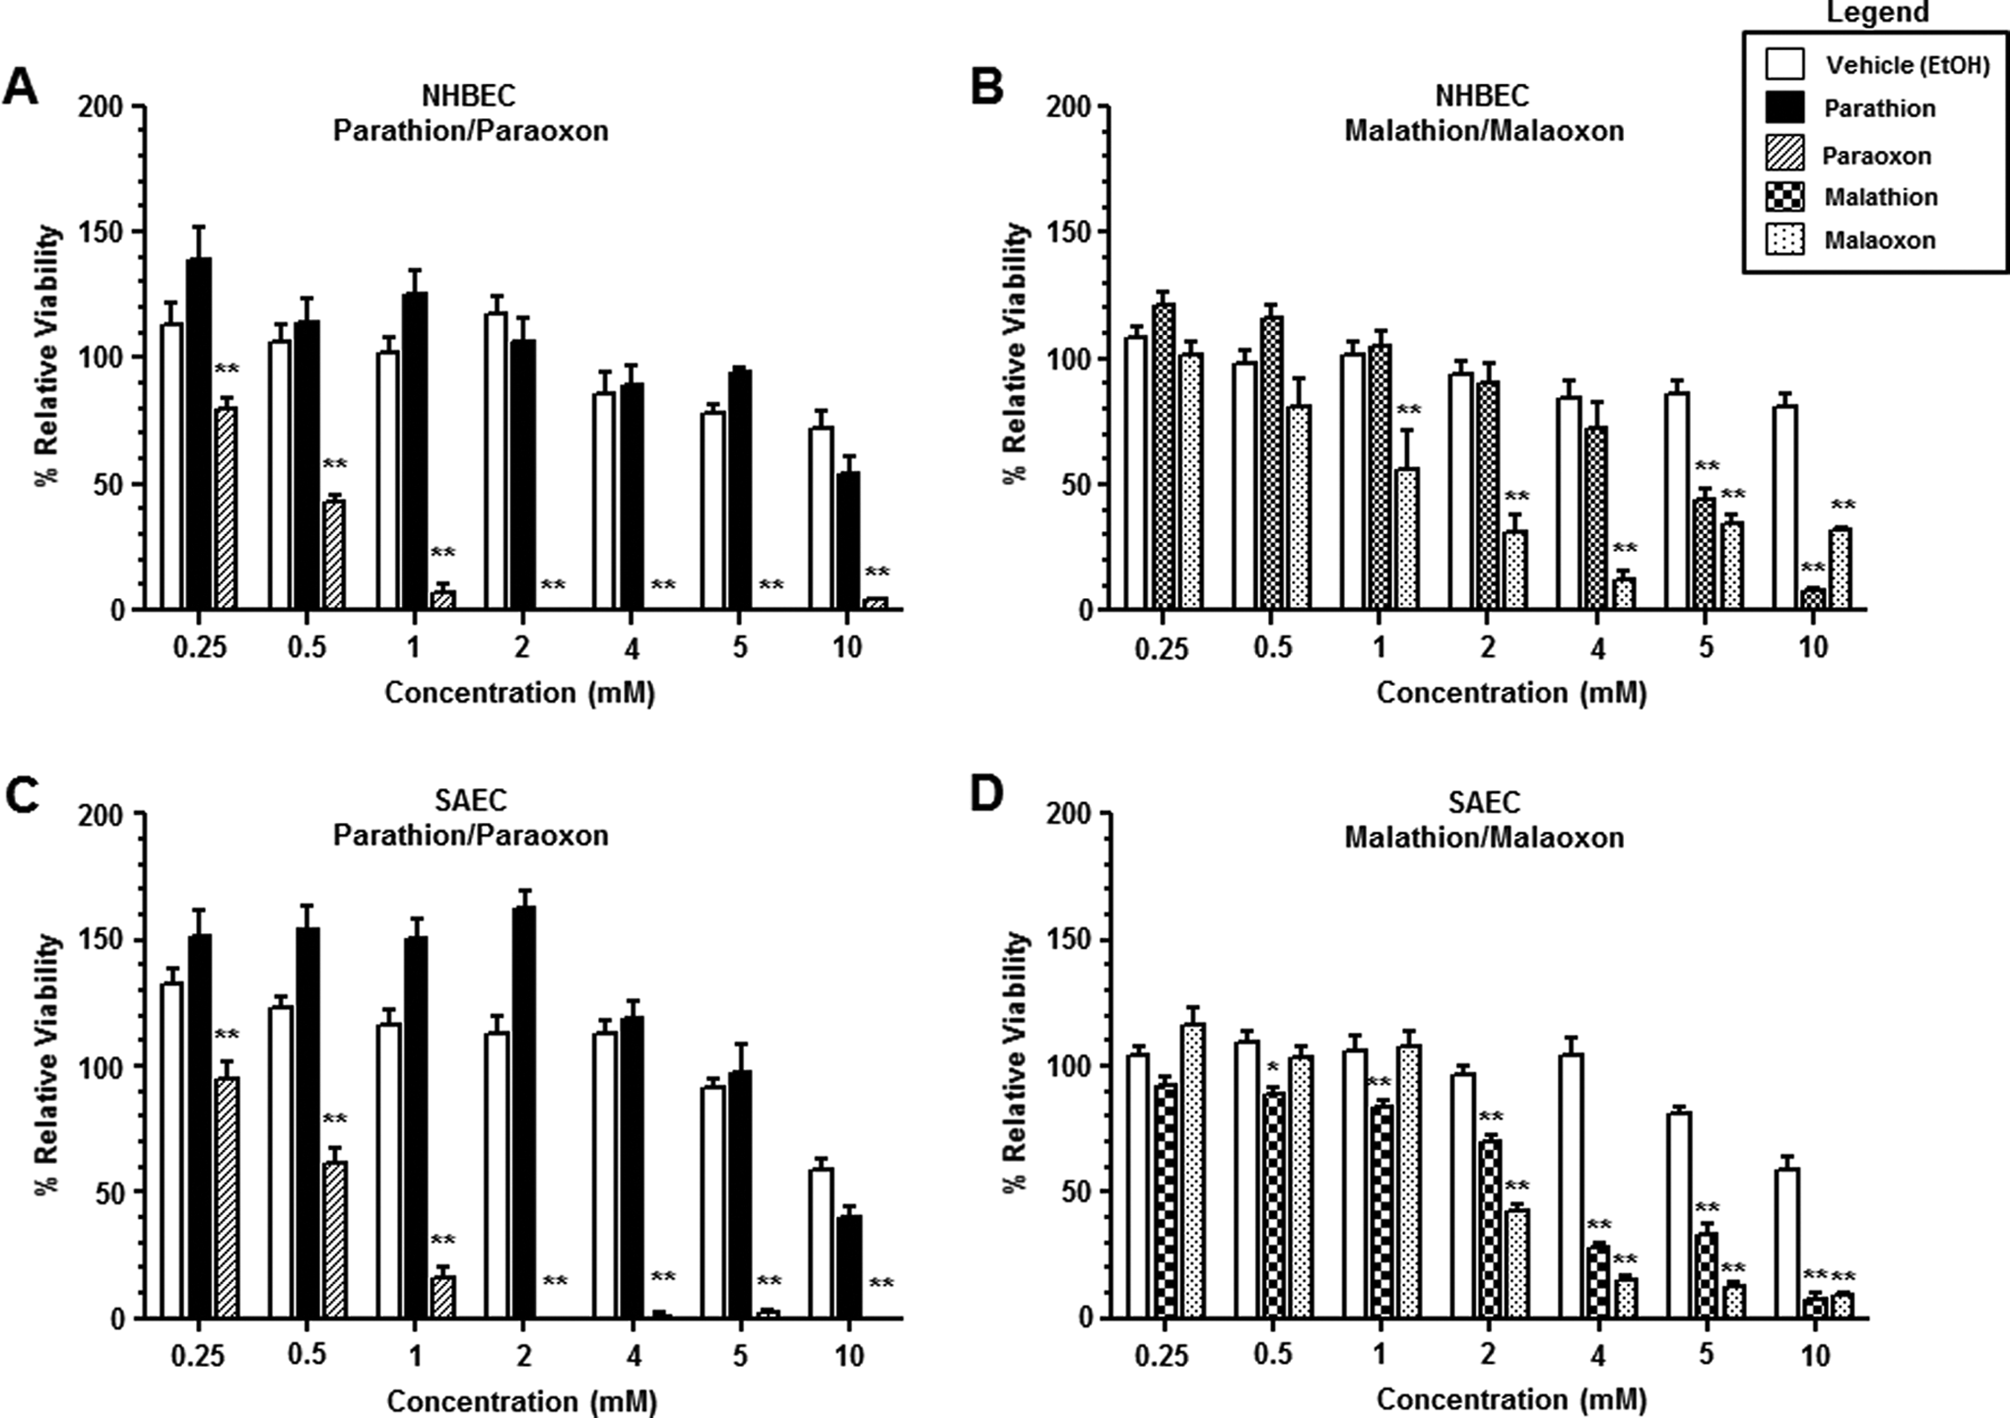
Effects of parathion, paraoxon, malathion, and malaoxon on the viability of cultured human airway epithelium. Open bars represent mean ± SEM of relative cellular viability following a 24-hour treatment of either NHBECs (A and B) or SAECs (C and D) with equivalent amounts of vehicle (EtOH). Filled bars represent mean ± SEM of relative cellular viability following a 24-hour treatment of either NHBECs (A) or SAECs (C) with increasing concentrations of parathion (0.25, 0.5, 1, 2, 4, 5, and 10 mmol/L). Cross-hatched bars represent mean ± SEM of relative cellular viability following a 24-hour treatment of either NHBECs (A) or SAECs (C) with increasing concentrations of paraoxon (0.25, 0.5, 1, 2, 4, 5, and 10 mmol/L). Checked bars represent mean ± SEM of relative cellular viability following a 24-hour treatment of either NHBECs (B) or SAECs (D) with increasing concentrations of malathion (0.25, 0.5, 1, 2, 4, 5, and 10 mmol/L). Dotted bars represent mean ± SEM of relative cellular viability following a 24-hour treatment of either NHBECs (B) or SAECs (D) with increasing concentrations of malaoxon (0.25, 0.5, 1, 2, 4, 5, and 10 mmol/L). n = 4 to 21 for each experimental condition. *Significantly decreased compared with vehicle control at P < 0.05; **significantly decreased compared with vehicle control at P < 0.01. SEM indicates standard error of the mean; NHBECs, normal human bronchial epithelial cells; SAECs, small airway epithelial cells; EtOH, ethanol.
Effects of Paraoxon and Malaoxon on Pulmonary Cell Cytotoxicity
The NHBECs were treated with increasing concentrations of paraoxon (0.5, 1, 2, 3, 4, or 5 mmol/L) or malaoxon (0.5, 1, 2, 3, 4, or 5 mmol/L) or equivalent amounts of vehicle control (EtOH) for 24 hours (Figure 2A). Statistically significant increases in LDH release were measured with these cells when they were exposed to 1 mmol/L paraoxon or 2 mmol/L malaoxon. Maximal effects were seen with 4 mmol/L paraoxon and 3 mmol/L malaoxon. Measurable increases in LDH release correlated with approximately 65% cytotoxicity with paraoxon and 70% cytotoxicity with malaoxon in NHBECs. Figure 2B illustrates the results observed when SAECs were treated with increasing concentrations of paraoxon (0.5, 1, 2, 3, 4, or 5 mmol/L), malaoxon (0.5, 1, 2, 3, 4, or 5 mmol/L), or equivalent amounts of vehicle control (EtOH) for 24 hours. Statistically significant increases in LDH release were measured at 0.5 mmol/L for both toxicants tested. Maximal effects were seen with 1 mmol/L paraoxon and 5 mmol/L malaoxon. Measurable increases in LDH release correlated with approximately 55% cytotoxicity with paraoxon and 95% cytotoxicity with malaoxon in treated SAECs.
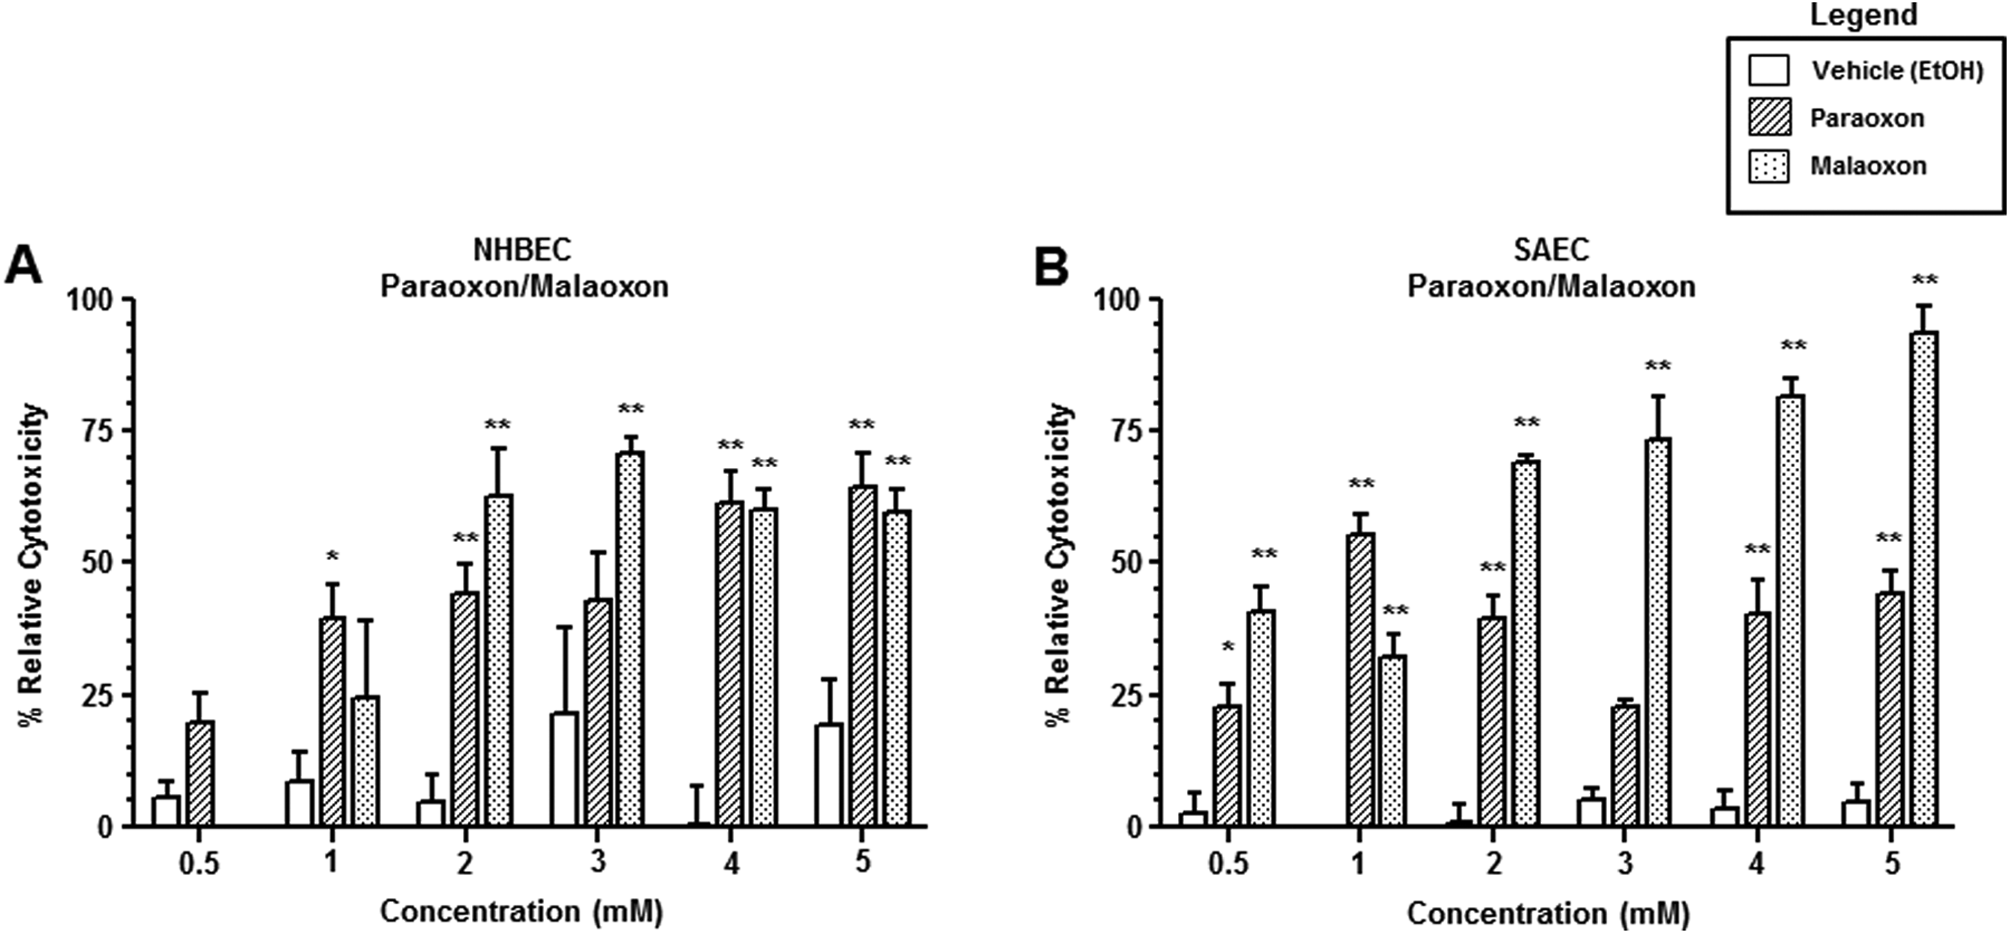
Cytotoxic effects of paraoxon and malaoxon on cultured human airway epithelium. Open bars represent mean ± SEM of relative cytotoxicity following a 24-hour treatment of either NHBECs (A) or SAEC (B) with equivalent amounts of vehicle (EtOH). Cross-hatched bars represent mean ± SEM of relative cytotoxicity following a 24-hour treatment of either NHBECs (A) or SAEC (B) with increasing concentrations of paraoxon (0.5, 1, 2, 3, 4, and 5 mmol/L). Dotted bars represent mean ± SEM of relative cytotoxicity following a 24-hour treatment of either NHBECs (A) or SAEC (B) with increasing concentrations of malaoxon (0.5, 1, 2, 3, 4, and 5 mmol/L). *Significantly increased compared with vehicle control at P < 0.05; **significantly increased compared with vehicle control at P < 0.01. SEM indicates standard error of the mean; NHBECs, normal human bronchial epithelial cells; SAECs, small airway epithelial cells; EtOH, ethanol.
Morphological Changes Associated With Exposure to OPs
Confluent monolayers of NHBECs were treated with media only (Figure 3A), vehicle (EtOH; Figure 3B), paraoxon (0.5 mmol/L; Figure 3C), or malaoxon (1 mmol/L; Figure 3D) for 24 hours. The experimental doses for these experiments were determined by estimating the IC50 for each toxicant with each cell type as illustrated in Figure 1. Following treatment, NHBECs exposed to paraoxon displayed distinct blebbing of the cellular membrane and appeared to have more condensed chromatin within the nuclei compared to those exposed to media or vehicle controls. Malaoxon-exposed NHBECs appeared to exfoliate from the cell culture plate surface with only a few of the remaining cells displaying cellular blebbing. Confluent monolayers of SAECs were treated with media only (Figure 3E), vehicle (EtOH; Figure 3F), paraoxon (0.5 mmol/L; Figure 3G), or malaoxon (2 mmol/L; Figure 3H) for 24 hours. Cellular blebbing similar to that observed with paraoxon-treated NHBECs was observed with paraoxon-treated SAECs, but the morphological effect was less pronounced. The SAECs exposed to an estimated IC50 dose of malaoxon also appeared to exfoliate from the cell culture surface, and cellular blebbing was observed at a higher frequency in the remaining SAECs when compared to that observed with malaoxon-treated NHBECs. There were no observable effects from vehicle treatment (EtOH) in either NHBECs or SAECS.
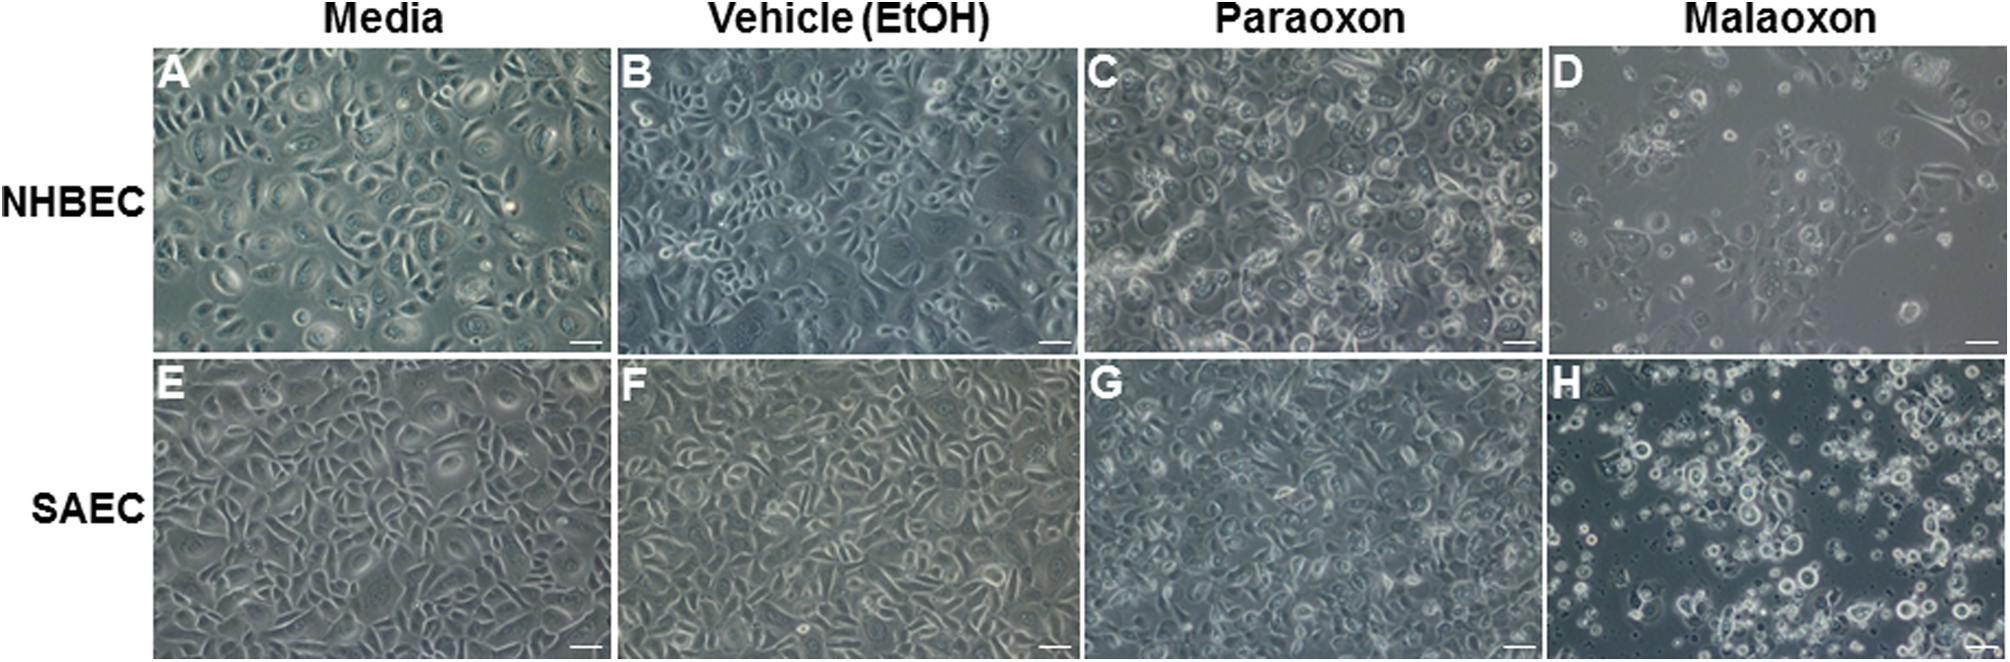
Morphological changes in cultured human airway epithelium following exposure to paraoxon and malaoxon. Phase contrast images of NHBECs and SAECs exposed to media alone, vehicle (EtOH), paraoxon (0.5 mmol/L), and malaoxon (1 mmol/L) for 24 hours. Bar = 50 µm. SEM indicates standard error of the mean; NHBECs, normal human bronchial epithelial cells; SAECs, small airway epithelial cells; EtOH, ethanol.
Organophosphorus Induction of Caspase Activity
In NHBECs, a 24-hour exposure to the approximate IC50 of paraoxon (0.5 mmol/L) for these cells induced an approximate 3.5-fold increase in caspase activity compared to the same cells treated with both media or equivalent amounts of vehicle (Figure 4A). In these same cells, a 24-hour exposure to the approximated IC50 of malaoxon (1 mmol/L) failed to induce caspase activity (Figure 4A). In SAECs, a 24-hour exposure to the estimated IC50 of paraoxon (0.5 mmol/L) induced an approximate 2-fold increase in caspase activity compared to the same cells treated with media or equivalent amounts of vehicle (Figure 4B). Unlike with NHBECs, a 24-hour treatment with the estimated IC50 of malaoxon (2 mmol/L) induced an approximate 1.9-fold increase in caspase activity compared to controls (media only or vehicle).
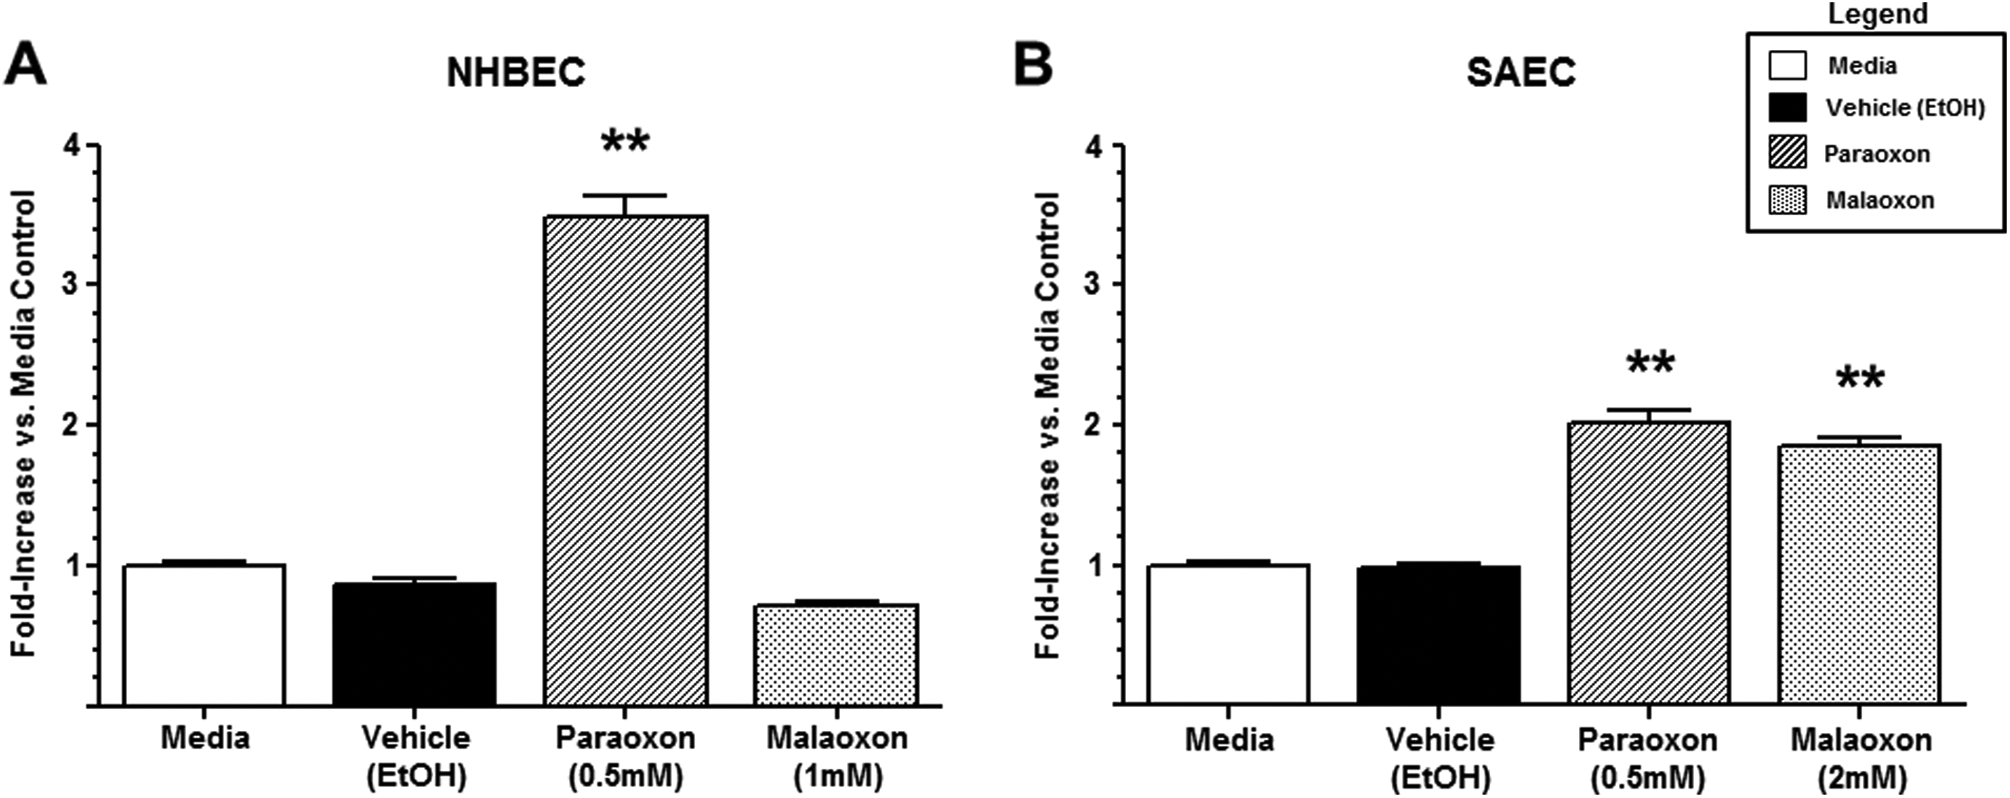
Caspase activation in cultured human airway epithelium following OP pesticide exposure. Open bars represent mean ± SEM of relative caspase activity following a 24-hour treatment of either NHBECs (A) or SAECs (B) with media alone. Closed bars represent mean ± SEM of relative caspase activity following a 24-hour treatment of either NHBECs (A) or SAECs (B) with equivalent amounts of vehicle (EtOH). Cross-hatched bars represent mean ± SEM of relative caspase activity following a 24-hour treatment of either NHBECs (A) or SAECs (B) with equivalent amounts of paraoxon (0.5 mmol/L). Dotted bars represent mean ± SEM of relative caspase activity following a 24-hour treatment of either NHBECs (A) or SAECs (B) with equivalent amounts of malaoxon (1 mmol/L). *Significantly increased compared with vehicle control at P < 0.05; **significantly increased compared with vehicle control at P < 0.01. SEM indicates standard error of the mean; NHBECs, normal human bronchial epithelial cells; SAECs, small airway epithelial cells; EtOH, ethanol.
Effect of Caspase Inhibition on OP-Induced Cell Death
Paraoxon-treated (0.25-2 mmol/L) NHBEC (Figure 5A) and SAEC (Figure 5C) monolayers exhibited a dose-dependent loss of cellular viability compared to simultaneous vehicle-treated (EtOH) control after 24 hours. Coincubation of these NHBEC or SAEC monolayers with the cell permeable pharmacological caspase inhibitor, Z-VAD-FMK (10 µmol/L), reduced the amount of paraoxon-induced cellular death. The amount of protection that could be correlated with caspase inhibition was also dependent upon the paraoxon dose. Malaoxon-treated (0.5-5 mmol/L) NHBEC (Figure 5B) and SAEC (Figure 5D) monolayers exhibited a dose-dependent loss of cellular viability compared to simultaneous vehicle-treated control after 24 hours. Incubation of these treated monolayers with Z-VAD-FMK failed to provide any protection against malaoxon-induced cellular death.
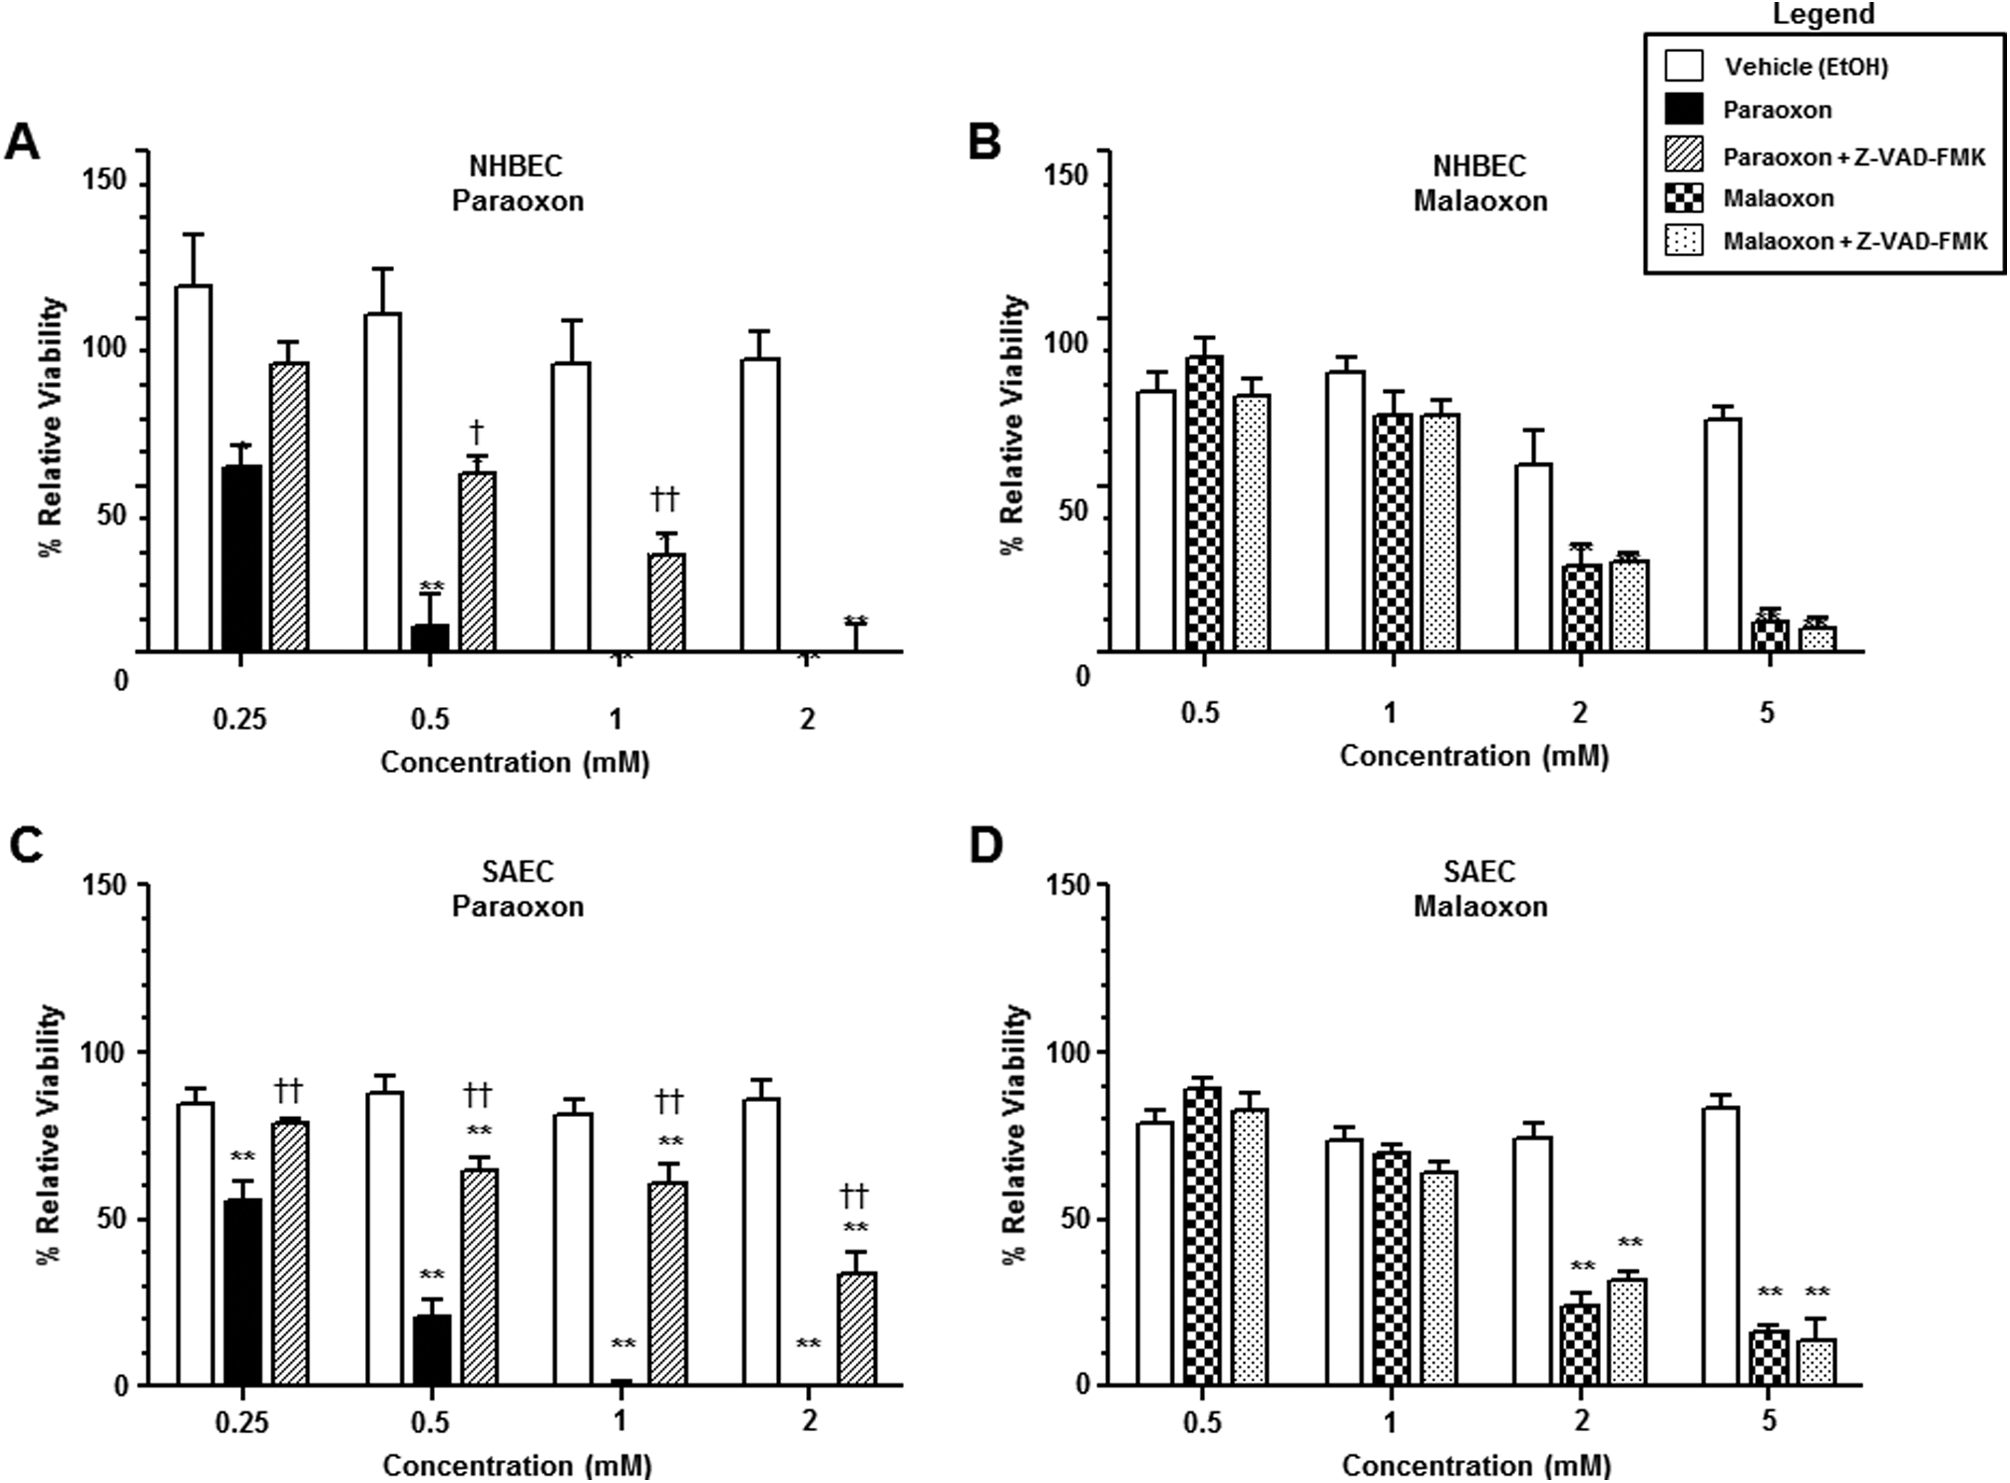
Effect of caspase inhibition on OP-induced changes in cellular viability in human cultured airway epithelium. Open bars represent mean ± SEM of relative cellular viability following a 24-hour treatment of either NHBECs (A and B) or SAECs (C and D) with equivalent amounts of vehicle (EtOH, 0.01% DMSO). Closed bars represent mean ± SEM of relative cellular viability following a 24-hour treatment of either NHBECs (A) or SAECs (C) with increasing concentrations of paraoxon (0.25, 0.5, 1, and 2 mmol/L) in the presence of 0.01% DMSO. Cross-hatched bars represent mean ± SEM of relative cellular viability following a 24-hour treatment of either NHBECs (A) or SAECs (C) with increasing concentrations of paraoxon (0.25, 0.5, 1, and 2 mmol/L) in the presence of the caspase inhibitor Z-VAD-FMK (10 µmol/L). Checkered bars represent mean ± SEM of relative cellular viability following a 24-hour treatment of either NHBECs (B) or SAECs (D) with increasing concentrations of malaoxon (0.25, 0.5, 1, and 2 mmol/L) in the presence of 0.01% DMSO. Dotted bars represent mean ± SEM of relative cellular viability following a 24-hour treatment of either NHBECs (B) or SAECs (D) with increasing concentrations of malaoxon (0.25, 0.5, 1, and 2 mmol/L) in the presence of the caspase inhibitor Z-VAD-FMK (10 µmol/L). *Significantly decreased compared with vehicle control at P < 0.05; **significantly decreased compared with vehicle control at P < 0.01. †Significantly increased compared with experimental chemical at P < 0.05; ††significantly increased compared with experimental chemical at P < 0.01. SEM indicates standard error of the mean; NHBECs, normal human bronchial epithelial cells; SAECs, small airway epithelial cells; DMSO, dimethyl sulfoxide; EtOH, ethanol.
Discussion
We examined the effects of the pesticides parathion and malathion as well as their metabolites, paraoxon and malaoxon, on pulmonary epithelial cell viability. Parathion and malathion failed to induce cellular death (Figure 1) at a concentration associated with in vivo pulmonary injury. 4,11 As opposed to parathion and malathion, the metabolites of these compounds, paraoxon and malaoxon, produced dose-dependent increases in cell death among the cultured pulmonary epithelial cells examined. Paraoxon doses as low as 0.25 mmol/L and malaoxon doses as low as 1 mmol/L produced statistically significant reduced viability compared to simultaneous vehicle controls (Figure 1). These results suggest that direct cellular toxicity of these pesticides is mediated through the chemical metabolites rather than the parent compounds. It is interesting to note that malathion did induce cell death in SAECs at increased concentrations. This could have occurred due to differences in P450 activity in SAECs versus NHBECs. Studies have demonstrated that cultured NHBECs have reduced P450 activity, 33 while cultured SAECs may contain Clara cells that have increased P450 activity. 34 In our system, SAECs may be metabolizing the malathion into the more toxic compound malaoxon. To the best of our knowledge, this is the first study to compare this aspect of parathion-, paraoxon-, malathion-, or malaoxon-induced toxicity in these specific pulmonary cell types (NHBECs and SAECs).
Since both paraoxon and malaoxon were shown to be the most toxic to both NHBECs and SAECs in our experimental system, both of these cell types were then studied to examine the possibility that these chemicals induced different toxic mechanisms in cells derived from either large or small airways. In addition to cellular viability measurements, we examined whether paraoxon or malaoxon reduced cellular viability through the disruption of the cell membrane. To do this, we performed the LDH release assay following a 24-hour exposure to increasing concentrations of either paraoxon or malaoxon (Figure 2). This assay measures the integrity of the cell membrane. Increased LDH detected in the cell culture medium suggests disruption of this membrane and necrotic cell death. Both paraoxon and malaoxon exposure increased cytotoxicity for both cell types. With malaoxon exposure, this increase appeared to be dose dependent. In cells exposed to paraoxon, the cytotoxicity associated with necrotic cell death appeared to plateau at an exposure concentration of ∼2 mmol/L in both cell types. It is interesting to note that paraoxon was slightly more cytotoxic to large airway cells when compared to small airway cells (Figure 2).
The pulmonary cells responded differently to the 2 different compounds as observed in our cellular viability/cytotoxicity results (Figures 1 and 2). The cellular morphology was visibly different following paraoxon or malaoxon treatment (Figure 3). Malaoxon treatment caused many observable changes in the cellular morphology of both NHBECs and SAECs (Figure 3D and E). With this treatment, many cells lost contact with the tissue culture matrix and several of the cells that remained had a necrotic-like morphology. The morphological changes associated with paraoxon exposure were much more subtle. The vast majority of the cells (NHBECs and SAECs) remained attached to the cell culture surface. These cells did display cell membrane blebbing and appeared to have more condensed chromatin within the nuclei compared to those exposed to media or vehicle controls. These morphological changes are possible indications of apoptosis. 35 These morphological differences in response to paraoxon and malaoxon exposure suggest that these compounds may have induced cellular death through distinct mechanisms.
Caspase activity is a key signaling element in the activation of the apoptotic pathway. 36,37 To determine whether the observed cell death in our studies could be attributed to apoptosis, we examined whether or not paraoxon and/or malaoxon induced caspase activity in NHBECs and SAECs (Figure 4). Exposure to paraoxon (0.5 mmol/L) induced caspase activation in both NHBECs (∼3.5-fold) and SAECs (∼2-fold; Figure 4A), while malaoxon (2 mmol/L) exposure only increased caspase activity in SAECs (∼1.9-fold; Figure 4B). These results suggest that paraoxon and to a lesser extent malaoxon induce apoptosis in these cells. To determine whether caspase activity and subsequent apoptosis were responsible for cellular death, we introduced the generalized pharmacological caspase inhibitor, Z-VAD-FMK, into our cellular viability assays (Figure 5). Incubation of NHBECs and SAECs with Z-VAD-FMK protects, at least in part, against paraoxon-induced loss of cellular viability (Figure 5A and C). At higher tested concentrations, the paraoxon seemed to overwhelm the cell systems and push the cells toward the necrotic cell death pathway. This protection was not observed when malaoxon exposed cells were treated with Z-VAD-FMK (Figure 5B and D). These results indicated that paraoxon pushed the cells toward the apoptotic pathway (at concentrations <IC50), while malaoxon pushed the cells toward the necrotic pathway at all concentrations examined.
Organophosphorus may induce toxicity through other mechanisms in addition to inhibition of AChE, 38,39 and the clinical course and response to treatment of OP poisoning differ substantially between OPs, 40 underscoring the need for a more complete understanding of the physiological effects of OP compounds. In the present study, we used NHBECs and SAECs to study the effects of parathion, paraoxon, malathion, and malaoxon on the regulation of cellular viability/death. To the best of our knowledge, prior studies have not examined the mechanism of OP-induced cellular death in cultured pulmonary epithelial cells. Here, we demonstrated that both paraoxon and malaoxon reduce cell viability in a dose-dependent manner. The approximate IC50 value of paraoxon was 0.5 mmol/L in both cell types and the approximate IC50 value of malaoxon was 1 mmol/L in NHBECs and 2 mmol/L in SAECs. Parathion had no significant effect on cell viability at the concentrations examined. Malathion did not induce cellular death at the concentrations examined in this study in NHBECs but did induce cellular death in SAECs, possibly due to differences in P450 activity. Furthermore, we demonstrated that exposure to paraoxon induced caspase activation in both NHBECs and SAECs, while malaoxon only induced caspase activity in SAECs. Caspase inhibition protected against paraoxon-induced cellular death but not against malaoxon-induced cellular death. These data suggest that caspase activation is, at least in part, responsible for paraoxon-induced cellular death in both NHBECs and SAECs.
Footnotes
Acknowledgments
The authors thank Ms. Donna Hoffman for administrative support throughout the manuscript preparation process.
Authors’ Note
Angelini contributed to conception and design; contributed to acquisition, analysis, and interpretation; drafted the manuscript; and critically revised the manuscript. Moyer contributed to design; contributed to acquisition, analysis, and interpretation; and critically revised the manuscript. Cole contributed to acquisition and analysis and critically revised the manuscript. Willis contributed to acquisition and analysis and critically revised the manuscript. Oyler contributed to design; contributed to analysis and interpretation; drafted the manuscript; and critically revised the manuscript. Dorsey contributed to analysis and interpretation and critically revised the manuscript. Salem contributed to analysis and interpretation and critically revised the manuscript. All authors gave final approval and agree to be accountable for all aspects of work ensuring integrity and accuracy.
Declaration of Conflicting Interests
The author(s) declared the following potential conflicts of interest with respect to the research, authorship, and/or publication of this article: DJA was a recipient of a National Research Council Senior Research Associateship. RAM was a Presidential Management Fellow at the Defense Threat Reduction Agency. KLW and SC were recipients of National Research Council Research Associateships sponsored by the Defense Threat Reduction Agency.
Funding
The author(s) disclosed receipt of the following financial support for the research, authorship, and/or publication of this article: This work was supported through the U.S. Army Edgewood Chemical Biological Center’s Commander’s Fund.