
Abstract
To examine 4-week toxicity of
Keywords
Introduction
A dietary deficiency in methionine (an essential amino acid) causes growth retardation, 1 and its supplementation to grain-based (methionine deficient) feed promotes growth of domestic animals. 2,3 However, supplementation of methionine at doses higher than dietary requirements appears to cause suppression of feed intake and growth. 4 Excessive intake of methionine causes hematological changes, hemolytic anemia, and subsequent splenic changes such as darkening, enlargement in gross observation, and hemosiderin deposition in histological examination. 5 –7 Although some studies have already examined short-term methionine toxicity in experimental animals, 4 –7 limited information is available from multidose toxicity studies that would enable establishing no-observed-adverse-effect-level (NOAEL) and lowest-observed-adverse-effect level (LOAEL) for this amino acid. Therefore, the present study attempted to determine NOAEL and LOAEL of methionine added to a standard rat diet for 4 continuous weeks.
Materials and Methods
Test Material
Pharmaceutical grade
Dietary Ingredients.
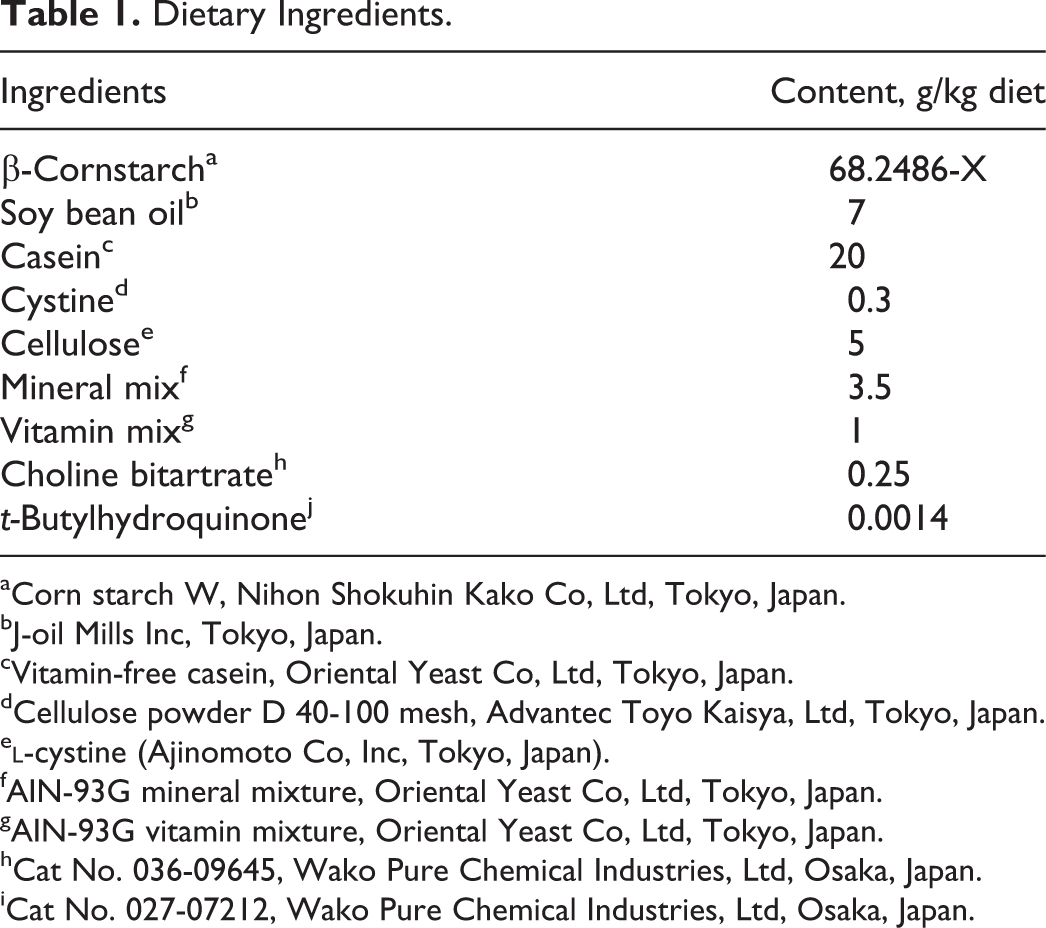
aCorn starch W, Nihon Shokuhin Kako Co, Ltd, Tokyo, Japan.
bJ-oil Mills Inc, Tokyo, Japan.
cVitamin-free casein, Oriental Yeast Co, Ltd, Tokyo, Japan.
dCellulose powder D 40-100 mesh, Advantec Toyo Kaisya, Ltd, Tokyo, Japan.
e
fAIN-93G mineral mixture, Oriental Yeast Co, Ltd, Tokyo, Japan.
gAIN-93G vitamin mixture, Oriental Yeast Co, Ltd, Tokyo, Japan.
hCat No. 036-09645, Wako Pure Chemical Industries, Ltd, Osaka, Japan.
iCat No. 027-07212, Wako Pure Chemical Industries, Ltd, Osaka, Japan.
Animal and Experimental Protocol
The study received an approval from Ajinomoto’s Institutional Animal Care and Use Committee. Four-week-old male F344/DuCrlCrj rats were purchased from Charles River Japan (Atsugi, Japan) and maintained in controlled conditions at 23°C ± 1°C and 60% ± 10% humidity with 12-hour light (0700 to 1900) and 12-hour dark cycle. Rats were housed individually in stainless steel cages and given free access to drinking water and a diet. Rats were fed a basal purified diet (no addition of methionine) and acclimated for 1 week. Thereafter, the rats were randomly assigned to 5 dietary groups (n = 6) and fed experimental diets with predetermined amounts of methionine (0%, 0.1%, 0.3%, 0.9%, or 2.7% [w/w] diet) for 4 weeks.
Rats were observed daily for clinical signs and general conditions. Body weights and food intakes were measured on days 0, 3, 6, 14, 21, and 27. Thereafter, half of animals in each group were placed in metabolic cages individually to collect urine samples and fasted for 18 hours. On day 28, they were weighed and sacrificed by exsanguination after collection of blood samples from the postcaval vein under ether anesthesia. Other half animals were placed in metabolic cages to collect urine samples similarly and sacrificed on day 29. ETDA-2K, trisodium citrate, or sodium heparin was added to the collected blood samples as anticoagulants for hematological examinations, coagulation tests, and blood chemistry, respectively. Plasma samples obtained using sodium citrate or heparin were stored at −80°C before the clinical laboratory tests.
Clinical Pathology
Urine volume, specific gravity (SG; digital urine gravity refractometer), pH, glucose (GLU), protein, occult blood, ketone, bilirubin, and urobilinogen were measured using an automated urine analyzer (CliniTek 500, Bayer AG, Leverkusen Germany), and total amounts of sodium (Na), potassium (K), and chloride (Cl) ions excreted were measured using a fully automatic electrolyte analyzer (EA06T, A&D Corp, Yokohama, Japan). Blood samples containing EDTA-2K were analyzed for red blood cell count (RBC), hemoglobin (HGB), hematocrit (HCT), mean corpuscular volume (MCV), mean corpuscular hemoglobin (MCH), MCH concentration (MCHC), platelet count, white blood cell (WBC) count, differential white blood cell counts including neutrophil (NEUT) count, lymphocyte count, monocyte (MONO) count, eosinophil (EOS) cell count, and basophil count, and reticulocytes using a multiblood testing device (ADIVIA2120, Simens, Munich, Germany). Blood samples anticoagulated by trisodium citrate were used for measurement of prothrombin time (PT), activated partial thromboplastin time (APTT), and fibrinogen (Fb) with a fully automated blood coagulation analyzer (CA-5000, Cysmex Inc, Kobe, Japan). Heparinized plasma samples were evaluated for lactic dehydrogenase, aspartate transaminase, alanine transaminase, creatine phosphokinase, alkaline phosphatase, total bilirubin (T-BIL), CRE, blood urea nitrogen (BUN), triglyceride (TG), total cholesterol (T-CHO), phospholipid (PL), GLU, Na, K, Cl, calcium (Ca), inorganic phosphorus, and total protein (TP) using an automatic analyzer for clinical chemistry (TBA-120FR, Toshiba Corp, Tokyo, Japan).
Postmortem Evaluations
All animals euthanized by exsanguination were subjected to a complete gross pathological examination, including external appearance and the peritoneal, pleural, and cranial cavities. The brain, heart, spleen, liver, kidneys, thymus, adrenals, testes, pituitary gland, and submaxillary glands (submandibular glands and sublingual glands) were weighed, and values relative to the body weights were calculated. In addition to the above-mentioned organs, organs and tissues including the lung, esophagus, stomach, duodenum, jejunum, ileum (including Peyer patches), colon, cecum, pancreas, urinary bladder, trachea, thyroid gland, tongue, skeletal muscle, sciatic nerve, spinal cord, aorta, eyeballs, Harderian glands, skin, mesenteric and cervical lymph nodes, bone marrow (sternum), epididymis, prostate, seminal vesicles, coagulating gland, parathyroid glands, and exorbital lacrimal gland were fixed in 10% buffered formalin solution. Paraffin sections of all tissues from the 5 dietary groups were stained with hematoxylin and eosin (HE) for histopathological assessment. Splenic and hepatic sections were stained also with Prussian blue for detection of iron in these organs.
Statistical Analysis
Values in each group (body weight, food consumption, water consumption, urinalysis, hematology, blood chemistry, and organ weight) were expressed as means and standard deviation. Group variances for the appropriate parameters were compared using Bartlett method. When the differences between group variances were not significant, Dunnett multiple comparison method was applied to determine the significance of differences with the basal control group. If the Bartlett test indicated significant differences between group variances for a given parameter, that parameter was compared among groups using the Steel multiple comparison method for mean ranking. The criterion of significance was an α level of .05 or .01.
Results
General Observations
There were no remarkable changes in general conditions, and no deaths occurred in any group during the experiment. However, a significant growth inhibition was seen in rats fed additional methionine (Table 2), and body weight gain for 4 weeks in 2.7% and 0.9% (w/w) group was 5 ± 3 g and 108 ± 9 g, respectively, while that in control was 123 ± 11 g. Growth inhibition in rats fed 2.7% (w/w) additional methionine was associated with significant decrease in food intake (Table 2). Water intake also decreased in the highest methionine group although its relative values to body weight did not. In contrast, water intake in rats fed 0.9% (w/w) additional methionine increased significantly. Based on food intakes on experimental day 14, additional methionine intake in 0.1%, 0.3%, 0.9%, and 2.7% (w/w) groups were 77 ± 6, 236 ± 16, 705 ± 31, 1458 ± 257 mg/kg BW/d, respectively.
Body Weight and Intake of Food, Water, and Additional Methionine.a
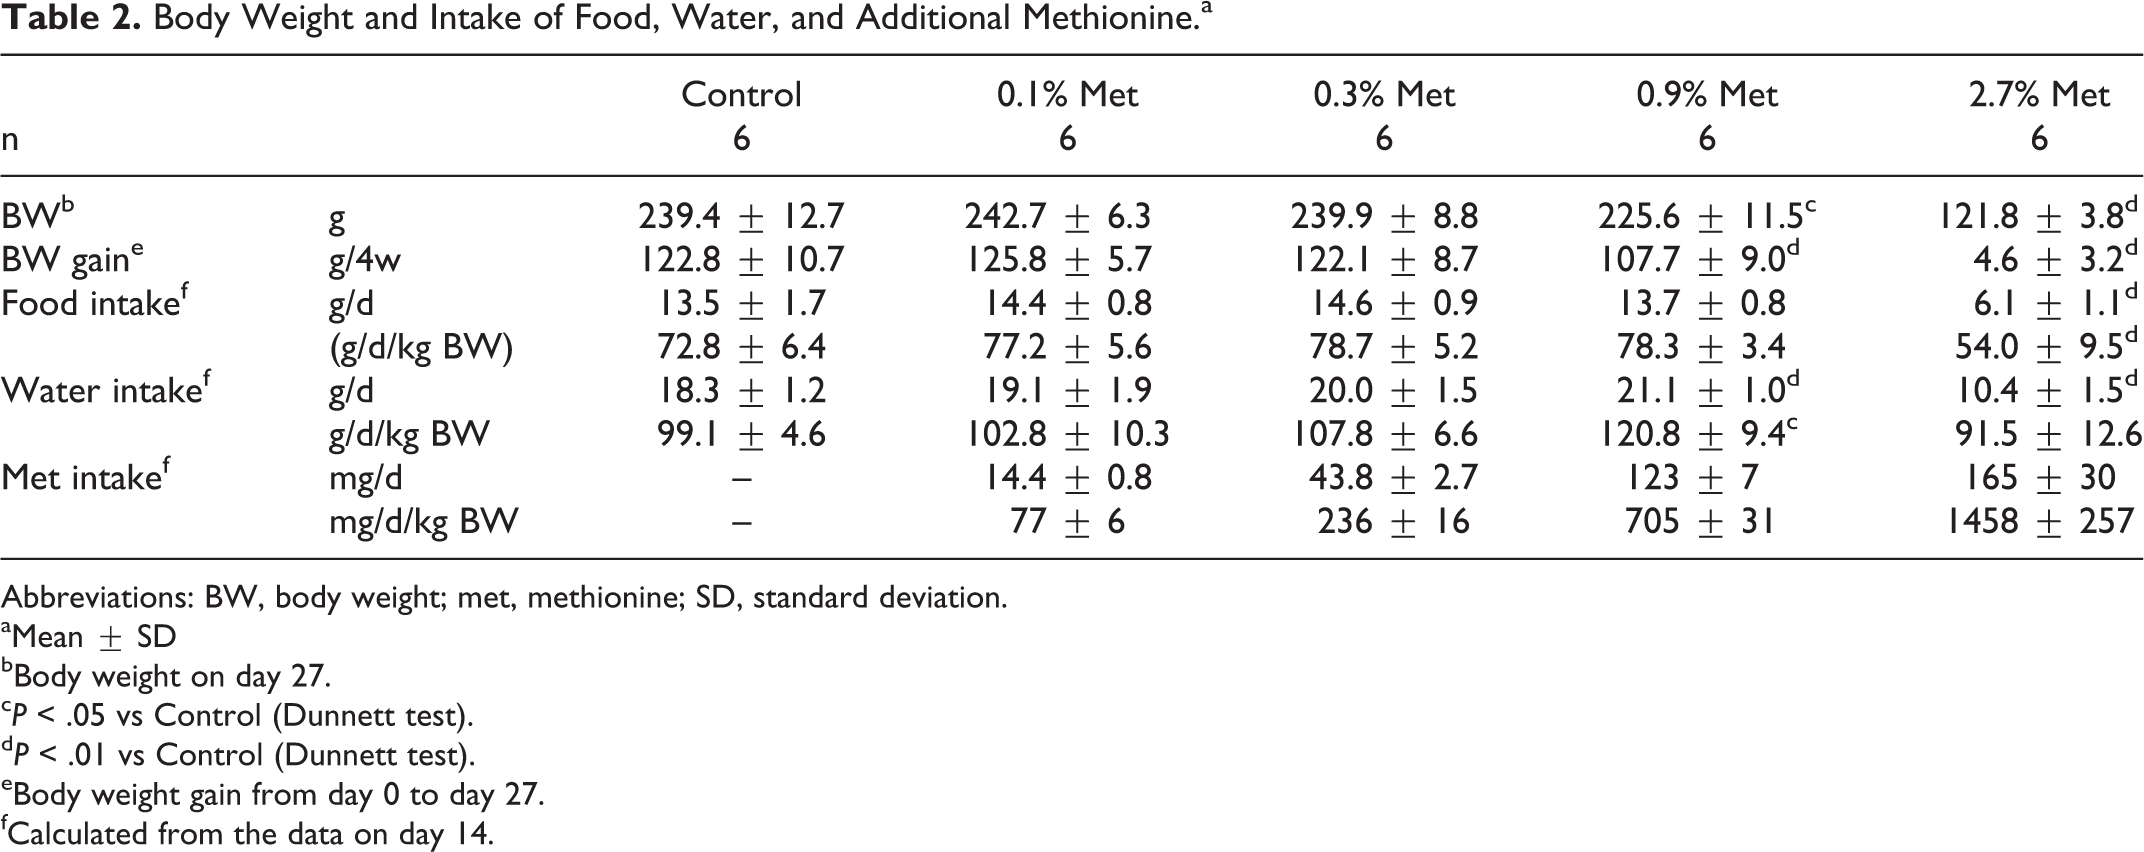
Abbreviations: BW, body weight; met, methionine; SD, standard deviation.
aMean ± SD
bBody weight on day 27.
c P < .05 vs Control (Dunnett test).
d P < .01 vs Control (Dunnett test).
eBody weight gain from day 0 to day 27.
fCalculated from the data on day 14.
Hematology, Plasma Biochemistry and Urinalysis
Red blood cell count, HCT, and HGB content in rats fed 2.7% (w/w) additional methionine were decreased by 15%, 5%, and 10%, respectively, compared to those in the control group (Table 3). In this group, MCV and MCH increased significantly, while MCHC was lower than in control. Reticulocyte count doubled compared to those of control, indicating promotion of erythropoiesis in rats fed 2.7% (w/w) methionine. Although MCH in 0.9% (w/w) methionine group and MCHC in 0.3% (w/w) methionine group were significantly different from those of control, the changes lacked clear dose dependency, and all the other variables related to erythrocytes were comparable to those found in controls.
Hematology and Coagulation Tests.a
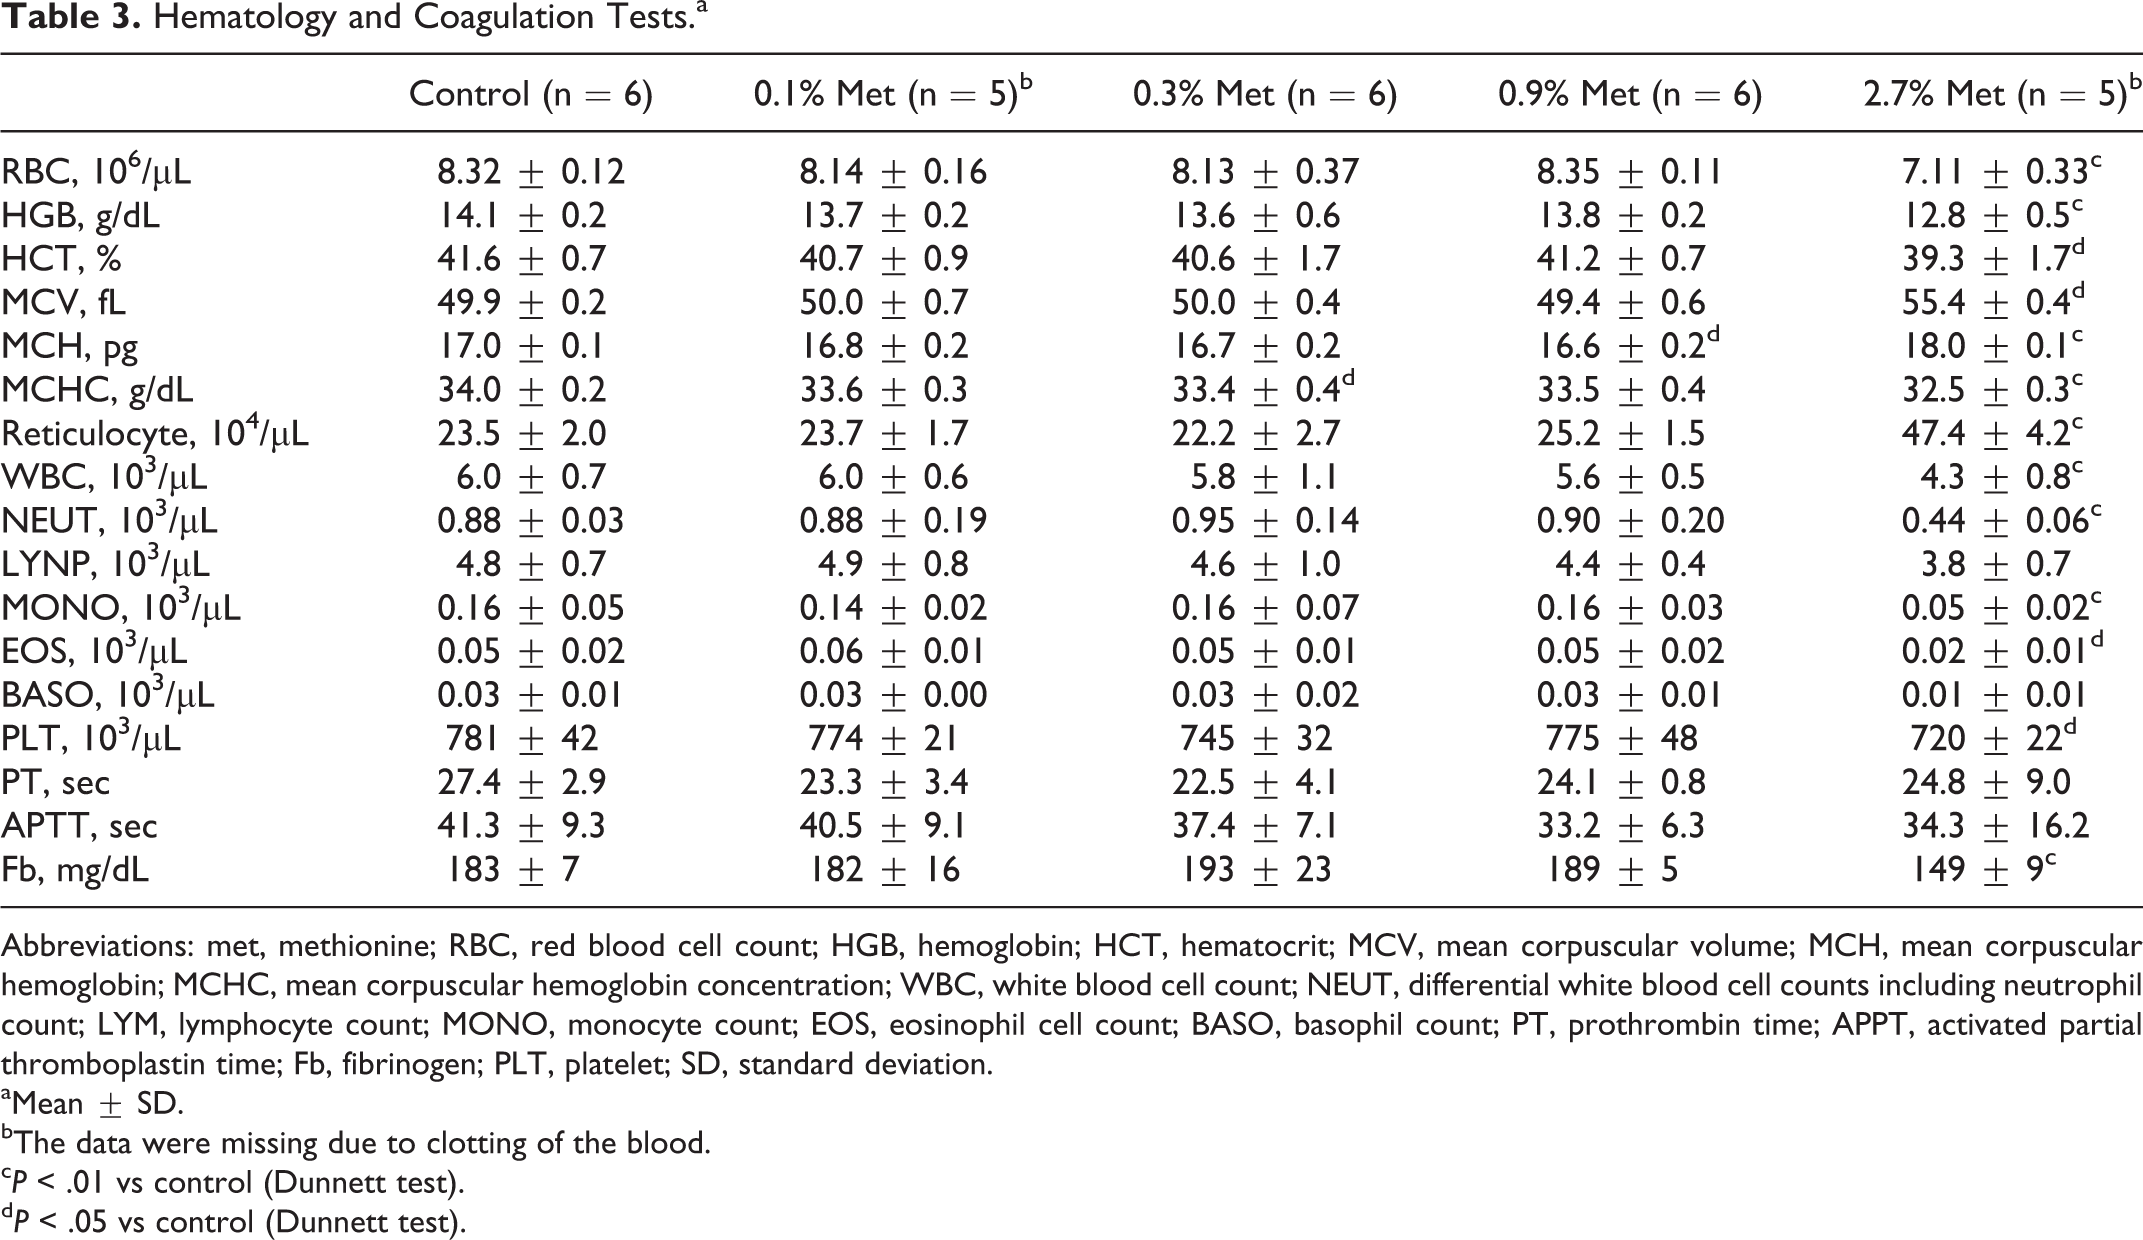
Abbreviations: met, methionine; RBC, red blood cell count; HGB, hemoglobin; HCT, hematocrit; MCV, mean corpuscular volume; MCH, mean corpuscular hemoglobin; MCHC, mean corpuscular hemoglobin concentration; WBC, white blood cell count; NEUT, differential white blood cell counts including neutrophil count; LYM, lymphocyte count; MONO, monocyte count; EOS, eosinophil cell count; BASO, basophil count; PT, prothrombin time; APPT, activated partial thromboplastin time; Fb, fibrinogen; PLT, platelet; SD, standard deviation.
aMean ± SD.
bThe data were missing due to clotting of the blood.
c P < .01 vs control (Dunnett test).
d P < .05 vs control (Dunnett test).
The WBC count also decreased in rats fed 2.7% (w/w) of additional methionine to 70% of control value (Table 3). Especially, NEUT, MONO, and EOS count decreased significantly in this group. Platelet count decreased in rats fed 2.7% (w/w) of additional methionine by 8% (Table 3). Plasma Fb also decreased in this group, although methionine load did not affect either PT or APTT.
Significant decreases in plasma alkaline phosphatase, GLU, TG, CRE, and Ca concentrations were seen in rats fed 2.7% (w/w) of additional methionine, while T-BIL, T-CHO, PL, and BUN concentrations increased in this group (Table 4). Although increase in plasma T-CHO concentration in rats fed 0.9% (w/w) additional methionine was also higher than control, there was no change in other variables.
Clinical Chemistry.a
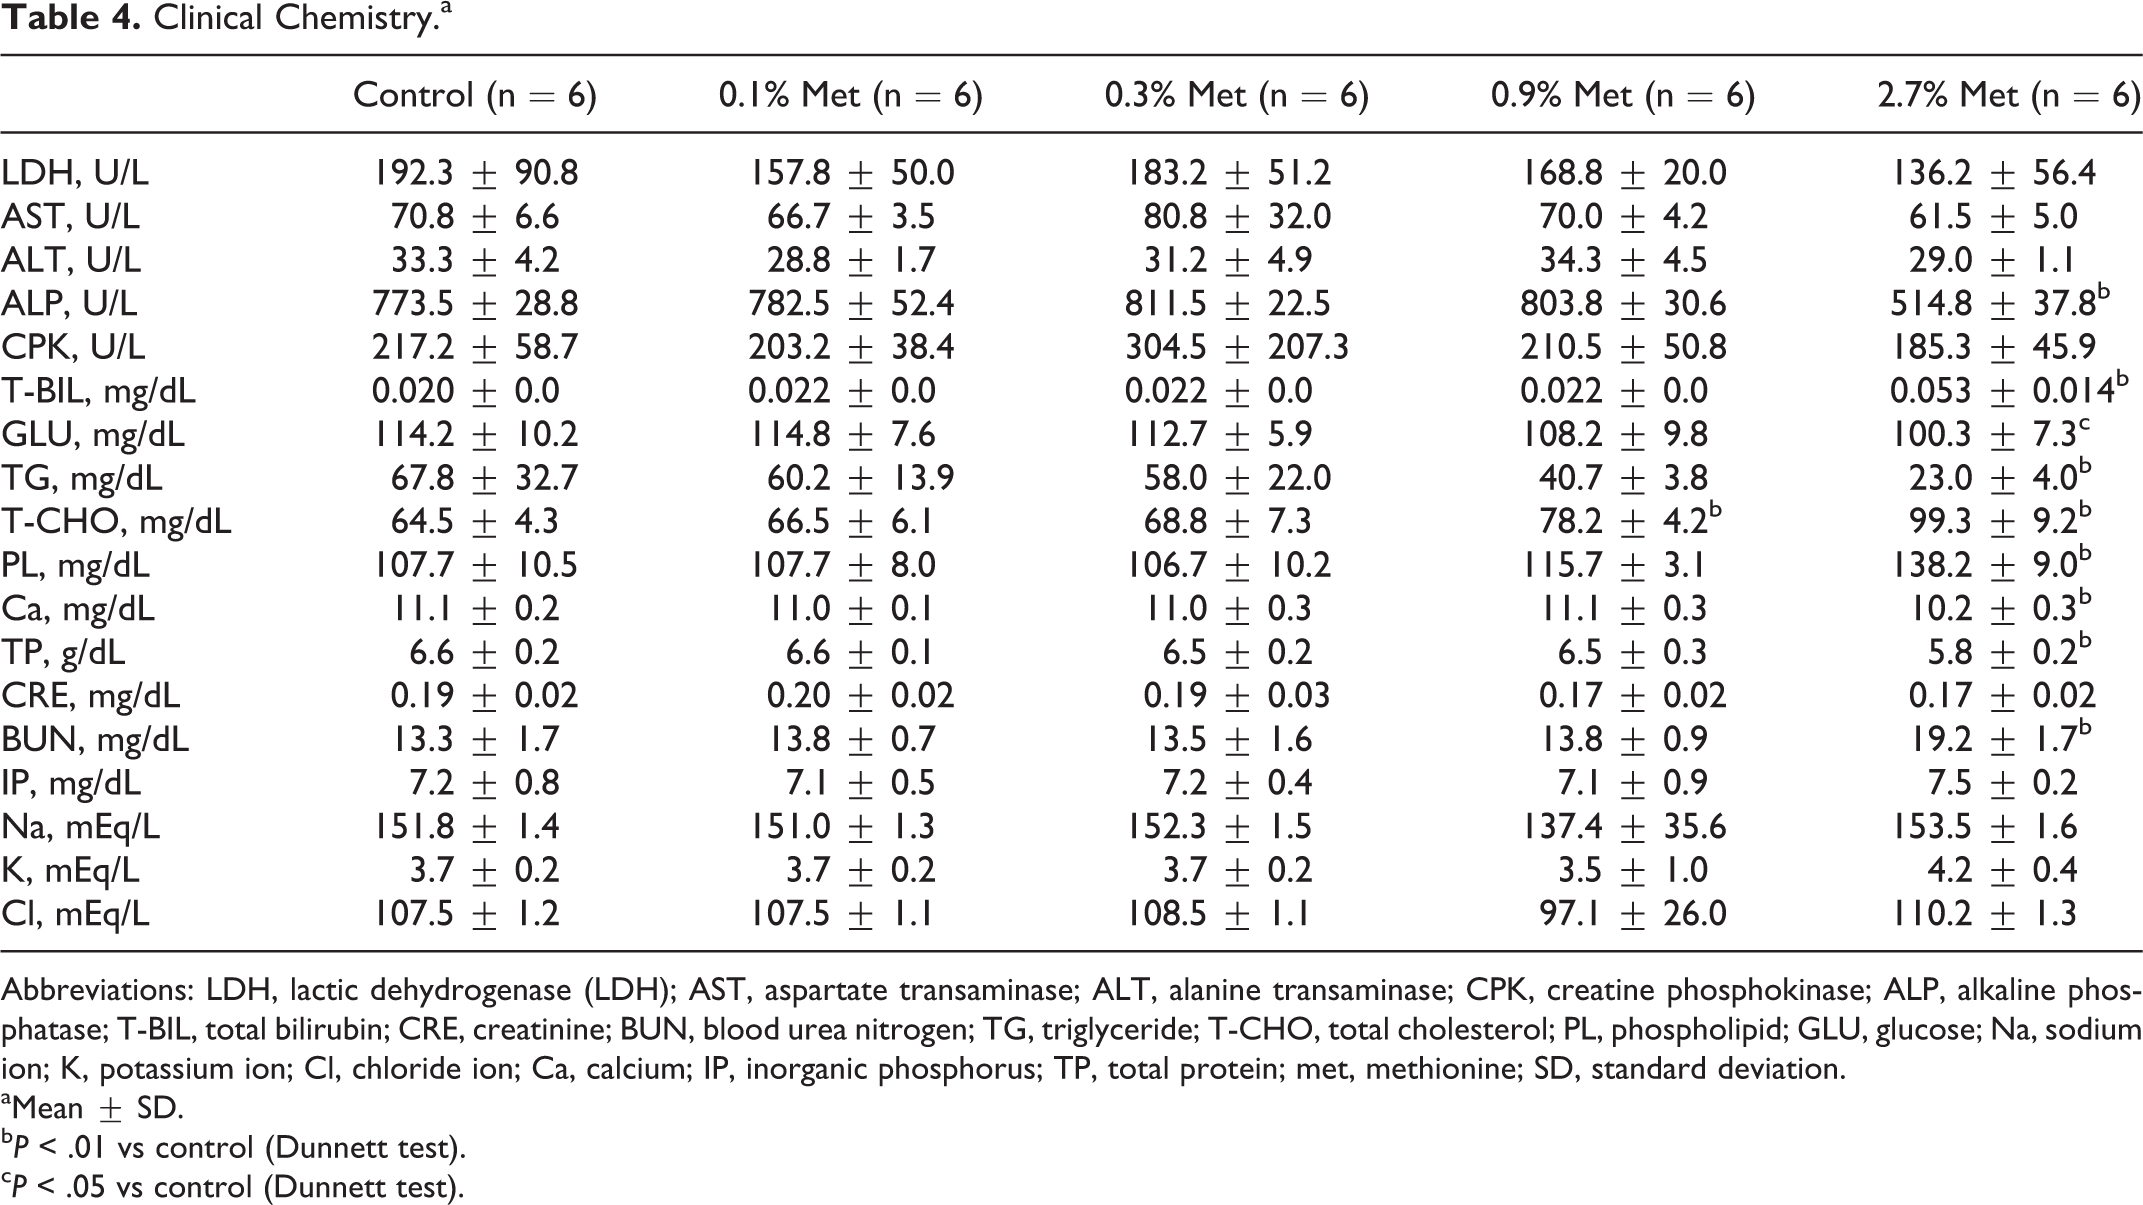
Abbreviations: LDH, lactic dehydrogenase (LDH); AST, aspartate transaminase; ALT, alanine transaminase; CPK, creatine phosphokinase; ALP, alkaline phosphatase; T-BIL, total bilirubin; CRE, creatinine; BUN, blood urea nitrogen; TG, triglyceride; T-CHO, total cholesterol; PL, phospholipid; GLU, glucose; Na, sodium ion; K, potassium ion; Cl, chloride ion; Ca, calcium; IP, inorganic phosphorus; TP, total protein; met, methionine; SD, standard deviation.
aMean ± SD.
b P < .01 vs control (Dunnett test).
c P < .05 vs control (Dunnett test).
Absolute urine volume and its relative value to body weight in the 2.7% (w/w) methionine group was about one-tenth and one-fifth of control value, respectively (Table 5). In contrast, SG in this group was significantly higher than in control. Urine of 4 and 5 animals among 6 rats in this group were positive in bilirubin and urobilinogen, respectively, while all animals in other groups (including control group) were negative in both variables.
Urinalysis.a,b
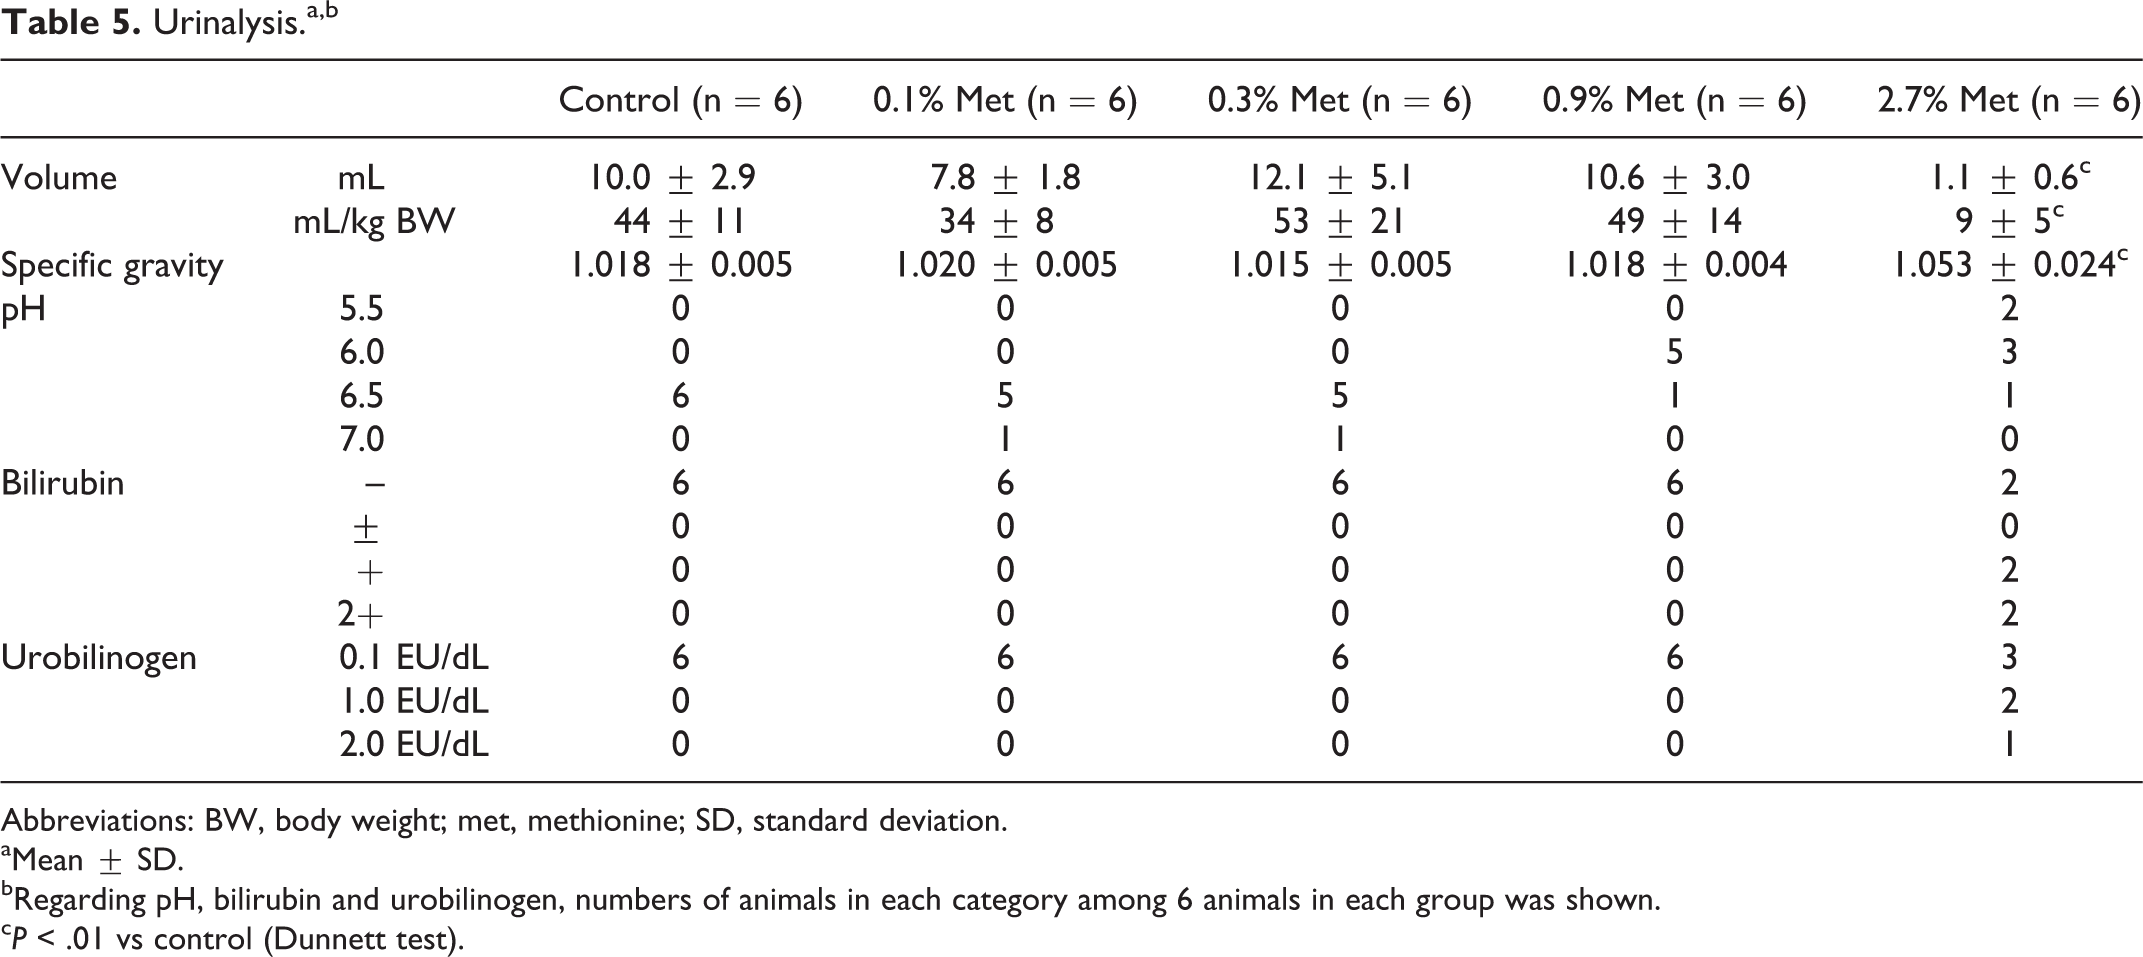
Abbreviations: BW, body weight; met, methionine; SD, standard deviation.
aMean ± SD.
bRegarding pH, bilirubin and urobilinogen, numbers of animals in each category among 6 animals in each group was shown.
c P < .01 vs control (Dunnett test).
Pathology
Feeding of 2.7% (w/w) of additional methionine decreased the weights of the brain, liver, heart, kidney spleen, thymus, testis, submandibular gland, and pituitary gland compared to control values (Table 6). Percentage decrease in thymus weight was greater than body weight in 2.7% (w/w) methionine group, resulting in a decrease in its relative weight. Finally, feeding of 2.7% (w/w) methionine did not change adrenal gland weight but doubled its relative weight compared to control values.
Organ Weight.a
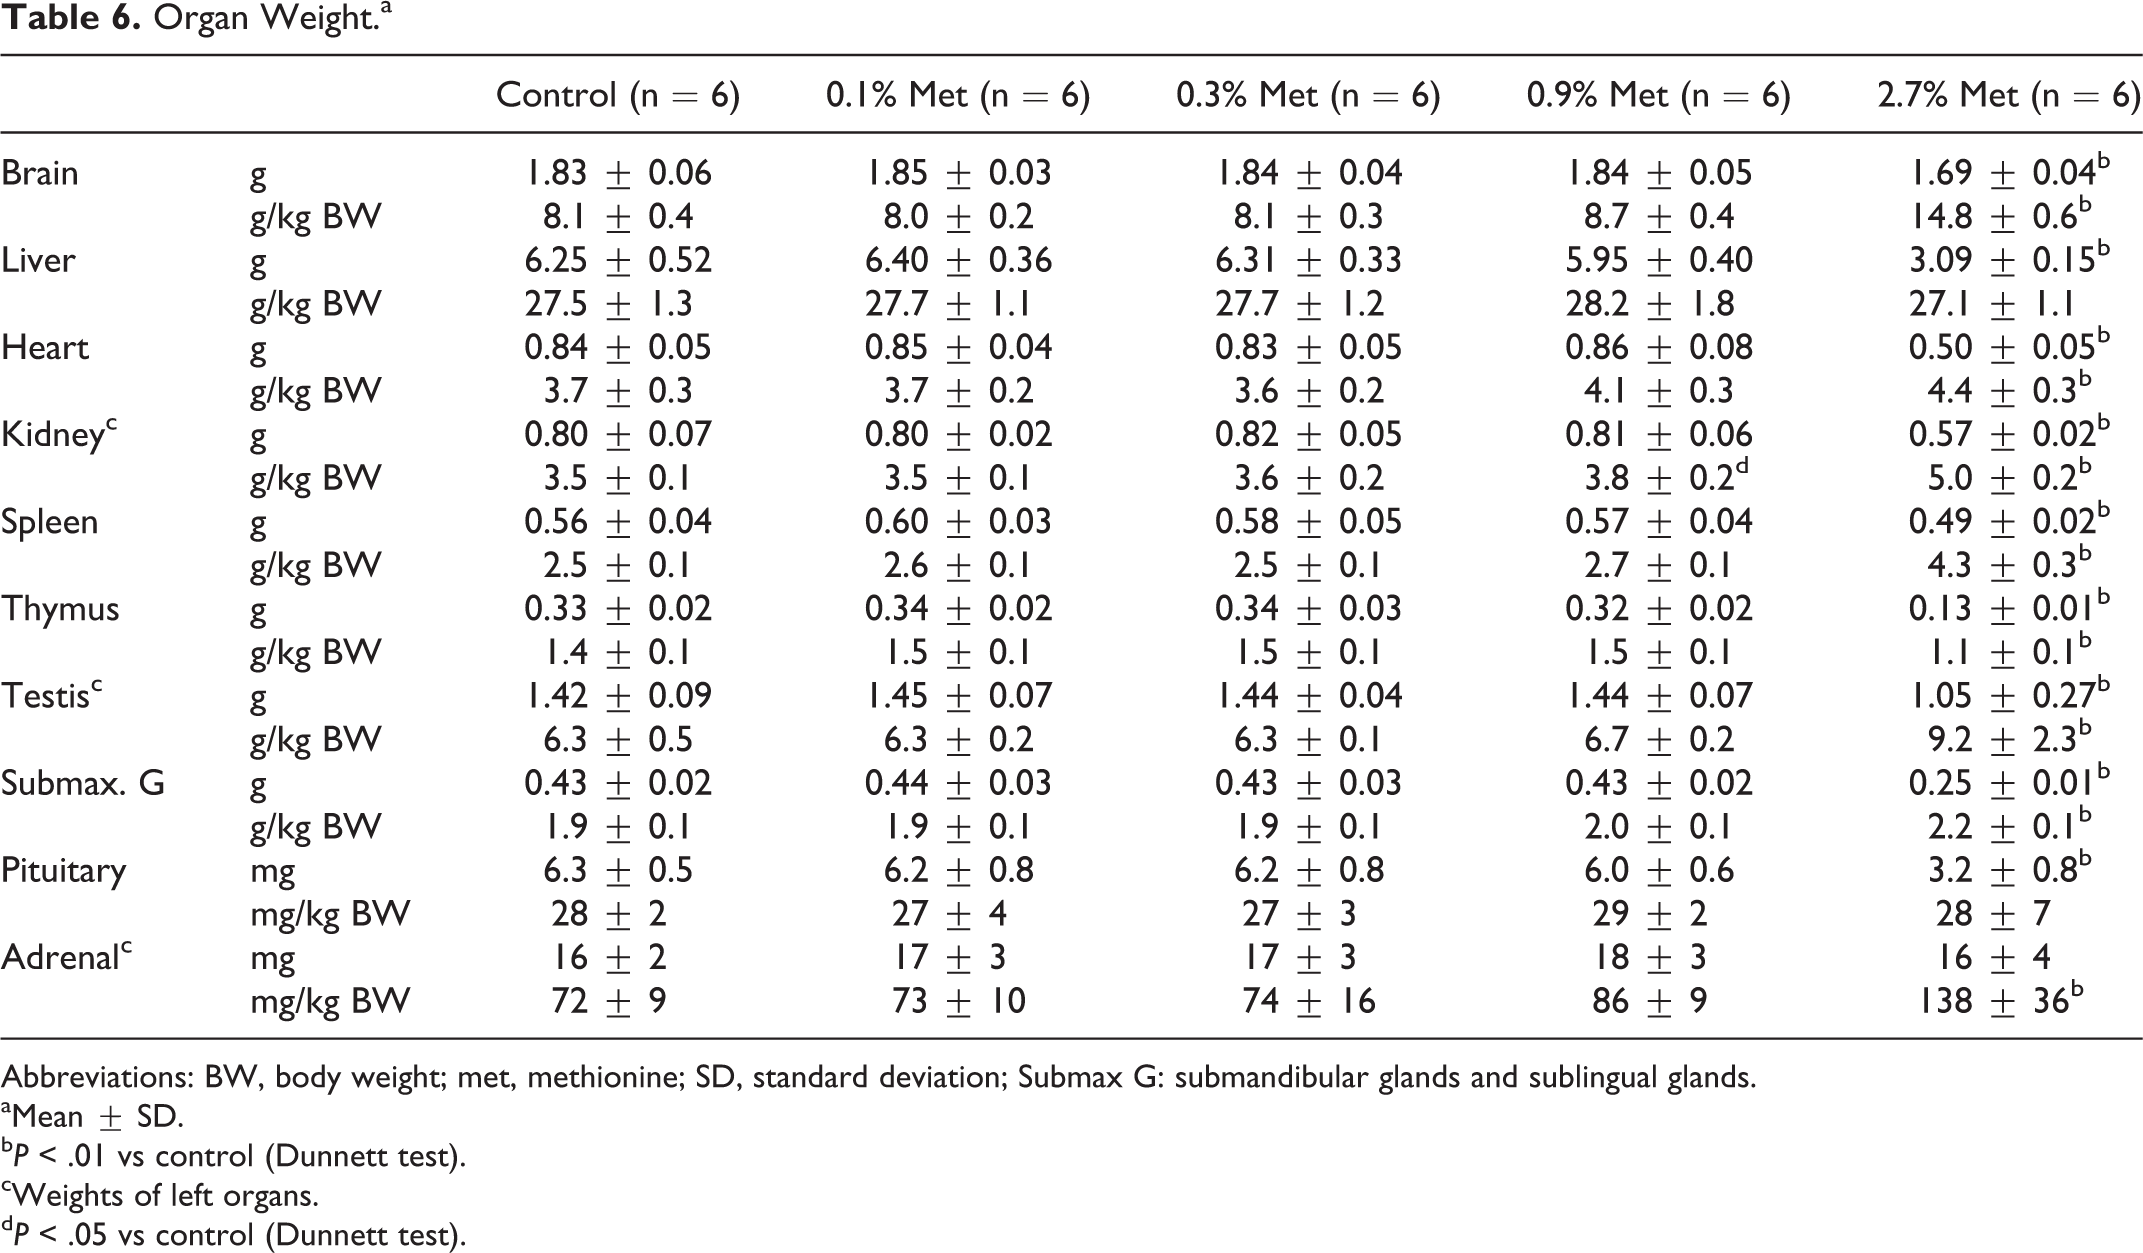
Abbreviations: BW, body weight; met, methionine; SD, standard deviation; Submax G: submandibular glands and sublingual glands.
aMean ± SD.
b P < .01 vs control (Dunnett test).
cWeights of left organs.
d P < .05 vs control (Dunnett test).
Gross observation at the time of exsanguination indicated decreases in both abdominal and subcutaneous fat, thymus atrophy, and darkening of spleens in all rats fed 2.7% (w/w) of additional methionine diet (Table 7). Slight atrophies of accessory reproductive organs, such as coagulating gland and seminal vesicle, were seen in some rats in this group.
Gross Pathological Findings.
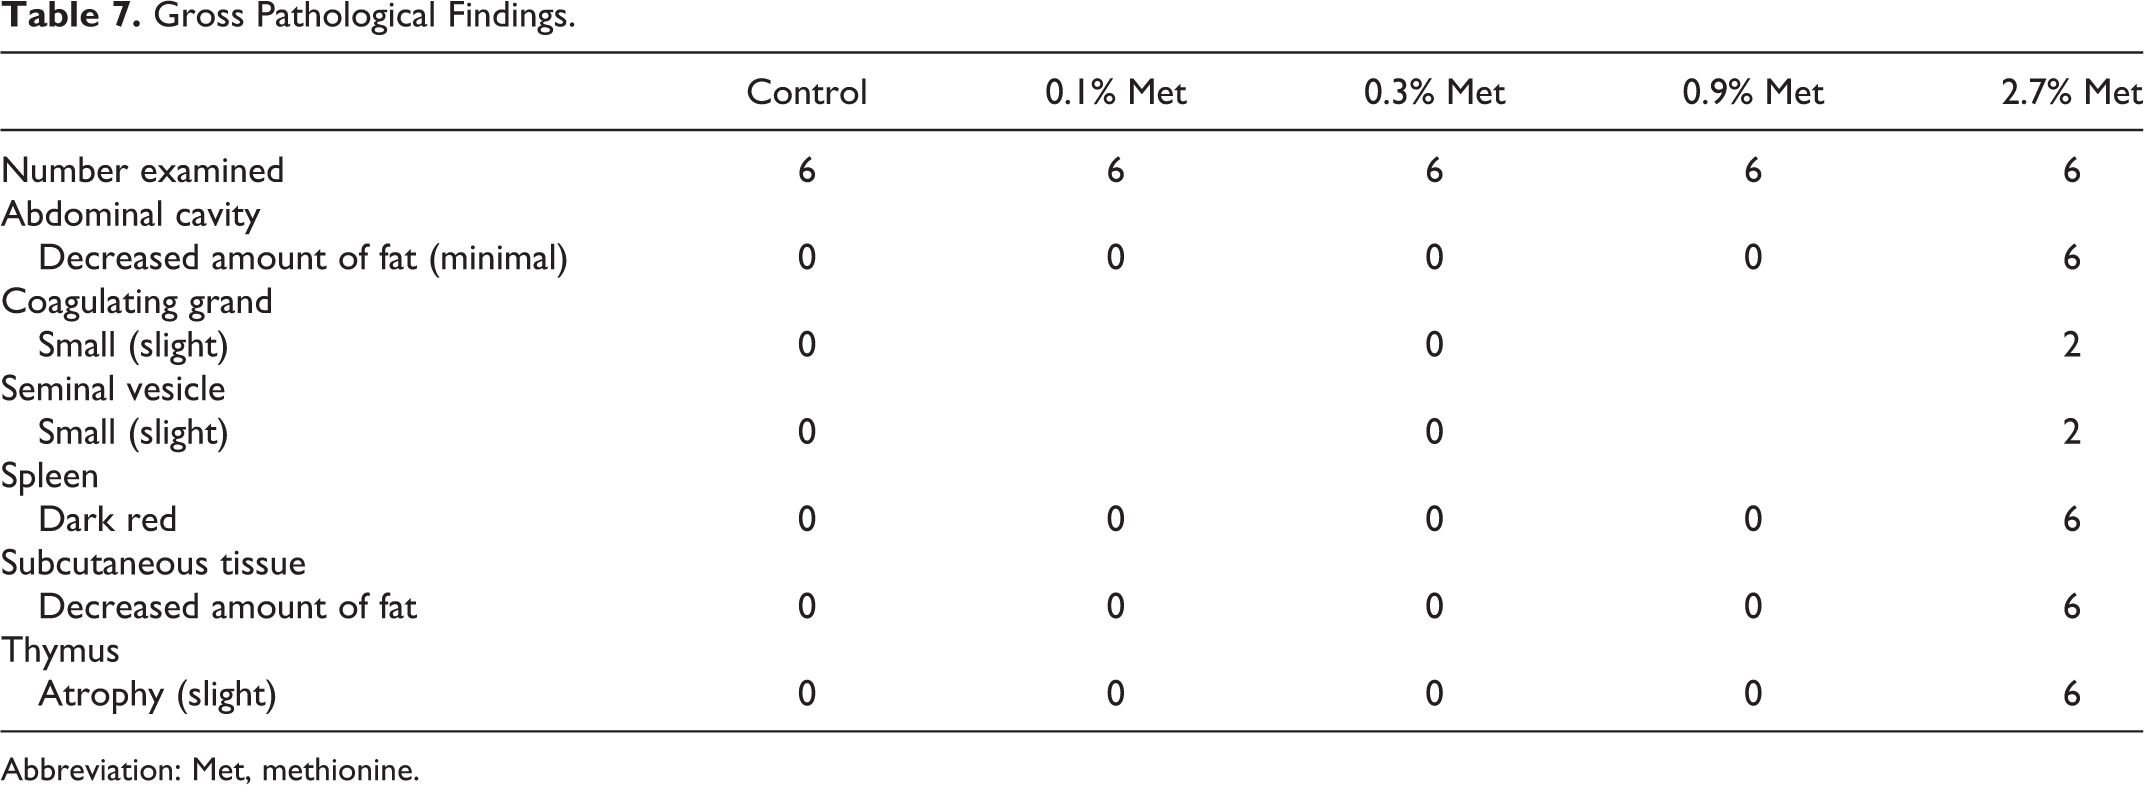
Abbreviation: Met, methionine.
Numerous histological changes were observed in rats fed 2.7% (w/w) methionine diet (Table 8). Typical changes in this group were congestion, hemosiderin deposition, and increase in hematopoiesis in spleen (Figure 1A), which were accompanied with hepatic hemosiderin deposition and decrease in myeloid/erythroid (M/E) ratio in bone marrow (Figure 1B). Other pathological changes were brown pigment deposition in zona reticularis and fatty changes in zona fasciculate of adrenal gland (Figure 1C), increase in single-cell necrosis in pancreas (Figure 1D), and degeneration of spermatocytes in testis (Figure 1F) in 2.7% (w/w) methionine group.
Histopathological Findings.a
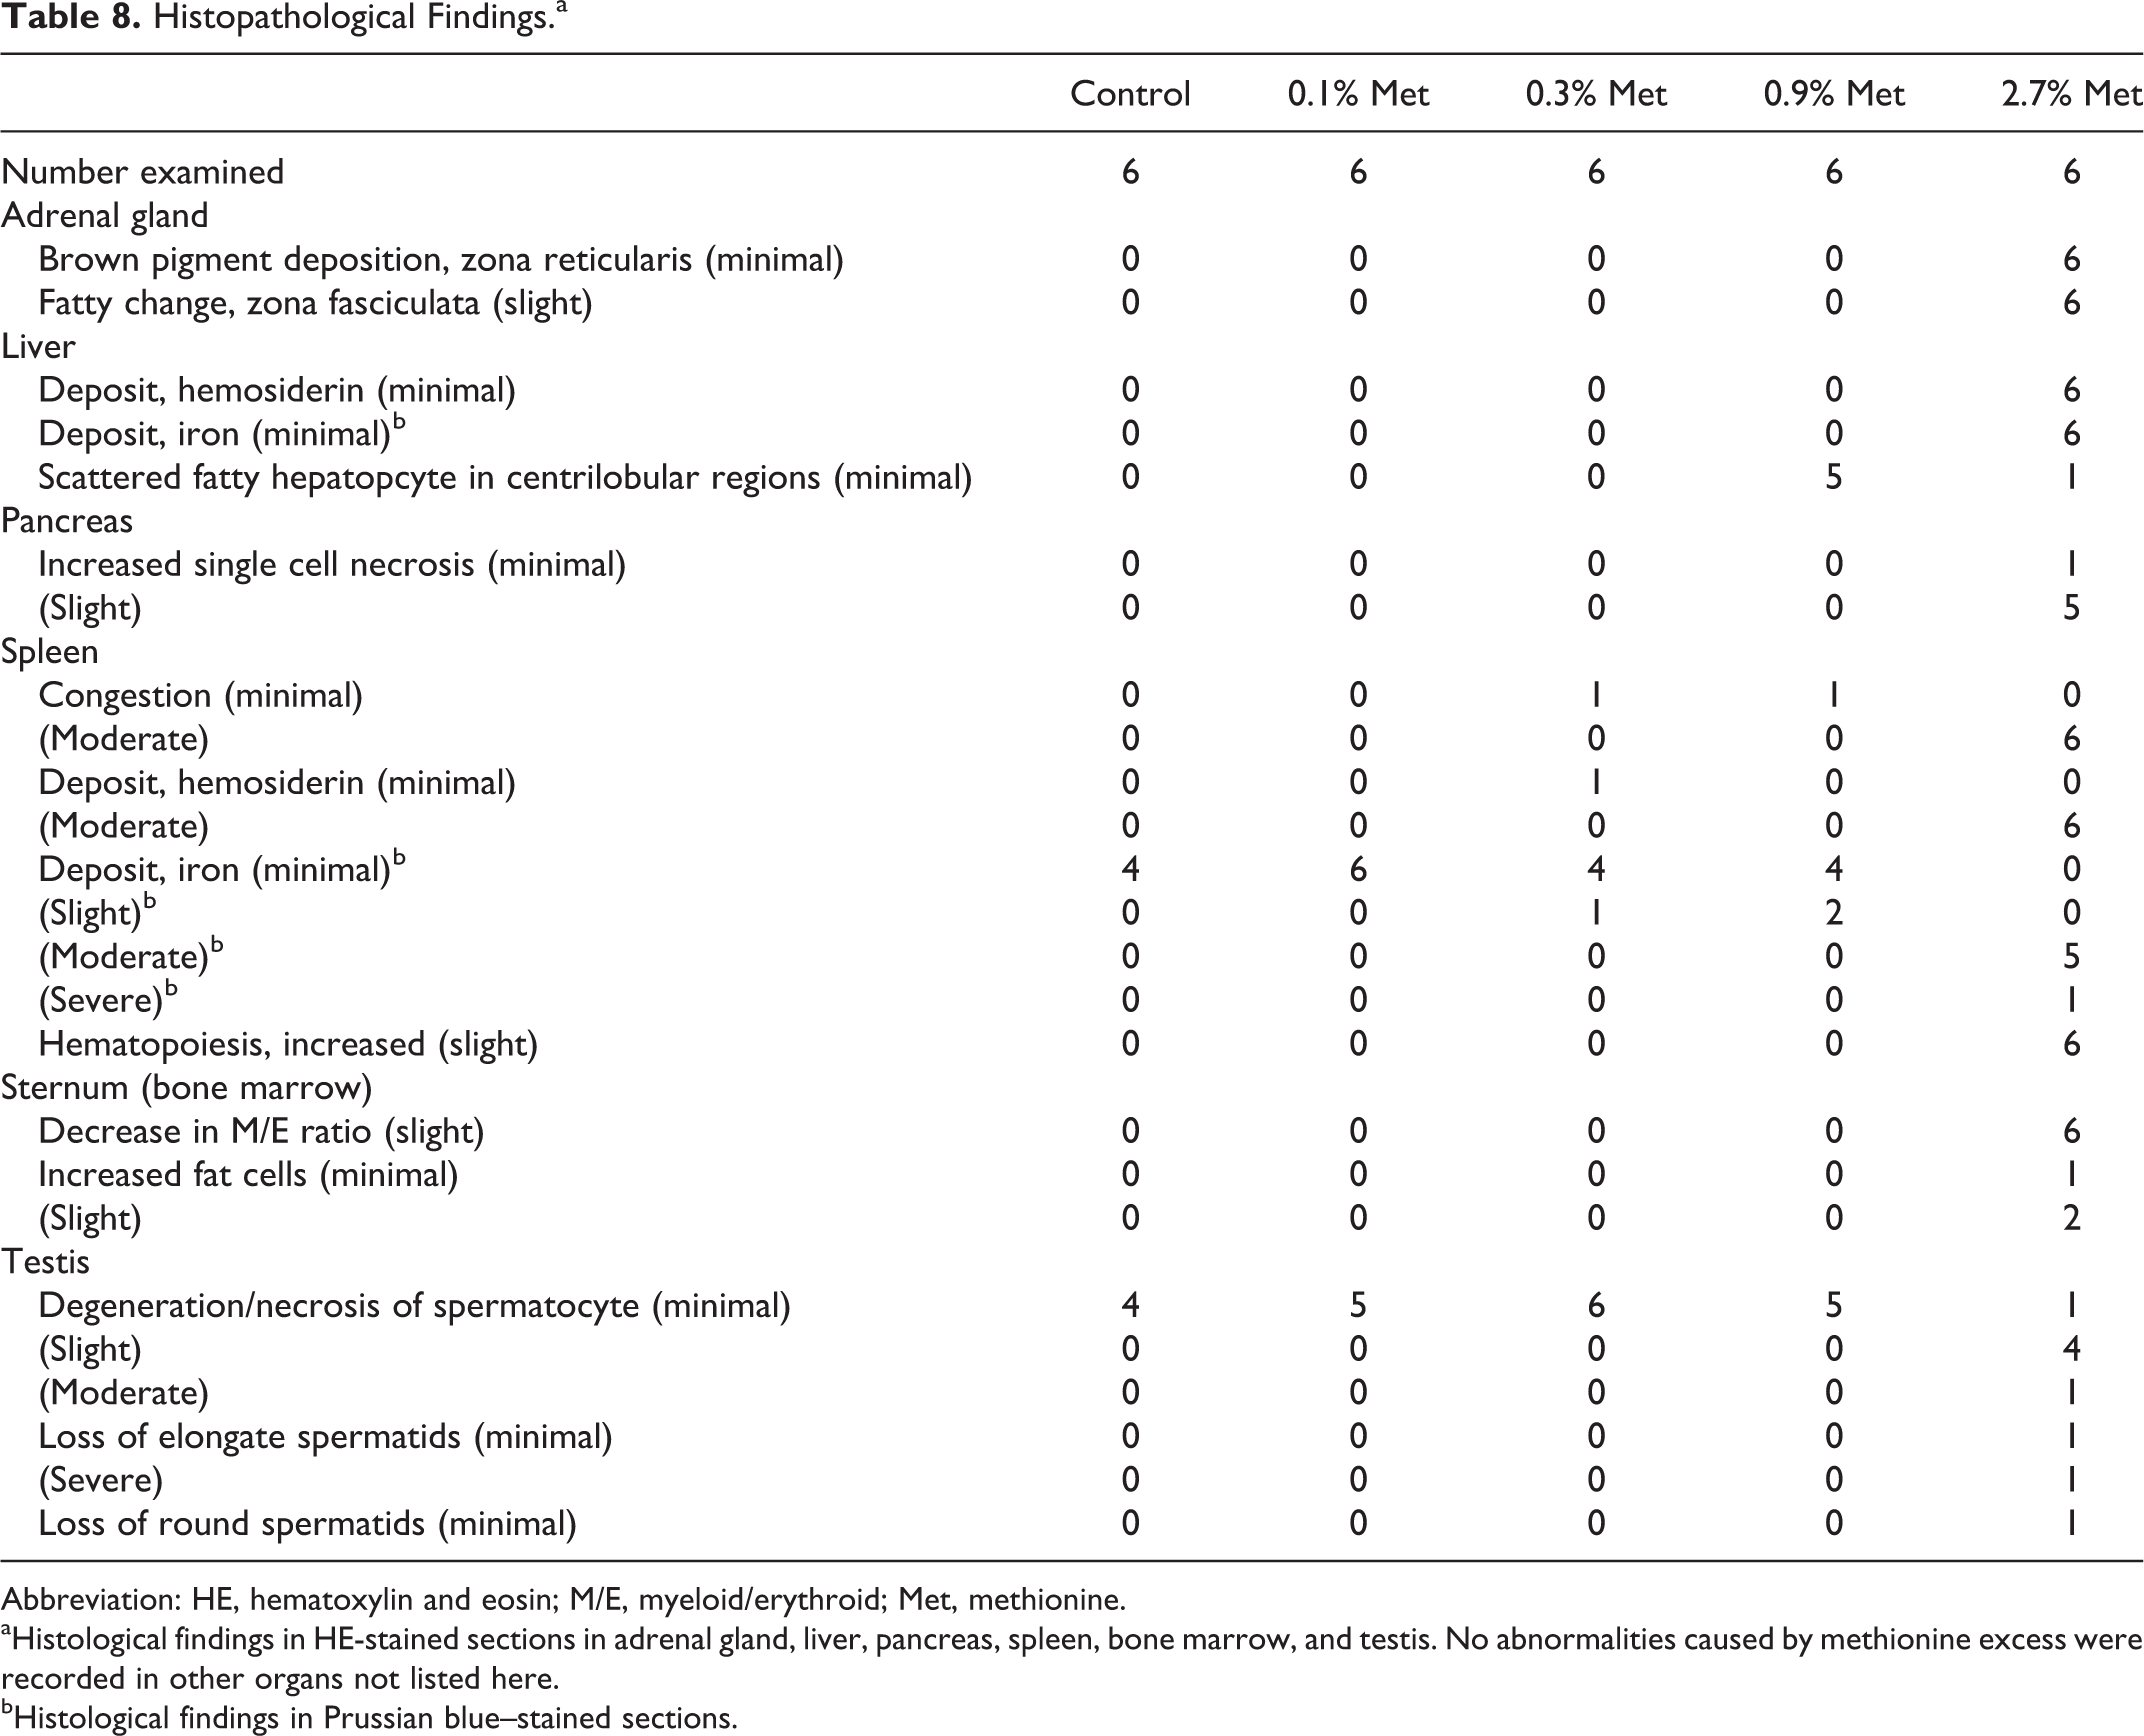
Abbreviation: HE, hematoxylin and eosin; M/E, myeloid/erythroid; Met, methionine.
aHistological findings in HE-stained sections in adrenal gland, liver, pancreas, spleen, bone marrow, and testis. No abnormalities caused by methionine excess were recorded in other organs not listed here.
bHistological findings in Prussian blue–stained sections.
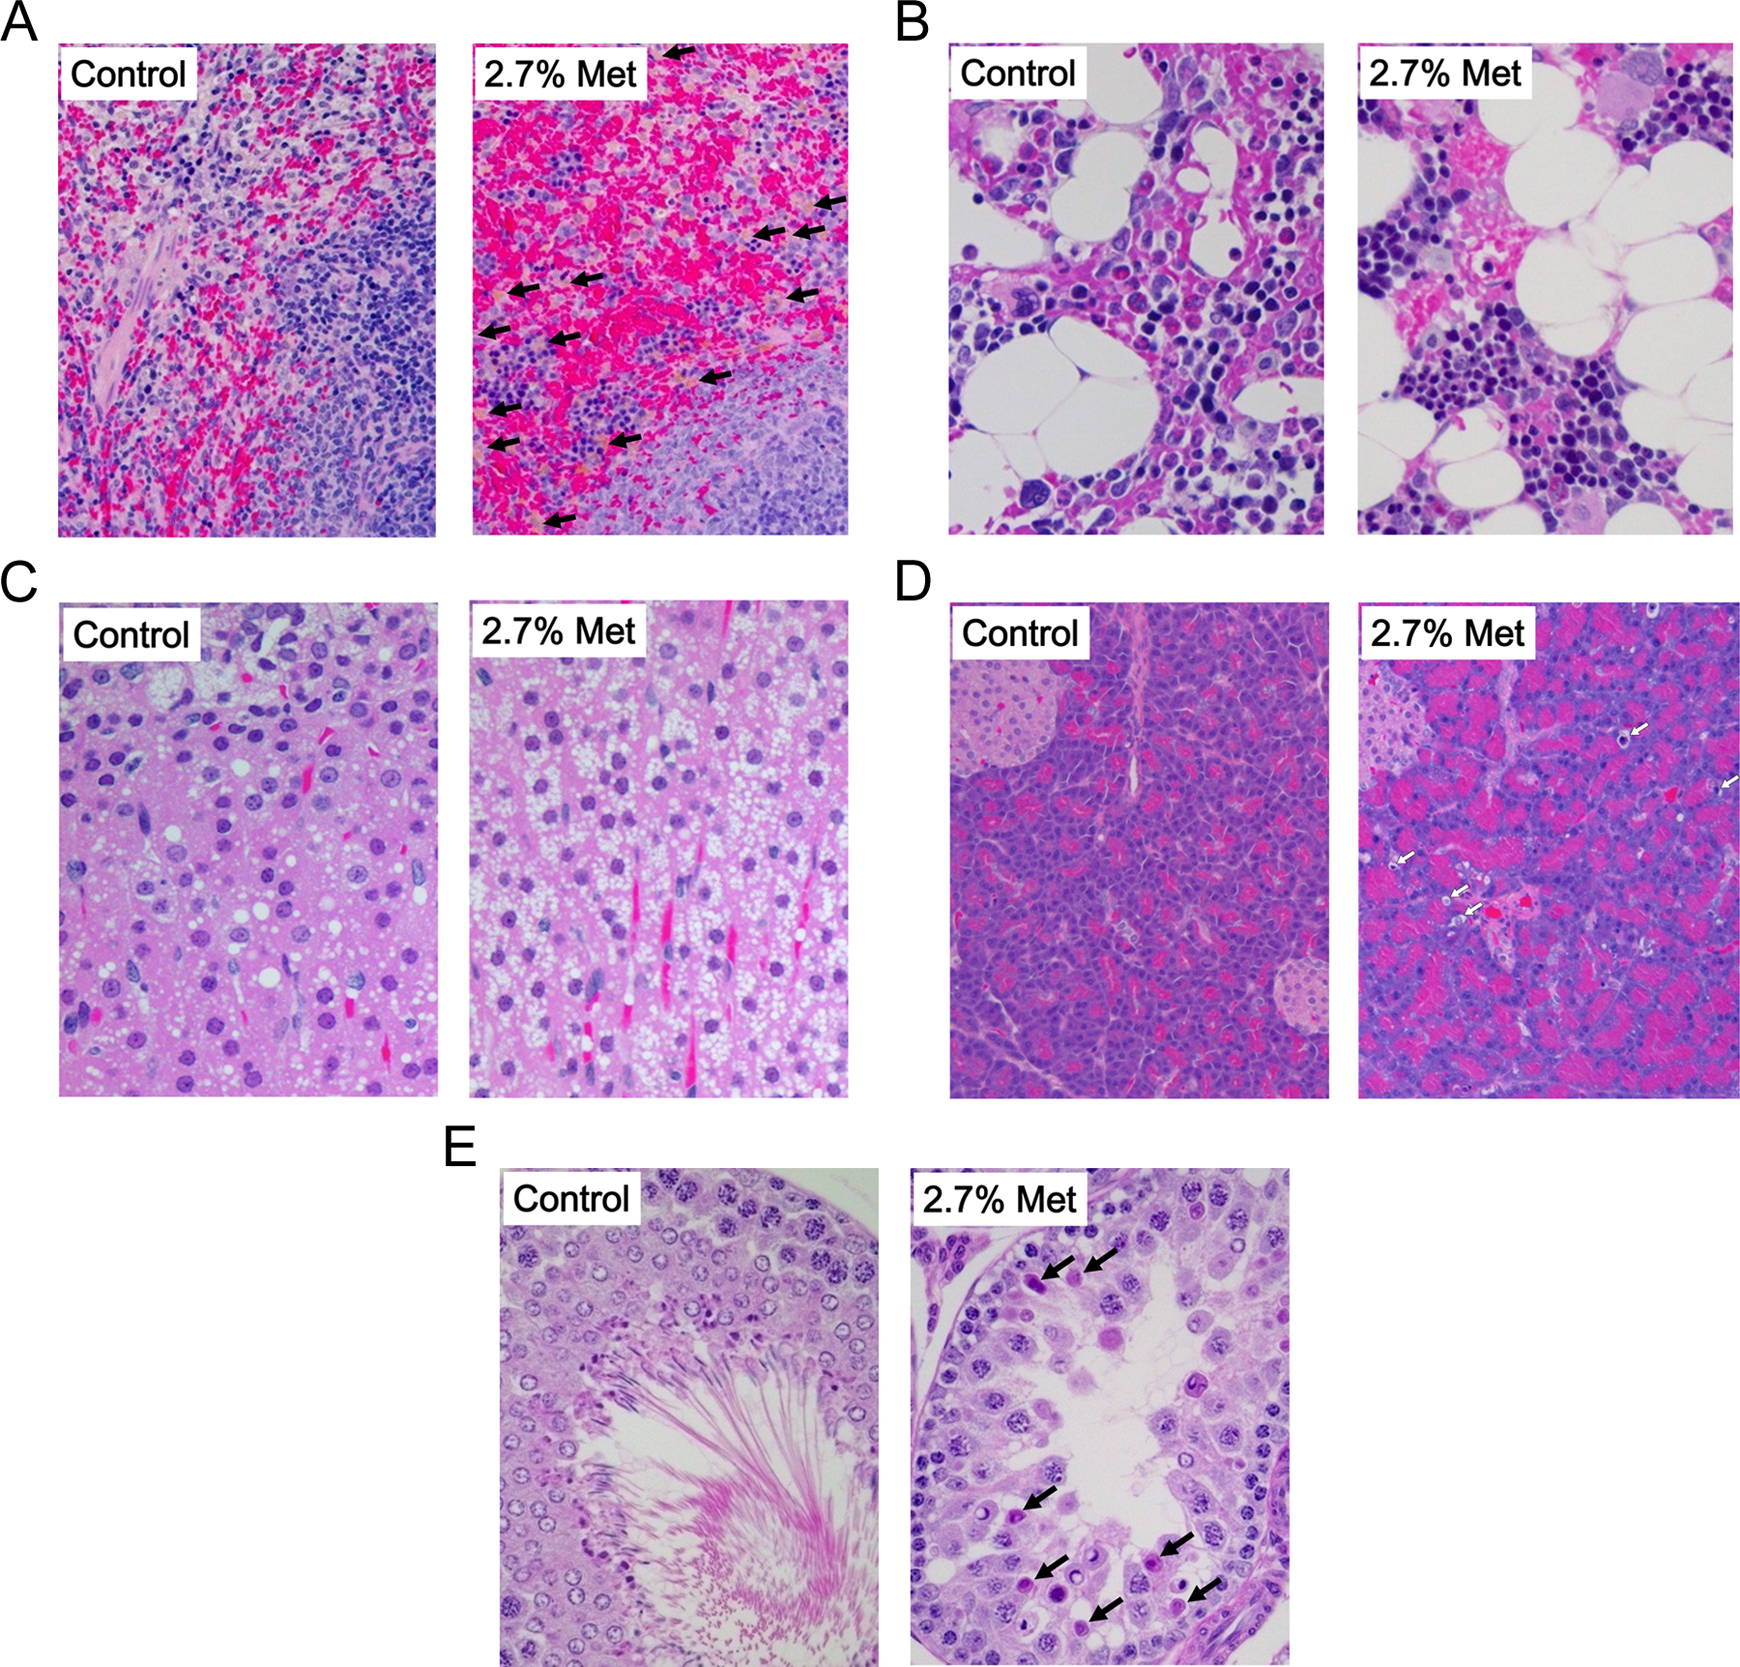
Histological changes. A (spleen), Marked congestion and hemosiderin deposition (black arrows) in 2.7% methionine (Met). B (bone marrow), Decrease in myeloid/erythroid (M/E) ratio and increase in fat cells in 2.7% Met. C (adrenal gland), Increase in lipid droplets in zona fasciculata in 2.7% Met. D (pancreas), Increase in single-cell necrosis (white arrows) in exocrine gland in 2.7% Met. E (testis), Degeneration/necrosis of spermatocyte (black arrows).
Since one of typical toxicities of methionine is hemolytic anemia characterized by increase in splenic and hepatic deposition of hemosiderin, these organs were stained with Prussian blue. Intense splenic iron staining in 2.7% (w/w) methionine group (Figure 2) agreed with the hemosiderin deposition in HE staining (Table 8).
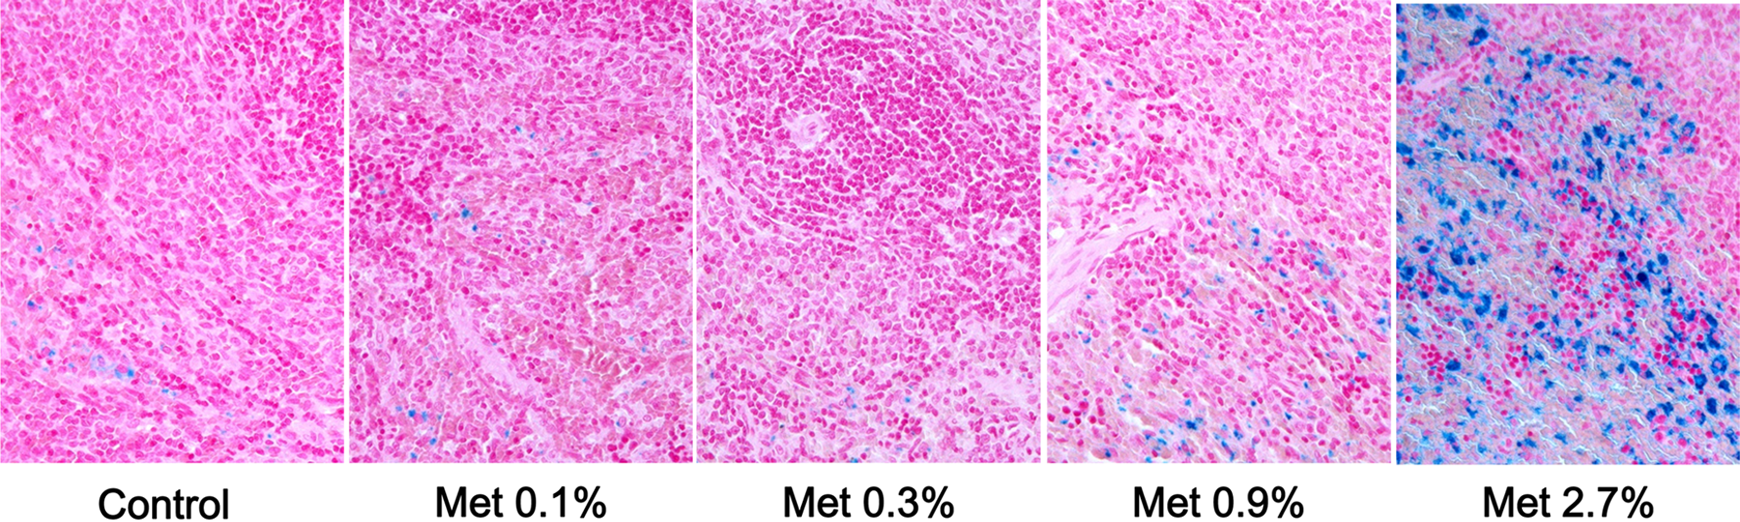
Iron staining of spleen. Splenic sections were stained with Prussian blue for detection of iron. Intense iron staining was evident in all animals supplemented with 2.7% of additional methionine.
Discussion
No deaths or treatment-related effects on clinical signs were seen during this 4-weeklong dietary administration of methionine to growing rats. Feeding of the highest dose of additional methionine (2.7% of diet), however, markedly reduced diet intake, water consumption, and growth.
In addition to these nutritional effects, various changes were observed in postmortem examinations. Contents of RBC count, HCT, and HGB decreased in the highest dose group, accompanied with increases in plasma bilirubin, splenic, and hepatic deposition of hemosiderin. In some of animals, increases in urinary bilirubin and urobilinogen were also evident. These results suggested increase in disruption of erythrocytes, in parallel to previous studies. 5 –7 An increase in reticulocytes number, a decrease in M/E ratio in bone marrow, and occurrence of splenic hematopoiesis indicated promotion of erythropoiesis, presumably due to physiological response to anemia.
Total WBC, NEUT, MONO, and EOS numbers decreased in rats fed on 2.7% (w/w) of additional methionine. These changes were accompanied by a decrease in M/E ratio in bone marrow, atrophy of thymus, and an increase in relative weight of the adrenal glands. All these changes could be attributed to enhancement of adrenocortical hormone production due to nonspecific stress. 8 Histological changes in the adrenal gland were consistent with this hypothesis. 9
In the testis, histological examination indicated an increase in degeneration of spermatocyte and loss of spermatids in some animals fed on the highest dietary level of methionine. Slight atrophy of accessory reproductive organs, such as coagulating gland and seminal vesicle, was also detected in some rats in the 2.7% (w/w) group during gross observation. We hypothesized that both suppression of food intake and stress responses in rats fed on excessive methionine were responsible for the above-described testicular changes, since both malnutrition and stress hormone reportedly affect reproductive functions. 10,11
In addition, significant changes were observed in a number of plasma biochemical parameters, such as GLU, TG, T-CHO, PL, Ca, TP, Fb, alkaline phosphatase, and BUN in rats fed on the highest dietary dose (2.7% w/w) of methionine. Toxicological meaning of those observations is not clear because (A) there were no significant histological changes related to these plasma parameters and (B) no changes in plasma enzyme activities (markers of tissue damage) were found. However, we assumed that the above-mentioned disturbance in plasma biochemistry was a consequence of a nonspecific liver response to the highest dose of methionine and the subsequent dramatic drop in body weight and diet intake. Major plasma proteins such as albumin, α-globulin, and Fb are produced in the liver. Glucose, TG, cholesterol, PL, and urea are also synthesized in the liver, and it is well known that their syntheses are affected by nutritional conditions. Comparably, a decrease in plasma alkaline phosphatase in the highest methionine group probably resulted from a nonspecifically diminished bone formation since severe inhibition of growth tends to be accompanied by compromised skeletal formation. 12
Minor, but significant, growth inhibition was also evident in rats fed 0.9% (w/w) additional methionine, although there was no significant change in food intake. Moreover, increases in water consumption, plasma T-CHO concentration, and tendency to lipid accumulation in the liver were observed. Since there were no hematological changes related to the observed changes, toxicological meanings of these changes would be minimal, if any.
Therefore, LOAEL of diet-added methionine was determined at 0.9% (w/w), corresponding to 705 ± 31 mg/d/kg body weight based on the data on day 14. Also, NOAEL of diet-added methionine was determined at 0.3% (w/w), corresponding to 236 ± 16 mg/d/kg body weight. These results are consistent with a previously published short-term rodent study. 4 The experimental diets used in the present study contained 0.5% (w/w) of methionine in the form of protein (casein). Therefore, LOAEL and NOAEL of total dietary methionine were 1.4% and 0.8% (w/w) diet, corresponding to 1100 ± 73 mg/d/kg body weight and 630 ± 41 mg/d/kg body weight, respectively. It should be noted that these values are close to methionine requirements recommended by National Research Council (0.6% w/w).
In conclusion, the present short-term feeding study characterized toxicity of dietary excess of methionine in rats and determined its NOAEL (0.3% of total diet) and LOAEL (0.9% of total diet). Since previous studies have shown possible effects of dietary excess of methionine on ovarian steroid synthesis, 13 determination of NOAEL and LOAEL in female rats should also be done in future.
Footnotes
Author Contributions
K. Chin contributed to conception and design, contributed to acquisition, analysis, and interpretation, drafted manuscript, critically revised manuscript, gave final approval, and agreed to be accountable for all aspects of work ensuring integrity and accuracy. R. Sakai contributed to conception and design, contributed to interpretation, drafted manuscript, critically revised manuscript, gave final approval, and agreed to be accountable for all aspects of work ensuring integrity and accuracy. S. Toue contributed to conception, contributed to acquisition and analysis critically revised manuscript, gave final approval, and agreed to be accountable for all aspects of work ensuring integrity and accuracy. Y. Kawamata contributed to design, contributed to acquisition, critically revised manuscript, gave final approval and agreed to be accountable for all aspects of work ensuring integrity and accuracy. A. Watanabe contributed to design, contributed to acquisition, critically revised manuscript, gave final approval, and agreed to be accountable for all aspects of work ensuring integrity and accuracy. T. Miwa contributed to conception and design, contributed to analysis and interpretation, drafted manuscript, critically revised manuscript, gave final approval, and agreed to be accountable for all aspects of work ensuring integrity and accuracy. M. Smriga contributed to conception and design, contributed to interpretation, drafted manuscript, critically revised manuscript, gave final approval, agreed to be accountable for all aspects of work ensuring integrity and accuracy.
Declaration of Conflicting Interests
The author(s) declared no potential conflicts of interest with respect to the research, authorship, and/or publication of this article.
Funding
The author(s) received no financial support for the research, authorship, and/or publication of this article.