
Abstract
Using rats fed 22 g/d of a control diet containing 0.005% zinc (Zn) or 2 Zn-excess diets containing 0.05% or 0.2% Zn for 4 weeks, we examined the mechanisms involved in the deterioration of renal function induced by Zn-excess intake. An increase in Zn intake elevated mean blood pressure (BP) and reduced renal blood flow (RBF) and inulin clearance in a dose-dependent manner. This decline in inulin clearance may be derived from a fall in RBF. Administration of the nitric oxide (NO) synthase inhibitor, Nω-nitro-
Introduction
The transition metal, zinc (Zn), is an essential trace element in humans and animals. 1 –3 Nutritional Zn deficiency leads to the disorder of the skin epithelium, the gastrointestinal system, the reproductive system, the neural system, the endocrine system, the ocular system, and the immune system. 1 –3 In recent years, Zn tablets and Zn-supplemented food have been circulating in Japan, the United States, and Europe for the purpose of maintaining good health and promoting health. 3 Moreover, oral Zn therapy has been recently done to treat hypogeusia and decubitus ulcers in adults 3 and hypogonadism and growth retardation from infants to adolescents. 4,5 Nevertheless, Zn toxicity resulting from Zn-excess intake has not been fully understood.
The vasodilatory gas, nitric oxide (NO), is primarily produced by endothelial nitric oxide synthase (NOS) from the terminal guanidino nitrogen of
The endogenous OO− scavenger, copper (Cu)/Zn-superoxide dismutase (SOD), is an enzyme requiring both Cu and Zn for exhibiting the function. 1,3 Ordinarily, the activity of Cu/Zn-SOD is reduced in either a Zn-deficient or a Cu-deficient state, or both. 1 Recently, Cu/Zn-SOD has been reported to have a protective effect on the oxidative stress induced by OO− through the OO− scavenging ability. 3,11 –14 Thus, Cu/Zn-SOD may have a central role in defending the vessel wall against OO−-induced oxidative stress. 15,16
Our previous studies revealed that Zn-excess intake led to an elevation in systemic blood pressure (BP) 17 and a reduction in renal blood flow (RBF) and inulin clearance. 18 The major mechanisms responsible for a rise in systemic BP may have been due to an increase in the action of OO− in the vessel wall and the resultant decrease in the action of the vasodilator, NO, resulting from the formation of ONOO−. 17 The increase in the action of OO− appeared to be attributed to a fall in the activity of Cu/Zn-SOD caused in the vessel wall by Cu deficiency secondary to Zn-excess intake. 17 By now, the mechanisms involved in a decrease in RBF and inulin clearance caused by Zn-excess intake remain unclear, however.
The present study was designed to explore the mechanisms responsible for the deterioration of renal function caused by Zn-excess intake. Thus, we examined basal systolic BP, diastolic BP, RBF, and inulin clearance in rats fed a control diet containing 0.005% Zn or 2 Zn-excess diets containing 0.05% or 0.2% Zn for 4 weeks. Concomitantly, we analyzed mean BP and RBF before and after administration of the NOS inhibitor, Nω-nitro-
Materials and Methods
Chemicals and Reagents
Tempol, thiobutabarbital, inulin, nuclease P1, and a DNA Extractor WB Kit were purchased from Wako Pure Chemicals (Osaka, Japan). Alkaline phosphatase was obtained from Toyobo Co, Ltd (Osaka, Japan). The
Dietary Regimen
Male Sprague-Dawley rats (n = 117) weighing approximately 150 to 170 g were obtained from Clea Japan Inc. (Tokyo, Japan). The rats were not specific pathogen-free animals. Prior to dietary intervention, all rats were preconditioned with a control diet containing 0.005% Zn for 1 week. Following preconditioning, the rats (approximately 180-210 g) were divided at random and in turns into 3 groups and given 22 g/d of a control diet (1.1 mg Zn/d) or 2 Zn-excess diets containing 0.05% Zn (11 mg Zn/d) or 0.2% Zn (44 mg Zn/d) for 4 weeks. The rats were allowed to have free access to double filtered deionized water during the overall experimental period. Consequently, the quantity of Zn ingested for 4 weeks amounted to approximately 31 mg Zn/rat in the control diet group, approximately 308 mg Zn/rat in the 0.05% Zn-excess diet group and approximately 1232 mg Zn/rat in the 0.2% Zn-excess diet group. Dietary compositions such as protein, carbohydrates, fat, minerals, and vitamin mixtures were identical except for Zn content in the 3 diets. 17,19 The food consumption was monitored daily during the dietary conditioning. The quantity of diet ingested was comparable in the 3 groups of rats. Body weight was measured immediately before the start of dietary manipulation (week 0) and monitored at an interval of a week up to the termination of dietary treatment. All animal experiments were performed in accordance with the Animal Experiments Guidelines of the Jikei University School of Medicine and Saitama Medical University.
Blood Collection and Tissue Preparations
Following dietary manipulation, the abdominal cavity of rats was opened under light ether anesthesia. Blood was then collected from the bifurcation of the aorta for the measurements of serum Zn and Cu using an atomic absorption spectrophotometer (Shimadzu, Kyoto, Japan). 17,19 Subsequently to blood collection, the thoracic aorta and kidneys were perfused with phosphate-buffered saline through the bifurcation of aorta 14,17,20 and immediately excised. The surrounding connective tissue was removed from the thoracic aorta and stored at −80°C for the subsequent analysis of Cu/Zn-SOD activity. 14,17 The kidneys were immediately decapsulated and longitudinally sliced into half. A sliced preparation was then fixed at 4°C overnight with 4% paraformaldehyde dissolved in phosphate-buffered saline and mounted in paraffin blocks for the subsequent hematoxylin–eosin (H&E) staining. 19,20 The remainder was stored at −80°C to measure the levels of 8-OHdG. 21
Measurements of Systemic BP and RBF
Following dietary conditioning, rats were intraperitoneally anesthetized with 125 mg/kg of thiobutabarbital and maintained at 37°C on a warmed rodent operating table. PE-50 Polyethylene catheters (Becton Dickson, Spark, Maryland) filled with heparinized saline were then placed around the femoral vein and the abdominal aorta via the femoral artery. Systolic BP, diastolic BP, and mean BP were measured through the placed arterial catheter connected to a Nihon Koden pressure transducer (Tokyo, Japan) according to the method reported previously. 12,14,17,18 Subsequently, the left kidney was exposed via midabdominal incision. The renal artery was then dissected carefully from the renal vein and fitted with a perivascular flow probe (internal diameter 1.0 mm) connected to an ultrasonic flowmeter (PD-20; Crystal Biotech, Northborough, Massachusetts) to measure RBF. 12,18 The pressure transducer and flowmeter were connected to a personal computer with a MacLab System (ADInstruments, Sydney, New South Wales, Australia) for simultaneous recording of BP and RBF. 12,14,17,18 Following surgery, intravenous infusion of saline was performed at 2 mL/h through the placed venous catheter to maintain a euvolemic state. 12,14,17,18 The experimental procedure was as follows.
Experiment 1
Rats subjected to surgery were left on a warmed rodent operating table for approximately 60 minutes until BP levels reached a steady state. Basal systolic BP, diastolic BP, mean BP, and RBF levels were then recorded for 30 minutes. Subsequently, changes in mean BP and RBF levels after suppressing the biosynthesis of the vasodilator, NO, were examined for 30 minutes by injecting 10 mg/kg of the NOS inhibitor,
Experiment 2
Using another group of rats, changes in mean BP and RBF levels after scavenging OO− were explored for 30 minutes following the measurements of basal mean BP and RBF levels by treating with 5 mg/kg/min of the OO− scavenger, tempol, 12,14,17 dissolved in saline through the venous catheter placed.
Analysis of Inulin Clearance
Inulin clearance was evaluated in rats fed a control diet or 2 Zn-excess diets as described previously. 12,18 Rats were anesthetized with 125 mg/kg of thiobutabarbital and placed on a heating pad. Modified PE-10 polyethylene catheters were inserted into the left femoral artery for blood collection and into the left femoral vein for constant infusion (5 μL/min) of inulin dissolved in saline (5 mg/mL). The PE-10 polyethylene catheters were also inserted into the bilateral ureters, exposed via a midabdominal incision, for urinary collection. Rats were left for 4 hours to allow the serum inulin concentration and urinary inulin excretion rate to stabilize. Blood (300 μL) was then collected, and urine was stored for the next hour, followed by the collection of blood again. A commercially available inulin assay kit was used for the measurements of inulin concentrations in the sera and urine (Toyobo). The concentrations of inulin in the sera, obtained before and after urine collection, were measured and averaged for each rat. Inulin clearance was calculated from the average serum concentration of inulin, urinary concentration of inulin, urine volume, and the weight of the kidneys.
Assay of Cu/Zn-SOD Activity
The activity of Cu/Zn-SOD was measured according to the method reported previously. 14,17 The thoracic aorta excised was suspended in ice-cold 25 mmol/L Tris-HCl, pH 7.4, containing 1 mmol/L dithiothreitol, 10 U/mL trazyrol, 1% leupeptin, and 10 mmol/L phenylmethylsulfonyl fluoride. Homogenization was then carried out 3 times for 10 seconds each with sonication. An organic solution of ethanol/chloroform (62.5/37.5, v/v) was added to the homogenates for the extraction of Cu/Zn-SOD (this procedure concomitantly inactivates manganese SOD). The samples were vortexed vigorously and centrifuged at 3000g for 5 minutes at 4°C. The aqueous layer of the samples containing Cu/Zn-SOD was collected for the measurements of Cu/Zn-SOD activity. The activity of Cu/Zn-SOD was determined according to the protocol provided by OXIS Health Products, Inc (Portland, Oregon) by measuring at 525 nm the optical density of a chromophore generated by the SOD-mediated autoxidation of the substrate 5,6,6a,11-tetrahydro-3,9,10-trihydroxybenzo[c]-fluorine. 14,17
Assay of 8-OHdG Content
The extraction of DNA from 100 mg of sliced kidney tissues was conducted according to the protocol provided by Wako Pure Chemicals using a DNA Extractor WB Kit. 21 After DNA extraction, 200 µg of DNA in Tris-EDTA buffer consisting of 10 mmol/L Tris-HCl, pH 8.0 and 1 mmol/L EDTA, pH 8.0 was hydrolyzed by adding both 15 µL of 200 mmol/L sodium acetate, pH 4.8 and 15 µL of nuclease P1 at a concentration of 1 mg/mL. Following incubation at 37°C for 1 hour, 15 µL of 1 mmol/L Tris-HCl, pH 7.4 and 7 µL of alkaline phosphatase at a concentration of 200 unit/0.7 mL were added and further incubated at 37°C for 1 hour. The DNA hydrolysates were processed for deproteinization by ultrafiltration with a Microcon YM-10 filter (Millipore, Massachusetts). 21 The concentrations of 8-OHdG were analyzed by a highly sensitive 8-OHdG Check ELISA kit. 21
Statistical Analysis
Data reported are expressed as means ± standard deviations of the values obtained from 7 to 9 rats. Statistical analysis was based on Duncan multiple range comparison test, 1-way analysis of variance (ANOVA) with Student t-test, or 2-way ANOVA with Student t-test. A value of P < 0.05 was considered statistically significant.
Results
Table 1 presents changes in body weight of rats fed a control diet (n = 9) or 2 Zn-excess diets (n = 9 each) for 4 weeks. Rats fed a control diet gain in weight from 191.1 ± 6.0 to 291.5 ± 17.0 g for 4 weeks. Similarly, rats fed 0.05% and 0.2% Zn-excess diets gain in weight from 196.9 ± 9.0 to 277.6 ± 12.5 g and from 192.1 ± 5.1 to 280.4 ± 10.9 g, respectively, for 4 weeks. The 3 groups of rats showed a progressive gain in body weight for 4 weeks following the initiation of dietary conditioning (P < 0.005; weeks 2-4 vs week 0). No significant differences in body weight during the dietary manipulation were observed among the 3 groups of rats, however.
Body Weight of Rats Fed a Control Diet or 2 Zn-Excess Diets for 4 Weeks.a
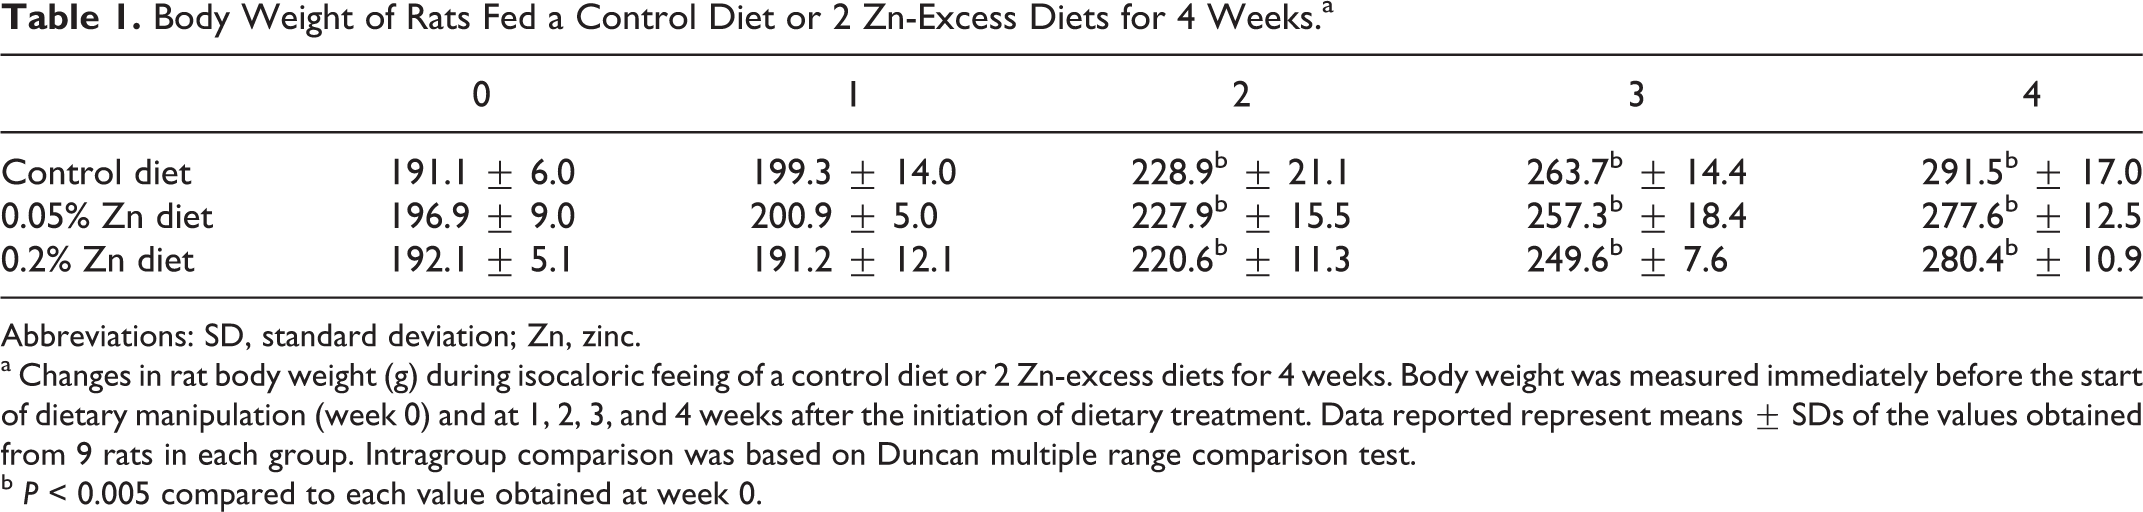
Abbreviations: SD, standard deviation; Zn, zinc.
a Changes in rat body weight (g) during isocaloric feeing of a control diet or 2 Zn-excess diets for 4 weeks. Body weight was measured immediately before the start of dietary manipulation (week 0) and at 1, 2, 3, and 4 weeks after the initiation of dietary treatment. Data reported represent means ± SDs of the values obtained from 9 rats in each group. Intragroup comparison was based on Duncan multiple range comparison test.
b P < 0.005 compared to each value obtained at week 0.
Table 2 shows the levels of serum Zn, Cu, and the Cu/Zn ratio in rats fed a control diet (n = 8) or 2 Zn-excess diets (n = 8 each) for 4 weeks. Levels of serum Zn, serum Cu, and the Cu/Zn ratio were 105.5 ± 6.4 μg/dL, 123.6 ± 7.8 μg/dL, and 1.171 ± 0.095, respectively, in rats fed a control diet. Similarly, levels of serum Zn, serum Cu, and the Cu/Zn ratio were 133.2 ± 11.7 μg/dL, 98.1 ± 7.1 μg/dL, and 0.736 ± 0.056, respectively, in rats fed a 0.05% Zn-excess diet and 286.3 ± 25.3 μg/dL, 14.4 ± 1.07 μg/dL, and 0.050 ± 0.003, respectively, in rats fed a 0.2% Zn-excess diet. Rats fed 0.05% and 0.2% Zn-excess diets had significantly increased concentrations of serum Zn by 1.3 and 2.7 times, respectively, relative to rats fed a control diet (P < 0.005). Inversely, rats fed 0.05% and 0.2% Zn-excess diets exhibited markedly decreased concentrations of serum Cu by 21% and 88%, respectively, when compared to rats fed a control diet (P < 0.005). Consequently, the Cu/Zn ratio was profoundly lower by 37% and 96% in rats fed 0.05% and 0.2% Zn-excess diets, respectively, than in rats fed a control diet (P < 0.005).
Levels of Serum Zn and Cu and the Cu/Zn Ratio in Rats Fed a Control Diet or 2 Zn-Excess Diet for 4 Weeks.a
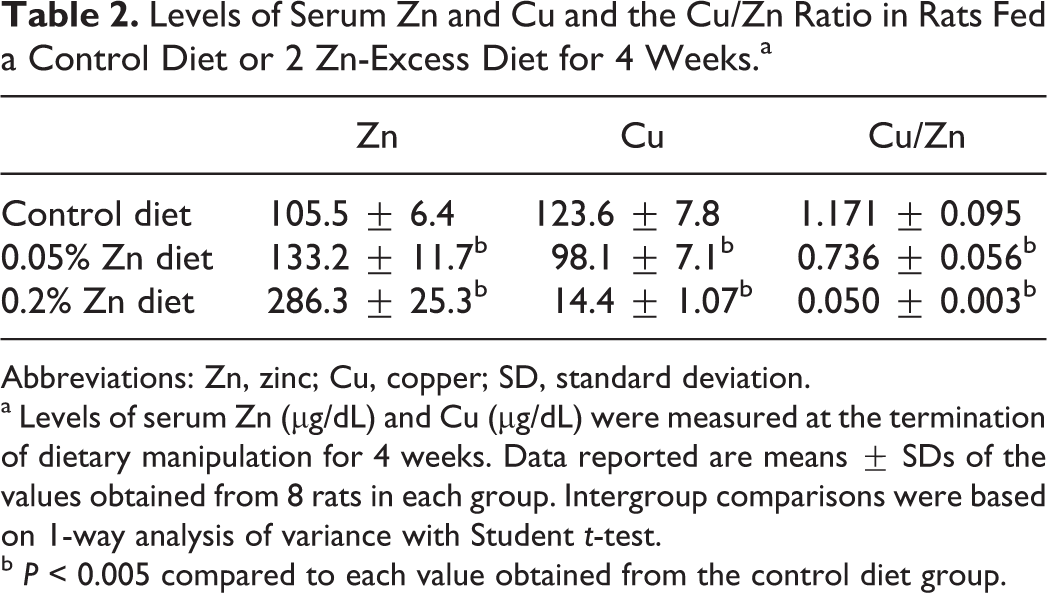
Abbreviations: Zn, zinc; Cu, copper; SD, standard deviation.
a Levels of serum Zn (μg/dL) and Cu (μg/dL) were measured at the termination of dietary manipulation for 4 weeks. Data reported are means ± SDs of the values obtained from 8 rats in each group. Intergroup comparisons were based on 1-way analysis of variance with Student t-test.
b P < 0.005 compared to each value obtained from the control diet group.
Figure 1 shows basal BP (A) and renal function (B) levels obtained from rats fed a control diet (n = 7) or 2 Zn-excess diets (n = 7 each) for 4 weeks. An increase in Zn intake augmented basal systolic BP, diastolic BP, and mean BP levels (P < 0.05) and decreased basal RBF and inulin clearance levels (P < 0.01) in a dose-dependent manner.
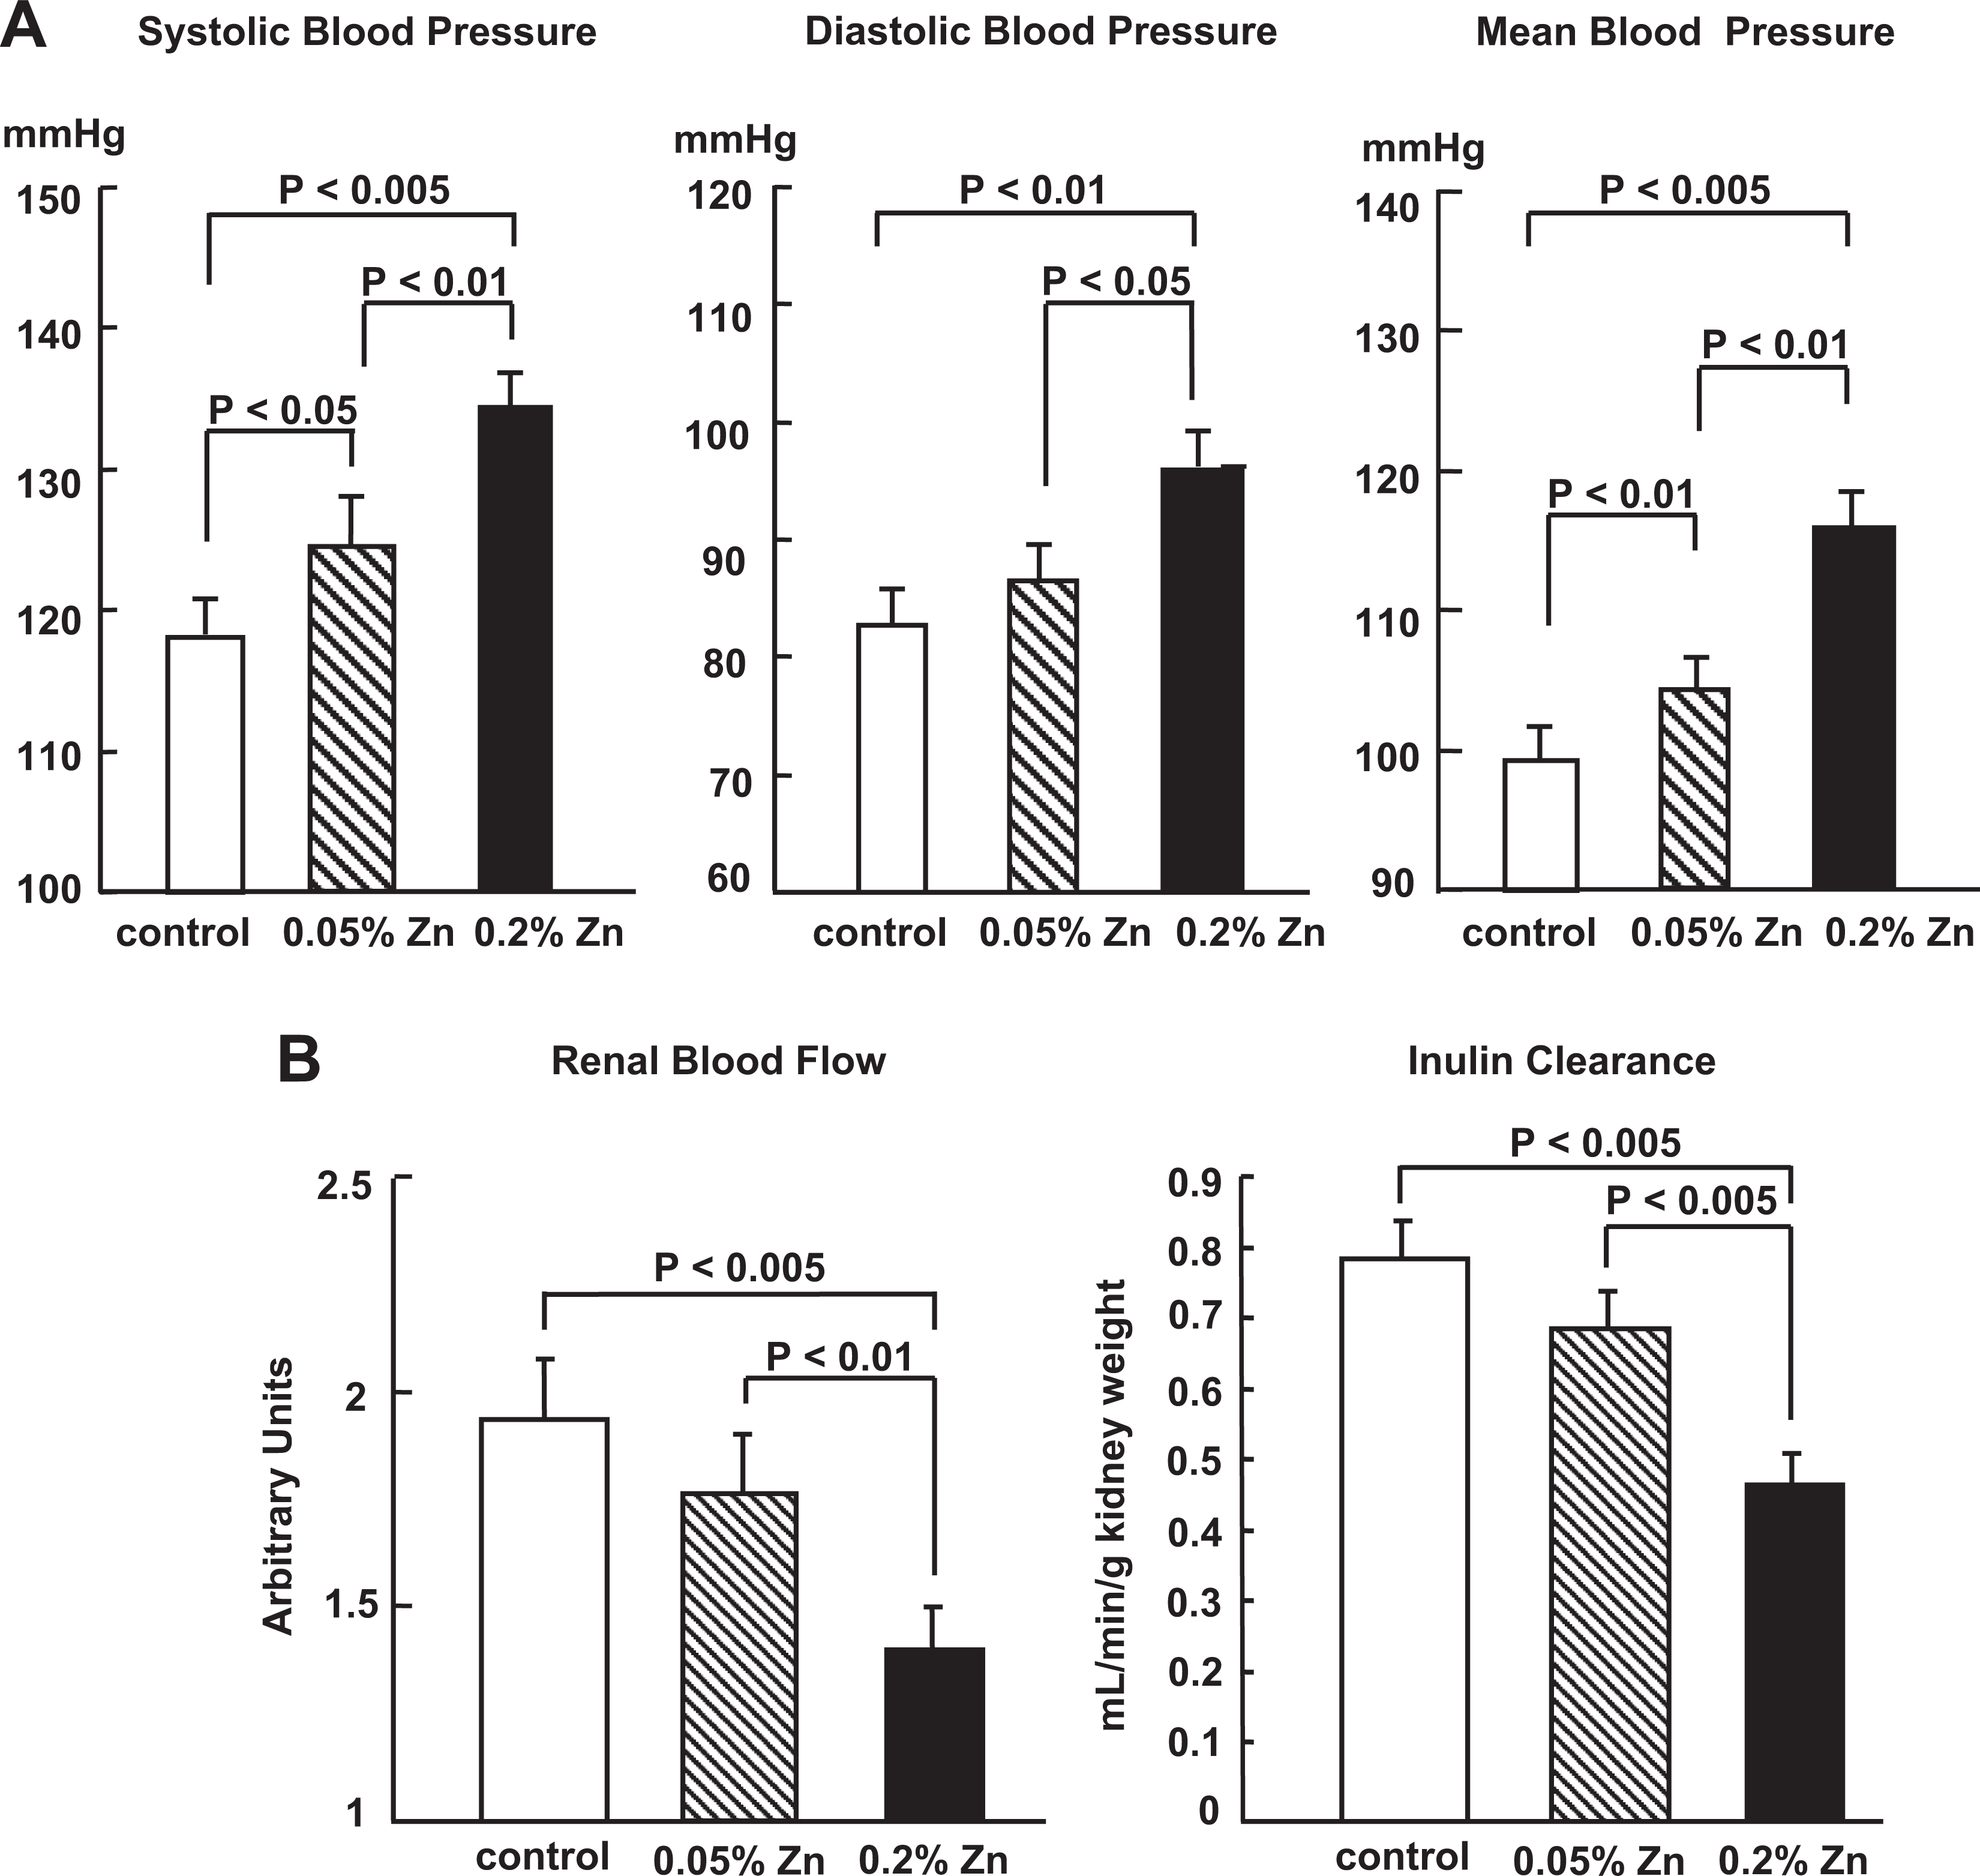
Basal blood pressure (mm Hg) levels (A) and basal renal blood flow (arbitrary units) and inulin clearance (mL/min/g kidney weight) levels (B) observed in rats fed a control diet or 2 Zn-excess diets for 4 weeks. Blood pressure, renal blood flow, and inulin clearance were measured at 4 weeks after the start of dietary treatment. Data reported represent means ± standard deviations (SDs) of the values obtained from 7 rats in each group. Statistical analysis was based on 1-way analysis of variance with Student t-test.
Figure 2 exhibits the effects of the NOS inhibitor,
Effects of
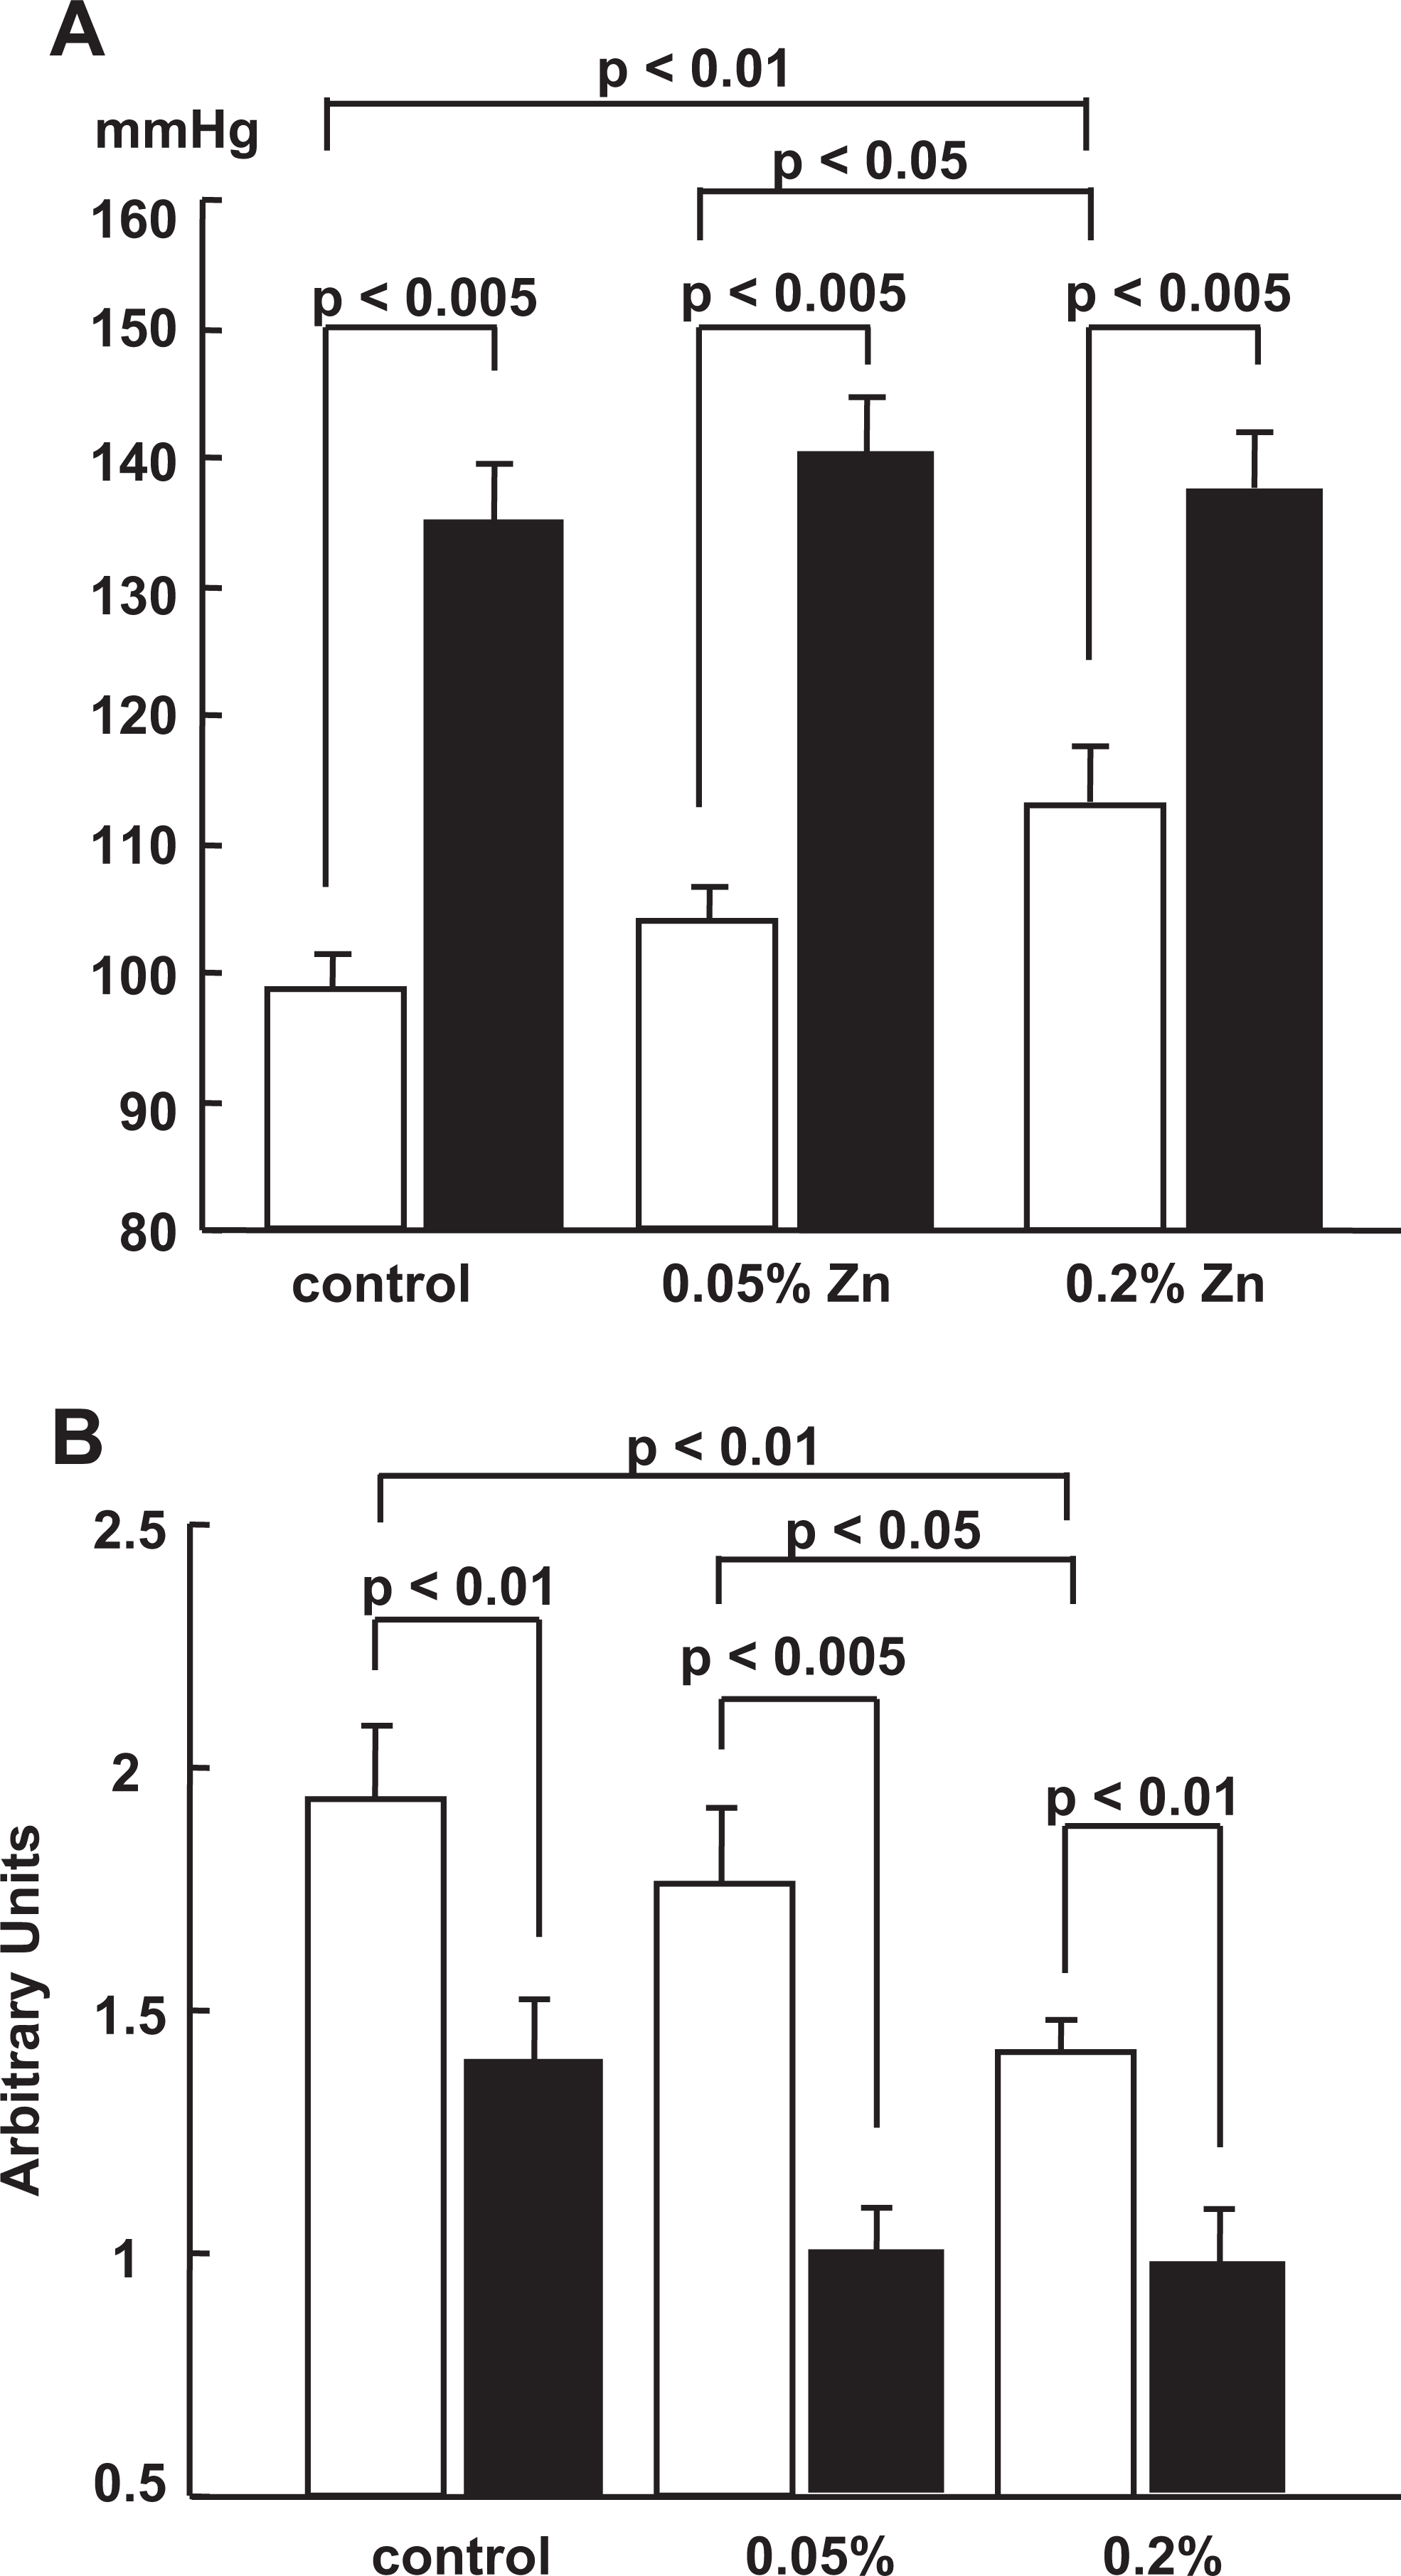
Figure 3 shows the effects of the OO− scavenger, tempol, on mean BP (A) and RBF (B) levels obtained from rats fed a control diet (n = 8) or 2 Zn-excess diets (n = 8 each) for 4 weeks. Basal mean BP and RBF levels in each group of rats with no tempol treatment were comparable to the results of Figure 1. Tempol treatment significantly decreased the mean BP levels (P < 0.01) and substantially increased the RBF levels (P < 0.05) in the 3 groups of rats. No significant differences in mean BP and RBF levels were noted among the 3 groups of rats with tempol treatment. However, an increase in RBF levels tended to be blunted in rats fed 2 Zn-excess diets, particularly a 0.2% Zn-excess diet, versus a control diet.
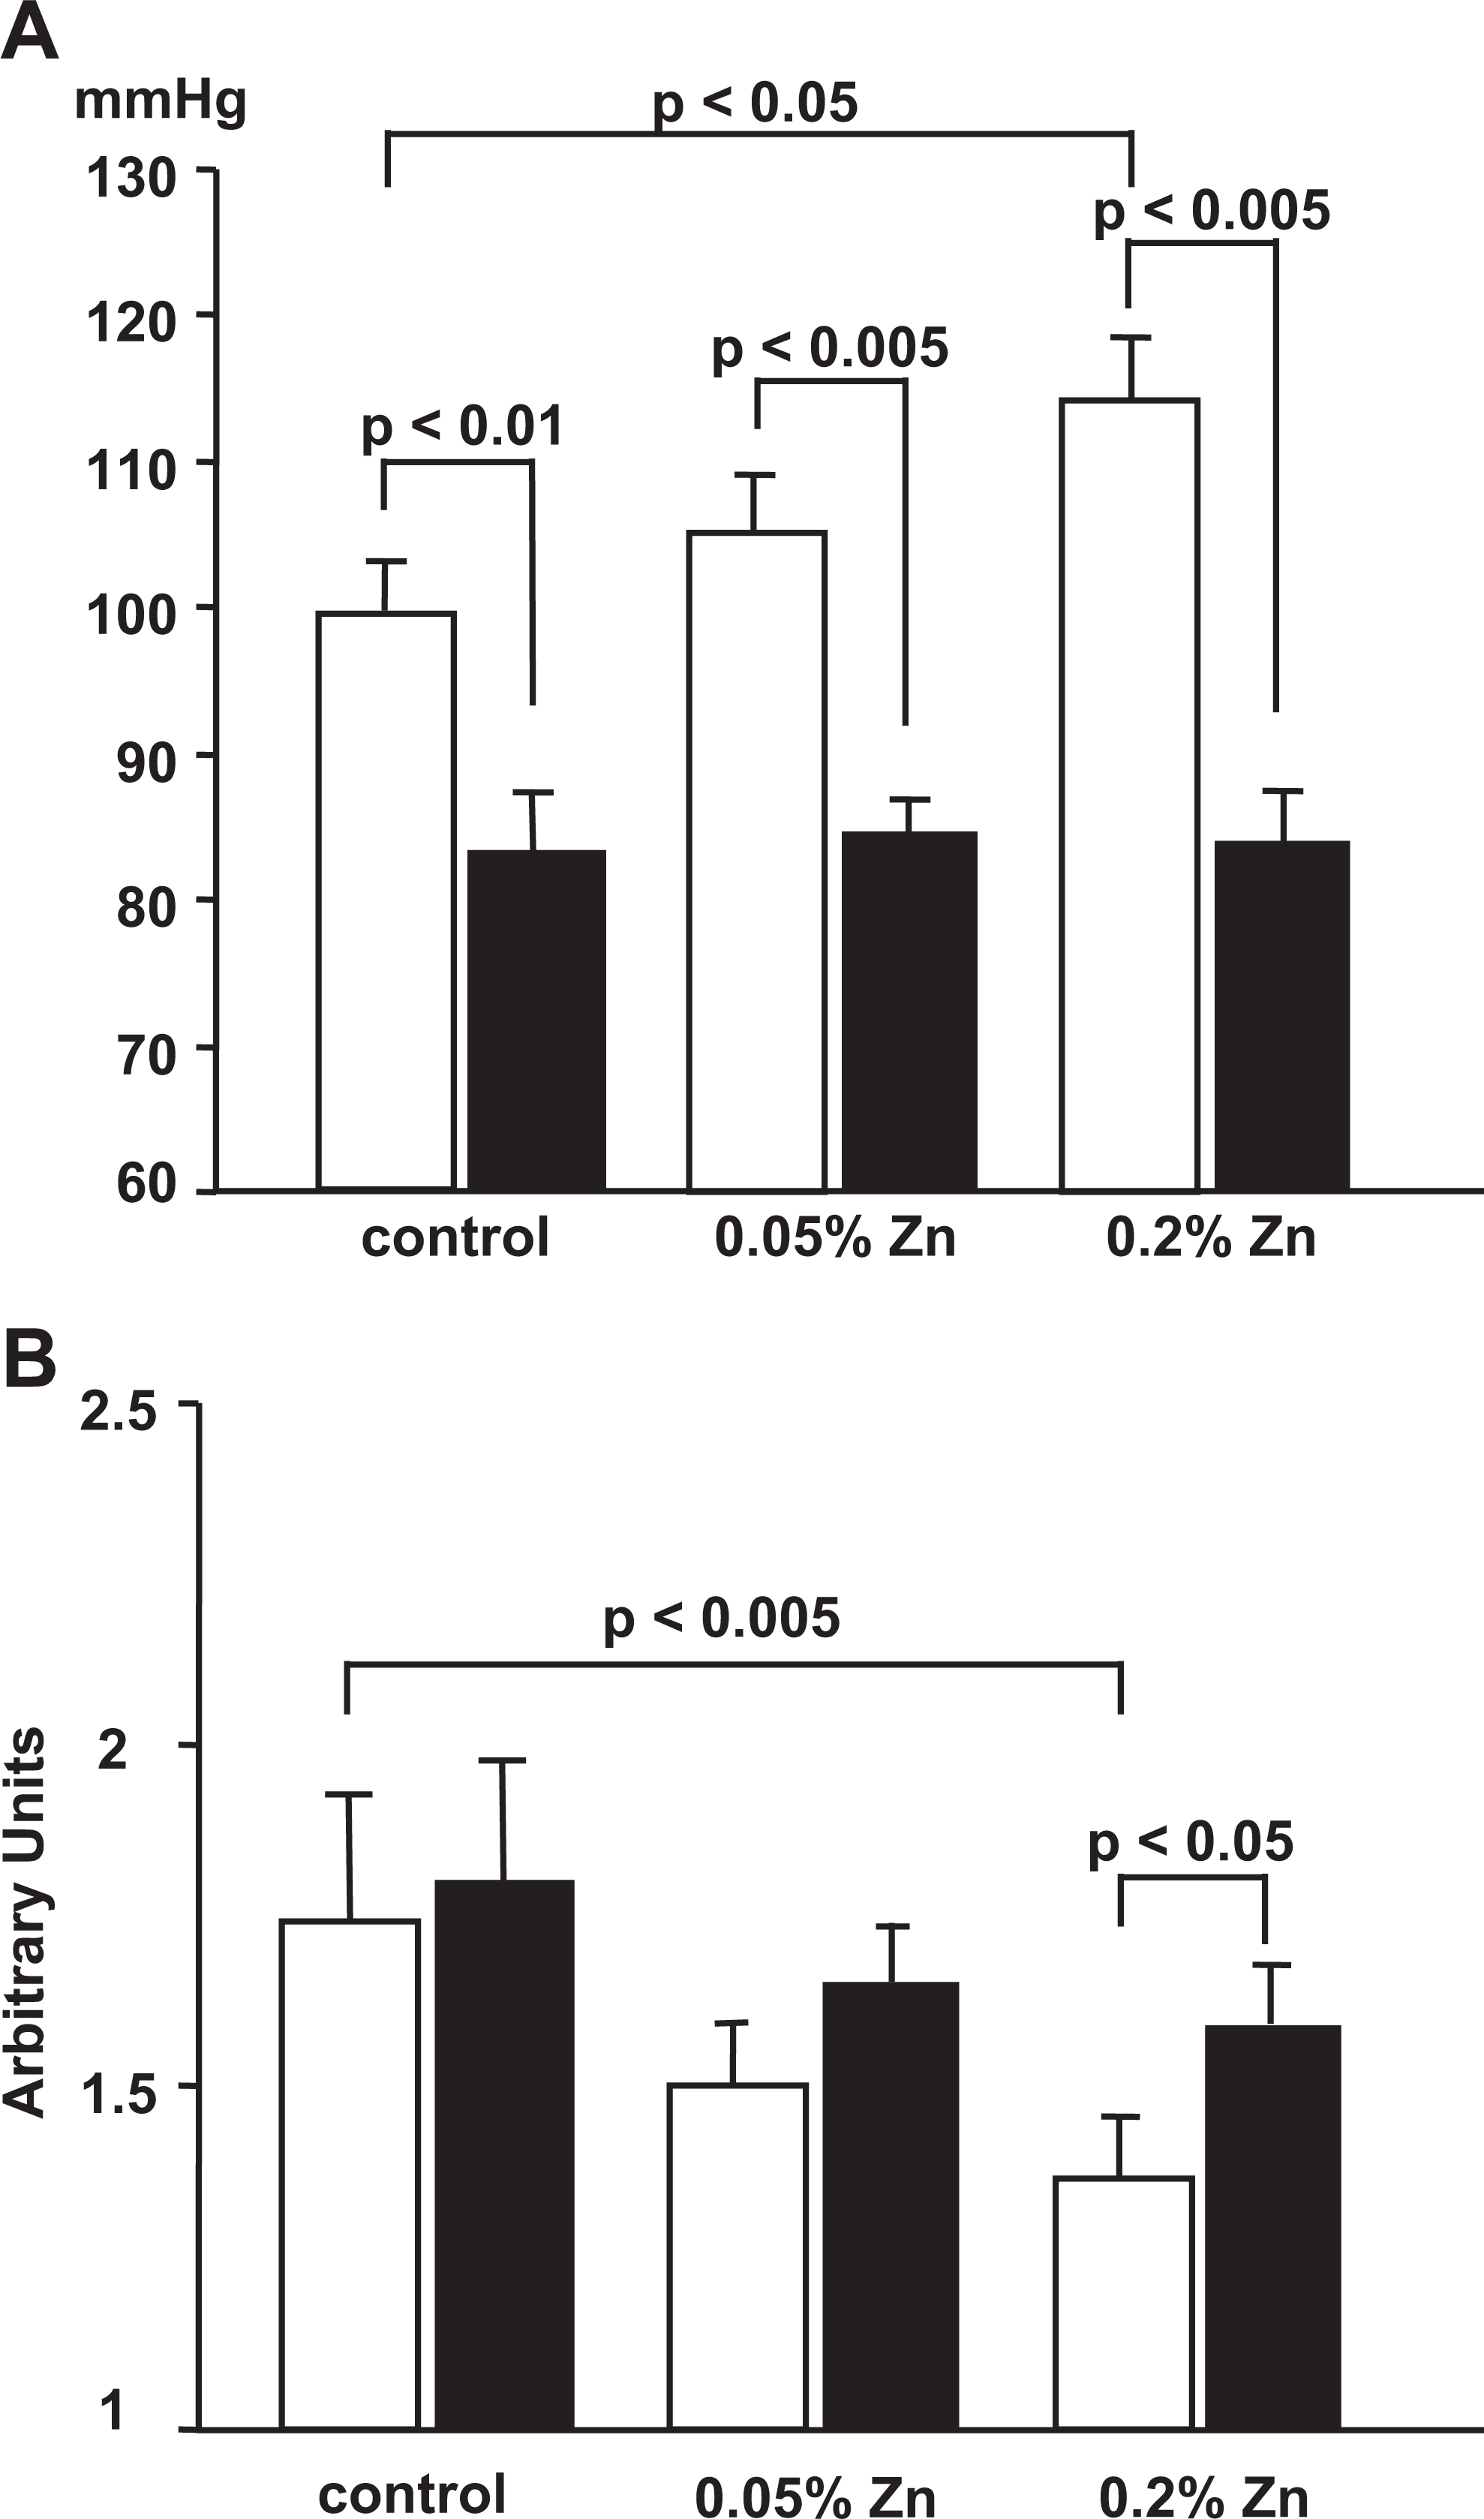
Effects of tempol treatment on mean blood pressure (mm Hg) levels (A) and renal blood flow (arbitrary units) levels (B) observed in rats fed a control diet or 2 Zn-excess diets for 4 weeks. Data reported represent means ± standard deviations (SDs) of the values obtained from 8 rats in each group. Statistical analysis was based on 2-way analysis of variance with Student t-test. White bars, basal condition groups. Black bars, tempol treatment groups.
Figure 4 presents representative photomicrographs of the H&E-stained kidney sections obtained from rats fed a control (A) or a 0.2% Zn-excess (B) diet for 4 weeks. The H&E staining revealed no significant morphologic changes in glomeruli, tubules, the interstitium, and vessels of the kidney from rats fed a 0.2% Zn-excess versus a control diet. This indicates that the kidney is structurally intact in rats fed a 0.2% Zn-excess diet for 4 weeks.
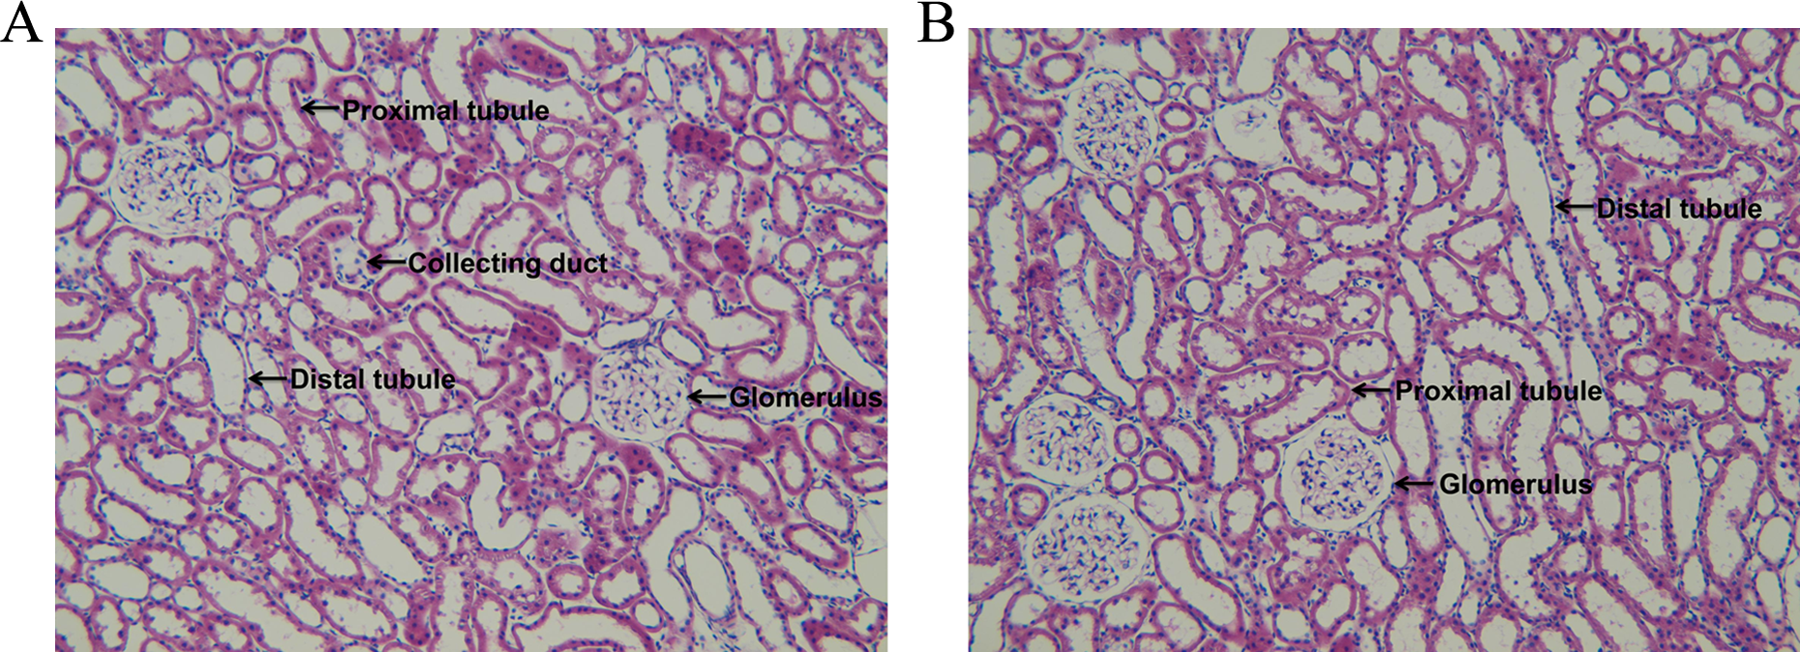
Representative photomicrographs of the hematoxylin–eosin-stained kidney sections obtained from rats fed a control (A) or a 0.2% Zn-excess (B) diet for 4 weeks. No significant pathological findings in glomeruli, tubules, the interstitium, and vessels were seen in the kidney of rats fed a 0.2% Zn-excess versus a control diet. Magnification: ×100.
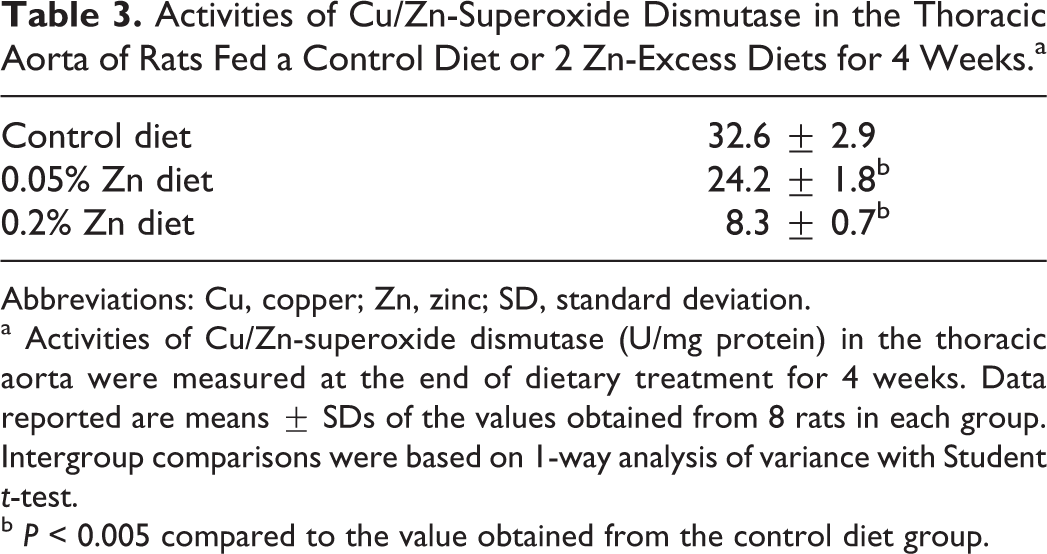
Table 3 shows the activities of Cu/Zn-SOD obtained from the thoracic aorta of rats fed a control diet (n = 8) or 2 Zn-excess diets (n = 8 each) for 4 weeks. The activities of Cu/Zn-SOD (U/mg protein) were 32.6 ± 2.9, 24.2 ± 1.8, and 8.3 ± 0.7 in rats fed a control, 0.05% Zn-excess, and 0.2% Zn-excess diets, respectively. The activities of Cu/Zn-SOD was significantly diminished by 26% and 75% in rats fed 0.05% and 0.2% Zn-excess diets, respectively, relative to rats fed a control diet.
Activities of Cu/Zn-Superoxide Dismutase in the Thoracic Aorta of Rats Fed a Control Diet or 2 Zn-Excess Diets for 4 Weeks.a
Abbreviations: Cu, copper; Zn, zinc; SD, standard deviation.
a Activities of Cu/Zn-superoxide dismutase (U/mg protein) in the thoracic aorta were measured at the end of dietary treatment for 4 weeks. Data reported are means ± SDs of the values obtained from 8 rats in each group. Intergroup comparisons were based on 1-way analysis of variance with Student t-test.
b P < 0.005 compared to the value obtained from the control diet group.
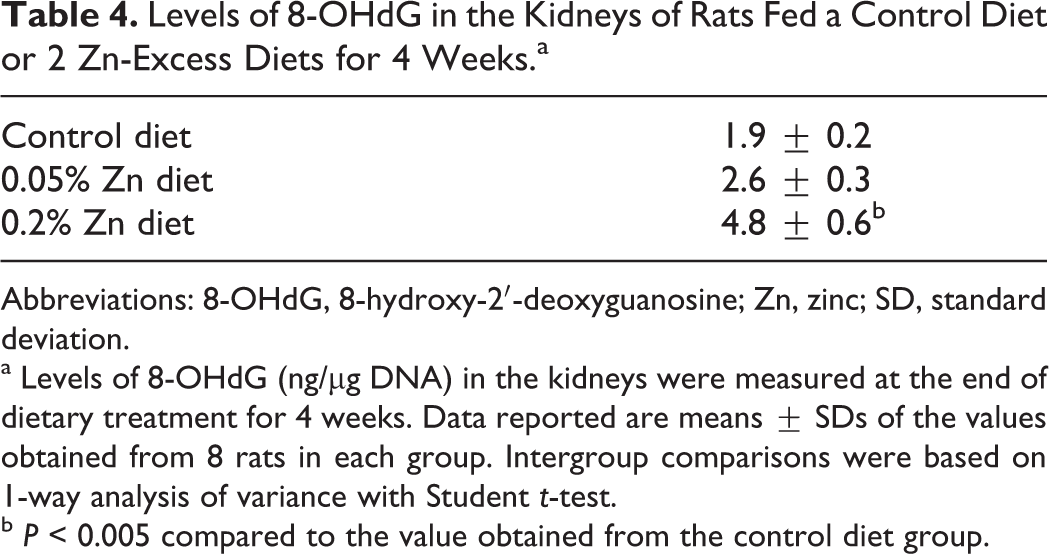
Table 4 presents the levels of 8-OHdG obtained from the kidneys of rats fed a control diet (n = 8) or 2 Zn-excess diets (n = 8 each) for 4 weeks. Levels of 8-OHdG (ng/μg DNA) were 1.9 ± 0.2, 2.6 ± 0.3, and 4.8 ± 0.6 in rats fed a control, 0.05% Zn-excess, and 0.2% Zn-excess diets, respectively. Levels of 8-OHdG were elevated according to an increase in Zn intake. Particularly, levels of 8-OHdG were significantly augmented by 2.5 times in rats fed a 0.2% Zn-excess diet when compared to rats fed a control diet.
Levels of 8-OHdG in the Kidneys of Rats Fed a Control Diet or 2 Zn-Excess Diets for 4 Weeks.a
Abbreviations: 8-OHdG, 8-hydroxy-2′-deoxyguanosine; Zn, zinc; SD, standard deviation.
a Levels of 8-OHdG (ng/μg DNA) in the kidneys were measured at the end of dietary treatment for 4 weeks. Data reported are means ± SDs of the values obtained from 8 rats in each group. Intergroup comparisons were based on 1-way analysis of variance with Student t-test.
b P < 0.005 compared to the value obtained from the control diet group.
Discussion
There is a reciprocal relationship between the intestinal absorption rates of Zn and Cu. 1,3,22,23 The ingestion of a diet containing large amounts of Zn augments intestinal absorption of Zn2+ instead of Cu2+. 1,3,22 –24 This increased absorption of Zn2+ leads to the replacement of serum Cu with serum Zn, resulting in a fall in the Cu/Zn ratio characteristic in a Zn-excess state. 1,3,22 –24 Indeed, the present study demonstrated an increase in serum Zn concentrations, a decrease in serum Cu concentrations, and a reduction in the Cu/Zn ratio according to the augmentation in Zn ingestion (Table 2). These observations indicate that rats fed Zn-excess diets may not only be in a Zn-excess state but also in a Cu-deficient state secondary to Zn-excess intake.
Of interest in the present study was that rats fed 2 Zn-excess diets had a dose-dependent increase in basal systolic BP, diastolic BP, and mean BP levels and a dose-dependent decrease in basal RBF and inulin clearance levels relative to rats fed a control diet (Figure 1). These observations indicate an elevation in basal systemic BP levels and a reduction in basal renal function due to Zn-excess ingestion. The fall in inulin clearance seen in rats fed 2 Zn-excess diets may be the result of a reduction in RBF because H&E staining showed no significant morphologic changes in the kidneys obtained from rats fed a 0.2% Zn-excess diet (Figure 4).
The family of NOS produces the vasodilatory gas, NO, from the terminal guanidino nitrogen of
We 12,14,17 and others 8 –10 have recently reported that an increase in the action of OO− in the vessel wall causes a reduction in the action of the vasodilator, NO, through the formation of ONOO−. We demonstrated in the present study that intravenous administration of the exogenous OO− scavenger, tempol, caused a fall in mean BP levels and a rise in RBF levels in rats fed a control diet and 2 Zn-excess diets (Figure 3). In a previous study, we obtained similar results on tempol treatment for an increase in systemic BP caused by Zn-excess intake. 17 These observations indicate that OO− may be a modifier of renal function as well as systemic BP via a decrease in the action of the vasodilator, NO, based on the formation of ONOO− in rats fed 2 Zn-excess diets. Thus, the mechanisms responsible for an elevation in systemic BP and the deterioration of renal function in rats fed 2 Zn-excess diets may be due to an increase in the action of OO− in the vessel wall. Indeed, an increase in 8-OHdG formation caused by enhanced OO− production was seen in rats fed 2 Zn-excess diets (Table 4).
There were no significant differences in mean BP and RBF levels after
The vasodilator, NO, augments glomerular capillary plasma flow (QA) and single nephron glomerular filtration rate (SNGFR) via a decrement in afferent arteriole resistance due to afferent arteriole vasodilation and an increment in the ultrafiltration coefficient (Kf) due to mesangial cell relaxation. 25,26 The present study, therefore, indicates that a fall in inulin clearance observed in rats fed 2 Zn-excess diets may be attributed to a decline in SNGFR derived from a decrement in QA caused by both an increment in afferent arteriole resistance due to an increase in afferent arteriole vasoconstriction and a decrement in Kf due to mesangial cell contraction through a decrease in the action of the vasodilator, NO.
On the other hand, the vasoconstrictor, angiotensin II, reduces QA and SNGFR through an increment in glomerular arteriole resistance due to afferent and efferent arteriole vasoconstriction (afferent arteriole < efferent arteriole) and a decrement in Kf due to mesangial cell contraction. 25,26 If the vasoconstrictor, angiotensin II, is in part involved, it is a conceivable that angiotensin II also contributes to a decline in SNGFR through a fall in QA due to both an increment in glomerular arteriole resistance and a decrement in Kf in rats fed 2 Zn-excess diets.
The endogenous OO− scavenger, Cu/Zn-SOD, dismutases OO− to hydrogen peroxide and the hydrogen peroxide is converted into water by catalase and glutathione peroxidase. 21,27 The Cu/Zn-SOD requiring both Cu and Zn for exhibiting the function is an endogenous enzyme scavenging OO− in the vessel wall. 1,3 It is therefore considered that Cu/Zn-SOD plays a central role in defending the vessel wall against the oxidative stress caused by OO−. In the present (Table 3) and previous 17 studies, the activity of Cu/Zn-SOD in the thoracic aorta was significantly reduced in rats fed 2 Zn-excess diets relative to rats fed a control diet in a dose-dependent manner. This fall in the activity of Cu/Zn-SOD may be due to the effect of Cu deficiency secondary to Zn-excess ingestion, contributing to an increase in the action of OO− in the vessel wall of rats fed 2 Zn-excess diets.
Values for both systemic BP and renal function observed in rats fed a 0.05% Zn-excess diet (11 mg Zn/d) were at the borderline in statistical significance when compared to those obtained from rats fed a control diet (1.1 mg Zn/d), suggesting that the lowest observed adverse effect level of Zn is approximately 11 mg/d (Figure 1).
Taneja and Mandal reported that an increase in serum Zn levels and a decrease in serum Cu levels were observed in the patients with hypertension versus the normotensive individuals in the Chandigarh of India. 28,29 Serum Zn and Cu levels were 0.177 ± 0.01 and 0.063 ± 0.01 mg/dL, respectively, in the normotensive subjects and 0.46 ± 0.01 and 0.035 ± 0.01 mg/dL, respectively, in the hypertensive subjects. The Cu/Zn ratio was approximately 0.36 and 0.076 in the normotensive and the hypertensive subjects, respectively. The hypertensive subjects had significantly higher serum Zn levels by 2.6 times than the normotensive subjects (2.7 times increase in rats fed a 0.2% Zn-excess vs a control [0.005% Zn] diet in the present study). Inversely, serum Cu levels were profoundly reduced by 44.4% in the hypertensive subjects when compared to the normotensive subjects (88% fall in rats fed a 0.2% Zn-excess versus a control diet in the present study). Consequently, the Cu/Zn ratio was notably decreased by 78.6% in the hypertensive subjects relative to the normotensive subjects (96% fall in rats fed a 0.2% Zn-excess versus a control diet in the present study). These observations, particularly the increase rate of serum Zn levels and the decrease rate of the Cu/Zn ratio in the hypertensive versus the normotensive subjects, were similar to those obtained in the present study (Table 2). Thus, the 3 dietary settings, a control diet containing 0.005% Zn and 2 Zn-excess diets containing 0.05% Zn or 0.2% Zn, used in the present study may be available to producing the Zn-excess animal models similar to humans.
In summary, the present study demonstrated that Zn-excess intake caused the deterioration of renal function via an increase in the action of OO−. Zn-excess intake may be a critical factor to elevate systemic BP and to reduce renal function through the oxidative stress caused by OO−. A reduction in the activity of Cu/Zn-SOD concomitantly seen in the vessel wall appeared to participate in the increase in the action of OO−. Indeed, 8-OHdG formation caused by OO− generation was substantially elevated in the Zn-excess setting. Hereafter, detailed epidemiologic studies should be done to elucidate the relationship between renal hemodynamics/function and Zn-excess intake in humans.
Footnotes
Declaration of Conflicting Interests
The author(s) declared no potential conflicts of interest with respect to the research, authorship, and/or publication of this article.
Funding
The author(s) disclosed receipt of the following financial support for the research, authorship and/or publication of this article: This work was supported by Grants (No. 21590715) for Scientific Research from the Ministry of Education, Science, Sports and Culture of Japan.