
Abstract
Zinc oxide (ZnO) nanoparticles (NPs) are being widely utilized in industry due to their versatile properties. The in vitro cytotoxicity findings and the potential for exposures to ZnO NP from different sources via different routes of entry into the body have raised public health concerns. Although recent studies have shown the cytotoxic effects of these NPs, including oxidative stress, apoptosis and necrosis induction, genotoxicity, and others, irradiation-induced cytotoxicity has not been systematically studied. The goal of this study was to determine whether irradiation in the forms of visible light (approximately 400-600 nm), ultraviolet (UV) A (366 nm), and UVC (254 nm) would affect ZnO NPs-induced cytotoxicity. The results of this study demonstrated that the cytotoxicity of 60 to 80 nm ZnO NPs to A549 cells is dosage, time, and wavelength dependent. Nuclear decomposition by ZnO NPs, prior to membrane deformation, was found to be enhanced when exposed to irradiation. This study suggests that this phenomenon may be attributed to the irradiation-induced formation of positively charged sites on the ZnO NPs, which enhances nuclear affinity and generation of reactive oxygen species. Finally, the data demonstrated that while ZnO NPs act preferentially toward nuclear regions, destructions of cell membrane and the cytosol have also been observed. The photocatalytic properties of ZnO NPs play a critical role during the early stages of cell death, and their effects were reduced through the use of an antioxidant, N-acetylcysteine. In conclusion, both visible light and UV irradiations have been found to enhance the cytotoxic effect of ZnO NPs on the A549 cell line. This finding supports the need for further in vivo exposure studies relevant to actual conditions to confirm whether combined irradiation and ZnO NP exposure could enhance the nanotoxicity of ZnO NPs.
Introduction
As one of the most widely used nanoparticles (NPs), zinc oxide (ZnO) NPs can be found in many skin care products, such as sunscreen lotions, creams, and cosmetics, as well as in pigments, tire compounds, nanosensors, nanocantilevers, field effect transistors, nanoresonators, and other industrial and medical applications. 1 Despite the positive impacts of ZnO NPs on human society, the in vitro cytotoxic effects of ZnO NPs create health concerns for humans because of the variety of potential routes of exposure and entry for ZnO NPs to get into human body including topical, inhalation (respiratory tract), ingestion (gastrointestinal tract), and injection (blood circulation). 2,3 In vitro studies using various cell lines demonstrated that ZnO NPs can cause cyto- and genotoxicities, including elevated reactive oxygen species (ROS) levels, intracellular oxidative stress, lipid peroxidation, cell membrane leakage, oxidative DNA damage, and among others. 4,5 Moreover, cosmetic products containing ZnO NPs are supposed to provide protection against ultraviolet (UV) irradiation. In support of this, it has been reported that the TiO2 and/or ZnO NPs in sunscreen lotions cannot penetrate the skin barrier and have been therefore labeled nontoxic. 6 Furthermore, prolonged exposure to these products has also been reported to slow the development of squamous or basal cell carcinoma. 7 Despite this in vivo support of ZnO NP-containing products, a number of in vitro studies have demonstrated a strong cytotoxicity.
Preliminary data demonstrated that the cellular uptake of ZnO NPs by human epidermal keratinocytes and the destructive effects were both time dependent (6-24 hours) and dose dependent (8-20 μg/mL), especially toward mitochondrial activity and DNA integrity. 8 Investigation of ZnO uptake, using human liver cells (HepG2), revealed significant cytotoxic and genotoxic effects caused by intracellular ROS generation. 9 Another study using primary human nasal mucosa cells indicated distinctive cyto- and genotoxicities, as well as the proinflammatory potential of ZnO NPs. 10 Indeed, an earlier study showed that inflammation was related to sensitivity toward cytotoxic NPs, while the oxidative status of cells and tissues may further accentuate this effect. 11 This may explain the typical cascade decreasing pattern of cell viability observed under constant exposure to toxic NPs. A comprehensive study reported that both remarkable cellular toxicity and increased intracellular calcium levels ([Ca2+]in) were observed when cells were treated with 20 nm ZnO NPs. Four genes related to apoptosis and oxidative stress responses were also found to be correlated with the NP cytotoxicity and calcium level variations, 12 these results provided a potential genetic risk even when cells were exposed to a sublethal concentration of ZnO NPs. A further study on the photocytotoxic effects of ZnO NPs under UVA irradiation with human head and neck squamous carcinoma cell line reported a sharp reduction in cell viability, even when NPs were applied at low dosages and with a short illumination time. 13 A phytotoxicity study on Allium cepa with ZnO NPs treatment also demonstrated clastogenic/genotoxic and cytotoxic effects, thus stressing an environmental concern about widely used ZnO nanomaterials. 14
Mechanism studies of ZnO NPs cytotoxicity have drawn increasing attention in recent years; however, several controversial conclusions have been reached from these studies. Our previous study of ZnO NPs cytotoxicity in human lung epithelial cells concluded that the free Zn2+ ions in ZnO NPs suspension were not responsible for the observed cytotoxicity. 15 However, another report on ZnO NPs attributed the cytotoxicity of ZnO NPs to particle dissolution and Zn2+ release. 16 Other studies explained ZnO NPs cytotoxicity by a combination of several effects, including labile zinc complexes, physicochemical properties, metal composition, particle scale, as well as metal solubility. 1,17 In addition, considering the use of ZnO NPs in sunscreen lotions with its potential photoactivity, it is highly suggested to investigate combined toxic effect of ZnO NPs with varied types of illumination and irradiation. 18 Recent report suggested an increased photogenotoxic effect of ZnO after an exposure to UV light. 19 Another close scrutinization of ZnO NPs reported its phototoxicity in HaCaT keratinocytes through oxidative DNA damage under UVA and visible light irradiations. 20 A more representative in vivo study using a mouse model showed similar data as the in vitro assay acquired, such as induced lipid peroxidation, oxidative DNA damage, and apoptosis in liver. 5 Furthermore, a recent in vivo study has reported a wide variety of organs, such as liver, kidney, lung, spleen, and pancreas, that might be the target of ZnO NPs. 21 In light of these inconclusive natures of this topic, further investigation is highly required to reach a solid conclusion on the basis of the irradiation-induced cytotoxicity of ZnO NPs.
In this study, the human lung adenocarcinoma epithelial cell line (A549) was employed as a cytotoxicity paradigm to evaluate irradiation-related ZnO NPs cytotoxic effects. A549 cell line has been widely acknowledged as a model in many previous in vitro cytotoxicity studies, 22,23 including ours, 15,24 -26 and it was reported to have similar cellular responses as keratinocytes as well, 8,27 presumably for the same derivation from precursor epithelial cells. Herein, A549 cell line was employed to maintain a good consistency and relevance to our previous data. However, further investigation of more diverse cell lines, such as keratinocytes, that offer a more realistic exposure scenario of irradiation-induced cytotoxic effects of ZnO NPs will be conducted. Safety evaluations and assessments of sunscreen formulations paid more attention to UVB-caused skin damages 18,28,29 for its readily damaging effect on skin tissues and generated sunburn pains, 30 which was further correlated with epidermal TRPV4 ion channel and endothelin 1 signaling. 31 However, broader UV spectra irradiation has been ignored and thus need further investigation. In this study, visible light, UVA, and UVC irradiations have been chosen to provide a variety of illumination and irradiation types. As a control, dark incubation conditions were also employed in the design of this study. In summary, both visible light and UV irradiations have been found to highly enhance the cytotoxic effect of ZnO NPs in the A549 cells as functions of exposure time, irradiation wavelength, as well as NPs dosage. Steep cell viability decreases, intracellular ROS induction, lactate dehydrogenase (LDH) releasing, cell shrinkage, as well as morphological changes, combined with cytoplasm leakage and cytoskeleton destruction, evidently indicate a highly enhanced cytotoxic effect of ZnO NPs under irradiation. Although these negative effects can partially be rescued by N-acetylcysteine (NAC), additional investigation of both in vitro and in vivo exposure to ZnO NPs under irradiation that relevant to actual conditions should be conducted for thorough safety evaluation in the future.
Materials and Methods
Reagents and Chemicals
Fetal bovine serum was purchased from American Type Culture Collection (ATCC; Manassas, Virginia). Ham’s F-12K medium with
Characterization of ZnO NPs
The ZnO NPs (60-80 nm) were purchased from Sigma-Aldrich at 99.0% purity. Particle size distributions, crystal structure, as well as surface area have been determined and characterized by tunneling electron microscopy (TEM; Philips Electron Optics, Eindhoven, Netherlands), x-ray diffuse scattering (Scintag, Inc, Cupertino, California), and Brunauer-Emmett-Teller (BET) analyzer. 15 Scanning electron microscopy (SEM) images of ZnO NPs were taken by a Hitachi S-4700 field-emission scanning electron microscope (FESEM; Hitachi Inc, Japan) at 5 kV.
Suspensions of ZnO NPs were prepared in the cell culture medium and dispersed using a Fisher ultrasonicator FS-60H (Fisher Scientific) for 5 minutes. The suspension was freshly prepared, diluted to desired concentrations in serum-containing medium, and then immediately applied to the human bronchoalveolar carcinoma-derived cells (A549).
Lamp Information
The UVGL-58 (UVA, irradiation peak at 366 nm) and UVGL-25 (UVC, irradiation peak at 254 nm; 115 V and 60 Hz alternating current power supply) lamps were used as UVA and UVC irradiation sources. Visible light was generated using a phosphor-converted light-emitting diode (LED) white light with broad band emission distributed from 400 to 700 nm. Two fluorescent tubes in each UV lamps, and multiple (2-4, depend on tested cell volume and area) LED white light sources, were used to provide evenly distributed surface irradiation intensity. Lamps were positioned above the cell culture area such that a final illumination output of 5 W was achieved at the culture surface.
Cell Culture and Treatment With ZnO NPs Under Various Irradiation Conditions
The human bronchoalveolar carcinoma-derived cell line (A549) was purchased from ATCC (Manassas). This cell line has been widely used in in vitro particulate matter-related pulmonary toxicity studies
32,33
; therefore, the same cell line was used in this study for data comparison and data correlation. Cells were maintained in phenol red-free Ham’s F-12K nutrient mixture purchased from Caisson Laboratories, Inc (North Logan, Utah) supplemented with
Cytotoxicity Assessment of ZnO NPs and Irradiation
To determine the cytotoxicity of 60 to 80 nm ZnO NPs under different irradiations sources, the WST-1 assay (Cell Titer 96 Aqueous One Solution Assay, Promega) and acetomethoxy derivate of calcein AM assay (Life Technologies Inc, Carlsbad, California) were used according to the manufacturers’ instructions. Absorbance at 450 nm using WST-1 and fluorescent emission at 515 nm for Calcein AM were measured using a microplate reader (FLOURstar; BMG Labtechnologies, Durham, North Carolina).
Intracellular ROS Measurement
Reactive oxygen species generation was measured using oxidation of 2′,7′-dichlorofluorescin (DCFH) and its diacetate form (DCFH-DA). 34 The DCFH-DA is hydrolyzed by esterase to DCFH, a compound unable to cross the cellular membrane. This initially nonfluorescent molecule is oxidized by cellular oxidants to a highly fluorescent product, 2′,7′-dichlorofluorescein (DCF). A DCFH-DA stock solution (in methanol) of 10 mmol/L was diluted 500-fold in HBSS (Life Technology Inc) without serum or other additive to yield a 20-μmol/L working solution. Cells were washed twice with HBSS and then incubated with DCFH-DA working solution for 1 hour under a dark environment (37°C incubator) followed by treatment with ZnO NPs for 24 hours. After exposure, fluorescence was determined at 485 nm excitation and 520 nm emission using a microplate reader (FLOUR star; BMG Labtechnologies).
Lactate Dehydrogenase Measurement
Lactate dehydrogenase activity in the cell culture medium was determined by an LDH kit (Pointe Scientific). 35,36 The analysis required 100 µL of culture medium. Lactate dehydrogenase catalyzed the oxidation of lactate to pyruvate with simultaneous reduction of nicotinamide adenine dinucleotide (NAD+) to NADH. The rate of NAD+ reduction was directly proportional to LDH activity in the cell medium. Absorption was measured using a Beckman DU-640B UV/Vis Spectrophotometer (Beckman Coulter Inc., Pasadena, CA) at 340 nm.
Cellular Staining With Fluorescent Probes
A549 cells seeded for 24 hours were treated with 60 to 80 nm ZnO NPs under dark, visible light, UVA, and UVC irradiation conditions for 6 hours. Cells were then treated with DCFH-DA for 1 hour without light, followed by 4′,6-diamidino-2-phenylindole (DAPI) staining for 10 minutes. Cells were then imaged using an epifluorescence Olympus IX 51 microscope (Olympus America, Center Valley, Pennsylvania) equipped with a fluorescein filter. Fluorescent images were captured and analyzed using SlideBook 4.1 software (Intelligent Imaging Innovations, Denver, Colorado). The final 3-dimensional (3-D) fluorescent images of cells were acquired by ImageJ software (NIH).
Tunneling Electron Microscopy Imaging
A TEM-specific thin layer carbon/nickel grid was presoaked in 0.1% poly-
Statistical Analysis
Each component of the study was run in triplicate for statistical validation purposes. Data have been expressed as the mean ± standard deviation. Statistical analyses were performed using Prism 5 (Graph-Pad Software, San Diego, California) including a one way analysis of variance test followed by a post hoc Tukey test to determine statistical significance. Differences were established to have statistical significance at P < 0.05 (*) or P < 0.01 (**).
Results
Characterization of ZnO NPs
The as-received ZnO NPs were characterized and used in this study without further modification. More than 99% purity has been indicated by the manufacturer, of which Na (45.4 µg/g), K (44.9 µg/g), Cu (37.9 µg/g), and Se (18.2 µg/g) were previously measured to be the major components of the impurity. 15 The size distribution of ZnO NPs was previously found to be 70 ± 13 nm by TEM. 15 X-ray diffraction analysis revealed that the ZnO NPs assumed a hexagonal structure, 15 and the surface area of ZnO NPs measured by the BET method was 12.16 m2/g. 15 Scanning electron microscopy was used to provide an overview of particle shape and diameter. Both ultrasonicated and nonultrasonicated ZnO NPs in solution were characterized by FESEM (Figure 1). Bulk aggregation was present in nonultrasonicated particles (Figure 1A and D), with sizes ranging up to 10 μm (Figure 1B) in diameter. The diameters of ultrasonicated ZnO NPs were appreciably smaller than nonultrasonicated particles; nevertheless, aggregation was still found in aqueous phase solutions (as shown in Figure 1C-F).
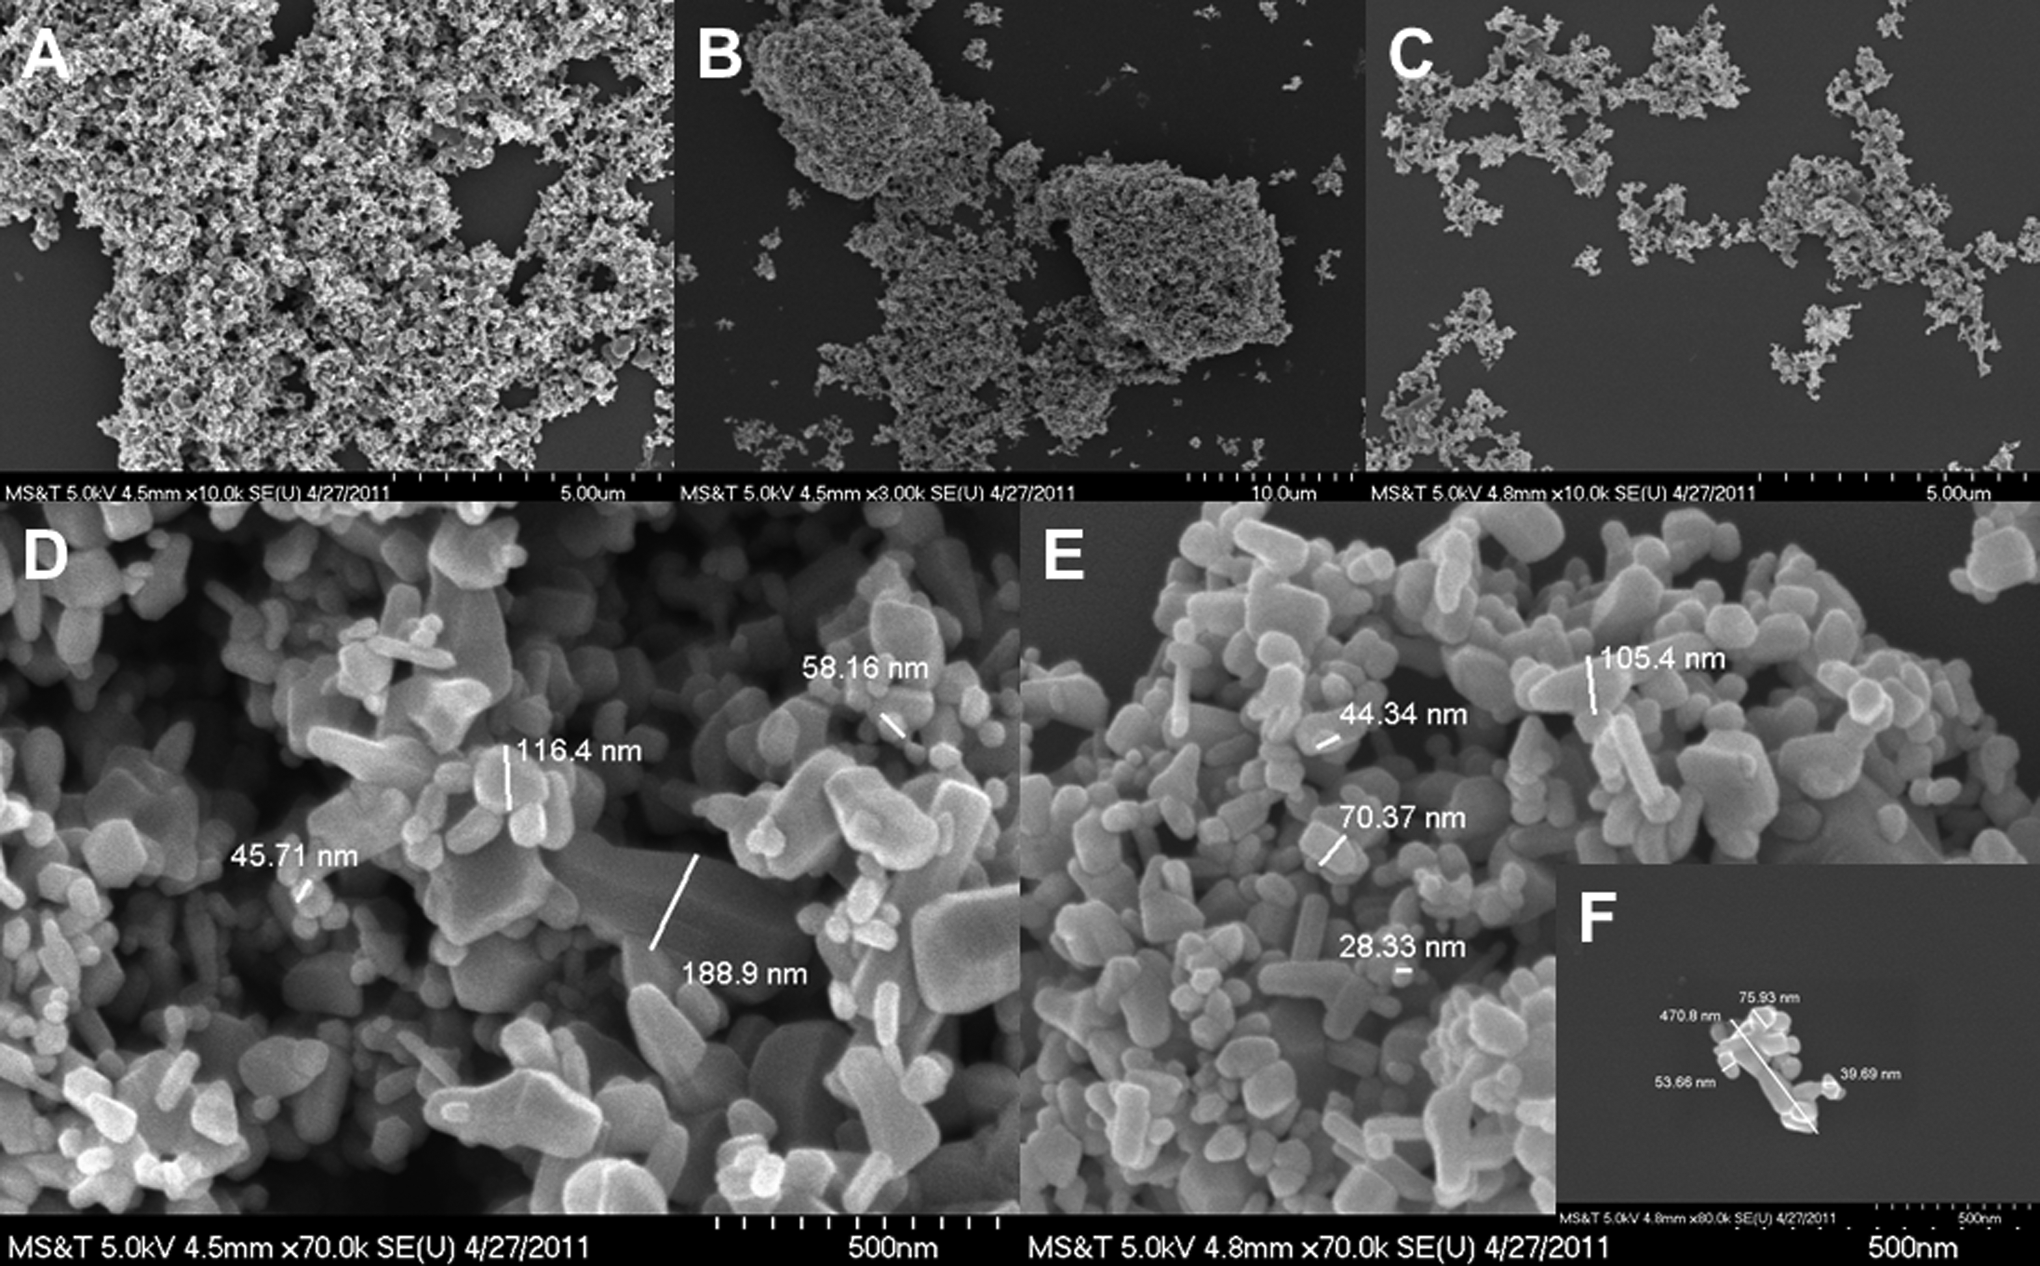
Scanning electron microscopy images of 60 to 80 nm ZnO NP aggregations with or without ultrasonication. All NPs were prepared as described in the Materials and Methods section. Images (C), (E), and (F) were ZnO NPs that were ultrasonicated. Images were taken with a Hitachi S-4700 field-emission scanning electron microscope at 5 kV and varied scale bars of 10 μm (B), 5 μm (A and C), and 500 nm (D–F). NP indicates nanoparticle; ZnO, zinc oxide.
Effects of Visible Light Exposure on Cytotoxicity of ZnO NPs
Comparisons between cell viabilities under visible light and dark environments are shown in Figure 2. Earlier work by our group 15,37 demonstrated that ZnO NPs are cytotoxic under dark conditions as a function of ZnO NP concentrations. The current study, again, found that cells incubated under dark conditions and treated with ZnO NPs at doses of 5, 10, 15, 20, and 25 μg/mL after 32 hours resulted in a decrease in cell viability, respectively, at percentage of 78.5%, 70.4%, 26.6%, 5.5%, and 3.4% (Figure 2A). The untreated control group failed to participate in this phenomenon (Ps < 0.05), thereby corroborated the previous study. Similarly, the cytotoxicity of equivalent ZnO NPs doses under visible light irradiation has been reported in Figure 2B. Although both groups (with or without irradiation) have experienced marked decreases in cell viability within the first 8 hours, the cell viabilities of the higher doses (with 15, 20, and 25 μg/mL ZnO NP dosages) under visible light irradiation are substantially lower (Figure 2B). A cell viability reduction of about 10% was found overall for cells treated with ZnO NPs and visible light than those treated with ZnO NPs and under dark conditions. Given the sharp reductions at the higher concentrations, doses of 15 and 25 μg/mL were chosen for analysis in the time- and dose-dependent studies as well as the mechanistic studies.
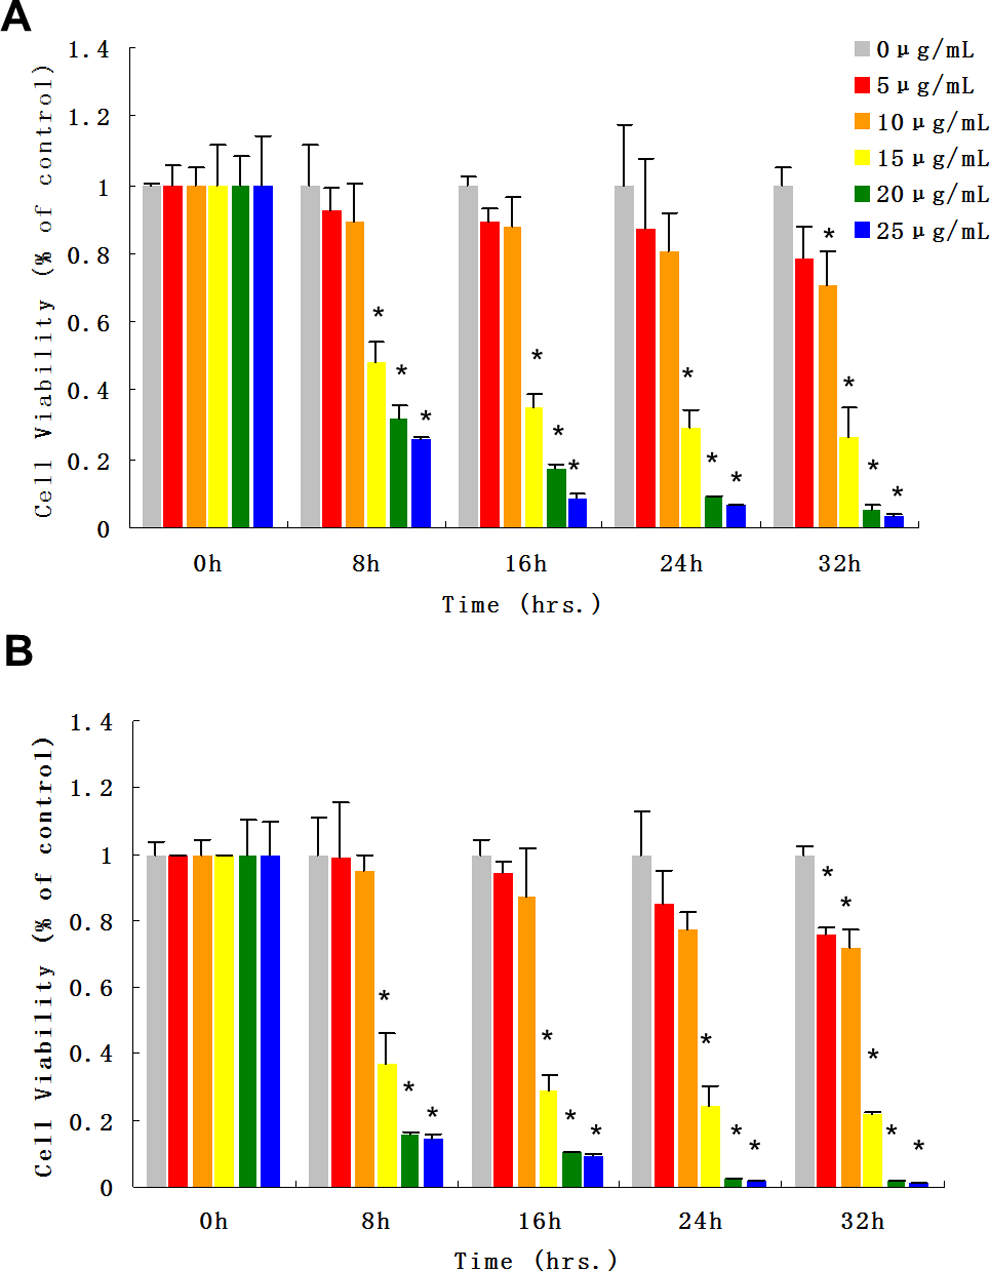
Cytotoxic effects of 60 to 80 nm ZnO NPs under visible light illumination on A549 cells. The ZnO NP suspension was prepared in serum-free cell culture medium and ultrasonicated before dosing. A, Cell viability after exposure to ZnO NPs under normal dark incubation conditions. B, Cell viability after exposure to both ZnO NPs and visible light at the same time. Each bar represents the mean ± SD of 3 independent experiments. Statistical significance was set as “*” representing P < 0.05, and remarkable statistical significance was set as “**” representing P < 0.01. NP indicates nanoparticle; SD, standard deviation; ZnO, zinc oxide.
Effects of ZnO NP dosages, Exposure Time, and Irradiation Wavelengths on the Cytotoxicity of ZnO NPs
A549 cells were exposed to ZnO NPs at 15 and 25 μg/mL dosage levels under various modes of irradiation, including dark, visible light, UVA, and UVC for 3, 6, 9, 12, and 15 hours. All 3 variables of exposure time, dose level, and irradiation source have been implicated as cytotoxicity factors (Figure 3). Cells irradiated with visible light, UVA, and UVC sources experienced higher cytotoxicity under equivalent dose and time conditions when compared with the untreated, dark control group. Indeed, at the 15 and 25 μg/mL levels after 3 hours exposure, cell viability decreased to 85.9% and 80.3%, respectively, under visible light, 77.7% and 53.5% under UVA light, and 45.9% and 49.1% under UVC light when compared with the control groups (P < 0.05). In contrast, only nonirradiated cells experienced a cell viability decrease to 85.6% and 85.9% compared with the control group (P < 0.05) under similar experimental conditions. This effect was accentuated after 12 hours of exposure. At the 15 and 25 μg/mL ZnO NP levels, the nonirradiated cell viabilities dropped to 62.8% and 61.1%, respectively, 40.2% and 51.5% under visible light, 11.3% and 9.8% under UVA light, 15.2% and 17.7% under UVC light when compared with the control groups (P < 0.05). Nevertheless, no statistical viability significances were observed between 15 and 25 μg/mL ZnO NP exposure groups under all irradiation conditions. Only control groups under different irradiation conditions and without ZnO NPs exposure showed slight differences (less than 12%) in cell viabilities, as a result of irradiation caused cytotoxicity. All controls were normalized as 100% cell viability in each group for clearer illustration.
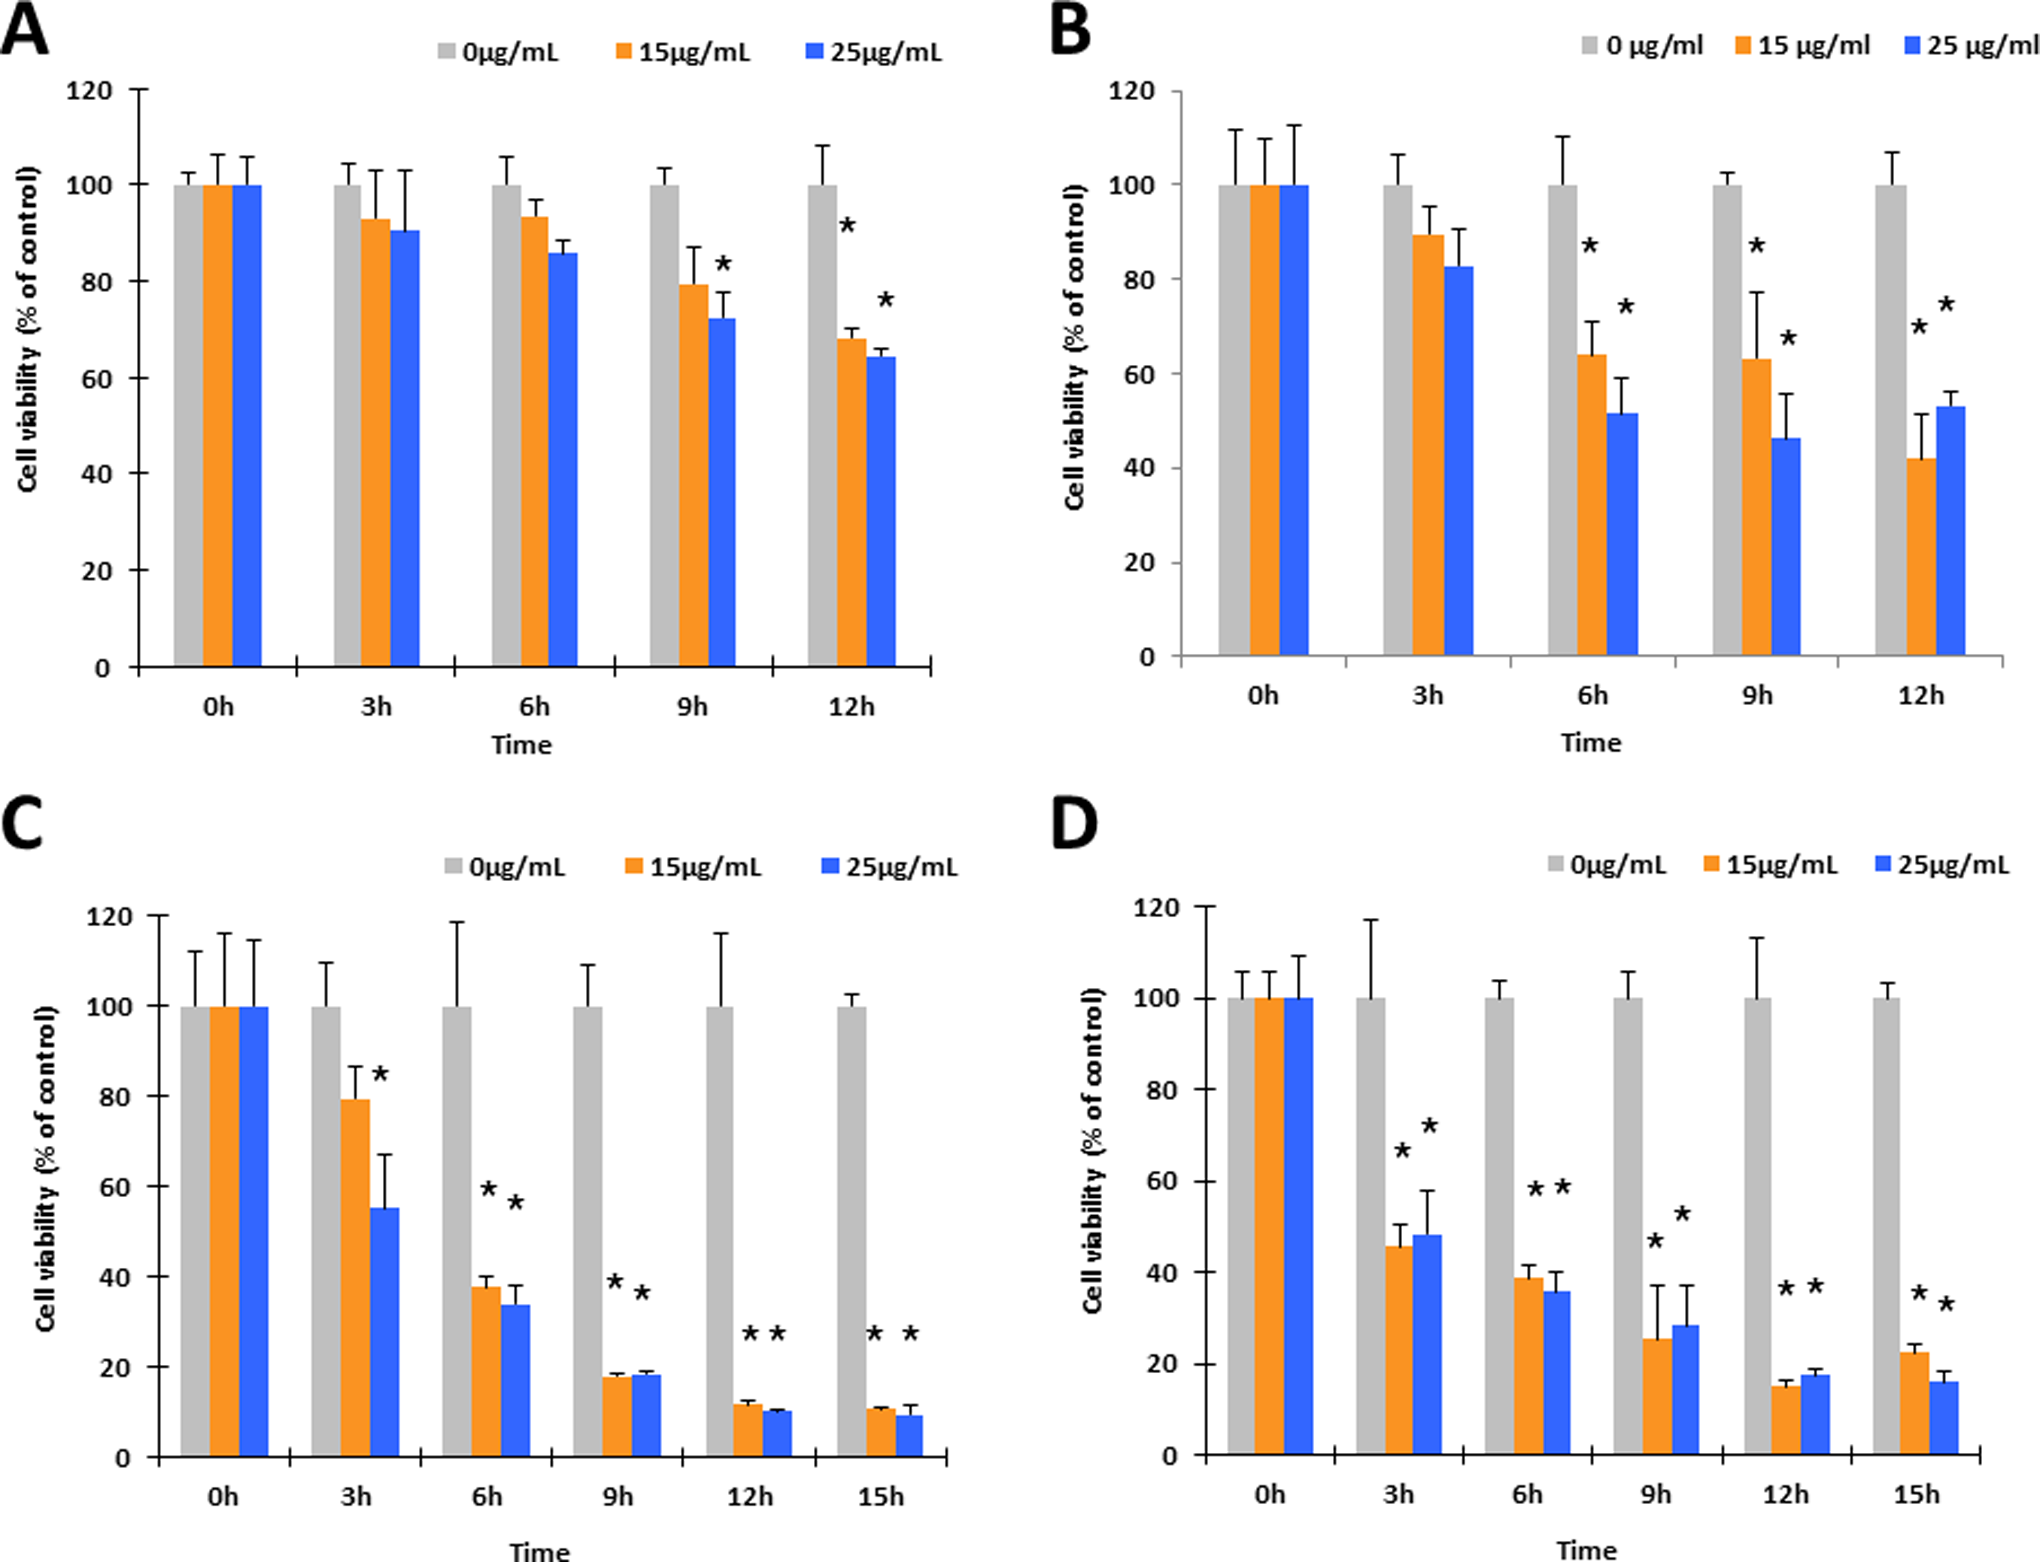
Cytotoxicity effects of ZnO NP dosages, exposure time, and differed irradiation conditions on A549 cells. Cells were seeded for 24 hours and then treated with ZnO NPs at dosages of 15 and 25 μg/mL combined with (A) normal dark culture, (B) visible light illumination for up to 12 hours, (C) UVA irradiation for up to 15 hours, and (D) UVC irradiation for up to 15 hours. Acetomethoxy derivate of calcein was used for cell viability evaluation. Each bar represents the mean ± SD of 3 independent experiments. Statistical significance was set as “*” representing P < 0.05, and remarkable statistical significance was set as “**” representing P < 0.01. NP indicates nanoparticle; UV, ultraviolet; SD, standard deviation; ZnO, zinc oxide.
Cellular ROS Generation Induced by Exposure to ZnO NPs and Different Wavelengths of Irradiations
The DCFH-DA was used to assess the intracellular ROS generation after cells were exposed to ZnO NPs at concentrations of 15 and 25 μg/mL under various irradiation conditions (Figure 4). Compared with controls, DCF fluorescent intensities increased by 12.8%, 33.9%, 148.1%, and 155.8% after 4 hours and by 39.2%, 145.9%, 288.9%, and 329.5% after 6 hours, respectively, in groups that exposed to 15 μg/mL ZnO NPs. Moreover, DCF fluorescent intensities increased by 74.5%, 78.9%, 172.3%, and 162.9% after 4 hours and by 96.6%, 254.1%, 408.5%, and 357.4% after 6 hours, respectively, in groups that exposed to 25 μg/mL ZnO NPs. In addition, DCFH-DA was also applied prior to the irradiation treatment, and the results were used to make comparison with testing with postirradiation-administrated DCFH-DA to better evaluate possible miss capturing of the free radicals or any potential bleaching/activating effect of irradiations on the dye molecules. Smaller increase in DCF fluorescent intensity was observed by applying the ROS dye beforehand compared with the postadministration of DCFH-DA (Figure 5). The highest value of DCF intensity was recorded after 3, 2, and 1 hours, respectively, in groups of dark incubation, visible light, and UVA irradiated, whereas no apparent peak intensity value was observed after 1 hour in the UVC-irradiated group. Nevertheless, a following intensity decline was observed after highest intensity appeared in all 3 irradiated groups. Among all irradiated groups, the highest DCF intensity was recorded in visible light-exposed group, and lower peak values were observed in the order of UVA and UVC. The comparison between groups of pre- and postadministration of DCFH-DA indicated a slightly higher DCF intensity in the preadministration group when both were under dark incubation, whereas distinctly different phenomena were seen in irradiated groups. Briefly, continual increases as well as increase–decrease patterns were observed in post- and pre-DCF administration groups, respectively.
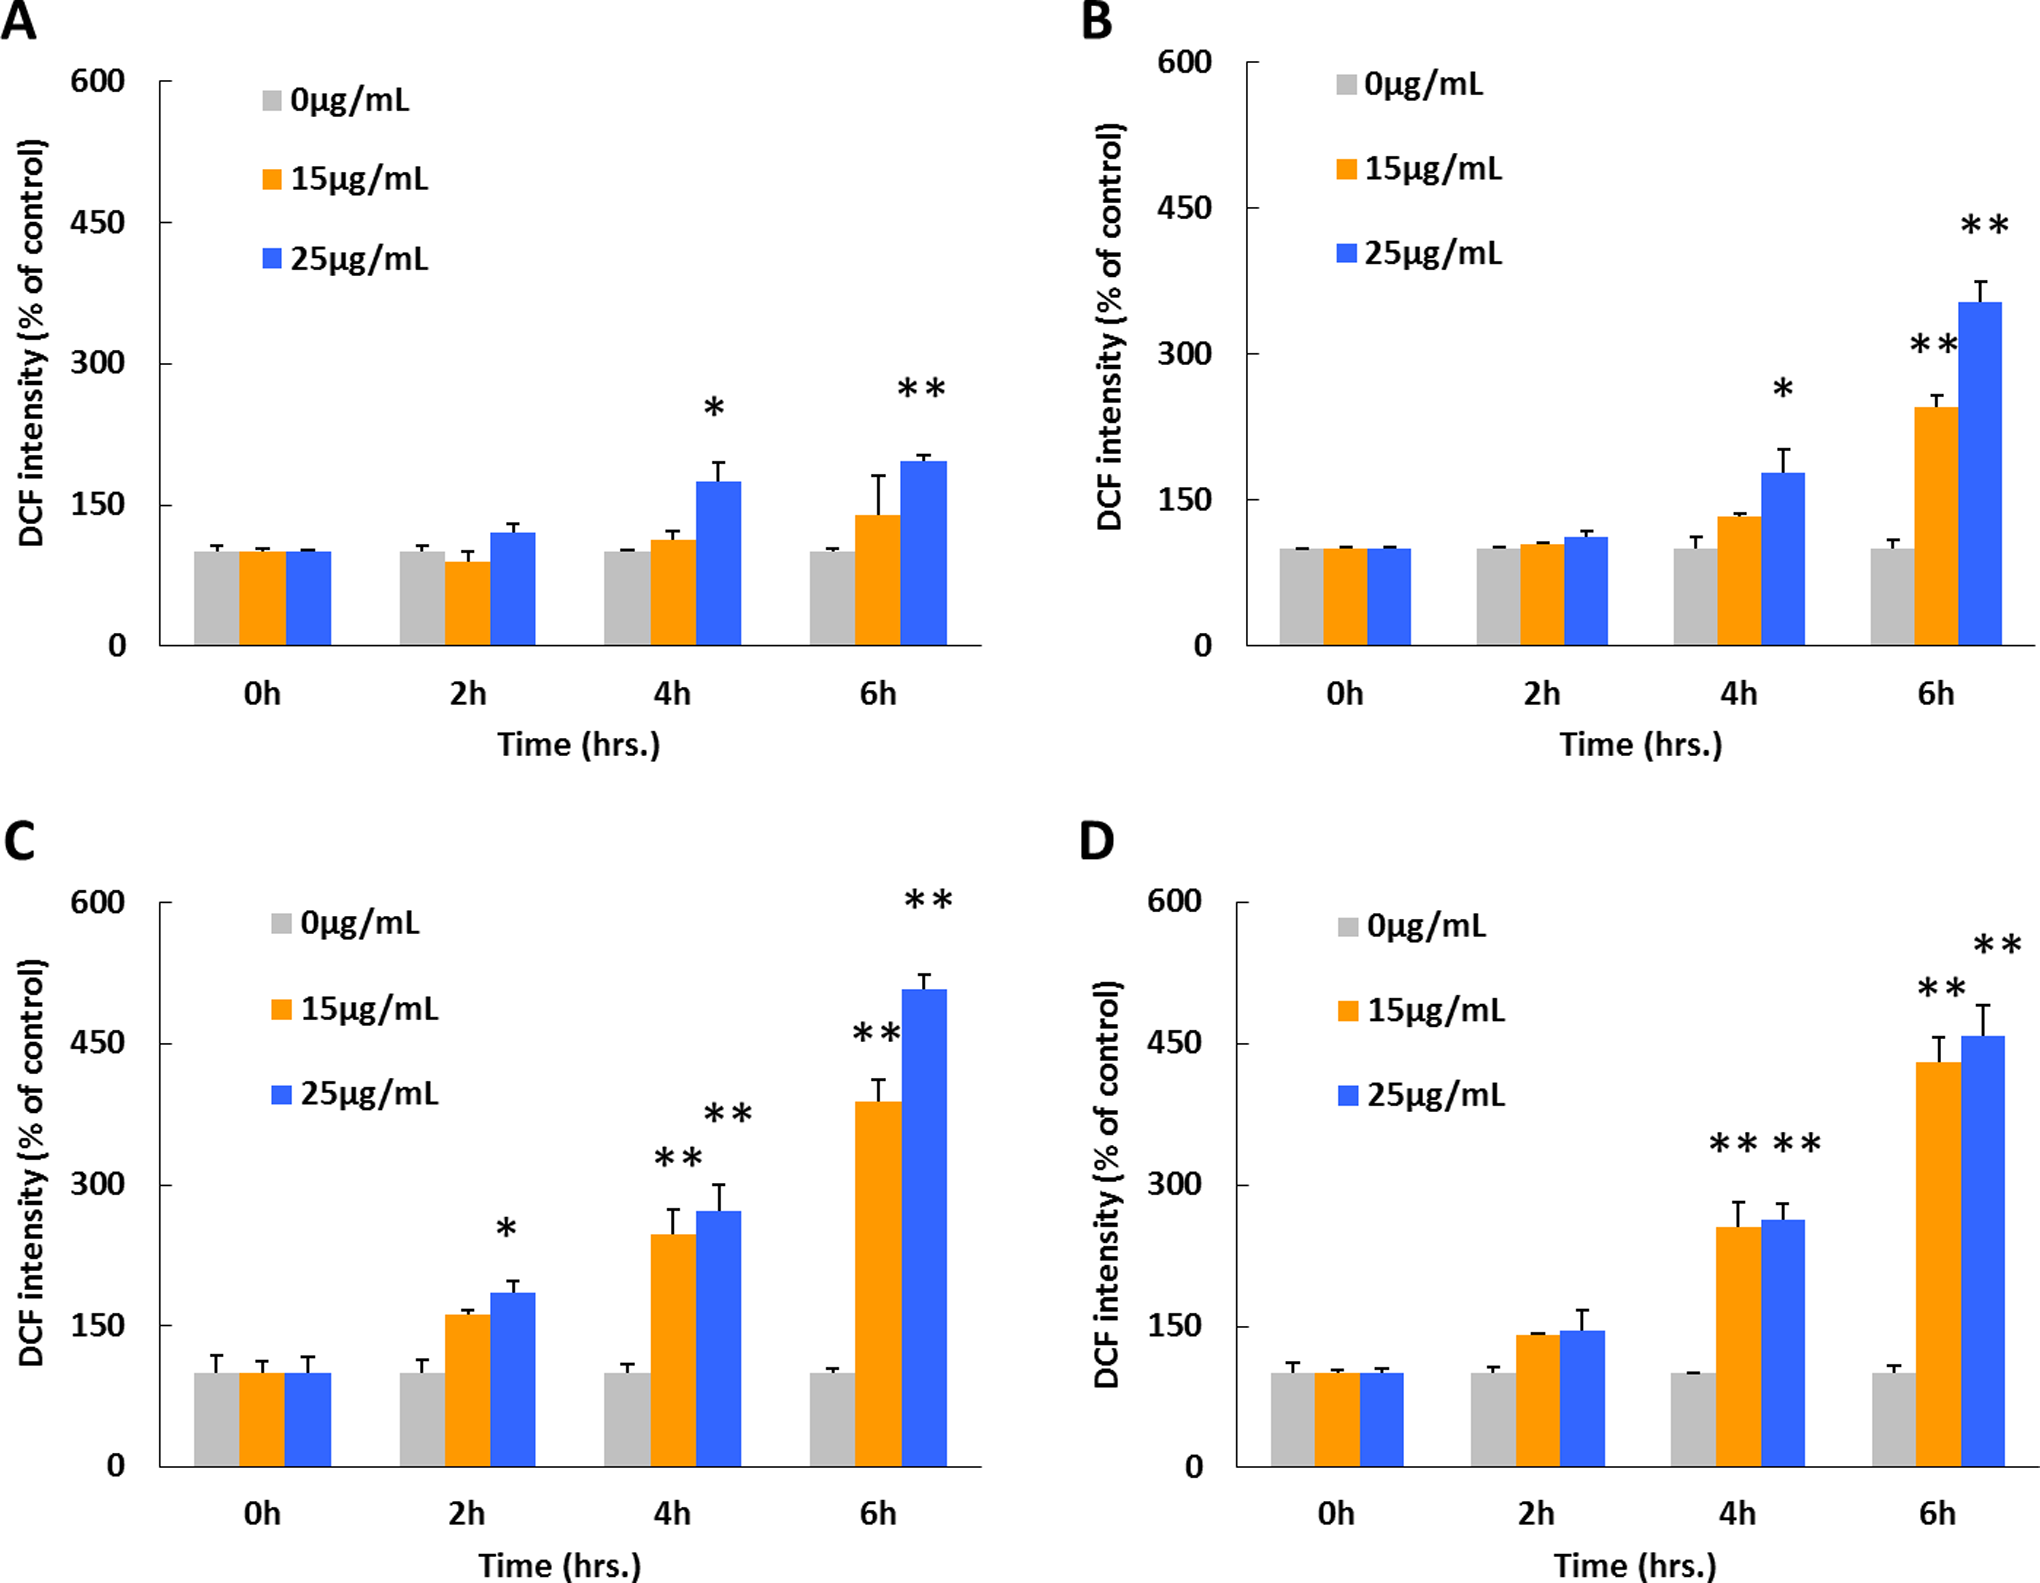
Effect of ZnO NPs on intracellular ROS generation under varied irradiation with postadministrated DCFH-DA. Seeded A549 cells were treated with ZnO NPs at dosages of 15 and 25 μg/mL for 6 hours under the following different conditions: (A) normal dark culture condition, (B) visible light illumination, (C) UVA irradiation, and (D) UVC irradiation. The DCFH-DA for ROS generation assay was added immediately after all irradiation treatments, and the fluorescent intensities were measured. Each bar represents the mean ± SD of 3 independent experiments. Statistical significance was set as “*” representing P < 0.05, and remarkable statistical significance was set as “**” representing P < 0.01. DCFH-DA indicates 2′,7′-dichlorofluorescin diacetate; NP, nanoparticle; ROS, reactive oxygen species; SD, standard deviation; UV, ultraviolet; ZnO, zinc oxide.
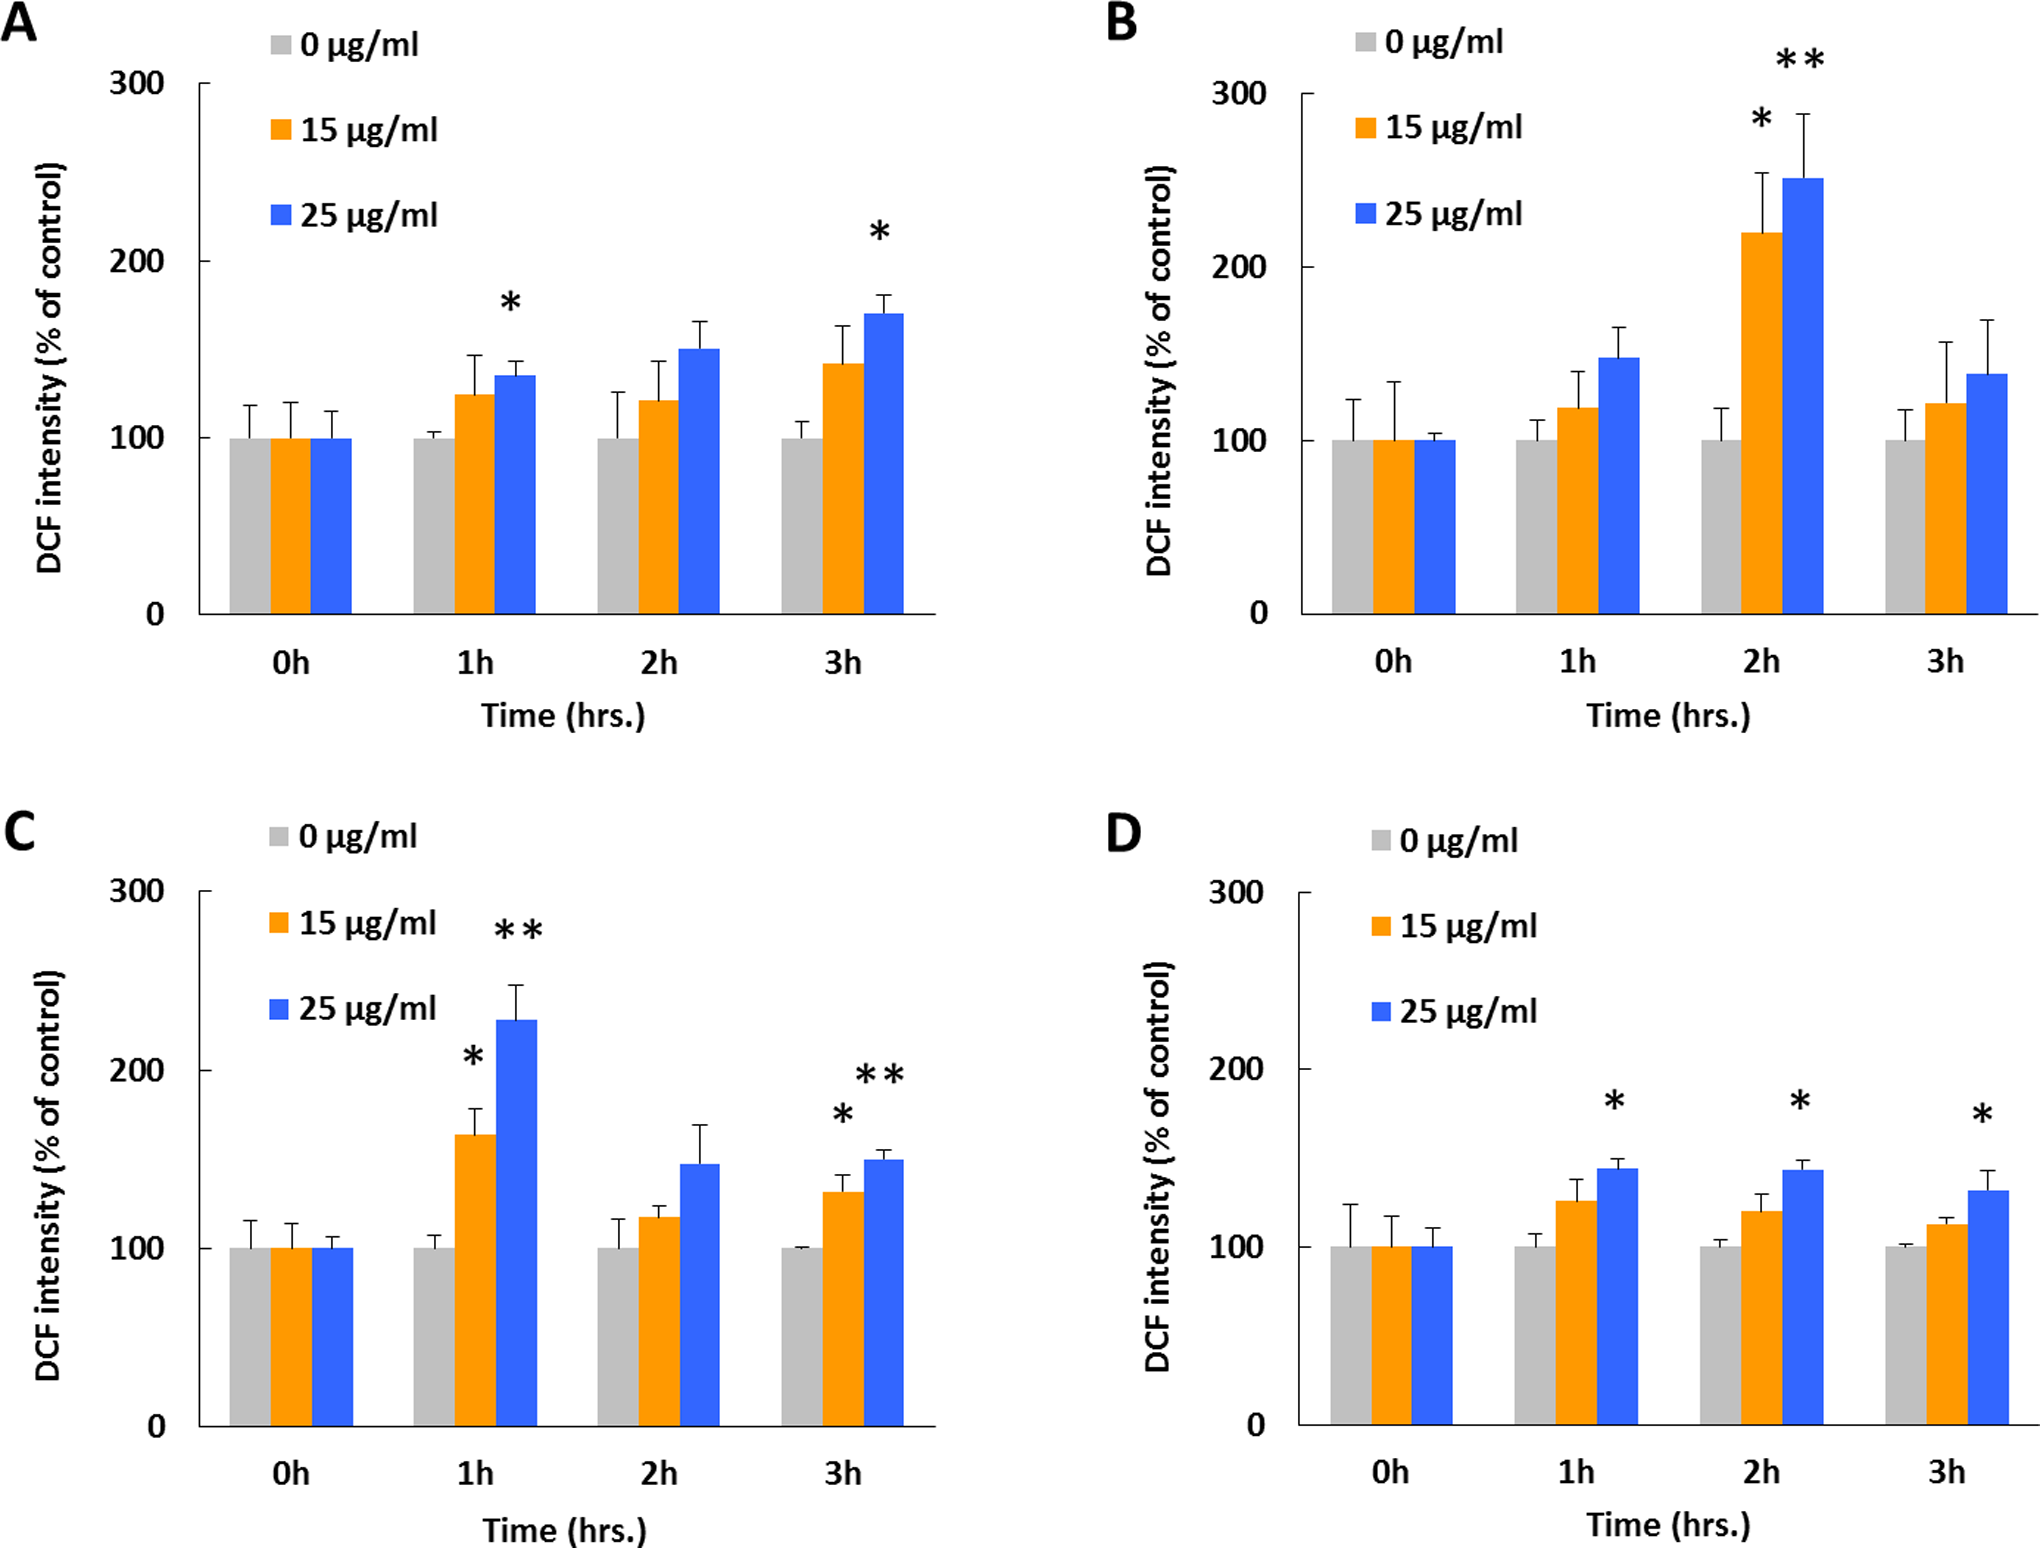
Effect of ZnO NPs on intracellular ROS generation under varied irradiation conditions with preadministrated DCFH-DA. Previous seeded A549 cells were prestained using DCFH-DA and then treated with ZnO NPs at dosages of 15 and 25 μg/mL combined with (A) normal dark culture condition, (B) visible light illumination, (C) UVA, and (D) UVC exposure for 3 hours. The DCFH-DA was added before ZnO NPs and illumination treatments for ROS generation evaluation and for studying the 2′,7′-dichlorofluorescein (DCF) fluorescent intensity photobleaching effect. Each bar represents the mean ± SD of 3 independent experiments. Statistical significance was set as “*” representing P < 0.05, and remarkable statistical significance was set as “**” representing P < 0.01. DCFH-DA indicates 2′,7′-dichlorofluorescin diacetate; NP, nanoparticle; ROS, reactive oxygen species; SD, standard deviation; UV, ultraviolet; ZnO, zinc oxide.
Cellular LDH Release After Exposure to ZnO NPs at Different Irradiation Conditions
Release of LDH to the cell culture medium has been widely used as an indicator for cellular membrane damage. Cells were exposed to ZnO NPs at concentrations of 15 and 25 μg/mL under various irradiation conditions (Figure 6). The LDH levels from the nonirradiated groups at 15 and 25 μg/mL ZnO NP doses gradually increased to 72.51 and 79.10 IU/L within 6 hours. In comparison, the control group acquired a 6-hour LDH level of only 13.18 IU/L. The LDH levels of all 3 irradiated cell groups initially increased but ultimately decreased with prolonged exposure time. The highest levels of LDH in visible light- and UVA-irradiated groups reached 92.3 and 105.5 IU/L (visible light) and 118.7 and 125.2 IU/L (UVA) after 4 hours of treatment. Meanwhile, LDH levels peaked at 125.2 and 118.7 IU/L under UVC exposure group after 2 hours treatment. The LDH levels of the control groups remained within the range of 6.59 to 13.18 IU/L (P < 0.05).
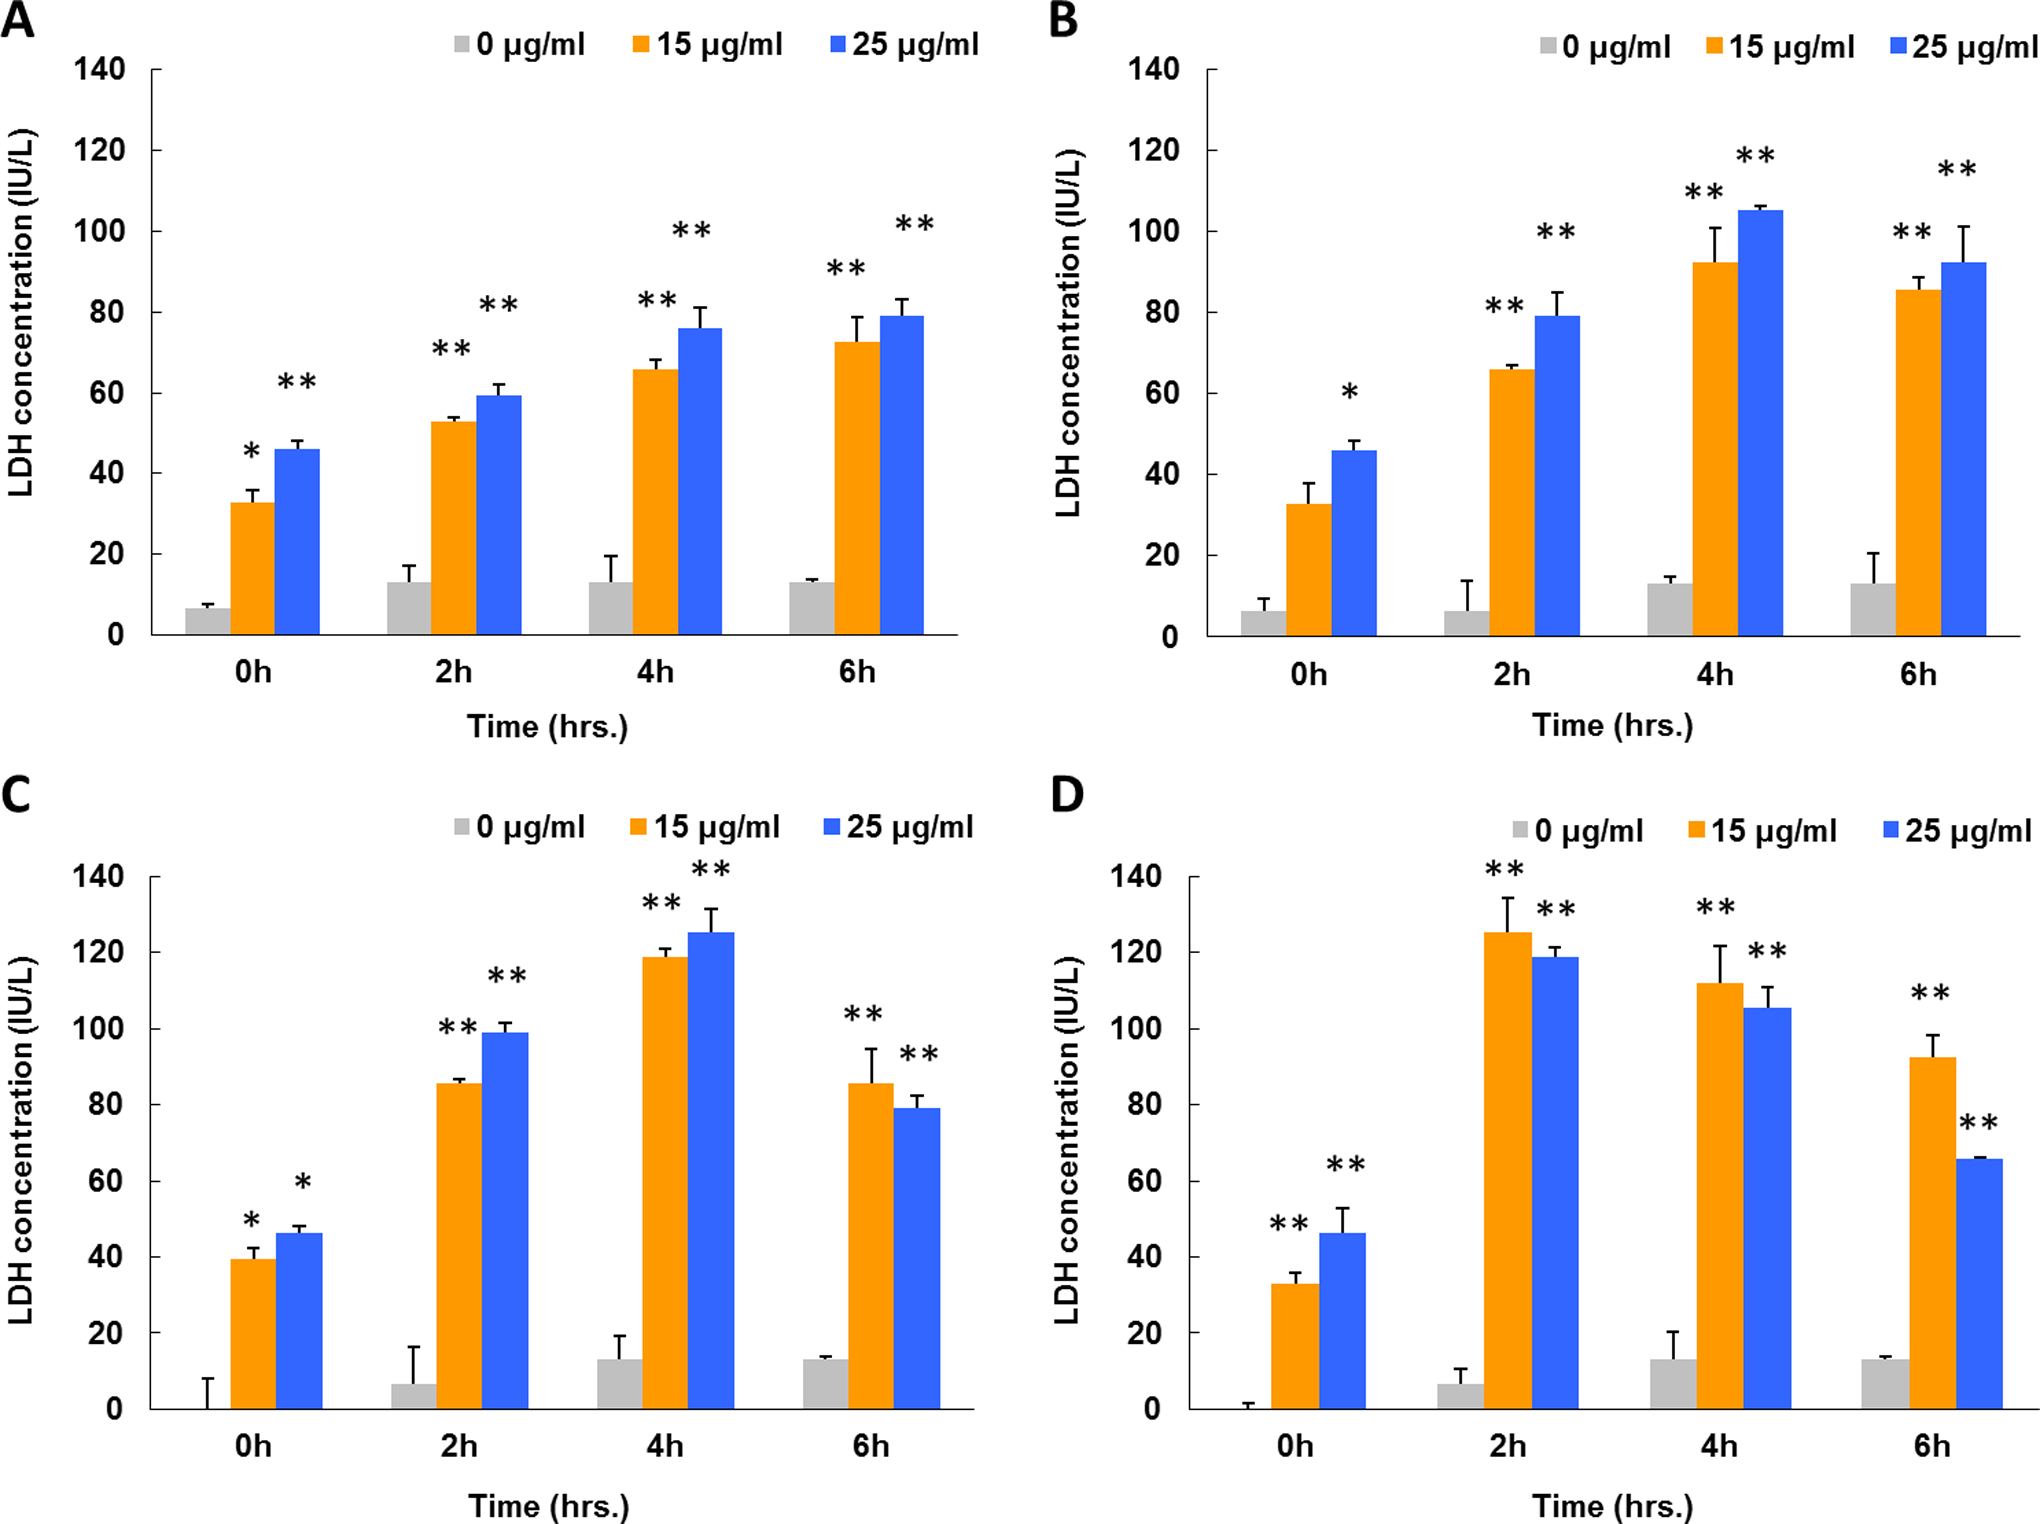
Lactate dehydrogenase levels in cell culture medium after 6 hours of exposure to ZnO NPs under various irradiation conditions. All A549 cells were treated with ZnO NPs at dosages of 15 and 25 μg/mL combined with (A) normal dark culture condition, (B) visible light illumination, (C) UVA irradiation, and (D) UVC irradiation. Lactate dehydrogenase-correlated nicotinamide adenine dinucleotide (NAD+) levels were measured by UV/Vis photometer at 340 nm. Each bar represents the mean ± SD of 3 independent experiments. Statistical significance was set as “*” representing P < 0.05, and remarkable statistical significance was set as “**” representing P < 0.01. NP indicates nanoparticle; SD, standard deviation; UV, ultraviolet; ZnO, zinc oxide.
Intracellular Damages Induced by ZnO NP Exposure and Irradiation
To assess the levels of cell nucleus damage at different exposure conditions, fluorescent dyes and imaging technique were used to acquire semiquantitative results. The DCFH-DA combined with cell nuclei marker DAPI was used to conduct this portion of the study. A549 cells were exposed to 0, 15, and 25 μg/mL ZnO NPs for 6 hours under varied irradiation conditions. Images of fluorescein isothiocyanate (FITC), DAPI, white (visible) light phase contrast, as well as fluorescent merging channels were taken and categorized for each irradiation condition (Figure 7). The FITC channel intensities, which were analyzed using ImageJ software, indicated that intracellular DCF intensity was correlated with the generation of ROS. The data illustrate that signal intensity increases with increasing ZnO NP concentration under each irradiation condition (Figure 7, FITC channel). Control cells exposed to visible light, UVA, and UVC irradiations increased DCF intensity by 60.7%, 23.3%, and 30.7% compared with the nonirradiated cells. For the cells that were treated with a 15-μg/mL dose of ZnO NPs, the DCF intensities under nonexposure, visible light, UVA, and UVC irradiation conditions increased by 58.8%, 108.9%, 94.4%, and 119.0%, respectively; for the cells that were treated with 25 μg/mL dosage ZnO NPs, the DCF intensities increased by 88.5%, 114.8%, 127.9%, and 128.8%, respectively, under the same conditions.
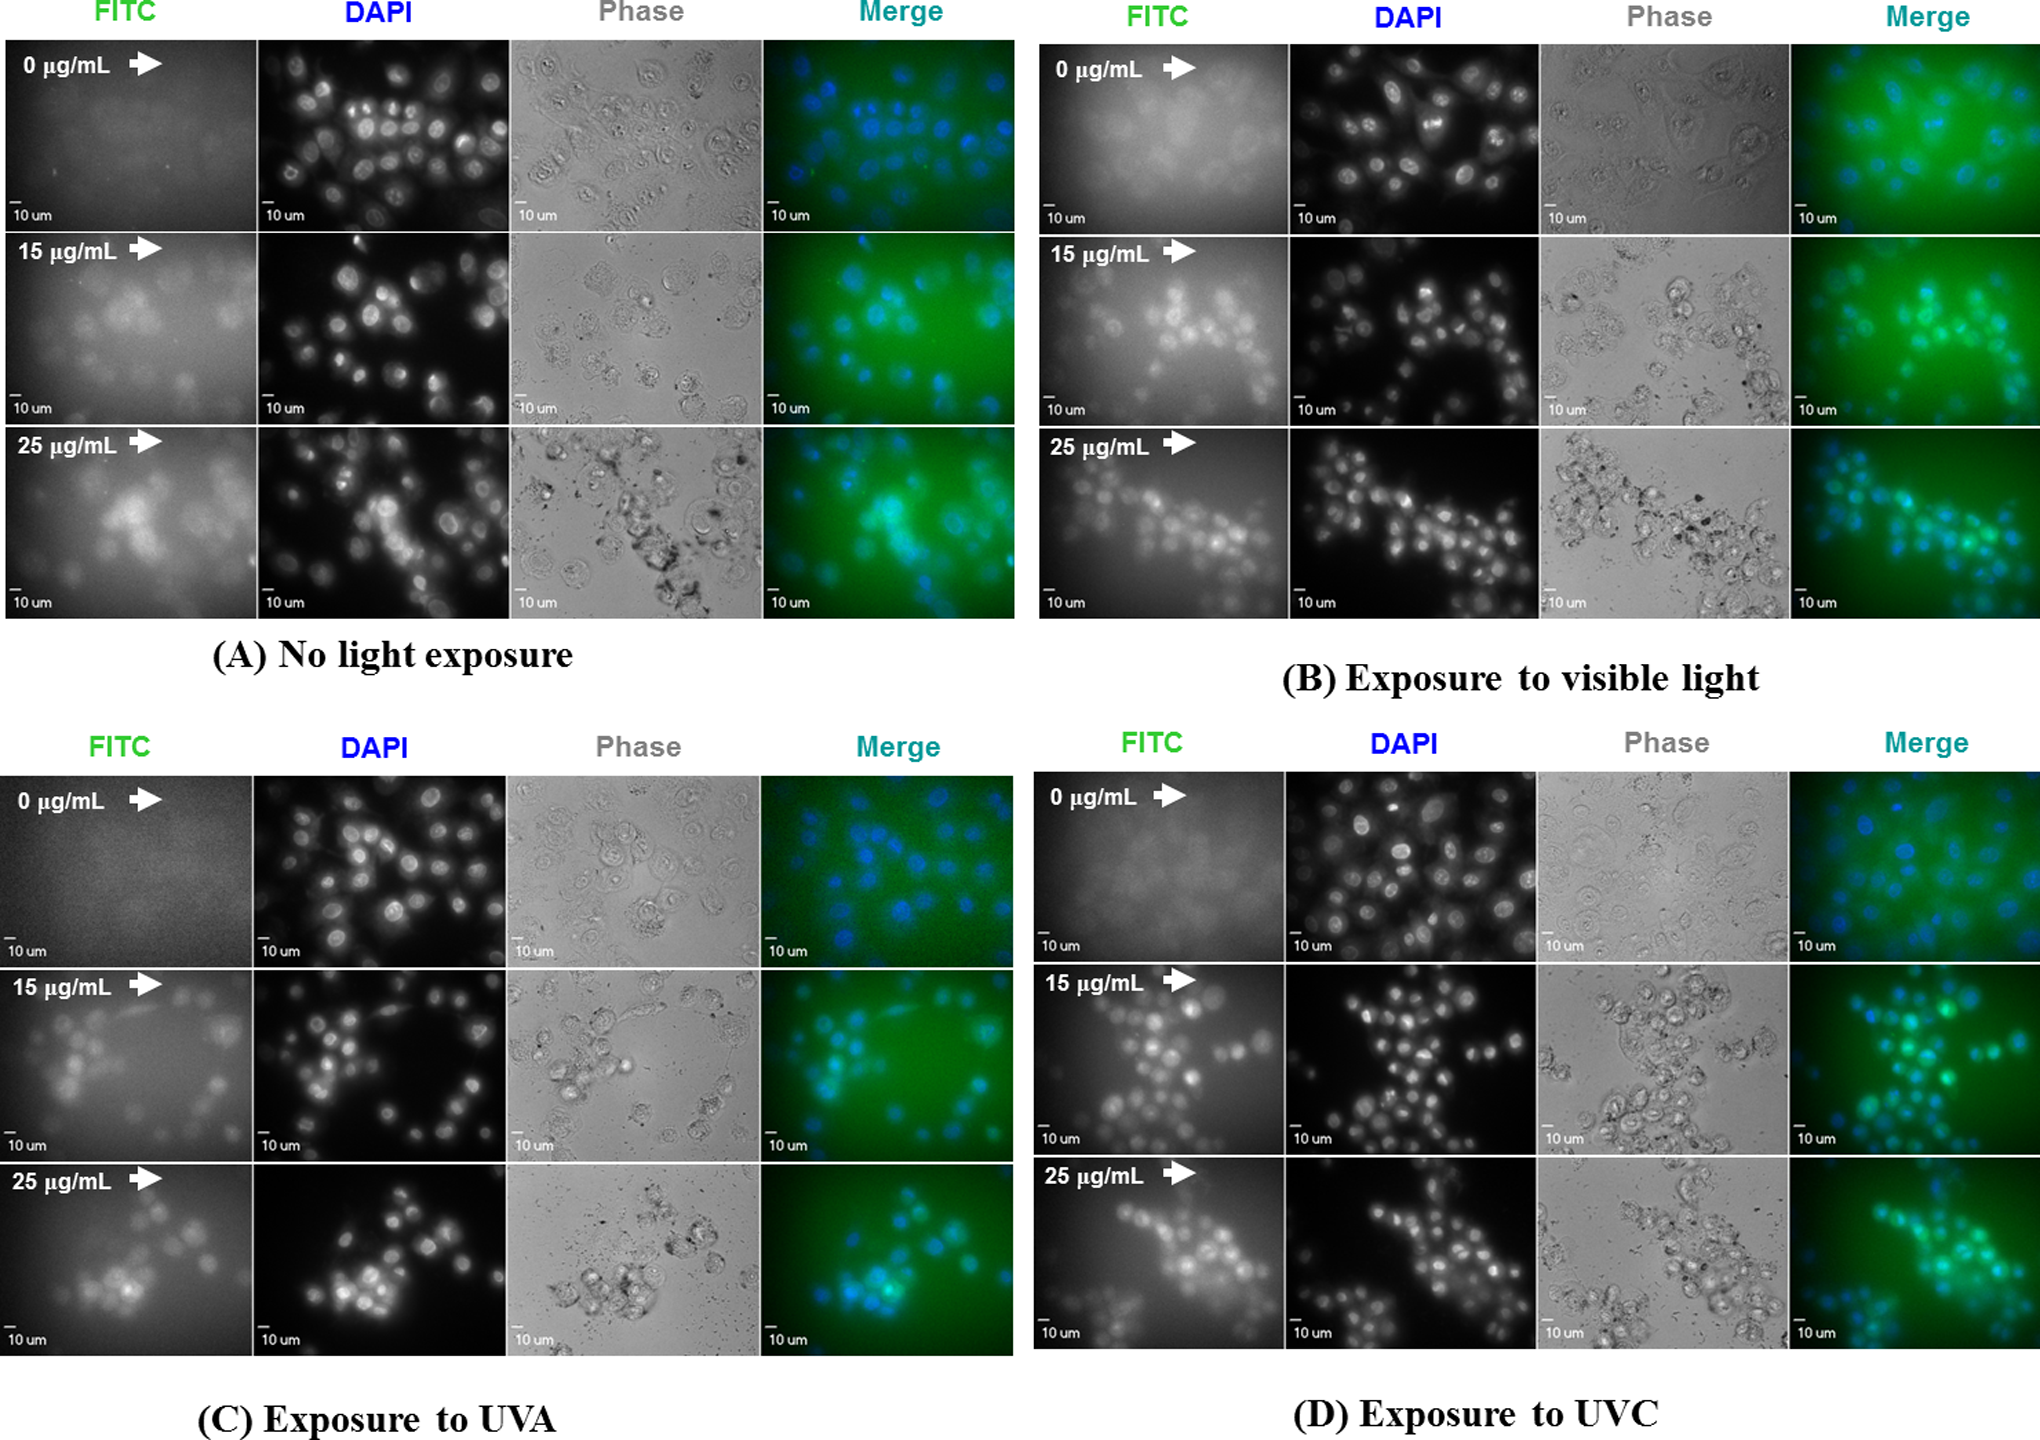
Fluorescent and phase contrast microscopic images of A549 cells that were treated with 15 and 25 μg/mL of zinc oxide (ZnO) nanoparticles under different irradiation conditions for 6 hours. Fluorescein isothiocyanate (FITC), 4′,6-diamidino-2-phenylindole (DAPI), phase contrast channels, as well as merged fluorescent images were captured. 2′,7′-Dichlorofluorescein (DCF) intensity in cell groups was quantified by ImageJ software.
A549 cell nuclei stained with DAPI exhibited a shrinking pattern with enhanced fluorescence intensity, a typical phenomenon of cell damage. The images indicated that the DAPI fluorescence intensities increased with ZnO NP doses for all 4 groups. Greater damage occurred in the irradiated groups than in the nonirradiated group (Figure 7, DAPI channel). The levels of cellular damage, represented by cell shape shrinkage and nuclear morphological transformation, became increasingly severe under the following order of exposure conditions: dark < visible light < UVA < UVC, as is shown in the phase contrast channel (Figure 7, phase channel). The ZnO NP agglomerates can be seen in the 15 to 25 μg/mL doses in each irradiation treatment; however, smaller sized agglomerates were observed in UVA- and UVC-irradiated groups.
An overlap of FITC and DAPI fluorescence signal in merged images was also arranged to show the status of nuclear damage and cell death. The overlapping percentage of these 2 fluorescent signals in 0, 15, and 25 μg/mL ZnO NPs-treated cells gradually increased in all 4 illumination groups (Figure 7, merge channel). Steep peaks of FITC- and DAPI-merged fluorescent signals in the 3-D surface plot images indicate severe cell shrinkage as well as cellular damage (Figure 8). Moreover, higher and sharper peaks were observed in an increasing order from nonirradiated to UVC-exposed groups (left to right) as well as from 0 to 25 μg/mL dose levels (up to down). This indicated that cell shrinkage occurred as a function of both illumination and ZnO dosages (Figure 8).
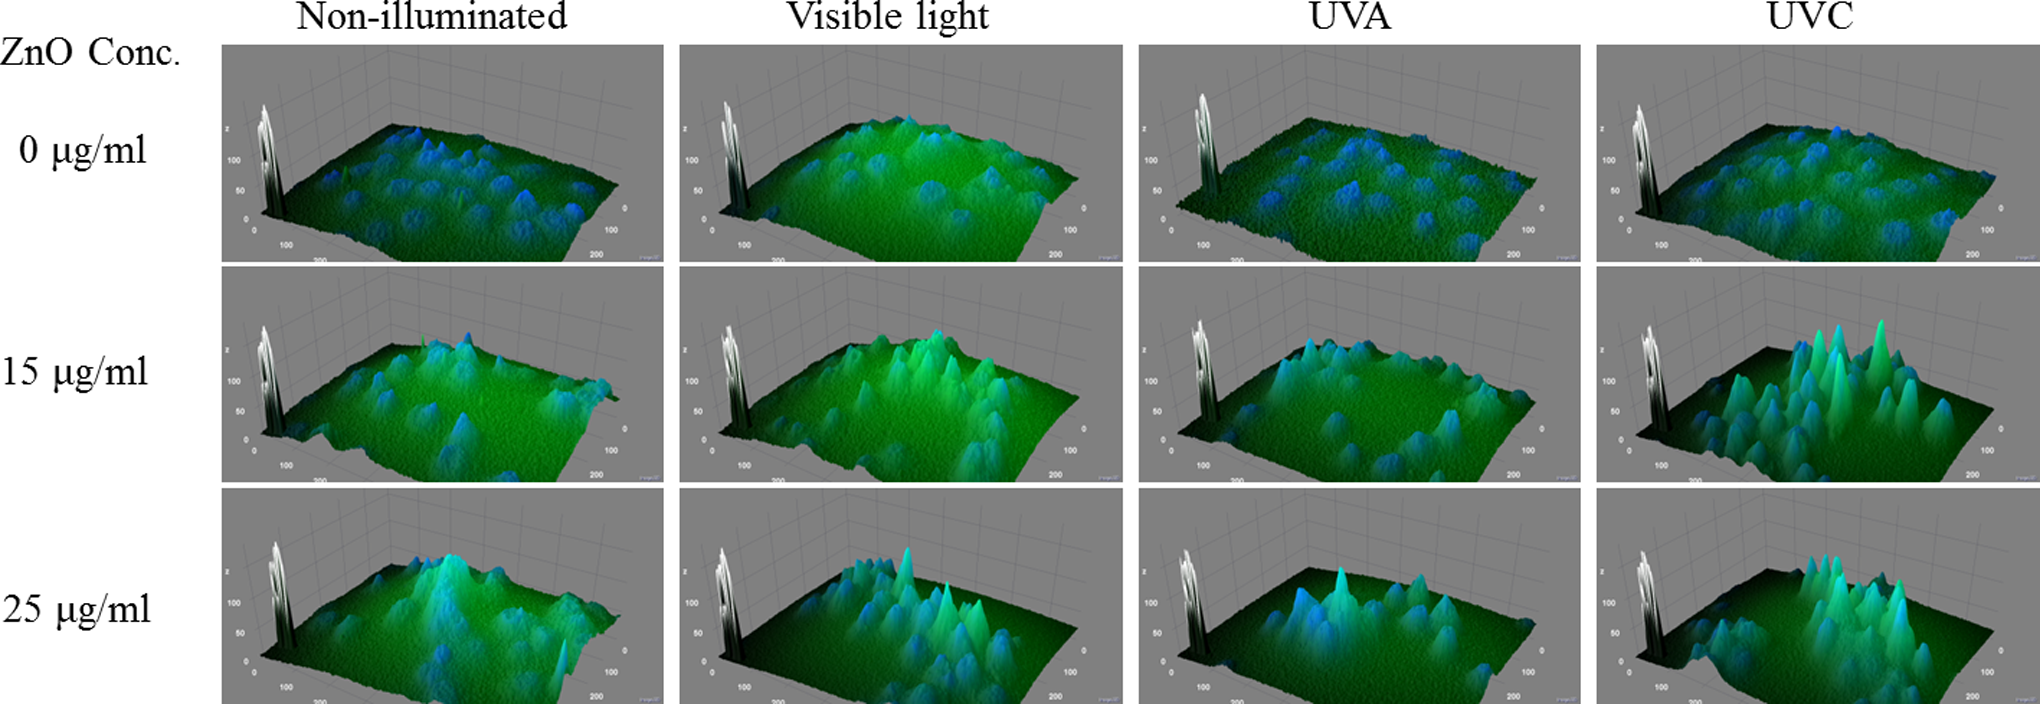
Three-dimensional surface plots of fluorescein isothiocyanate (FITC) and 4′,6-diamidino-2-phenylindole (DAPI)-merged images of A549 cells that were treated with ZnO nanoparticles (NPs) under varied irradiation conditions. The merged images were processed and plotted using imageJ software.
Remediation of Cytotoxicity Induced by ZnO NPs and Varied Irradiations Using NAC
Remediation effects of an antioxidant NAC was further used as a cell viability recovery test. A549 cells that were exposed to ZnO NPs combined with different irradiation conditions and different dosages of NAC were used to examine changes in cell viabilities. The doses of NAC were 0, 0.1, 0.3, and 0.5 mmol/L, and exposure time was 24 hours (Figure 9). Cell viability without addition of NAC was measured as 80%, 50%, 37%, and 36% of control after 24-hour exposure to 25 μg/mL ZnO NPs under nonirradiation, visible light, UVA, and UVC exposure conditions, respectively. At 0.1, 0.3, and 0.5 mmol/L NAC levels, cell viabilities increased to 83%, 87%, and 95% in the nonirradiation group, respectively, 62%, 81%, and 89% in the visible light exposure group, 43%, 57%, and 74% in the UVA exposure group, and 40%, 54% and 71% in the UVC exposure group.
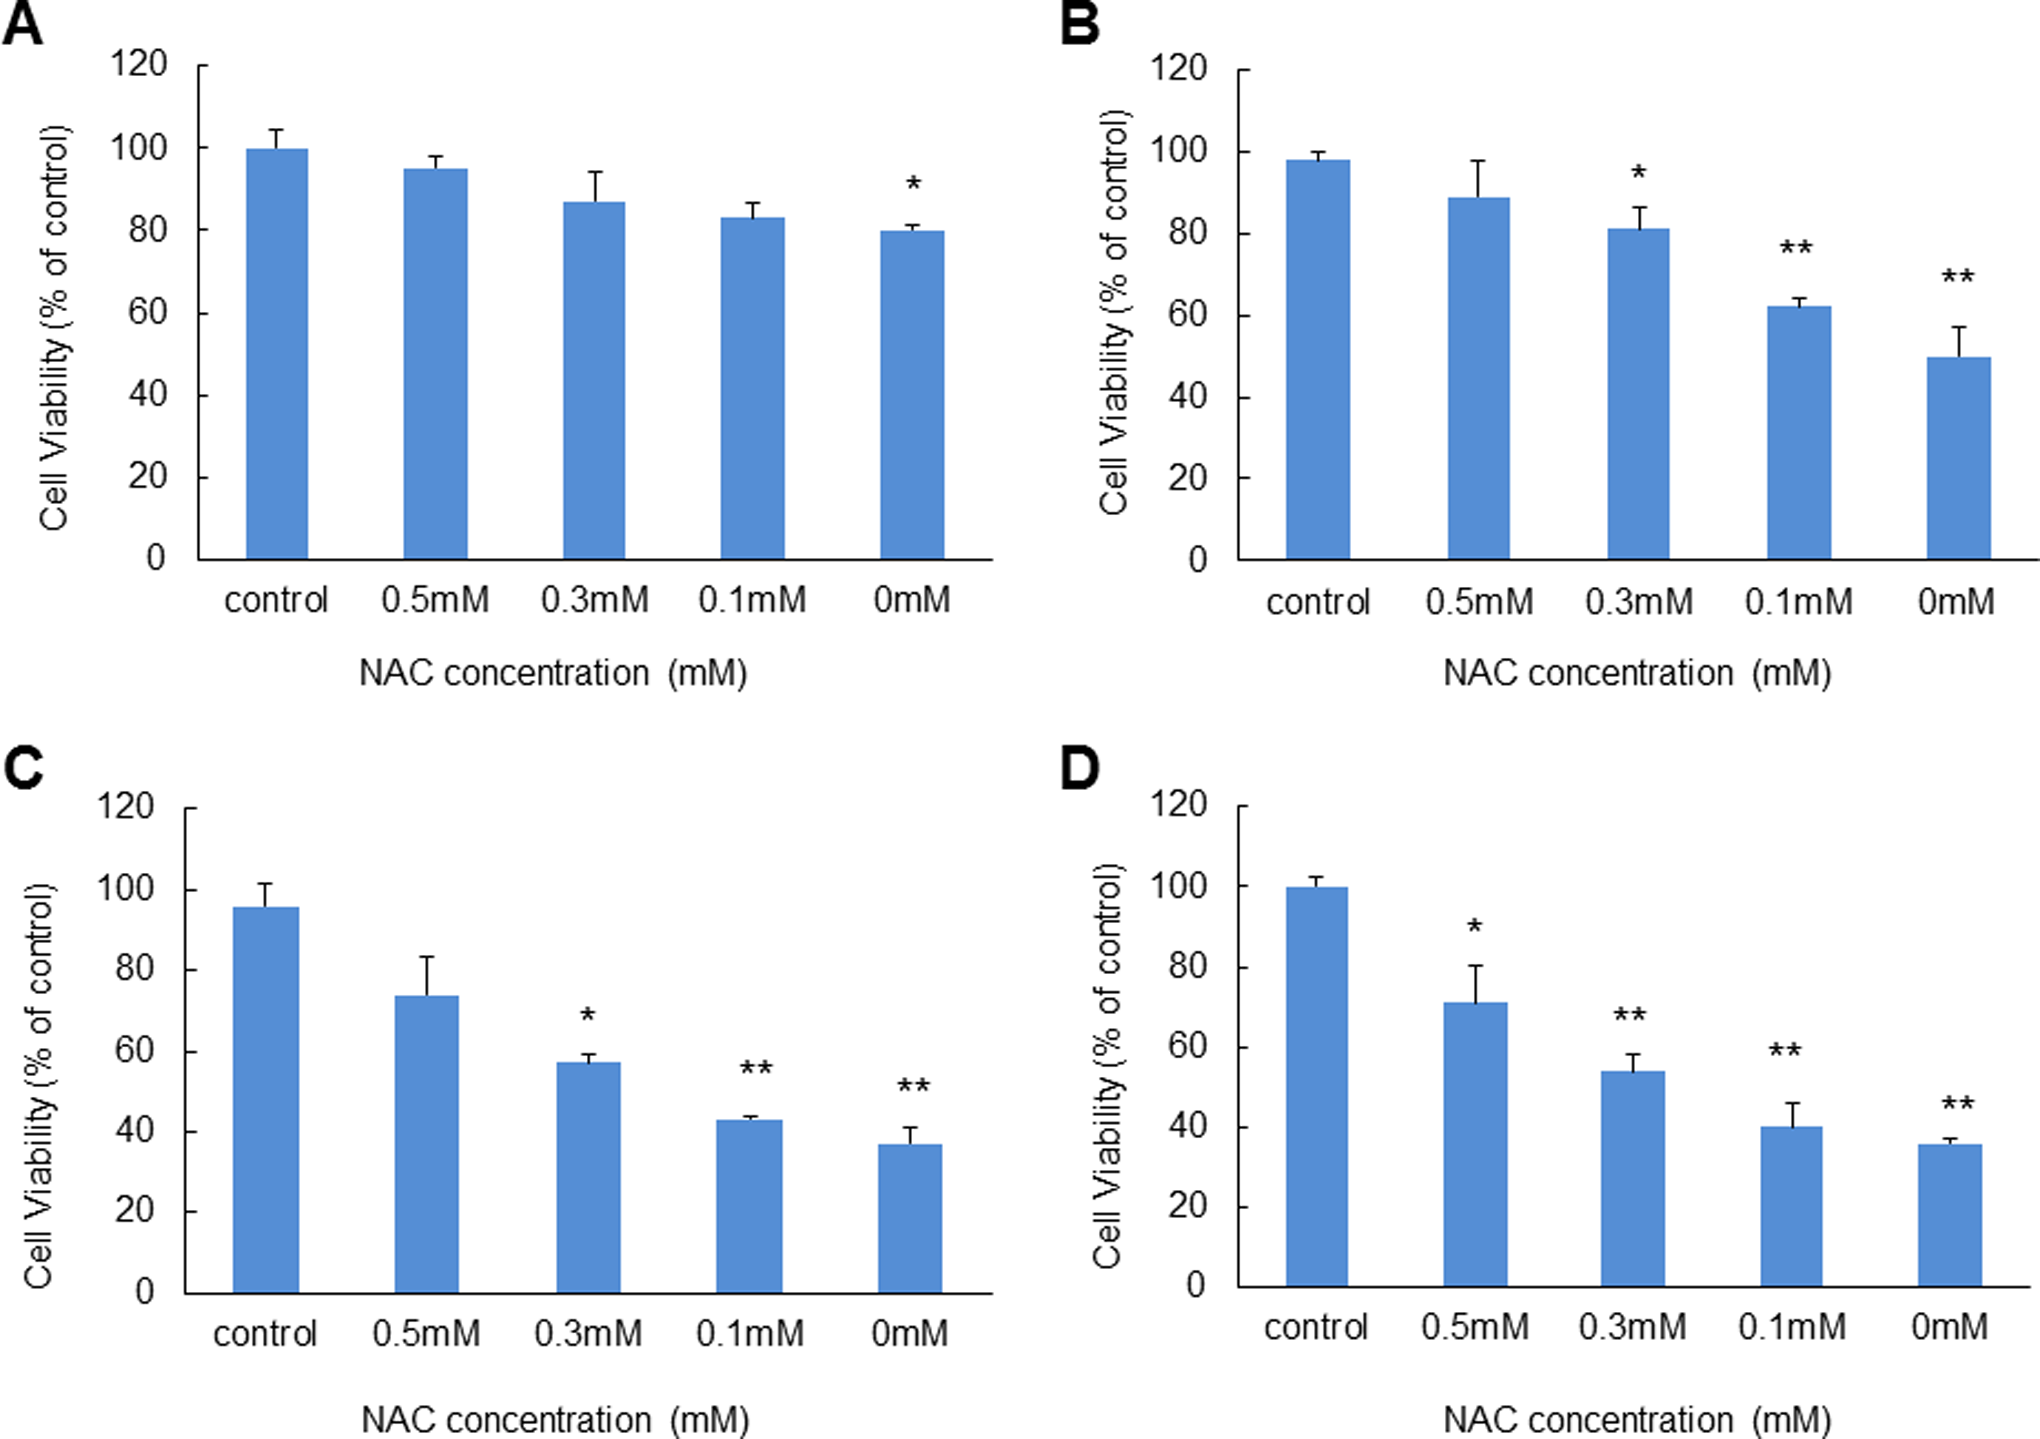
Remediation effect of antioxidant N-acetylcysteine (NAC) on A549 cells against cytotoxicity induced by ZnO NPs and varied irradiations. The ZnO NP concentration was 25 μg/mL, and the irradiation exposure time was 24 hours. N-Acetylcysteine concentrations added: 0, 0.1, 0.3, and 0.5 mmol/L. A, Normal dark culture condition; (B) visible light illumination; (C) UVA irradiation; and (D) UVC irradiation. Acetomethoxy derivate of calcein was used for cell viability measurement. Each bar represents the mean ± SD of 3 independent experiments. Statistical significance was set as “*” representing P < 0.05, and remarkable statistical significance was set as “**” representing P < 0.01. NP indicates nanoparticle; ZnO, zinc oxide; UV, ultraviolet.
Tunneling Electron Microscopy Images of Intracellular ZnO NPs
In order to evaluate the cytotoxic effects of ZnO NPs on the intracellular structure and cell organization, TEM images were taken from cells that were exposed to ZnO NPs. A549 cells were preseeded onto thin layer carbon membranes followed by treatments with ZnO NPs under dark culture conditions, ZnO NPs under visible light irradiation, and with normal dark incubated cells serving as a control. After 6 hours of treatment, all samples were fixed with 2.5% glutaraldehyde solution in serum-free F-12K cell culture medium overnight and then dehydrated using ascending ethanol solutions of 50%, 70%, 80%, 90%, and 100% concentrations. Samples were finally soaked in gradient HMDS/ethanol solutions and imaged by Tecnai F20 TEM. Intracellular structure damage was observed in the nonirradiated ZnO NP group and ZnO NP group exposed to visible light, while the intracellular structures of the control group cells remained well organized (Figure 10A). Gray or black randomly distributed intracellular agglomerates were observed in cell debris in both ZnO NP-treated groups; however, more agglomerates with diverse shapes and sizes were observed in the irradiated cells than those of nonirradiated ones. The details of cellular destruction by ZnO NPs without irradiation are shown in Figure 10B. Aggregates were observed attached to or embedded in cellular cavity edges, indicating severe necrosis and cellular mass loss that the cells were undergone.
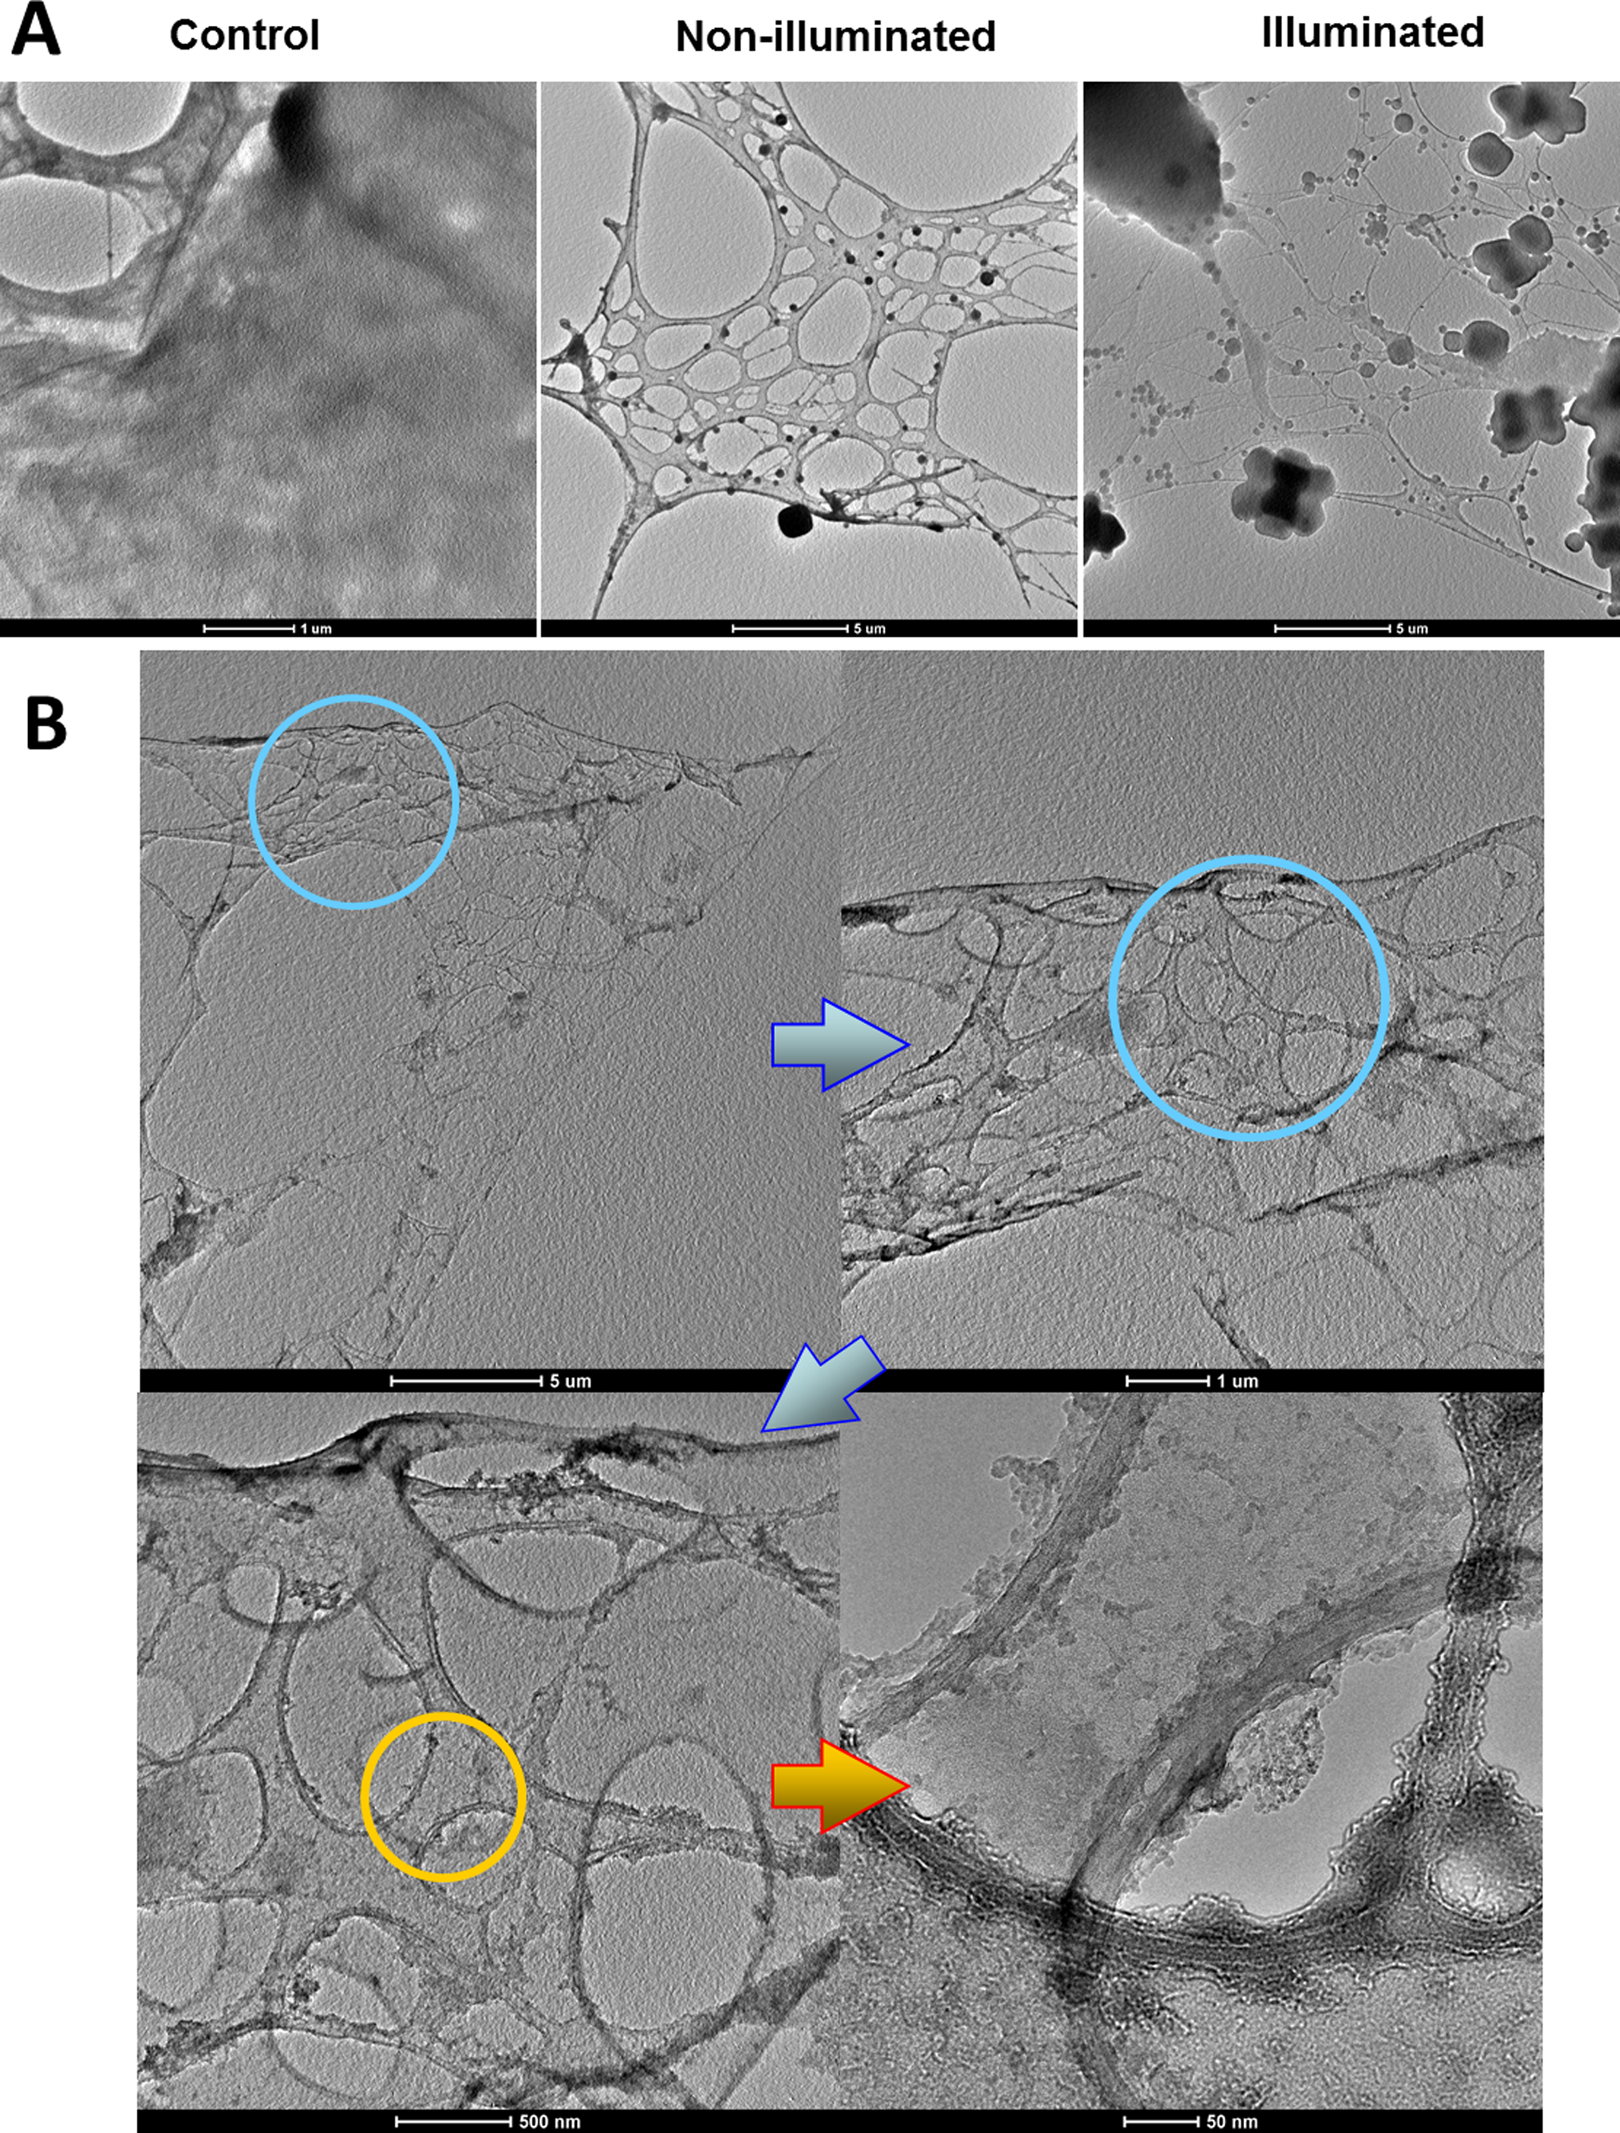
The TEM images of cellular destructions by ZnO NPs and irradiation treatment. A549 cells were preseeded onto the thin layer TEM carbon-nickel grid followed by treatments with 25 μg/mL ZnO NPs only or 25 μg/mL ZnO NPs plus visible light illumination. Normal dark incubated cells were set as control. After 6 hours treatment, cells were fixed overnight, followed by ethanol-assisted dehydration and hexamethyldisilazane (HMDS) soaking. A, Comparisons of cellular destruction in cells among control, ZnO NPs only, and ZnO NPs plus visible light illumination and (B) detailed structure destruction and NPs distribution. Pictures were taken with a Tecnai F20 STEM with varied scale bars of (A) 1, 5, and 5 μm (left to right), (B) 5 μm, 1 μm, 500 nm, and 50 nm (up left to bottom right). NP indicates nanoparticle; TEM, tunneling electron microscopy.
Discussion
Toxicity studies conducted on micro- or nanoscaled ZnO materials by several research groups, both in vitro and in vivo, have demonstrated toxic effects potentially relevant to human exposure. In our previous studies, we demonstrated a specific, dosage-dependent cytotoxicity of 60 to 80 nm and 420 nm ZnO on A549 cells. 15,37 However, there are only a few published data regarding the cytotoxicity of ZnO NPs under different irradiation conditions. 18,20 In this study, the cytotoxicity of 60 to 80 nm ZnO NPs under different irradiation conditions was investigated on the A549 cell line.
The results of this study suggest that 60 to 80 nm ZnO NPs carry cytotoxicity effects at dose levels of 15 to 25 μg/mL, occurring in a dose-, time-, and irradiation-dependent manner. Investigations into cellular ROS generation demonstrated higher oxidative stress levels in irradiated groups as given by the following order: dark < visible light < UVA ≈ UVC. The LDH activity appeared attenuated under prolonged irradiation; however, cell membrane damage was observed, verifying worsening cellular conditions. A strong inverse relationship between decreasing cell viability and increasing ROS levels after 12 to 15 hours suggested that oxidative stress is the primary cause of cell death under the exposure conditions. These findings are partially in agreement with an in vivo study by Xiong et al 38 insofar as irradiation induced higher cytotoxicity caused by ZnO NPs. The authors showed acute toxicity, oxidative stress, and oxidative damage in zebra fish after treatment with ZnO NPs with more pronounced effects under visible light irradiation. Despite this, similar toxic effects of ZnO NPs, bulk ZnO suspension, and Zn2+ solution were reported in their study, which at the time was different from our prior conclusions. This discrepancy prompted the need for a more comprehensive mechanism study, as embodied by this study, to elucidate the toxic effects of NPs under varied irradiation sources.
Throughout the study, the actual or effective size of the nanomaterial must be known and maintained. Failure for doing so may ruin subsequent particle size-related data analysis, and, hence, may render false conclusions. Indeed, it has been perceived that smaller particles have a greater toxicity. 39 -41 Our previous study 42 suggested that hydrodynamic size, rather than manufactured particle size, dictated the physicochemical properties and thereby, the cytotoxic effects of the NPs. Detailed SEM images (Figure 1) provide coincident evidences of this size discrepancy due to their hydrodynamic property. In preparation of this study’s NPs, ZnO NPs were initially mixed with ultrapure water, followed by 15 minutes of either vortexing or ultrasonication. Droplets of these freshly prepared ZnO NP suspensions were immediately dehydrated in vacuum and analyzed with SEM. Particle aggregates with diverse diameters ranging from 10 μm to 100 nm were observed. Given this breadth of size, all subsequent data were based on the hydrodynamic aggregates. Furthermore, aggregate scales (diameter, thickness, etc) seemed to vary significantly with and without ultrasonication pretreatment (Figure 1A-C). A closer view revealed more complicated surface structures with “deep” grooves in those samples lacking ultrasonication (Figure 1D and E), although there were no significant size differences between groups. This study then suggests that aggregation occurred primarily due to 2 factors: particle surface charge and solvent surface tension. Ultrasonication treatment removes fine air bubbles attached to the surface of the NPs, thereby weakening the surface tension-induced hydrophobicity, and ultimately maintaining smaller aggregation size. Given the size range of the aggregates (Figure 1F), it was hypothesized that a dynamic nucleation and precipitation process may occur. Thus, chronic cytotoxic or genotoxic effects on cells may present, depending on the equilibrium of the dynamic process. Particularly, if the stability of the whole system is high enough, then a colloidal system should further be considered, as few cytotoxic studies have dealt with colloidal systems. Therefore, the interactions between the cells and the NPs may not be significantly influenced by the manufactured particle size; rather, it will be highly affected by the NPs hydrodynamic size as well as the nucleation–precipitation dynamic equilibrium. This is a topic that requires further investigation.
The ZnO NPs are widely used in daily care products such as cosmetics, sunscreen lotions, and facial creams. Although the cytotoxic effects have been thoroughly studied under normal dark incubation conditions, the cytotoxic effects of ZnO NPs under different irradiation conditions have not been thoroughly addressed. In this study, our findings demonstrate that the cytotoxic effects of ZnO NPs are significantly enhanced under irradiation. Our previous studies showed that ZnO NPs were cytotoxic within the narrow dose range of 15 to 20 μg/mL. To revalidate this, a similar dose range (0-25 μg/mL) was used for 32 hours under visible light in comparison to the dark incubation control group (Figure 2). The cell viability results in Figure 2A are in agreement with the previous data, showing strong cytotoxic effects at concentrations ≥15 μg/mL. The higher dosing levels (15, 20, and 25 μg/mL ZnO NPs) however, exerted a 10% higher cytotoxicity than compared with the nonirradiated cell group. In this way, visible light irradiation enhances the cytotoxic effects of ZnO NPs. It has been well acknowledged that ZnO has characteristic photocatalytic properties. A strong conjecture toward this phenomenon is that visible light irradiation can promote electrons from valence bands to conductive bands, which can enhance greater levels of free radical generation (Figure 4). It was noted that more drastic cell viability changes occurred within the first 9 hours in both groups, suggesting quick destructive processes. Consequently, a more detailed viability study was conducted within the first 15 hours of treatment of ZnO NPs (Figure 3). In this study, 2 more irradiation sources were added, either with emission peaks at 375 nm (UVA) or 254 nm (UVC). Similar cell viability decreases were obtained in nonirradiated and visible light-irradiated groups (Figure 3A and B) compared with the results in Figure 2, whereas those groups treated with UVA and UVC irradiations (Figure 3C and D) had higher death rates. Since UV irradiation itself is harmful to cells, cell viability would suffer even when there are no ZnO NPs being added. Therefore, all control groups in each irradiation test were treated with the same irradiation to eliminate the inherent cytotoxicity of UV light. A separate test (data not shown) conducted within the same time scale, with different irradiations but without ZnO NPs, revealed minor viability variations (<10%) when compared with the dark incubated cell group. This indicated that irradiation alone was negligible (Figure 3) in relation to the viability changes associated with the coupling of ZnO NP treatment and irradiation. This conclusion was found to be valid in a subsequent imaging trial with fluorescent dyes (Figure 6). The data in Figure 3 also show that shorter wavelengths caused greater cell losses than the visible light. The possible reason for this phenomenon has been attributed to the chemicophysical properties of ZnO NPs. When the excitation photons have energy higher than ZnO band gap (∼3.6 eV, 375 nm), outer electrons will be promoted and thereby favor free radical generation, which is highly cytotoxic. The data quantitatively demonstrated that the cytotoxicity of ZnO NPs was dose, time, as well as irradiation wavelength dependent. Furthermore, irradiation enhanced the cytotoxicity of ZnO NPs significantly, especially within the first 8 to 16 hours, further indicating that photocatalytic reactions were dominant during this early stage of cell destruction.
Two following studies were conducted to examine ROS generation as well as cell membrane disturbances (as shown in Figures 4 –6). Basically the first 3 to 6 hours were chosen for investigation because cells may undergo severe destructive process before a dominant cell death period occurred within this time period. It was found that ROS generation occurred as the function of all 3 factors: NPs dosage, duration time, and irradiation wavelengths (Figure 4). An ROS-specific fluorescent dye, DCFH-DA, was used to quantify the ROS generation, and pre- or postirradiation exposure was tested to assess the amount of ROS under each condition. Although only a slight difference was observed when cells were incubated under the dark incubation, distinctly different results were obtained under irradiations (Figures 4 and 5). This large variation may attribute to: (1) larger amount of ROS generated under irradiation; (2) photobleaching or photoactivation of DCF dye molecules; and (3) more free radicals captured for preaddition of DCFH-DA. Based on the phenomena that less DCF intensity variations between pre- and postadministration under dark incubation and the large intensity differences under all irradiated conditions, it is clear that irradiation can enhance ROS generation. It is possible that photobleaching or photoactivation can affect the DCF fluorescent intensity, which would be highly correlated with irradiation frequency or irradiation power. However, the experimental data in our study did not support this hypothesis, and no correlation was observed between irradiation (frequency and power) and DCF fluorescent intensity without existence of ZnO NPs. Therefore, it can be concluded that the DCF intensity increases are mainly due to the ROS generations, which directly correlates with the combined effects of dosed ZnO NPs and irradiations.
Additional experiments were conducted to show the cell oxidative conditions through the release of LDH from the cell membrane (Figure 6). Likewise, the results in the nonirradiated cell group corroborated our previous study (Figure 6A), while all 3 irradiation treated cell groups had signal loss after prolonged irradiation (Figure 6B-D). This study suspects that this phenomenon may be associated with inactivation of the enzymatic reactions caused by the accumulating free radicals.
By using 2 fluorescent dyes, more detailed examinations of the cytotoxic effects can be made (Figure 7). Specifically, cells uniformly stained with DCF and DAPI fluorescent dyes provide the following 5 conditions: (1) cellular ROS generation, through the increase in DCF fluorescence intensity at the FITC channel, (2) deterioration of cell health, through the morphological shrinkage of DCF-labeled cell body, (3) health of the cell nucleus, through the increase in DAPI fluorescence intensity at the DAPI channel, (4) cell viability decrease, through the morphological shrinkage of DAPI-labeled cell nucleus, and (5) deformation or decomposition of nuclear membrane, through overlapped fluorescence intensity of both DCF and DAPI dyes. Figure 7 shows increased cytotoxicity with increased ZnO NP doses and at short irradiation wavelengths. Both intensified fluorescence emissions and drastic morphological shrinkages were observed in the cell groups that were treated with high levels of ZnO NPs and irradiated with short wavelengths. It is important to mention that with the increase in ZnO NPs dose in each group, more cells stained with cyan-colored fluorescence were observed in merged images, indicating a possible decomposition of the nucleus before the cell membrane was destructed. This phenomenon is also expressed in a 3-D diagram (Figure 8), which was based on merged images from Figure 7. The peak circumference represents the cell shape, and the peak height represents fluorescence intensity. Images from the up-left to the down-right corner show the changes in the following key parameters as higher doses of ZnO NPs and shorter wavelength irradiations were applied: (1) reduced circumference of each peak, (2) higher and steeper peak shapes, (3) brighter fluorescence signals, and (4) gradual change in color distribution pattern of each peak; in other words, more cyan-colored peaks were seen in groups with higher doses of ZnO NPs and shorter wavelength irradiations. These signal changes are clear signs of cell shrinkage, cellular ROS generation, and nuclear decomposition. Despite the severe cytotoxic effects observed due to the exposure to ZnO NPs and irradiations with varied wavelengths, relatively higher cell viability, thus lower cytotoxicity, was achieved when NAC was applied in all cell groups (Figure 9). This is logical, as NAC is a strong antioxidant. The data indicate that the remediation effect of NAC is concentration dependent, and a greater viability recovery was achieved when a higher concentration of NAC was applied. Nevertheless, the antioxidant effects of NAC varied among irradiation sources, with lower remediation effects in the UVA and UVC irradiation cell groups. This suggests that an excessive amount of generated free radicals can surpass the antioxidant abilities of NAC.
A previous study on the cytotoxicity of iron oxide NPs showed that the toxicity was generated through endocytosis via cytoplasm-bound vesicles in A549 cells. 43 A separate study on silver NP uptakes and intracellular distribution in human mesenchymal stem cells also showed a specific endolysosomal localization of silver NPs, and the primary uptake mechanisms were reported to be the clathrin-dependent endocytosis and macropinocytosis. 44 Although there were contrasting results that showed that the cell type and the mechanism of interactions play important roles in the cytotoxicity of NPs, the authors suggested that a case-by-case basis would be favored on the investigation of NP aggregates behavior with cells. 45 Another study on the cytotoxicity of monodisperse polypyrrole NPs also showed endocytosis through transportation via endosomal networks to lysosomes. 46 Thus, it is reasonable to infer that most of the cellular uptake of nanoscale particles may go through a lysosomal-targeted endocytosis pathway. Our findings in this study are in agreement with these studies. Results reveal that ZnO NP agglomerates render small sizes and more amount of subcellular localization in irradiation cell groups (Figures 7 and 8) with worse cell viability compared with the normal dark incubated cell group, suggesting that irradiation treatment can assist ZnO NPs to gain better dispersion conditions that may promote the uptake of ZnO NPs into cells, and thus elicit a higher cell death rate.
When considering the above-mentioned results, it is worth mentioning that the appearance of cyan-colored peaks shown in Figures 7 and 8 indicates nuclear decomposition before the disintegration of the cell membrane. The ZnO NPs that enter cells will generate intracellular ROS and induce nuclear decomposition prior to cell membrane disintegration. Such destructive effect depends on ZnO NP dosages, duration time, as well as irradiation wavelengths. A separate experiment on intracellular calcium levels (data not shown) produced a similar result. When a lethal dose of ZnO NPs was applied to cells, increased intracellular calcium was observed. Moreover, fluorescent dye-labeled Ca2+ was observed transiently entering into cell nucleus and induced whole cell decomposition later on. This phenomenon, again, demonstrated a unique way of cell death induced by ZnO NPs, which has not been clearly reported yet. Nevertheless, few studies have showed correlations between nanotoxicity and priorities of destruction to different cellular organelles, especially with respect to the cell nucleus. Since the superactive free radicals can react with many bioactive macromolecules swiftly and unselectively, we hypothesize that the unclear priority of destruction on cell nucleus can be attributed to specific physicochemical properties of ZnO NPs. Moreover, considering the basic environment within the cell nucleus, due to the presence of a large amount of negatively charged DNA molecules, we hypothesize that this basic environment in the nucleus would selectively attract positively charged “holes” generated on the ZnO NPs surface by irradiation, thus favoring the subsequent free radicals production specifically. Because both culture medium and cytoplasm were maintained at pH values close to 7.2 to 7.4, it follows that a basic environment would not be present elsewhere. Therefore, it may be the case that once ZnO NPs enter the A549 cells, these NPs preferentially destroy the cell nucleus rather than the cell membrane. Having said that the detailed mechanisms are not yet clear, further studies are necessary to confirm this hypothesis.
Free radicals are very active species and can interact with many intracellular molecules. Reductive molecules (glutathione, nicotinamide adenine dinucleotide phosphate, etc), sources (mitochondria) within cytoplasm, and other molecules distributed throughout the cytoplasm can all consume free radicals. Therefore, ZnO NPs will not only preferably destroy nuclei but also contribute to whole cell degradation, unselectively. As shown in the TEM images (Figure 10), cells that were treated with 25 μg/mL 60 to 80 nm ZnO NPs in dark exhibited severe cytoplasmic destruction after 6 hours when compared with controls and an even more pronounced effect was observed when visible light irradiation was applied (Figure 10A). A partial view of a cell that was treated only with ZnO NPs provided closer details, showing that membranes were being torn off while the cytosol was being depleted (Figure 10B). However, most cytoskeleton and microfilament structure can still be seen due to their resilience and relatively lacking of reductive function groups.
The increased cytotoxic effects of ZnO NPs under visible and UV irradiation may be attributed to their photocatalytic reactivity. Zinc oxide has been widely reported to have antibacterial activity, although the mechanism has not yet been clarified until only recently. The UV-stimulated hydroxylation was observed at the surface reactive defective sites of ZnO crystals with atmospheric water molecules. 47 Another electron paramagnetic resonance study on visible light-induced ROS generation by ZnO NPs revealed that ZnO NPs in aqueous suspensions can produce increased levels of hydroxyl radicals and singlet oxygen. 48 Moreover, ZnO suspension can generate a greater amount of oxy radicals when irradiated with visible light at the range of 400 to 500 nm.
Although the detailed mechanism of the cytotoxicity of ZnO NPs is not totally clear, there is evidence showing that ZnO NP-induced toxicity may be due to its dissolution in culture medium and endosomes. The ZnO NPs were observed entering caveolae undissolved or entering lysosomes in which smaller particle remnants dissolved in different cell types. 16 Muller et al 49 indicated that ZnO NPs, which are comparatively stable at extracellular pH environment, can cause cell viability reduction through dissolution in lysosomes, intracellular release of ionic Zn2+, and combined with severe structural changes in mitochondria. It was also found that intracellular Zn2+ toxicity was associated with mitochondrial dysfunction and mitochondria depolarization by Ca2+ and Zn2+ through considerably different mechanisms. 50 Further, it has been reported that ZnO NP exposure can increase the intracellular calcium levels in a concentration- and time-dependent manner. 12 Our calcium imaging tests are in agreement with this study, too. While in this case, the transient receptor potential melastatin 7, a Ca2+ permeable nonselective cation channels, was found important in Zn2+-mediated cellular injury. In conclusion, the above-mentioned studies suggest that the cytotoxic effects of ZnO NPs are attributed to ZnO dissolution. However, none of these studies can explain cell death through early-stage cell nucleus decomposition as shown in this study. Thus, more thorough studies are needed to elucidate a possible multipathway mechanism of ZnO NPs-induced cytotoxicity.
In summary, we quantitatively demonstrated that the cytotoxicity of 60 to 80 nm ZnO NPs to A549 cells was dose, time, as well as irradiation wavelength dependent, and these cytotoxic effects were primarily due to the presence of ZnO NPs, not irradiation. Our detailed study also discovered a unique route of ZnO NPs-induced cell death: nuclear decomposition prior to cell membrane deformation. Based on this phenomenon, we suggest that the basic nuclear environment selectively attracts the positively charged “holes” on ZnO NP surfaces caused by irradiation. Finally, the study demonstrates that ZnO NPs unselectively contribute to whole cell degradation in addition to preferentially destroying cellular nuclei. Overall, steep cell viability decreases, intracellular ROS induction, LDH releasing, cell shrinkage as well as morphological changes, combined with cytoplasm leakage, specific cell nucleus destruction in early stage, and cytoskeleton destruction in late stage, together evidently indicate a highly enhanced cytotoxic effect of ZnO NPs under irradiation. Although these negative effects can partially be rescued by NAC, additional investigation of both in vitro and in vivo exposure studies that are relevant to actual conditions should be conducted to validate whether combined irradiation and ZnO NP exposure could enhance the nanotoxicity of ZnO NPs.
Footnotes
Declaration of Conflicting Interests
The author(s) declared no potential conflicts of interest with respect to the research, authorship, and/or publication of this article.
Funding
The author(s) disclosed receipt of the following financial support for the research, authorship, and/or publication of this article: This study was funded by Environmental Research Center and the Center for Biomedical Science & Engineering at Missouri University of Science and Technology.