
Abstract
Female F344 rats were exposed to anthraquinone (AQ) by dietary feed at concentrations of 0, 50, 150, 469, 938, 1875, or 3750 ppm for 2 or 13 weeks. End points evaluated included clinical observations, body weights, serum chemistry, blood AQ, gross pathology, organ weights, and select tissue histopathology. Mean body weight and food consumption were 5% to 10% lower than control values in rats of the ≥938 ppm group during study weeks 2 through 13. Occasional decreases in body weight means were also observed in rats of the 150 and 469 ppm groups. Increases in liver, kidney, and spleen weights were observed in rats exposed to AQ diet concentrations ≥150 ppm for 13 weeks. Urinary bladder weights were increased at ≥469 ppm. Liver and spleen weights were also increased following 2 weeks of exposure. Liver weight increases were clearly dependent on AQ concentration. At 2 weeks, decreases in serum aspartate aminotransferase (AST), blood urea nitrogen, and creatinine concentrations were observed in higher AQ exposure groups, and AST was decreased at 13 weeks (≥1875 ppm). Microscopic alterations were observed in the liver (mild centrilobular hypertrophy), spleen (mild hematopoietic cell proliferation and pigmentation), and kidneys (minimal hyaline droplets) of rats exposed to AQ for 13 weeks. Blood AQ concentrations ranged from 0.75 to 14.8 µg/mL in rats of the 150 to 3750 ppm groups, respectively, and were similar in value following either 2 weeks or 13 weeks of exposure. A no observed adverse effect level of 469 ppm AQ (31.3 mg/kg/d) was selected based on the absence of liver histopathology.
Keywords
Introduction
Anthraquinone (AQ; CAS No. 84-65-1), a derivative of anthracene, is a polycyclic aromatic hydrocarbon with 3 fused rings of benzene. The AQ is a solid with very low vapor pressure (1.16 × 10⁻⁷ mm Hg at 25°C) and low water solubility (1.35 mg/L at 25°C). 1 The AQ is used primarily as an intermediate in the production of dyes and pigments and as a catalyst in pulping processes in the paper and pulp industry. 1 Several isomers are possible from its chemical structure, but the specific isomer 9,10-anthraquinone, where the keto groups are located on the central benzene ring, is most commonly considered the primary constituent of AQ. The US production of AQ in 1998 and 2002 was 5000 to 25 000 tons 1 making it a high-production volume chemical. China is a major producer and worldwide distributor of AQ, where production volume in 2008 reached 37 500 tons. 2 The AQ has a history of use as a geese repellant in terrestrial areas (eg, airports) or in developed urban areas (eg, golf courses), 3 possibly due to the laxative effect of AQ derivatives when treated on birdseed or grass. 1,4 The US Environmental Protection Agency accepted AQ as a bird repellant for use near airports in 1998; however, AQ was phased out as a bird repellant by the European Union Commission in 2008. 5
Routes of potential human exposure of AQ are dermal contact, inhalation, and ingestion. The AQ has been detected in air, water, soil, plants, fish/seafood, and animal tissue. 5 Sources of environmental exposure are both natural and anthropogenic. Animal toxicity studies with AQ are limited. Acute oral, dermal, intraperitoneal, and inhalation tests in rats indicate minimal toxicity with values of median lethal dose (LD50) > 5000 mg/kg, LD50 > 5000 mg/kg, LD50 = 3500 mg/kg, and median lethal concentration (4 hours) >1.327 mg/L, respectively. 6 A 28-day oral gavage study in Wistar rats at doses ranging from 2 to 250 mg/kg/d showed decreased body weight gains; increased liver, kidney, and spleen weights; and hepatocyte enlargement. 6 A no observed adverse effect level (NOAEL) was 2 mg/kg/d. Wistar rats administered AQ by oral feed at concentrations of 15, 150, and 1500 ppm for 3 months also showed decreased body weight gains; decreased food consumption; increased liver weights; and hepatocyte enlargement with an NOAEL of 15 ppm. 6 Decreased body weight gains and hepatocytic enlargement were observed at 1500 ppm only. 6 Thus, a decrease in food consumption and an increase in absolute liver weights were the basis for the selected NOAEL. 6 The National Toxicology Program (NTP) conducted 14-week and 2-year feeding studies with AQ in F344 rats and B6C3F1 mice. 7 Diet concentrations of AQ in the 14-week rat and mouse studies ranged from 1875 to 30 000 ppm. In rats, mean body weights were decreased (females), liver and kidney weights were increased (≥7500 ppm), and tissue microscopic findings included liver hypertrophy, renal hyaline droplets, bone marrow hyperplasia, thyroid follicular cell hypertrophy (≥3750 ppm), urinary bladder inflammation and transitional cell hyperplasia (3000 ppm female group) and spleen congestion, pigmentation, and hematopoietic cell proliferation. 7 At high AQ concentrations (≥15 000 ppm), kidney nephropathy was also observed. In mice, the effects of AQ exposure were primarily liver hypertrophy, spleen pigmentation and hematopoietic cell proliferation, and urinary bladder cytoplasmic alteration. 7
Diet concentrations of AQ in NTP’s 2-year rat study ranged from 469 to 3750 ppm and in NTP’s 2-year mouse study ranged from 833 to 7500 ppm. 7 In rats, the survival rate in AQ-exposed groups was similar or greater than control animals, but body weights in AQ-exposed rats were less than those of the controls. Male and female rats administered AQ had higher incidences of kidney, liver (equivocal in males), and urinary bladder tumors compared to control rats. The AQ-related nonneoplastic effects included kidney hyaline droplet accumulation, nephropathy, liver centrilobular hypertrophy, bone marrow hyperplasia, and lesions of the spleen (congestion, pigmentation, and hematopoietic cell proliferation). In the mouse study, liver adenomas/carcinomas were increased in both males and females compared to respective controls, while a slightly higher rate of thyroid follicular cell adenoma was considered an equivocal finding. Noteworthy, nonneoplastic lesions in AQ-exposed mice included liver centrilobular hypertrophy, urinary bladder intracytoplastic inclusion bodies, and splenic hematopoietic cell proliferation.
To further evaluate the activity of AQ at target organ sites where carcinogenic effects were observed, the NTP conducted a 32-day feed study in male and female F344 rats at AQ concentrations of 0 (control), 469, 938, and 3750 ppm. 7 An 8-day interim evaluation was also performed. End points included body weights, organ weights, liver cytochrome P450 (CYP) activity (day 8), liver and kidney 8-hydroxy-2′-deoxyguanosine (8OHdG) and 2′-deoxyguanosine concentrations (day 8), and cell proliferation in the liver, kidney, and urinary bladder (day 32). Mean body weights between the study groups were similar at 8 days but lower in the male AQ groups after 32 days of exposure. Liver and kidney weights of all AQ exposure groups were significantly higher than the controls at 8 and 32 days. Liver CYP activities were increased at day 8, and the increases were concentration related for CYP2B1. There were no consistent exposure-related changes in 8OHdG, 2′-deoxyguanosine or the ratio of 8OHdG/2′-deoxyguanosine in the livers and kidneys of male and female rats following 8 days of exposure. Cell proliferation values were higher than controls in female (≥ 938 ppm) and male (3750 ppm) urinary bladders but not in the kidneys or livers of AQ-dosed rats following 32 days of exposure. The incidences of liver hypertrophy and kidney hyaline droplets were increased compared to controls in male (≥ 469 ppm) and female (≥ 938 ppm) rats following 32 days of exposure.
Results of in vitro genotoxicity studies with AQ are conflicting and inconclusive. 5 A likely explanation for both positive and negative results in identical mutation assays is contamination of the AQ test material with derivatives that are mutagenic. 8 For example, pure AQ was not mutagenic in Salmonella typhimurium strains, but 97% AQ was mutagenic. 7 Derivatives of AQ showing significant mutagenic activity were 2-hydroxyanthraquinone and 1-, 2-, and 9-nitroanthracene. 7 Results of in vivo genotoxicity studies with AQ (mouse DNA damage and mouse micronucleus tests) are also mixed and inconclusive 5,7,9 perhaps due, again, to contamination of the AQ test material with derivatives. Doi et al 10 reviewed the carcinogenic activities of AQ and 6 derivatives that were evaluated in long-term bioassays conducted by the National Cancer Institute and the NTP. All compounds reviewed were mutagenic in at least 1 genotoxicity assay. However, not all compounds showed clear evidence of carcinogenicity in rats and mice. Sites of tumorigenicity were influenced by the type of functional group (eg, amino, bromo, and methyl) and by the number and/or position of substitutions. 10 Thus, postulating a mode of action of AQ carcinogenicity via a mutagenic relationship remains inconclusive.
The NTP concluded clear evidence of carcinogenic activity of AQ based on increased incidences of renal tubule neoplasms (≥469 ppm), urinary bladder transitional epithelial papilloma or carcinoma (≥1875 ppm), and hepatocellular adenoma (≥469 ppm) in female F344 rats administered by dietary feed at concentrations of 0 (control), 469, 938, 1875, or 3750 ppm AQ for a lifetime (105 weeks exposure). Nonneoplastic effects in the kidney, liver, spleen, and bone marrow were also observed in female rats at AQ diet concentrations ≥469 ppm. 7 Since 469 ppm was the lowest concentration used in the NTP study, an NOAEL was not reported. In our study, the objective was to focus on the toxicity of previously identified target tissues (kidney, urinary bladder, liver, and spleen) associated with oral AQ exposure and to characterize both dose–response and time course relationships. It was anticipated that a more thorough characterization of target organ effects with dose and exposure time would provide more definitive results to support the selection of an NOAEL and to improve human risk assessment of AQ. In all, 6 concentrations of AQ and 2 time points were selected. Toxicity was assessed only in female F344 rats that have been previously shown to be more responsive to AQ exposure than male rats. 7 Of the 6 AQ concentrations selected in the current study, 2 concentrations were below the lowest concentration used in NTP’s 2-year bioassay of AQ. End points evaluated included clinical observations, body weights, food consumption, target organ weights, serum clinical chemistry, gross pathology, and target organ histopathology. In addition, blood samples collected at necropsy were analyzed for AQ.
Materials and Methods
Test Materials
Anthraquinone (CAS No. 84-65-1) was obtained from Sigma-Aldrich, St Louis, Missouri (Product No. A90004). A certificate of analysis from Sigma-Aldrich indicated a purity of 99.4%.
Study Design, Animals, and Animal Husbandry
In this study, 145 female Fisher 344 rats (Rat F344/NCrl) from Charles River Laboratories (Kingston, New York) aged 4 to 5 weeks old were used. The selection of the F344 strain was based on the findings of the NTP bioassay that showed increased incidences of tumors of the liver, kidney, and urinary bladder when AQ was administered in the diet at 938 to 3750 ppm. 7 To keep the number of animals on study at a minimum, only 1 sex of F344 rats was used. Since the incidences of renal tubule adenoma/carcinoma and hepatocellular adenoma were higher in females compared to males indicating females had a greater sensitivity of effect, female rats were chosen for the current study. Treatment group sizes were 10 with an additional 2 to 3 rats assigned to the control group per time point to be used to assure a group size of at least 10 for evaluation of biological end points. Upon arrival, rats were acclimated to housing and animal room environment for 12 to 14 days. Rats were weighed and randomized using Provantis8 (Provantis, Conshohocken, Pennsylvania) to ensure that the mean body weight in each treatment group was approximately the same. Animals were ear tagged and housed 2 or less rats per cage in shoebox style cages separated from the treatment group. Alpha-dri cellulose bedding (Shepard Specialty Papers, Kalamazoo, Michigan) was used. Animals had access to reverse osmosis water (Hydro Systems, Durham, North Carolina) and NIH-07-certified meal feed (Zeigler Brothers, Gardners, Pennsylvania) ad libitum. The animal room was kept within the standard temperature and relative humidity parameters (64°F-79°F and 30%-70% relative humidity) and standard light cycle (0700-1900 hours).
The Hamner Institutes for Health Sciences is fully accredited by the Association for Assessment and Accreditation of Laboratory Animal Care International. Currently acceptable practices of good animal husbandry were followed per National Research Council’s Guide for the Care and Use of Laboratory Animals 11 and were in compliance with all appropriate parts of the Animal Welfare Act. 12 In addition, the study design and protocol were approved by The Hamner Institutes’ Institutional Animal Care and Use Committee prior to the initiation of the study.
Preparation and Administration of AQ
A feed premix was prepared by hand grinding a weighed amount of the test material into 1 kg of rodent meal using a mortar and pestle. The 1-kg premix sample was blended with rodent meal using a Patterson-Kelly 3-ft3 twin shell blender until homogeneity was achieved.
Dietary feed concentrations of AQ were 0, 50, 150, 469, 938, 1875, and 3750 ppm. These concentrations were chosen to assess the potential for effects at lower levels than those included in the previous NTP studies. 7 In a 14-week dose range-finder study, 7 mean body weights of female rats were significantly less in AQ groups fed diets of 1875 to 30 000 ppm compared to the control group.
Batches of AQ feed concentrations were prepared approximately every 3 weeks and submitted for analysis on the same day they were prepared. Upon receipt, triplicate aliquots (∼1 g each) from each of the top, middle, and bottom locations of the blended feed batch were placed into labeled screw cap polypropylene vials. The 99.8% dimethylformamide (DMF; Sigma-Aldrich) of 5 mL was added to the aliquots prior to tightly capping and placing the vials in a sample rotator for 30 minutes. Samples were allowed to settle for 5 minutes before an aliquot of supernatant was removed and placed in a microcentrifuge tube. Feed sample extracts were then centrifuged at 4500 × g for 2 minutes at room temperature and analyzed without further dilution. Calibration curves (25-5000 µg/g) were prepared on the same day as sample analysis by spiking control feed with a freshly prepared stock solution of AQ in DMF. Samples and standards were analyzed by Gas chromatography (GC)/flame ionization detector (Agilent 6890, Agilent Technologies, Inc., Santa Clara, CA) with a 30-m, 320-µm, 0.25-µm film thickness Restek Rtx-1 column (Restek, Bellefonte, Pennsylvania). The temperature program used for the analysis was as follows: (1) the initial oven temperature of 140°C was held for 1 minute; (2) GC oven temperature was then ramped to 275°C at a rate of 20°C/min; and (3) postrun oven temperature was held for 1 minute at 300°C for a total run time of 7.75 minutes. Chromatograms were manually integrated, and feed concentrations were calculated through the use of the generated calibration curves and dilution factors.
Mixed AQ-feed concentration stability was conducted at 2 concentrations, 50 ppm and 3750 ppm, and under 3 different environmental conditions. Samples of prepared feed were stored at (1) room temperature; (2) room temperature and shielded from light; or (3) 4°C and shielded from light. Subsamples of the various storage conditions were analyzed and quantified through comparison to a freshly prepared calibration curve (described previously). Sample analysis was conducted every week for a total of 5 weeks. Following completion of the stability studies, it was observed that the concentration of AQ in feed was not impacted by any of the different storage conditions, with final concentrations ±15% of the original feed concentration (50 or 3750 ppm).
The mean ± standard deviation concentration of the prepared feed batches were 0 ± 0, 47 ± 2, 147 ± 6, 459 ± 30, 917 ± 24, 1871 ± 77, and 3654 ± 121 ppm of AQ for target concentrations of 0, 50, 150, 469, 938, 1875, and 3750 ppm, respectively.
Mortality Checks, Clinical Observations, Body Weights, Food Consumption, Administered Dose, and Organ Weights
Animals were checked daily for clinical signs of toxicity, morbidity, or death. Body weights were measured twice during the first week and then weekly, including immediately prior to scheduled necropsy. Food consumption was measured twice weekly. At necropsy, the left and right kidney, liver, spleen, and urinary bladder were removed and weighed. Clinical observations, body weights, food consumption, and organ weights were recorded in Provantis8 (NT2000 versions 8.2.0.1 or 8.2.0.6, Instem, Conshohocken, Pennsylvania). Food consumption was calculated on a per cage basis and divided by the number of animals assigned to that cage during the collection period. The administered dose of AQ was calculated using the mean (relative to body weight) food consumption data and the mean analytical concentration of AQ in the administered diet. Means of food consumption and analytical diet concentration per dose group were combined, and the results were expressed as mg AQ per kg body weight per day.
Necropsy, Serum Clinical Chemistry, Blood AQ Analysis, and Tissue Histopathology
Animal necropsies occurred in the morning of the day following scheduled time points. Animals were weighed and anesthetized with a lethal intraperitoneal injection of sodium pentobarbital. A cardiac puncture was performed to collect the blood samples, and animals were then exsanguinated via transection of the abdominal aorta. Blood samples for clinical chemistry analysis were placed in a serum separator tube (gel barrier) and centrifuged. The following analytes were measured in the serum within 24 hours of collection: aspartate aminotransferase (AST), alkaline phosphatase (ALP), bilirubin (total), blood urea nitrogen (BUN), creatinine, and lactate dehydrogenase. Reagent sets for the serum analytes and quality control materials including standards were obtained from Pointe Scientific, Inc. (Canton, Michigan). Instructions supplied with the reagent sets were followed. A Roche COBAS FARA II chemistry analyzer (Roche Diagnostics, Indianapolis, IN) was used for analysis of serum samples. The COBAS operator manual and laboratory standard operating procedures were followed for conducting analyte analyses.
Another aliquot of approximately 0.5 mL of blood was collected, placed in an anticoagulated tube (ethylenediaminetetraacetic acid), and stored in a freezer (−80°C). A total of 5 samples from each concentration and time point were randomly selected and analyzed for AQ concentration using high-performance liquid chromatography with diode-array detection (Agilent 1100, model G1315A, Agilent Techologies, Inc., Santa Clara, CA). Aliquots of thawed whole blood samples were mixed with Chromasolv plus grade acetonitrile (Sigma-Aldrich) containing 10 μg/mL benzophenone as an internal standard at a ratio of 1:1. Each sample was sonicated for 20 seconds, briefly vortexed, and centrifuged at 10 000 × g for 5 minutes at 4°C. Sample supernatant was transferred to silinated glass inserts, diluted with water at a ratio of 3:1, and placed in labeled sample vials and analyzed. Calibration curve samples were prepared by spiking whole blood with known amounts of AQ to a range of 0.01 to 3.00 µg/mL. The limit of quantitation for the analyte was 0.64 µg/mL in whole blood. Samples and standards were analyzed on a 2.0 × 150 mm Phenomenex Aqua C18 column with 3 µm particles (Phenomenex, Torrance, California). Instrumental analysis was carried out on injection sizes of 10 µL at ambient temperature and a constant HPLC flow rate of 200 µL/min. An isocratic method was used with 25% water and 75% acetonitrile for 6.0 minutes. The wavelength was set at 253 nm.
For kidney histopathology, a longitudinal slice from the left kidney and a cross-sectional slice from the right kidney were taken. The urinary bladder was bisected longitudinally, and a slice was removed. For the spleen, a cross-sectional slice was collected. For lung tissue, the trachea was cannulated below the larynx and the left lung infused under approximately 30 cm of hydrostatic pressure with 10% neutral-buffered formalin (NBF). When filled, a suture around the left bronchus was pulled tightly to tie off the left lobe. The left lobe with trachea attached was removed and sliced. Liver slices from 3 of 4 lobes (median, right, and left) were taken. Kidney, bladder, spleen, and liver sections were placed in cassettes and immersed in NBF for approximately 48 hours. The tissue cassettes and left lung were then transferred to a cup containing 70% ethanol followed by paraffin embedding. Embedded tissues were sectioned at 5 µm and stained with hematoxylin and eosin for microscopic evaluation by a board-certified pathologist. Histomorphologic findings were graded from 1 to 5 where 1 = minimal, 2 = mild, 3 = moderate, 4 = moderately severe, and 5 = severe. The liver lobes were not evaluated independently to assess interlobe variability but were evaluated together to characterize an overall hepatic effect of AQ exposure.
Statistical Analysis
Body weight, food consumption, and organ weight data were analyzed using the statistical tests provided by the Provantis software system (NT2000 versions 8.2.0.1 or 8.2.0.6, Instem, Conshohocken, Pennsylvania). A 1-way analysis of variance (ANOVA) was used. If significant, the ANOVA was followed by a Dunnett test to compare AQ concentration groups with the control group. Serum chemistry data were analyzed using JMP 9.0.0 software (SAS Institute, Inc, Cary, North Carolina). A goodness of fit test (Shapiro-Wilk, P < 0.01) and homogeneity of variance test (Levene, P < 0.05) were conducted. If pretest assumptions were met, an ANOVA was used and, if significant (P < 0.05), AQ-exposed groups were compared to the control group using Dunnett test. For datasets of nonnormal distributions or unequal variances, a Welch ANOVA followed by Steel test was used. A result of P < 0.05 was considered significant.
Results
Clinical Observations, Body Weights, Food Consumption, Administered Dose, and Blood AQ
The only AQ exposure-related clinical observation during the study was dark-colored urine staining of the urogenital area in rats of the 938, 1875, and 3750 ppm groups. Urogenital area staining was frequently observed during study weeks 8 through 13 and occurred in 80% to 100% of the rats in the ≥938 ppm group. A statistically significant decrease (5%-8%) in mean body weight compared to control animals was observed in rats of the ≥469 ppm group during study weeks 2 through 13. Rats of the 150 ppm group also had a statistically significant decrease (5%) in mean body weight during study weeks 7 through 13. Mean food consumption (relative to body weight) was statistically significantly lower (8%-10%) in AQ-exposed rats of the ≥938 ppm group compared to control rats. The decrease in food consumption was observed during the first 9 weeks of AQ administration, but during the last 4 weeks of the study, weekly food consumption means in rats of the AQ groups were similar to controls. The administered doses calculated from food consumption (relative to body weight) and analytical diet concentration data at the conclusion of the 13-week study were 3.2, 10.2, 31.3, 59.7, 121, and 241 mg AQ/kg body weight/d for 50, 150, 469, 938, 1875, and 3750 ppm AQ diet concentrations, respectively. Administered doses at the conclusion of the 2-week time point were 29% to 43% higher than the 13-week administered dose calculations due to much higher relative (to body weight) food consumption values for younger rats. At necropsy, blood was removed from animals of all concentration groups for AQ analysis. Following 2 weeks of exposure, blood AQ concentrations increased with diet concentration ranging from 0.78 to 13.73 µg/mL for the 150 to 3750 ppm groups (Table 1). At 13 weeks, blood AQ concentrations were similar to the 2-week results and ranged from 0.75 to 14.80 µg/mL for the 150 to 3750 ppm groups (Table 1). Anthraquinone was not detected in the blood of rats of the 50 ppm group above the limit of quantitation (0.64 µg/mL).
Blood AQ Concentration (µg/mL) in Female F344 Rats Following Daily Exposure of AQ by Dietary Feed.
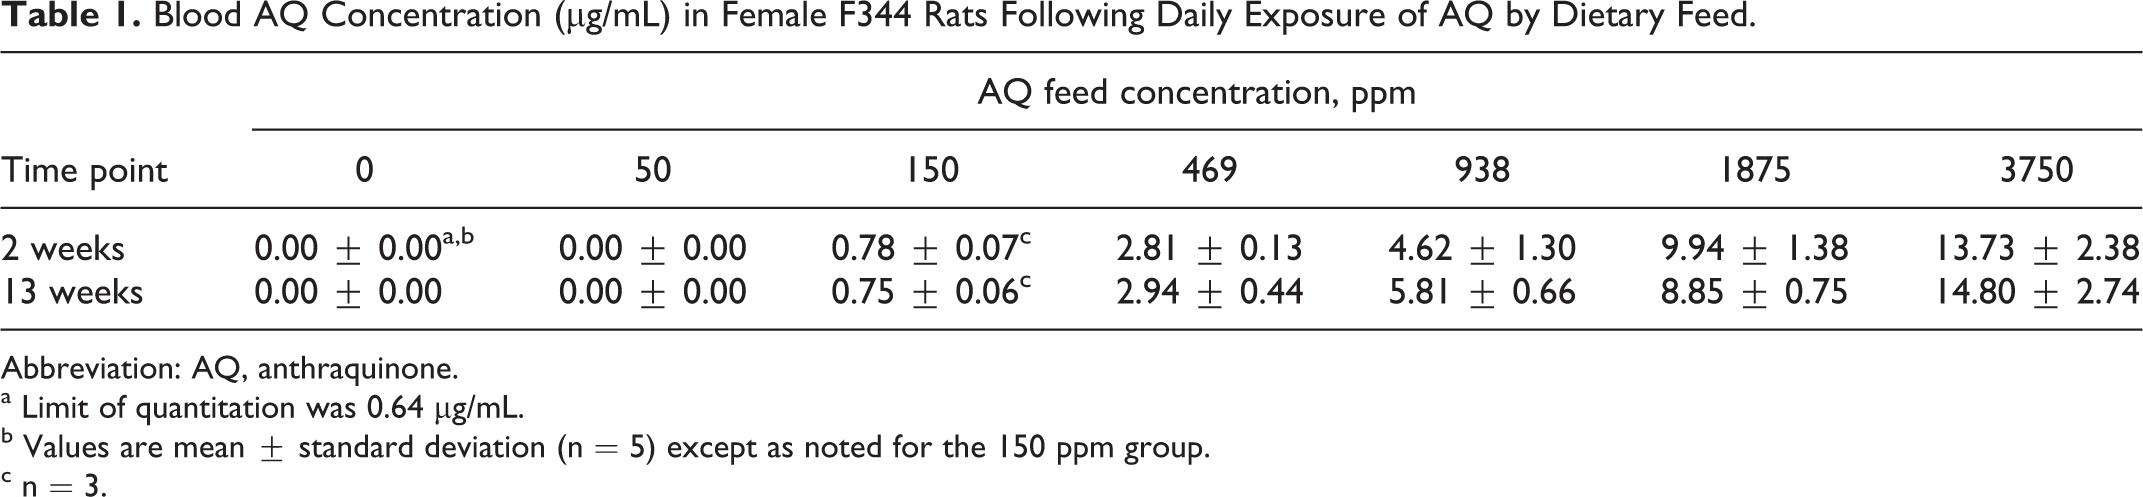
Abbreviation: AQ, anthraquinone.
a Limit of quantitation was 0.64 µg/mL.
b Values are mean ± standard deviation (n = 5) except as noted for the 150 ppm group.
c n = 3.
Organ Weights
At AQ diet concentrations ≥150 ppm, statistically significant increases were observed in mean absolute or relative weights of the liver, kidneys, and spleen compared to control values following 13 weeks exposure (Table 2). Mean relative urinary bladder weights were increased in rats exposed to ≥469 ppm. Increases in mean absolute or relative kidney (left) and spleen weights were also observed in rats of the 50-ppm group (Table 2). The liver weight increases were dependent on AQ concentration, 111%, 130%, 147%, 169%, and 189% of control (mean relative weights) for the 150, 469, 938, 1875, and 3750 ppm groups, respectively. The increase in mean relative kidney weights ranged from 106% to 116% of control for the 50, 150, and 469 ppm groups, but increases in mean relative kidney weights were 116% to 119% of control for AQ diet concentrations of 938, 1875, and 3750 ppm (Table 2). For urinary bladder, the increase in mean relative weights in rats of the 469 to 3750 ppm groups ranged from 121% to 127% of the control. The mean relative spleen weights were 128% to 148% of control but did not show an AQ concentration-dependent trend (Table 2). Similar organ weight changes and trends were observed in AQ-exposed rats at the 2-week necropsy for the liver and spleen only (Table 3).
Absolute and Relative (to Body Weight) Organ Weights of Female F344 Rats Following 13 Weeks of Daily Exposure of AQ by Dietary Feed.
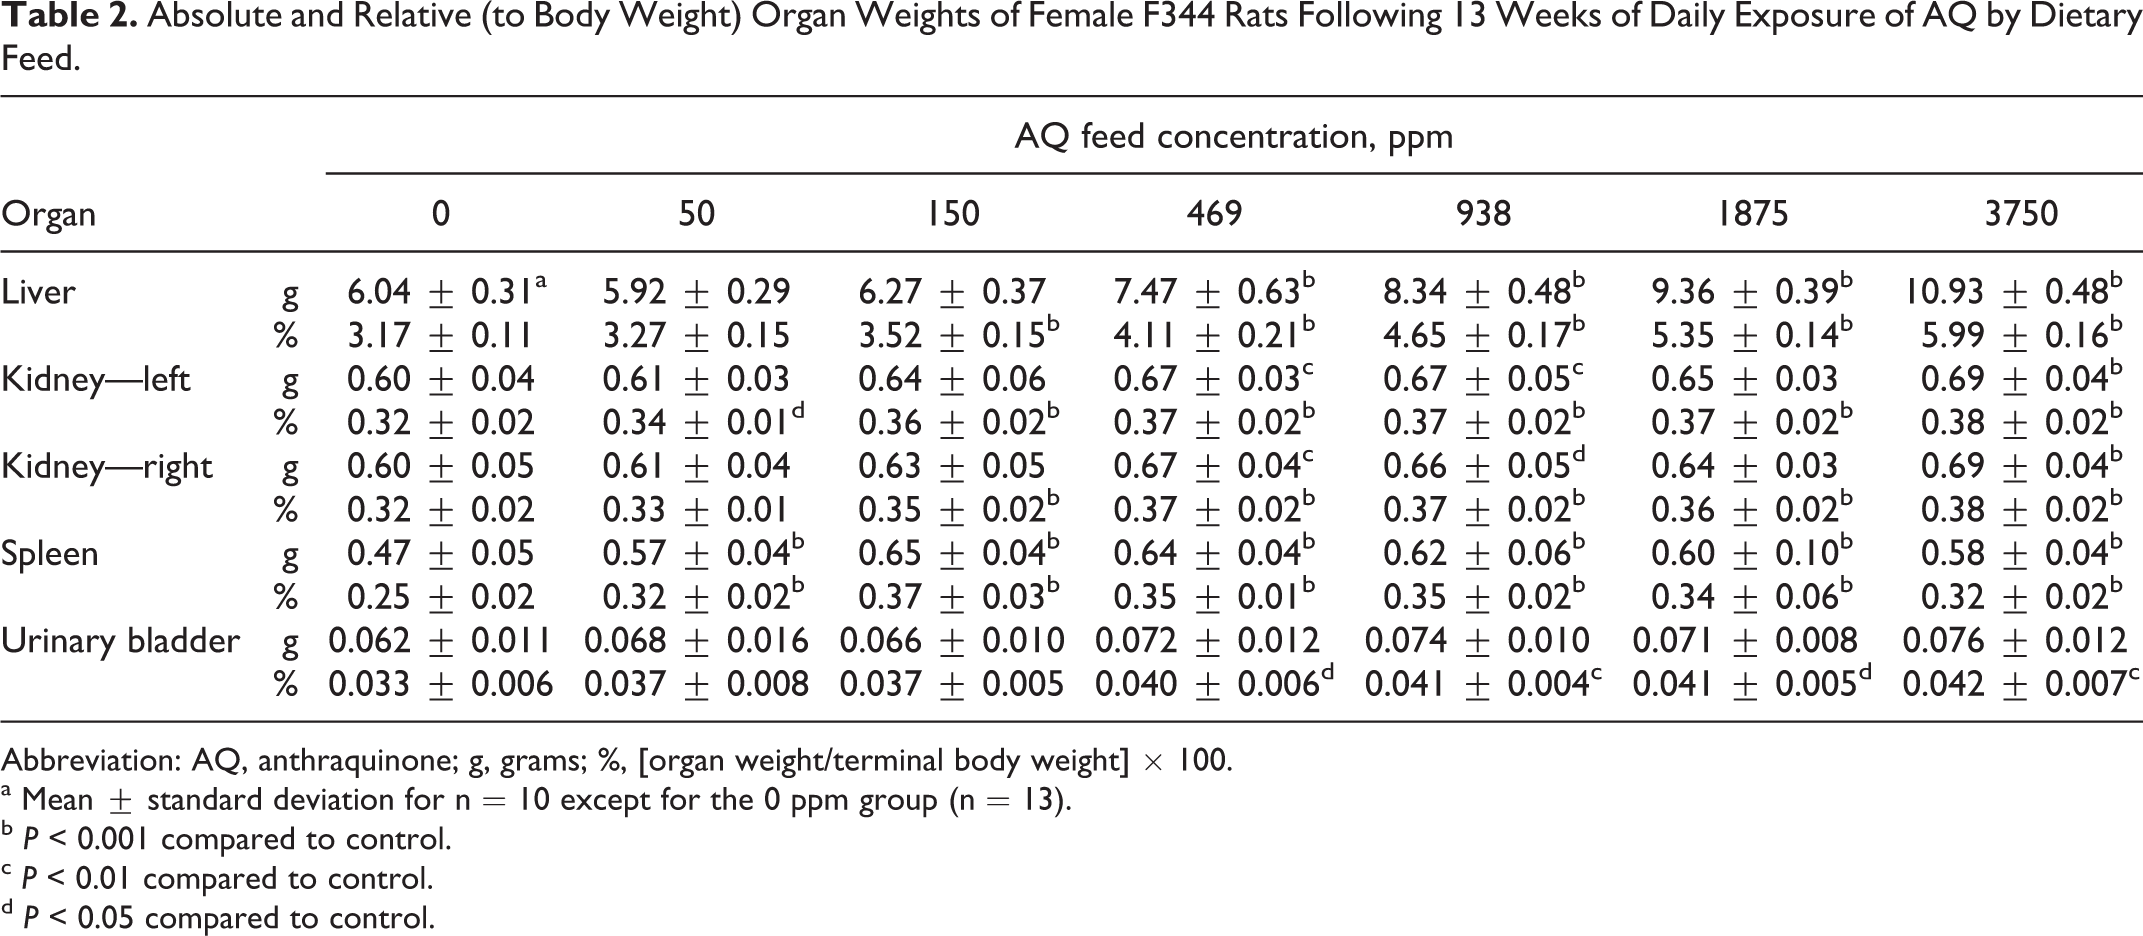
Abbreviation: AQ, anthraquinone; g, grams; %, [organ weight/terminal body weight] × 100.
a Mean ± standard deviation for n = 10 except for the 0 ppm group (n = 13).
b P < 0.001 compared to control.
c P < 0.01 compared to control.
d P < 0.05 compared to control.
Absolute and Relative (to Body Weight) Organ Weights of Female F344 Rats Following 2 Weeks of Daily Exposure of AQ by Dietary Feed.
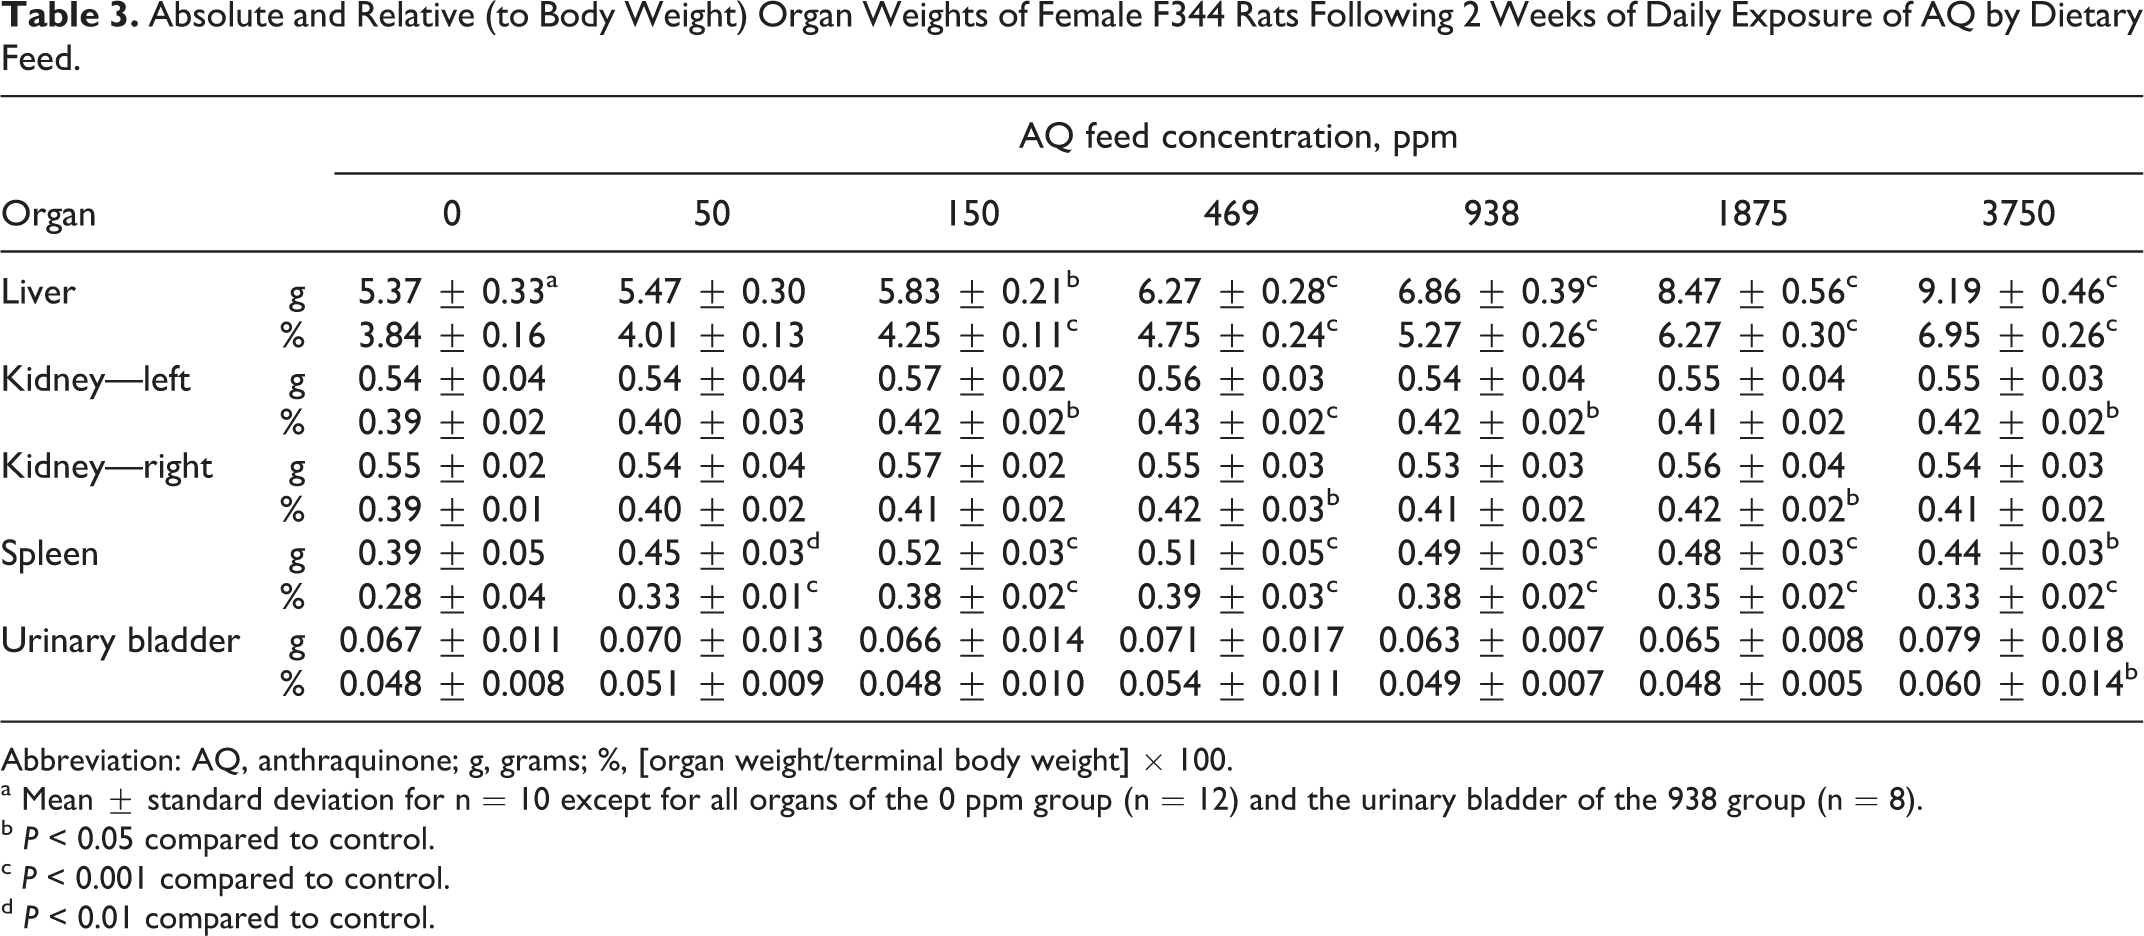
Abbreviation: AQ, anthraquinone; g, grams; %, [organ weight/terminal body weight] × 100.
a Mean ± standard deviation for n = 10 except for all organs of the 0 ppm group (n = 12) and the urinary bladder of the 938 group (n = 8).
b P < 0.05 compared to control.
c P < 0.001 compared to control.
d P < 0.01 compared to control.
Clinical Chemistry and Histopathology
Of the 6 analytes measured in the serum, 3 were statistically significantly altered compared to control mean values. Following 2 weeks of exposure, AST, BUN, and creatinine concentrations were decreased in rats of the 3750 ppm group (Table 4). The BUN levels were also decreased in rats of the 469, 938, and 1875 ppm groups, while creatinine was decreased in rats of the 1875 ppm group, and AST was decreased in rats of the 938 ppm group. Following 13 weeks of AQ exposure, a decrease in AST in rats of the 1875 and 3750 ppm groups was the only statistically significant altered serum analyte (Table 4).
Selected Serum Chemistry Concentrations of Female F344 Rats Following Daily Exposure of AQ by Dietary Feed.
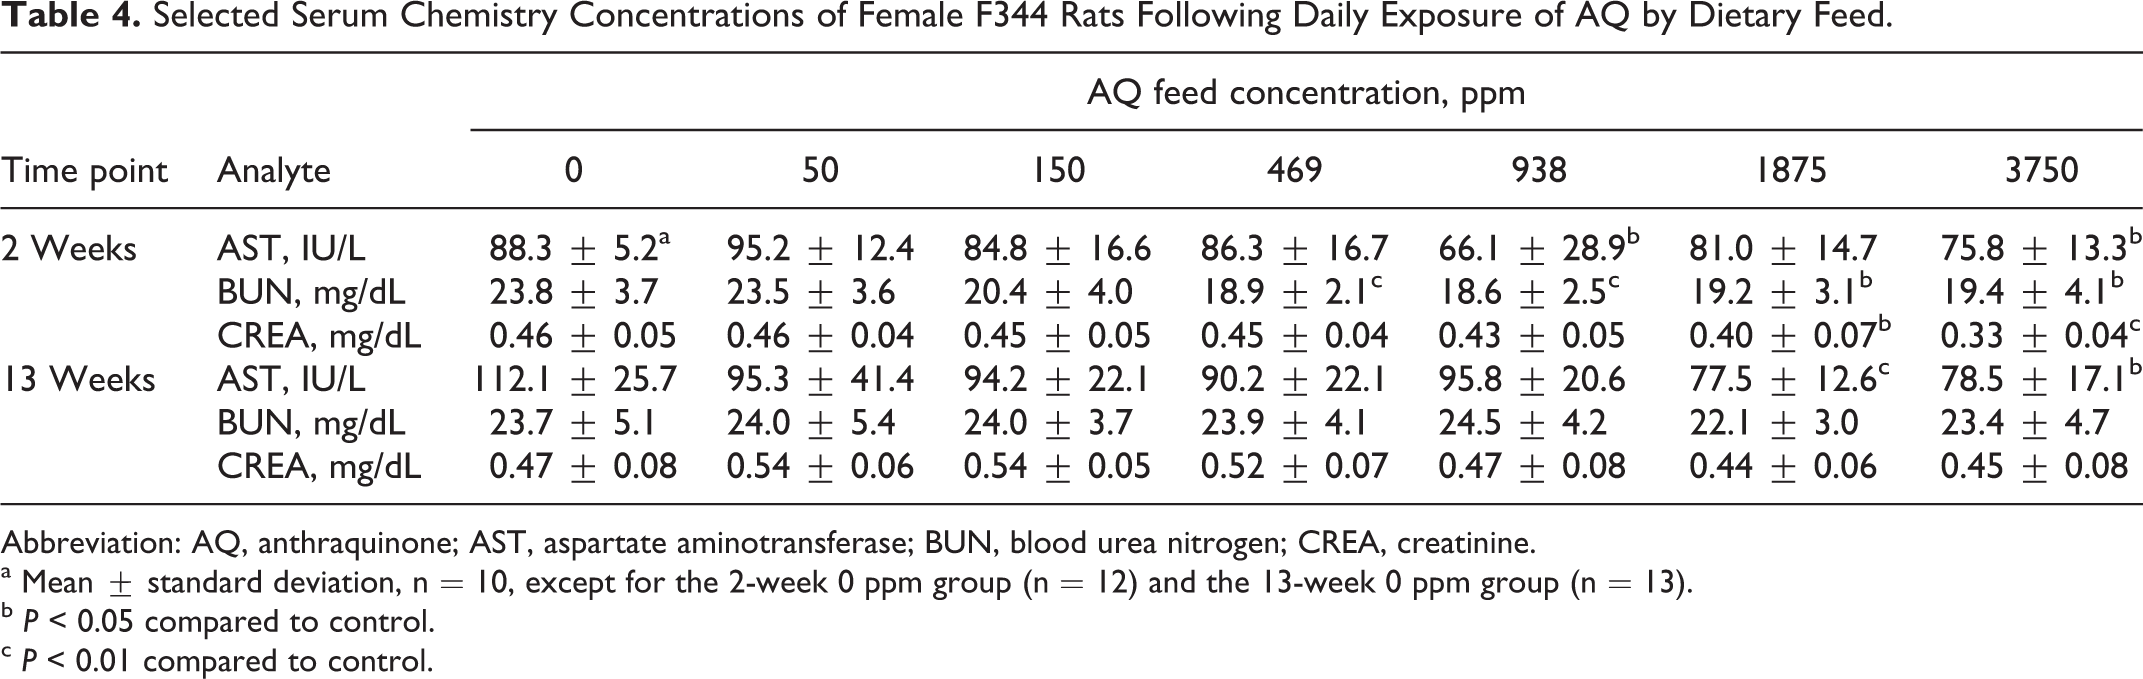
Abbreviation: AQ, anthraquinone; AST, aspartate aminotransferase; BUN, blood urea nitrogen; CREA, creatinine.
a Mean ± standard deviation, n = 10, except for the 2-week 0 ppm group (n = 12) and the 13-week 0 ppm group (n = 13).
b P < 0.05 compared to control.
c P < 0.01 compared to control.
There were no AQ exposure-related gross observations during animal necropsies of the 2- and 13-week time points. There were no AQ exposure-related microscopic findings in the lungs or urinary bladders. Following 2 weeks of exposure, minimal to mild hypertrophy was observed in the liver at ≥938 ppm AQ (Table 5). The liver hypertrophy was centrilobular in distribution. Mild centrilobular hypertrophy was also observed in the liver of rats of the 3 highest AQ exposure groups following 13 weeks of exposure (Table 5 and Figure 1). Additional histological findings in rats exposed to AQ for 13 weeks were mild hematopoietic cell proliferation and pigmentation of the spleen and minimal hyaline droplets in the kidney (Table 5). Hematopoietic cell proliferation was characterized by an increase in the number of hematopoietic cells in the red pulp, and the pigment was red brown in color. Renal hyaline droplets were within the cytoplasm of tubule epithelial cells within the lumens of the tubules and were yellow brown to dull eosinophilic in color and variably sized (Figure 2).
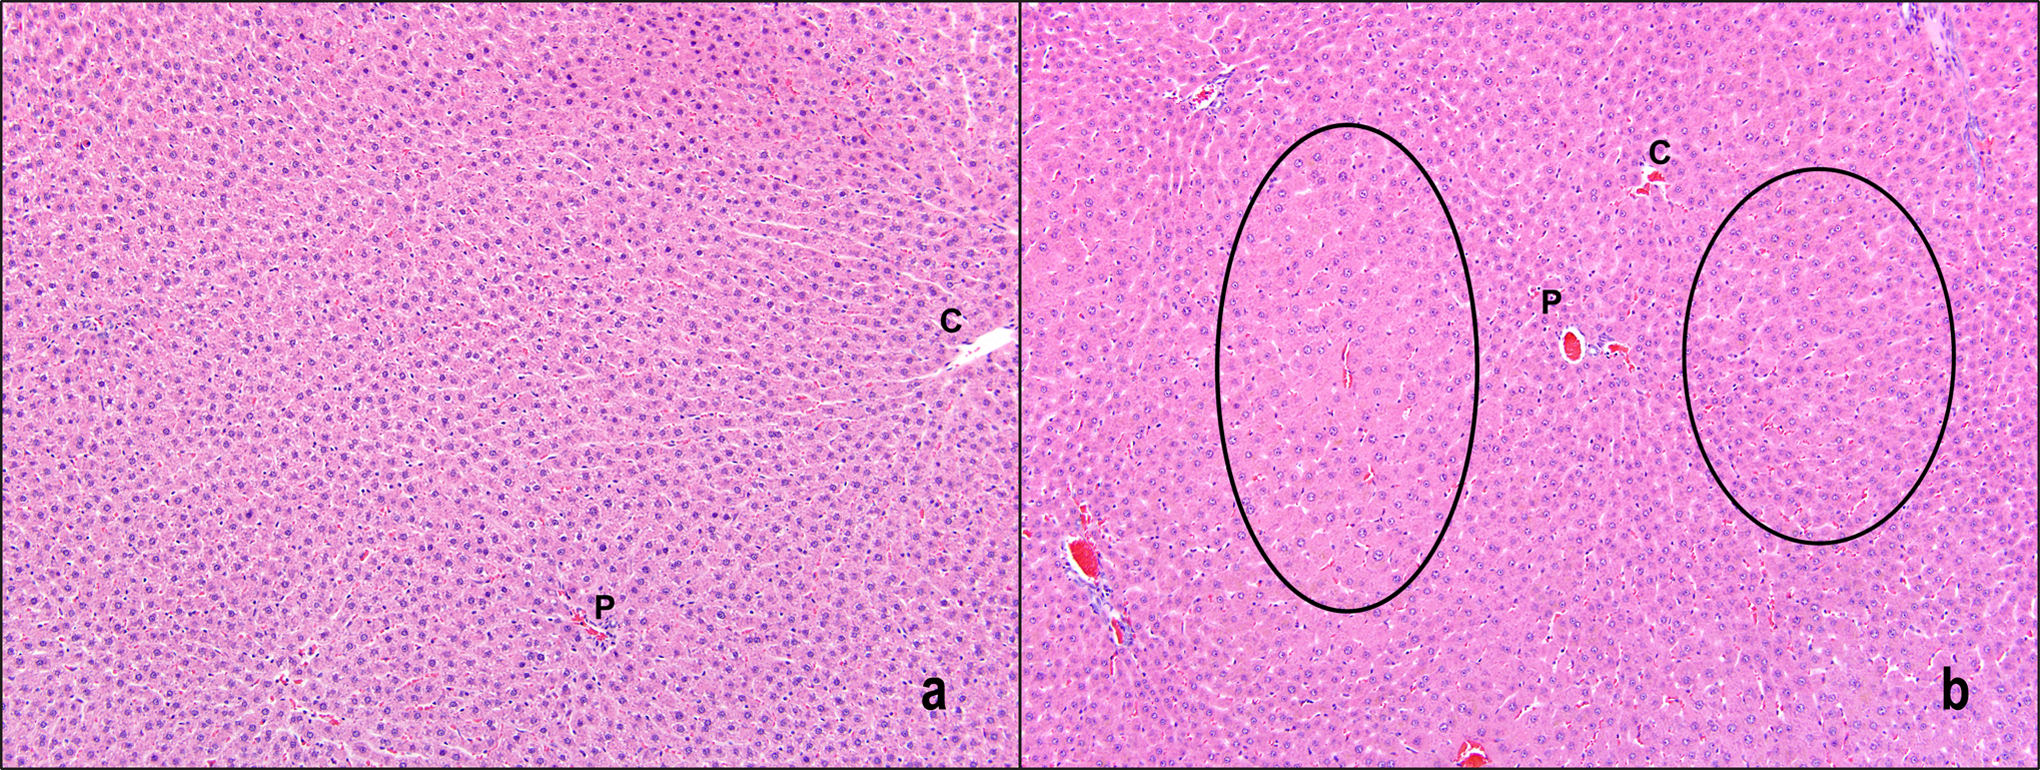
Centrilobular hypertrophy (circled areas) in the liver of rats following 13 weeks of AQ exposure. a, 0 ppm (control) and (b) 3750 ppm. Hematoxylin and eosin; 10×. P indicates portal vein; C, central vein; AQ, anthraquinone.
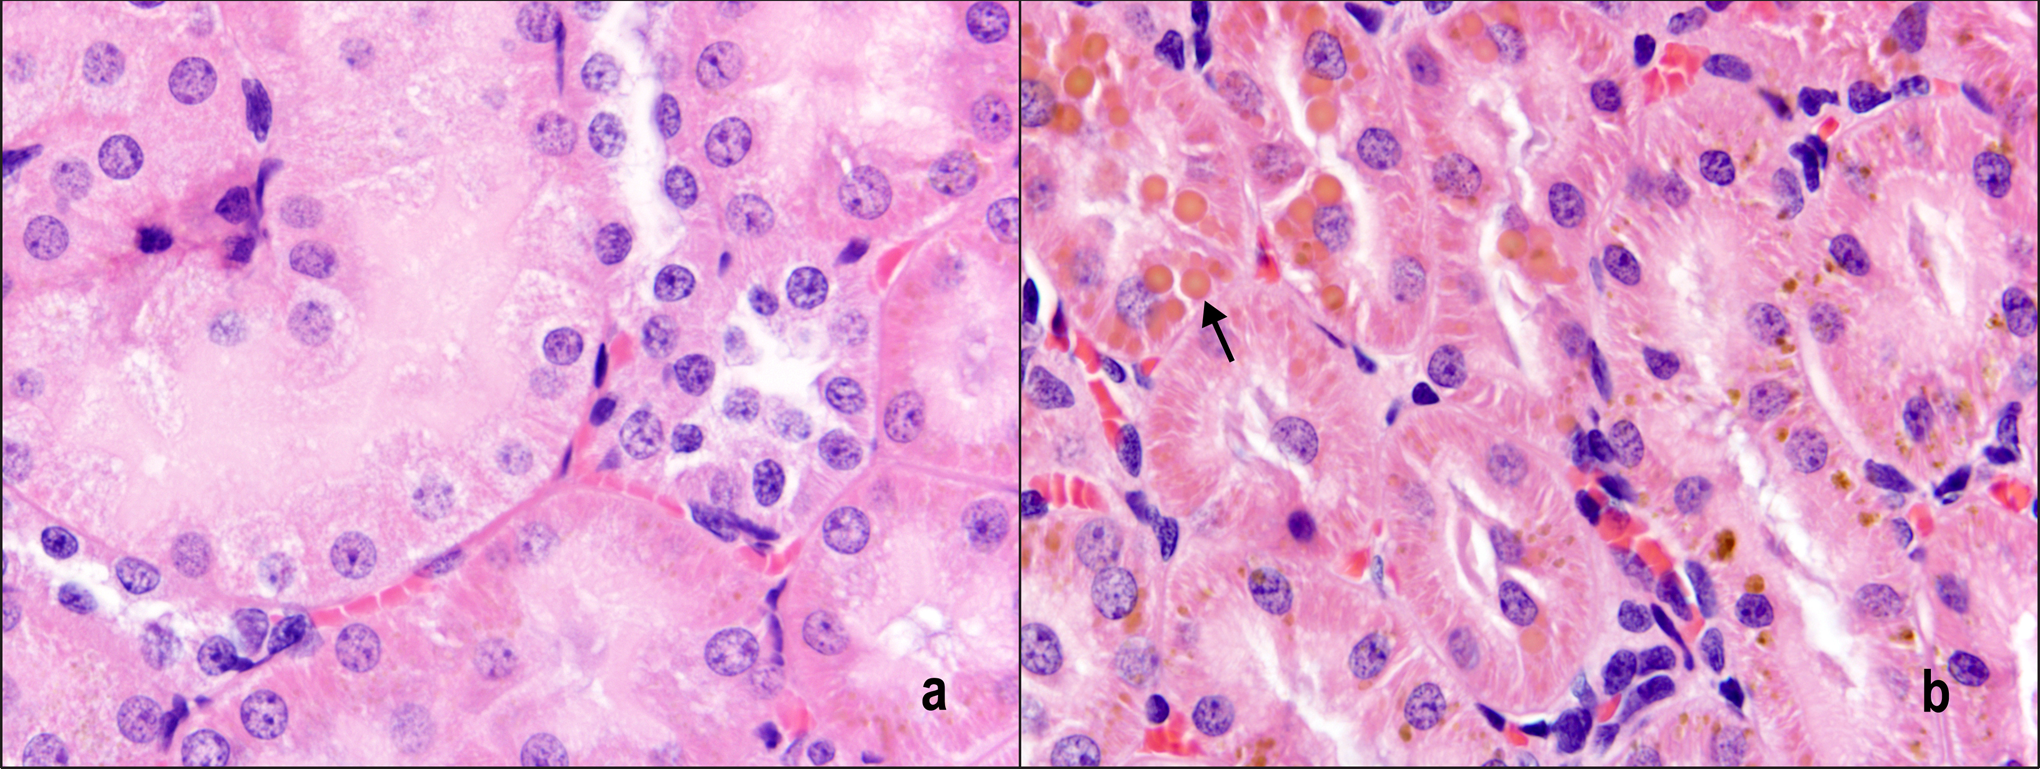
Hyaline droplets (arrow) in the kidney of rats following 13 weeks of AQ exposure. a, 0 ppm (control) and (b) 3750 ppm. Hematoxylin and eosin; 80×. AQ indicates anthraquinone.
Selected Histopathologic Changes in Female F344 Rats Following Daily Exposure of AQ by Dietary Feed.
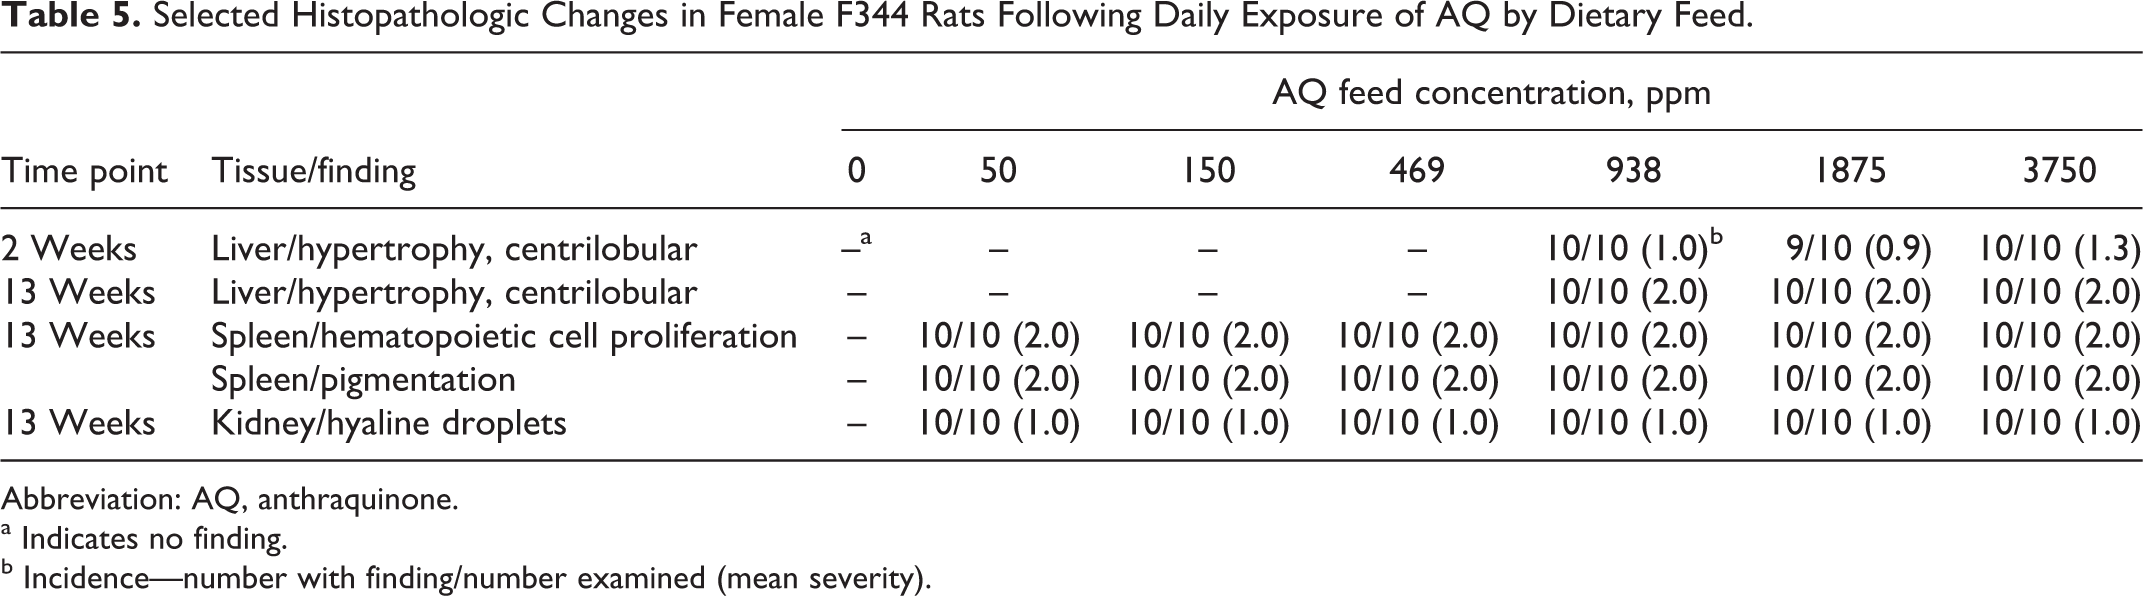
Abbreviation: AQ, anthraquinone.
a Indicates no finding.
b Incidence—number with finding/number examined (mean severity).
Discussion
In a rat dietary carcinogenic study at AQ concentrations of 469 to 3750 ppm, the kidney, liver, spleen, and urinary bladder were identified as critical target organs of effect following chronic exposure. 7 Toxicity was also observed in these organs following 14 weeks of exposure at diet AQ concentrations of 1875 to 30 000 ppm; and in the kidney, liver, and urinary bladder of F344 rats exposed for 32 days to diet AQ concentration of 469 to 3750 ppm. 7 Results in the current study agree very well with the NTP studies and demonstrate a continuum of AQ effects in female rats at lower diet concentrations (50-3750 ppm) and at different durations of exposure (2 and 13 weeks). In a separate 3-month oral feed study using Wistar rats, an NOAEL of 15 ppm AQ was selected; however, the basis for the NOAEL was a decrease in food consumption and an increase in absolute liver weights but no tissue histopathology. 6 The current study provides data useful for selection of a 13-week NOAEL based on tissue histopathology.
Following 2 weeks of exposure, food consumption and body weights were slightly lower than controls in the higher AQ groups (≥938 ppm). At necropsy, liver and spleen weights were mildly increased (≥150 ppm). Serum levels of AST, BUN, and creatinine were decreased, and the liver had noteworthy microscopic changes (minimal centrilobular hypertrophy at ≥938 ppm). In NTP’s 32-day study, 7 body weights were unchanged in the female rats following 8 or 32 days of AQ exposure, but liver and kidney weights were increased at both the time points (≥469 ppm). The incidences of liver hypertrophy and kidney hyaline droplets were increased compared to controls in female rats exposed to ≥938 ppm AQ following 32 days. 7 The toxicological significance of the decrease in serum AST, BUN, and creatinine in the current study is unclear and in contrast to the statistically significant increases in serum creatinine, total protein, alanine aminotransferase, and ALP observed in female rats of higher AQ exposure groups (≥1875 ppm) on study days 4, 22, or study week 14. 7
When the exposure duration increased from 2 to 13 weeks, weekly body weight and food consumption values of AQ-exposed rats remained lower than control values but did not increase in severity. In addition to the increase in liver and spleen weights that were observed following 2 weeks of exposure, the kidney and urinary bladder weights were also increased at 13 weeks (Table 3). Only the increase in liver weights continued to show a consistent AQ concentration-dependent relationship. The magnitude of the observed increases in liver weights between 2 and 13 weeks of exposure was similar. Serum chemistry values between control and AQ-exposed rats were similar at 13 weeks indicating a return to normal levels from being mildly decreased. Microscopically, the incidence of liver centrilobular hypertrophy did not change between the 2-week and 13-week AQ exposure groups, though the severity slightly increased (minimal to mild). An increase in exposure duration at lower AQ concentrations (≤469 ppm) did not induce liver hypertrophy but an increase in exposure duration did induce effects in the spleen and kidney of all AQ exposure groups. However, the effects in the spleen (hematopoietic cell proliferation and pigmentation) and kidney (hyaline droplets) were not AQ concentration dependent with respect to incidence or severity. The 13-week findings of the current AQ study are in agreement with observed findings in female rats of NTP’s 14-week AQ study conducted at higher concentrations, 7 such as lower body weights, increased liver and kidney weights, liver hypertrophy, eosinophilic hyaline droplets in the kidney, and splenic hematopoietic cell proliferation and pigmentation. Notably, higher AQ concentrations did result in minimal anemia, serum clinical changes, bone marrow hyperplasia, kidney nephropathy, and thyroid gland follicular cell hypertrophy in female rats after 14 weeks exposure 7 but the current study did not evaluate these end points.
Blood AQ levels increased proportionally with AQ exposure concentration (Table 1). A 25-fold increase in feed AQ concentrations (150-3750 ppm) agreed well with the 20-fold increase in blood AQ levels (0.75-14.8 µg/mL). There was no difference in blood AQ concentrations between 2 and 13 weeks of exposure. In previous studies, plasma AQ concentrations in female rats at the 3-month interim evaluation showed a 2- to 3-fold increase between feed AQ concentrations of 469 and 938 ppm, but no difference was observed in plasma AQ levels between feed AQ concentrations of 938, 1875, and 3750 ppm. 7 Plasma AQ concentrations in male rats following 8 days of AQ diet administration showed better linearity compared to the 3-month data set. 7 In the 2-year study, plasma AQ levels in female rats were approximately twice the plasma AQ levels in male rats 7 which may explain in part the greater responsiveness in females versus males at similar AQ exposure conditions. There was very good agreement in calculated administered doses between the current study and the NTP study. Administered AQ doses in the current 13-week study were 31, 60, 121, and 241 mg/kg/d for feed AQ concentrations of 469, 938, 1875, and 3750 ppm, respectively, and at week 14 of the 2-year study were 28, 55, 107, and 226 mg/kg/d for F344 female rats of identical feed groups. 7 The NTP developed a physiologically based pharmacokinetic (PBPK) model to characterize tissue AQ concentrations in rats following oral administration. 7 Results of the PBPK model indicated plasma AQ concentrations can serve as an internal dosimeter consequent to exposure in feed. In female rats, plasma AQ concentrations were proportional to kidney AQ concentrations. 7
Mechanistic studies with AQ are limited to help determine the pathology associated with the major effects observed in the current study (liver centrilobular hypertrophy, splenic hematopoietic cell proliferation and pigmentation, and kidney hyaline droplets). The NTP conducted a 32-day feed study in male and female F344 rats at AQ concentrations of 469, 938, and 3750 ppm to further evaluate the activity of AQ at target organ sites, where carcinogenic effects were observed. 7 End points included liver CYP activity (day 8), liver and kidney 8OHdG and 2′-deoxyguanosine concentrations (day 8), and cell proliferation in the liver, kidney, and urinary bladder (day 32). Liver CYP1A1 and CYP2B1 were increased at day 8, and the increases were concentration related for CYP2B1. Longo et al 13 also observed induction of liver CYP1A2 and CYP2B but not CYP1A1 in rats administered intragastrically with 100 mg/kg AQ (corn oil vehicle) daily for 3 days. Induction of drug-metabolizing enzymes is associated with liver hypertrophy. Cell proliferation was not observed in the livers or kidneys of AQ-dosed rats following 32 days of exposure. 7 The NTP 2-year study confirmed the presence of α2µ-globulin in the kidneys of male rats, but the identity of protein composition of droplets in kidneys of female rats was not investigated. 7 The relationship of the kidney hyaline droplets, nephropathy, and renal adenomas or papillomas in AQ-exposed rats remains unclear. In the current study, alterations in the spleen were consistent with an erythropoietic response to the observation of a minimal to mild, macrocytic, responsive anemia in rats exposed to ≥3750 ppm AQ by day 26 of the 14-week study. 7 The nonneoplastic effects of AQ on the spleen were consistent throughout the 2-year study but did not lead to neoplastic effects. The current study and NTP’s 14-week study did not show urinary bladder histopathology in female rats except at an AQ concentration of 30 000 ppm. 7 Yet, an increase in cell proliferation was observed in female (≥938 ppm) and male (3750 ppm) urinary bladders in the 32-day study without microscopic alterations. 7 Urinary bladder tumors were observed in female and male rats exposed to AQ for 2 years. 7
In conclusion, female F344 rats administered AQ by dietary feed at concentrations up to 3750 ppm for 13 weeks had reduced body weight and food consumption compared to control values; increased liver, kidney, spleen, and urinary bladder weights; and microscopic alterations in the liver (mild centrilobular hypertrophy), spleen (mild hematopoietic cell proliferation and pigmentation), and kidneys (minimal hyaline droplets). In the current study, effects in the liver appeared consistently related to AQ dose compared to effects observed in other target organs. Since the NTP study 7 clearly demonstrated liver toxicity following chronic exposure at diet concentrations ≥469 ppm of AQ (centrilobular hypertrophy, cystic degeneration, inflammation, eosinophilic focus, and hepatocellular adenoma), the observed increases in liver weights and incidence of centrilobular hypertrophy in the current study at diet concentrations ≥938 ppm AQ were considered to be part of a pathological continuum that became more adverse with continued exposure. Thus, an NOAEL of 469 ppm AQ (31.3 mg/kg/d) was selected based on the absence of liver histopathology. The selection of this NOAEL is in agreement with the results of NTP’s 32-day feed study, where female rats exposed to 469 ppm AQ had a low but not statistically significant incidence of liver hypertrophy. 7
Footnotes
Acknowledgments
We thank Carol Bobbitt, Kathy Bragg, Nigel Edgerton, Kay Roberts, Mark Sochaski, and other members of The Hamner Institutes’ laboratory animal care, necropsy, clinical chemistry, and analytical chemistry groups and EPL’s histology staff for technical support.
Declaration of Conflicting Interests
The author(s) declared no potential conflicts of interest with respect to the research, authorship, and/or publication of this article.
Funding
The author(s) disclosed receipt of the following financial support for the research, authorship, and/or publication of this article: The study was funded by the American Chemistry Council’s Long-Range Research Initiative.