
Abstract
The wide scale use of copper oxide nanoparticles (CuONPs) due to their unique properties and important applications in magnetic, thermal, electrical, sensor devices, and cosmetics makes human beings more prone to the exposure of CuONPs and its potential adverse effects. Exposure to such nanoparticles is mainly through skin and inhalation. Therefore, the aim of the present study was to assess the apoptotic and genotoxic potential of CuONPs (50 nm) in the human skin epidermal (HaCaT) cells and its underlying mechanism of cellular toxicity. Significant decreases in cell viability were observed with CuONPs exposure in a dose- and time-dependent manner and also induced significant reduction in glutathione and induction in lipid peroxidation, catalase, and superoxide dismutase in HaCaT cells. A significant increase in caspase-3 activity was observed with CuONPs exposure in HaCaT cells indicating apoptosis. Apoptosis or necrosis was confirmed with fluorescent staining (acridine orange and propidium iodide). The CuONPs also induced DNA damage that was mediated by oxidative stress. This study investigating the effects of CuONPs in human skin cells has provided valuable insights into the mechanism of potential toxicity induced by CuONPs.
Introduction
Nanotechnology is a new promising field with potential applications in domestic, industrial, and biomedical products. 1 Due to the growing number of applications, there is an increasing risk of human and environmental exposure to nanomaterials. Their potential toxicological impacts are still a matter of investigation, and our actual knowledge on the effects of engineered nanosized contaminants on biological systems remains incomplete. 2,3 These effects need to be assessed in order to provide a scientific basis for safe development of nanotechnologies. Copper oxide nanoparticles (CuONPs) possess biocide properties that are interesting for applications in antimicrobial textiles, paints, and plastics. 4 However, CuONPs were found to be highly toxic compared to other carbon or metal oxide nanomaterials. 5 Due to their small size, as nanoparticles (NPs) may cross biological barriers to reach different organs and according to their size and surface properties, accumulation of metal NPs was previously observed in different organs. 6 However, there are only a few reports describing the toxicity of CuONPs in bacteria, crustaceans, and zebra fish. 7
Free oxygen radical generation and oxidative stress elicit a wide variety of cellular events including DNA damage and apoptosis. 8 Among different metal oxide NPs, CuO was shown to cause the most severe cytotoxicity and DNA damage in lung and laryngeal epithelial cells, essentially through oxidative stress. 9 Moreover, under in vitro conditions, CuONPs were also found to induce toxic effects in different types of neuronal cells such as the human SH-SY5Y neuroblastoma and H4 neuroglioma cells. 10,11 However, several aspects of CuONPs toxicity on such cellular systems remain unknown. Genotoxicity of nanomaterials is of particular concern, since an alteration of the genetic material has potential for cell death, tissue malfunction, cancer development, reproductive adverse effects, and/or fertility impairment. Skin is the largest organ of the body and could serve an important portal route for entry of NPs in the human body. Sharma et al 12 have reported that CuONPs induced a disruption of the blood–brain barrier in mice and rats. The CuONPs have also been shown to produce reactive oxygen species (ROS) leading to the toxicity. 13 Therefore, in the present study, an attempt was made to assess the cellular toxicity and genotoxic potential of CuONPs in human skin epidermal cells as well as to understand its possible mechanism.
Materials and Methods
Chemicals and Reagents
Fetal bovine serums (FBSs), penicillin–streptomycin, and Dulbecco modified Eagle medium (DMEM)/F-12 medium were purchased from Invitrogen Co (Carlsbad, California). The CuONPs (CAS-No. 1317-38-0, Product No. 544868, average particle size: 50 nm, and surface area 29 m2/g), glutathione (GSH), 5,5-dithio-bis-(2-nitrobenzoic acid; DTNB), MTT [3-(4,5-dimethylthiazol-2-yl)-2,5-diphenyltetrazolium bromide], 2,7-dichlorofluorescin diacetate (DCFH-DA), and propidium iodide (PI) were obtained from Sigma-Aldrich (St. Louis, Missouri).
All other chemicals used were of the high purity and available from commercial sources.
Copper Oxide NP Preparation and Characterization
The CuONPs were suspended in Milli-Q water at a concentration of 1 mg/mL. Stock suspension was probe sonicated at 40 W for 15 minutes. The optical absorption of the CuONPs suspension was measured using a double-beam ultraviolet–visible spectrum (Varian-Cary-300 ultraviolet-visible spectrophotometer; Varian Inc, Columbia, Maryland) in the wavelength range of 200 to 800 nm at room temperature. The average hydrodynamic size of CuONPs was measured by dynamic light scattering (DLS, Nano-Zetasizer-HT; Malvern Instrument, UK), and the DLS experiments were performed as described by Murdock et al. 14
Samples for transmission electron microscopy (TEM) analysis were prepared by drop-coating CuONPs solution on carbon-coated copper TEM grids. The films on the TEM grids were allowed to dry prior to measurement. The TEM measurements were performed on a JEOL model 2100 F instruments (JEOL Ltd, Tokyo, Japan) operated at an accelerating voltage at 200 kV.
Cell Culture and Exposure to CuONPs
Human skin epidermal cell line (HaCaT; passage no. 20) was procured from American Type Culture Collection (Rockville, Maryland), and it was preserved and subcultured up to passage no. 48 in the laboratory and was used to determine the cell viability against CuONPs. The cells were cultured in DMEM/F-12 medium supplemented with 10% FBS and 100 U/mL penicillin–streptomycin at 5% CO2 and 37°C. At 85% confluence, the cells were harvested using 0.25% trypsin and were subcultured into 75-cm2 flasks, 6-well plates, and 96-well plates according to the experiment. The cells were allowed to attach to the surface for 24 hours prior to treatment. The CuONPs were suspended in the cell culture medium and diluted to appropriate concentrations (5, 10, 20, and 30 μg/mL). The appropriate dilutions of CuONPs were then sonicated using a sonicator bath at room temperature for 10 minutes at 40 W to avoid particles agglomeration before exposure to the cells. Cells not exposed to CuONPs served as control in each experiment.
Cell Morphology
Morphology of HaCaT cells was observed after exposure to different concentrations of CuONPs for 24 and 48 hours using a Leica DMIL Phase-Contrast microscope (Leica, Wetzlar, Germany).
Copper Oxide NPs Uptake in HaCaT Cells
Human skin epidermal cells (1 × 10⁵ cells/well) were seeded in 6-well cell culture plates. After 24 hours seeding, the cells were exposed to CuONPs (20 µg/mL) for 24 hours. After exposure, the treatment was aspirated, and the cells were washed twice with 1× phosphate-buffered saline (PBS). The cells were fixed with 2.5% glutaraldehyde in a 6-well plate, scraped, and centrifuged. After washing with 0.1% phosphate buffer, the pellet was postfixed in 1% osmium tetraoxide for 3 hours. The fixed pellet was then washed and dehydrated through acetone (30%-100%). Sample was infiltrated with Araldite resin overnight at room temperature and finally embedded in pure resin. The blocks were cured at 60°C for 72 hours. After incubation, ultrathin sections (60 nm) were prepared using Reichert-Jung ultra-microtome (Reichert-Jung; Vienna, Austria). The sections were stained with uranyl acetate and Reynold lead citrate. The grids were examined under a TEM (JEM-2100; JEOL Ltd) operated at an accelerating voltage of 120 kV using a 20-µm aperture.
The MTT Assay
The MTT assay was used to investigate mitochondrial function as described by Mossman. 15 Briefly, 1 × 10⁴ cells/well were seeded in 96-well plates and exposed to different concentrations (0, 5, 10, 20, and 30 µg/mL) of CuONPs for 24 and 48 hours. At the end of exposure, culture media was replaced with new media containing MTT solution (0.5 mg/mL) and incubated for 4 hours at 37°C. As a result, formazan crystal was formed, and it was dissolved in dimethyl sulfoxide (DMSO). The plates were kept on shaker for10 minutes at room temperature and then analyzed at 530 nm using multiwall microplate reader (Omega Fluostar; BMG Labtech, Ortenberg, Germany). Untreated sets were also run under identical conditions and served as control.
Lactate Dehydrogenase Leakage Assay
The release of cytoplasmic lactate dehydrogenase (LDH) enzyme into the culture medium was determined by Wroblewski and LaDue. 16 The HaCaT cells were treated with different concentrations (0, 5, 10, 20, and 30 µg/mL) of CuONPs for 24 and 48 hours. After exposure, 100 µL of samples were collected from the centrifuged culture media. The LDH activity was assayed in 3.0 mL of reaction mixture with 100 μL of pyruvic acid (2.5 mg/mL phosphate buffer) and 100 μL of reduced nicotinamide adenine dinucleotide (NADH; 2.5 mg/mL phosphate buffer), and the rest of the volume was adjusted with phosphate buffer (0.1 mol/L, pH 7.4). The rate of NADH oxidation was determined by following the decrease in absorbance at 340 nm for 3 minutes at 1-minute intervals at 25°C using a spectrophotometer (Varian-Cary 300 Bio). The amount of LDH released is expressed as LDH activity (IU/L) in culture media.
Measurement of Intracellular ROS
The ROS generation was assessed in HaCaT cells after exposure to different concentrations (0, 5, 10, 20, and 30 µg/mL) of CuONPs using DCFH-DA dye as fluorescence agent. 17 The ROS generation was studied by 2 methods: fluorometric analysis and microscopic fluorescence imaging. For fluorometric analysis, cells (1 × 10⁴ per well) were seeded in 96-well black bottom culture plates and allowed to adhere them for 24 hours in CO2 incubator at 37°C. Then, the HaCaT cells were exposed to the above concentrations of CuONPs for 24 and 48 hours. On the completion of respective exposure periods, the cells were incubated with DCFH-DA (10 mmol/L) for 30 minutes at 37°C. The reaction mixture was aspirated and replaced by 200 µL of PBS in each well. The plates were kept on shaker for 10 minutes at room temperature in the dark. Fluorescence intensity was measured using multiwell microplate reader (Omega Fluostar) at excitation wavelength of 485 nm and at emission wavelength of 528 nm, and values were expressed as percentage of fluorescence intensity relative to control wells.
Parallel set of cells (5 × 10⁴ per well) was analyzed for intracellular fluorescence using upright fluorescence microscope equipped with charge-coupled device cool camera (Nikon Eclipse 80i equipped with Nikon DS-Ri1 12.7 mega pixel camera; Nikon, Tokyo, Japan).
Oxidative Stress Biomarkers
Cells at a final density of ∼6 × 10⁶ in a 75-cm2 culture flask were exposed to different concentrations (0, 5, 10, 20, and 30 µg/mL) of CuONPs for 24 and 48 hours. After exposure, the cells were scraped and washed twice with chilled 1× PBS. The harvested cell pellets were lysed in cell lysis buffer (20 mmol/L Tris-HCl [pH 7.5], 150 mmol/L NaCl, 1 mmol/L Na2EDTA, 1% Triton, and 2.5 mmol/L sodium pyrophosphate). The cells were centrifuged at 15 000g for 10 minutes at 4°C, and the supernatant (cell extract) was maintained on ice until assayed for oxidative-stress biomarkers. Protein content was measured by the method of Bradford, 18 using bovine serum albumin as the standard.
Lipid peroxidation assay
The extent of membrane lipid peroxidation (LPO) was estimated by measuring the formation of malondialdehyde (MDA) using the method of Ohkawa et al. 19 The MDA is one of the products of membrane LPO. A mixture of 0.1 mL of cell extract and 1.9 mL of 0.1 mol/L sodium phosphate buffer (pH 7.4) was incubated at 37°C for 1 hour. The incubation mixture, after precipitation with 5% trichloroacetic acid, was centrifuged (2300g for 15 minutes at room temperature), and the supernatant was collected. Then, 1.0 mL of 1% thiobarbituric acid was added to the supernatant and placed in the boiling water for 15 minutes. After cooling to room temperature, absorbance of the mixture was taken at 532 nm and expressed in nmol MDA/h/mg protein using molar extinction coefficient of 1.56 × 10⁵ mol/L cm.
Glutathione estimation
The GSH level was quantified using Ellman reagent. 20 The assay mixture contained phosphate buffer, DTNB, and cell extract. The reaction was monitored at 412 nm, and the amount of GSH was expressed in terms of nmol GSH/mg protein.
Measurement of superoxide dismutase
Superoxide dismutase (SOD) activity was estimated using a method described by Kakkar et al. 21 The assay mixture contained sodium pyrophosphate buffer, nitroblue tetrazolium, phenazinemethosulfate, NADH, and the required volume of cell extract. One unit of SOD enzyme activity is defined as the amount of enzyme required for inhibiting the chromogen production (optical density at 560 nm) by 50% in 1 minute under assay conditions and expressed as specific activity in units/min/mg protein.
Measurement of catalase level
Catalase (CAT) activity was measured by following its ability to split hydrogen peroxide (H2O2) within 1 minute of incubation time. The reaction was then stopped by adding dichromate/acetic acid reagent, and the remaining H2O2 was determined by measuring chromic acetate at 570 nm, which is formed by the reduction in dichromate/acetic acid in the presence of H2O2 as described earlier by Sinha. 22 The CAT activity was expressed as μmol/L H2O2 decomposed/min/mg protein.
Quantification of Apoptosis Using PI and Acridine Orange
The CuONP-induced cell death of HaCaT cells was quantified using PI and acridine orange (AO) double staining according to standard procedures 23 and examined under fluorescence microscope (Lieca attached with Q-Fluor Software). Briefly, the cells were seeded at the concentration of 1 × 10⁴ cells/mL in a 30-mm cell culture plate and after 24 hours treated with CuONPs (10.0 µg/mL). Then, the cell culture plates were incubated in the atmosphere of 5% CO2 at 37°C for 48 hours. At the end of exposure, the cells were spun down at 1000 rpm for 10 minutes. Supernatant was discarded, and the cells were washed twice with PBS after centrifuging at 1000 rpm for 10 minutes to remove the medium. Fluorescent dyes containing AO (10 µg/mL) and PI (10 µg/mL) were added into the cell culture plate. Freshly stained cell suspension was dropped on a glass slide and covered by cover slip. The slides were observed under fluorescence microscope within 30 minutes before the fluorescence color starts to fade. The percentage of viable and apoptotic cells was determined in 250 cells. The AO and PI are intercalating nucleic acid-specific fluorochromes that emit green and orange fluorescences, respectively, when they are bound to DNA. Viewed by fluorescence microscopy, viable cells appear to have green nucleus with intact structure, while apoptotic cells exhibit a bright-green nucleus showing condensation of chromatin as dense green areas. Late apoptotic cells and necrotic cells will stain with both AO and PI. Hence, late apoptotic cells exhibited an orange nucleus showing condensation of chromatin, while necrotic cells display an orange nucleus with intact structure.
Caspase-3 Assay
The activity of caspase-3 was determined from the cleavage of the caspase-3 substrate I (N-acetyl-DEVD-p-nitroaniline). The p-nitroaniline was used as the standard. Cleavage of the substrate was monitored at 405 nm, and the specific activity was expressed in picomoles of the product (nitroaniline) per min/mg of protein.
Determination of DNA Strand Breakage
The alkaline single-cell gel electrophoresis was performed as a 3-layer procedure 24 with slight modification. 25 In brief, 70 000 cells/well were seeded in a 6-well plate. After 24 hours of seeding, the cells were treated with different concentrations of CuONPs for 24 and 48 hours. After treatment, the HaCaT cells were trypsinized and resuspended in DMEM, and the cell suspension was centrifuged at 1200 rpm at 4°C for 5 minutes. The cell pellet was finally suspended in chilled PBS for comet assay. Viability of cells was evaluated by Trypan blue exclusion method. 26 The samples showing cell viability higher than 84% were further processed for comet assay. In brief, about 15 µL of cell suspension (approximately 20 000 cells) was mixed with 85 µL of 0.5% low-melting point agarose and layered on one end of afrosted plain glass slide, precoated with a layer of 200 µL normal agarose (1%). Thereafter, it was covered with a third layer of 100 µL of low-melting point agarose. After solidification of the gel, the slides were immersed in lysing solution (2.5 mol/L NaCl, 100 mmol/L Na2EDTA, 10 mmol/L Tris pH 10 with 10% DMSO, and 1% Triton X-100 added fresh) overnight at 4°C. The slides were then placed in a horizontal gel electrophoresis unit. Fresh cold alkaline electrophoresis buffer (300 mmol/L NaOH, 1 mmol/L Na2EDTA, and 0.2% DMSO, pH 13.5) was poured into the chamber and left for 20 minutes at 4°C for DNA unwinding and conversion of alkali-labile sites to single-strand breaks. Electrophoresis was carried out using the same solution at 4°C for 20 minutes, at 15 V (0.8 V/cm) and 300 mA. The slides were neutralized gently with 0.4 mol/L Tris buffer at pH 7.5 and stained with 75 µL ethidium bromide (20 µg/mL). For positive control, the HepG2 cells were treated with 100 µmol/L H2O2 for10 minutes at 4°C. Two slides were prepared from each well (per concentration), and 50 cells per slide (100 cells per concentration) were scored randomly and analyzed using an image analysis system (Komet-5.0; Kinetic Imaging, Liverpool, UK) attached to fluorescence microscope (DMLB, Leica, Germany) equipped with appropriate filters. The parameters, for example, percentage tail DNA (ie, % tail DNA = 100 − % head DNA) and olive tail moment, were selected for quantification of DNA damage in HaCaT cells as determined by the software.
Statistical Analysis
At least 3 independent experiments were carried out in duplicates for each evaluation. Data were expressed as mean (±standard error) and analyzed by 1-way analysis of variance. P value less than .01 was considered statistically significant.
Results
Copper Oxide NPs
The optical absorbance of CuONPs is shown in Figure 1A. Figure 1B shows the typical TEM images of the CuONPs. These pictures exhibit that the majority of the particles were in spherical shape with smooth surfaces. The TEM average diameter was calculated from measuring over 100 particles in random fields of TEM view. The average TEM diameter of CuONPs was 55.80 ± 8.70 nm. Figure 1C represents the frequency of size (nm) distribution of CuONPs.
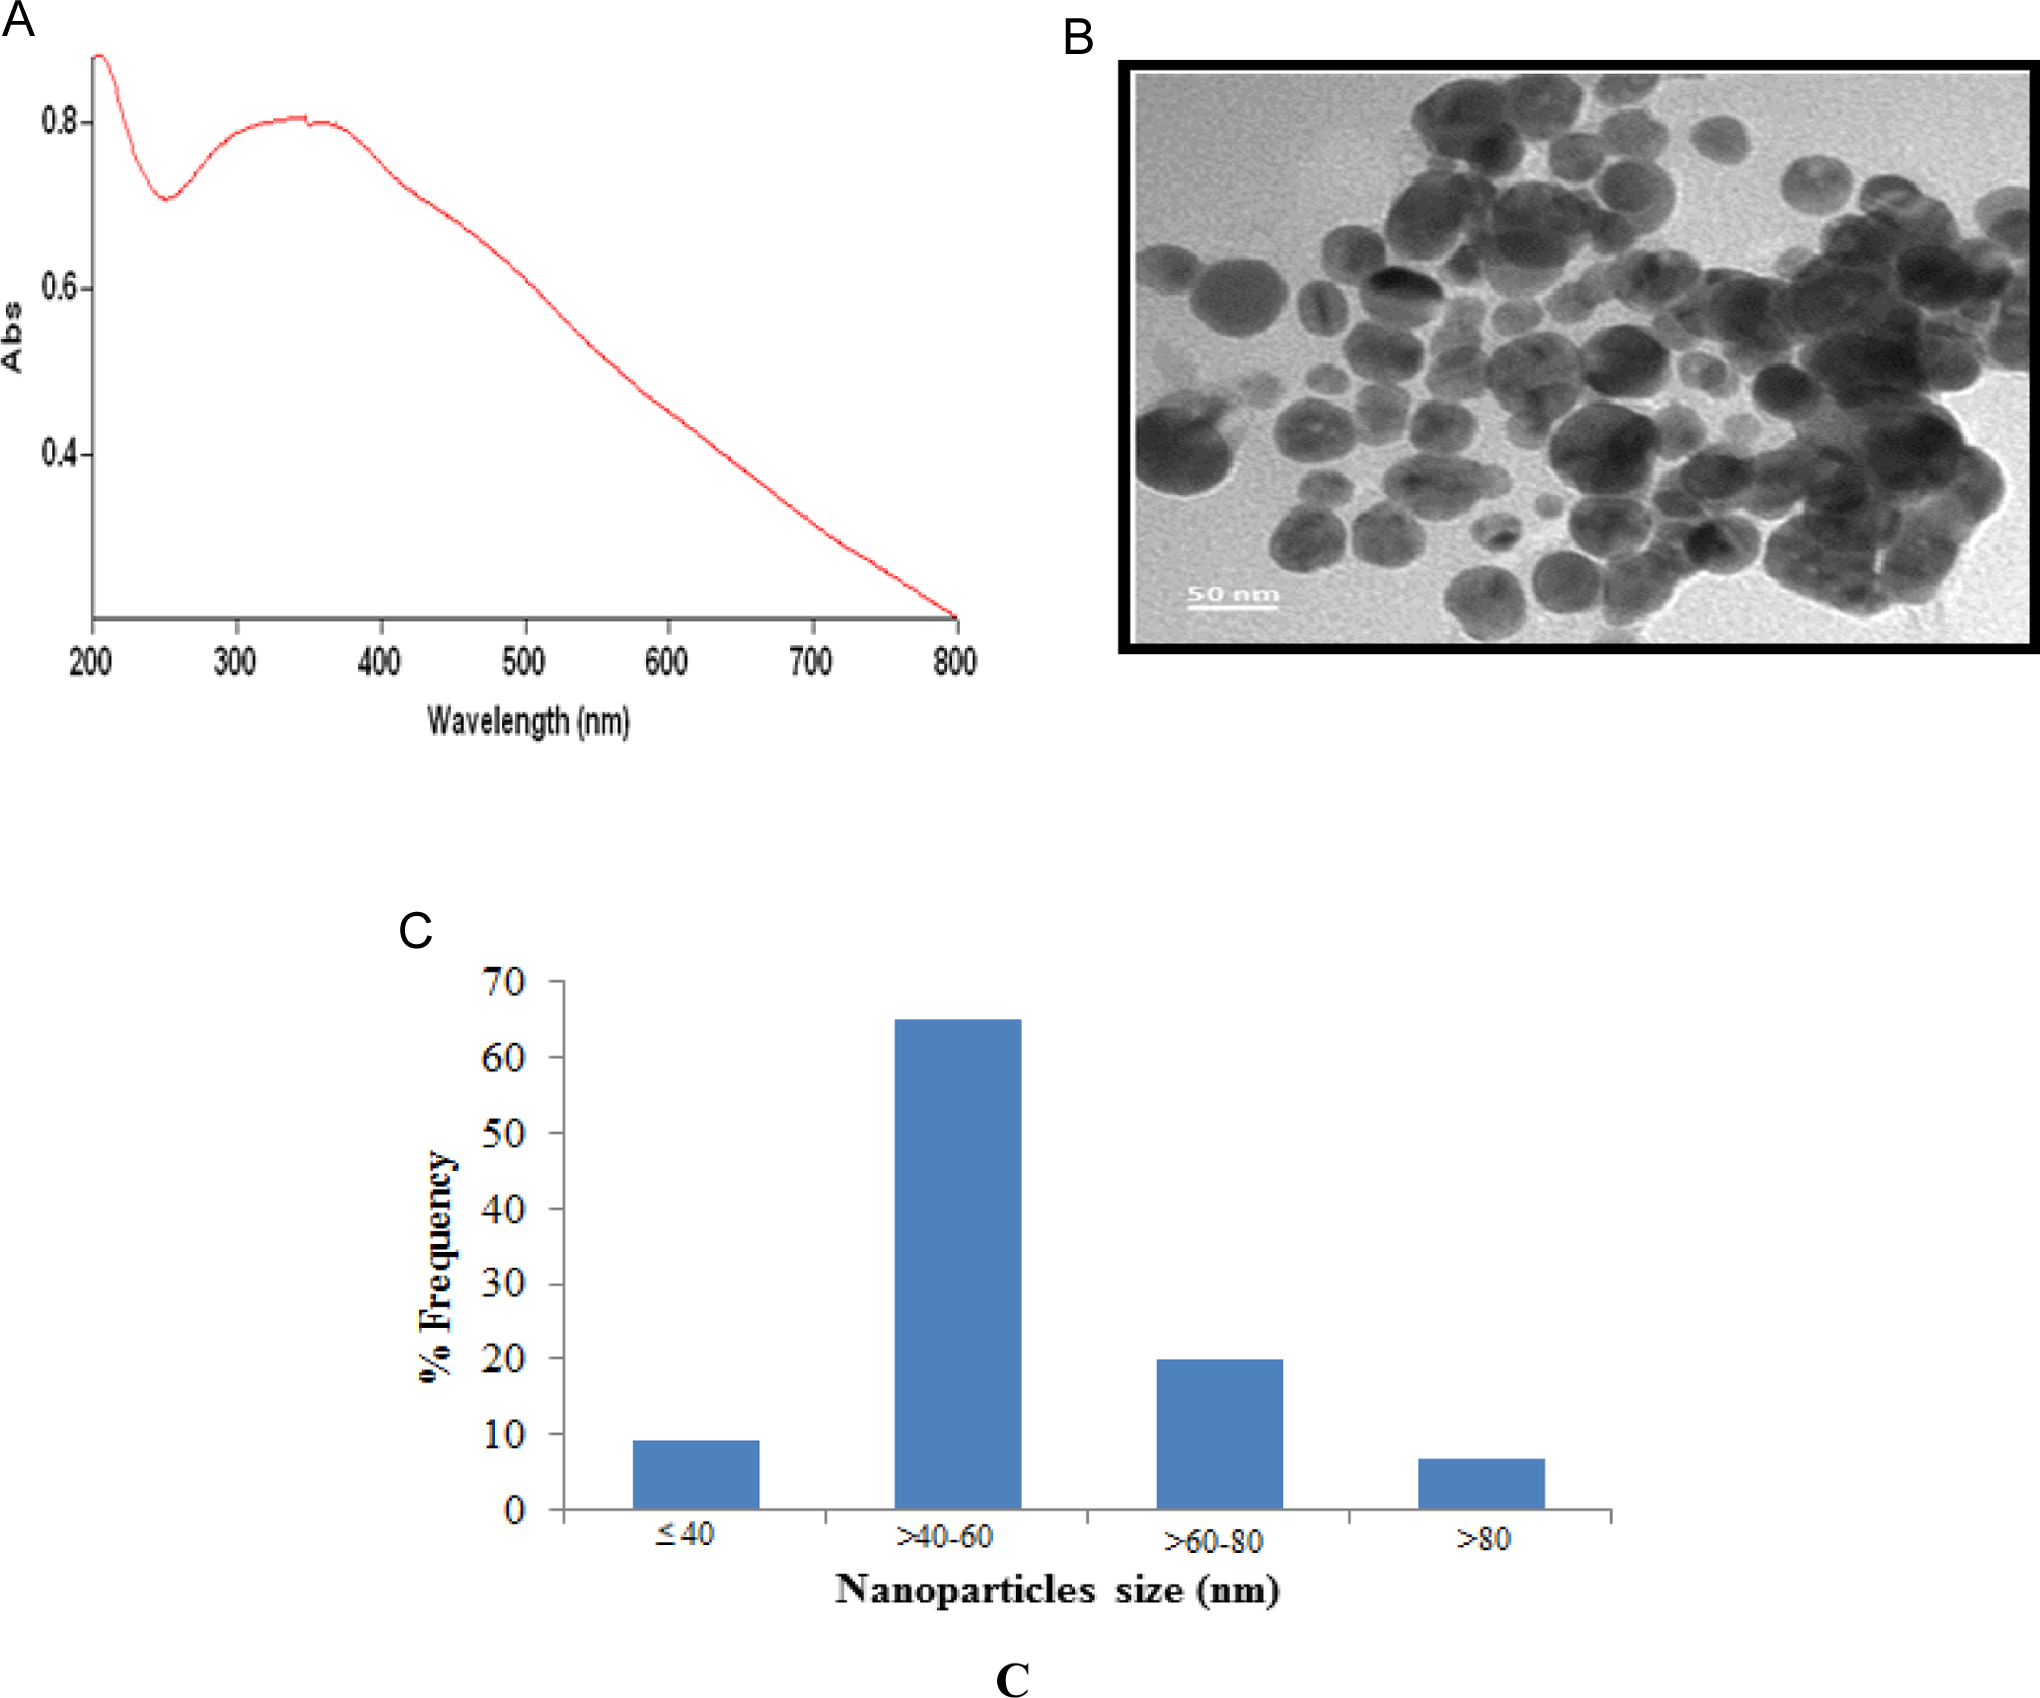
Characterization of CuONPs (A), ultraviolet–visible spectrum of CuONPs (B), and transmission electron microscopic (TEM) image (C). The size distribution histogram was generated using (TEM) image. CuONP indicates copper oxide nanoparticle.
All the data from electron microscopy and associated techniques were obtained under high vacuum and constitutes the size, morphology, and composition analysis characteristics of the CuONPs. The average hydrodynamic size and ζ potential of CuONPs in cell culture medium determined by DLS were 68.5 ± 5 nm and −32.80 mV, respectively.
Morphological Changes and TEM
Figure 2 showed the comparative morphology of untreated and CuONP-treated HaCaT cells. Cells treated with 20 µg/mL of CuONPs changed into spherical shape and detached from the surface (Figure 2B). The HaCaT cells exposed to CuONPs showed a significant cellular uptake of the NPs as evident from the transmission electron microscopic microphotographs (Figure 2C). The transmission electron microscopic images showed that NPs were found to be distributed inside the cells mostly in cytoplasm, but some of them were also found in the nucleus (Figure 2C).
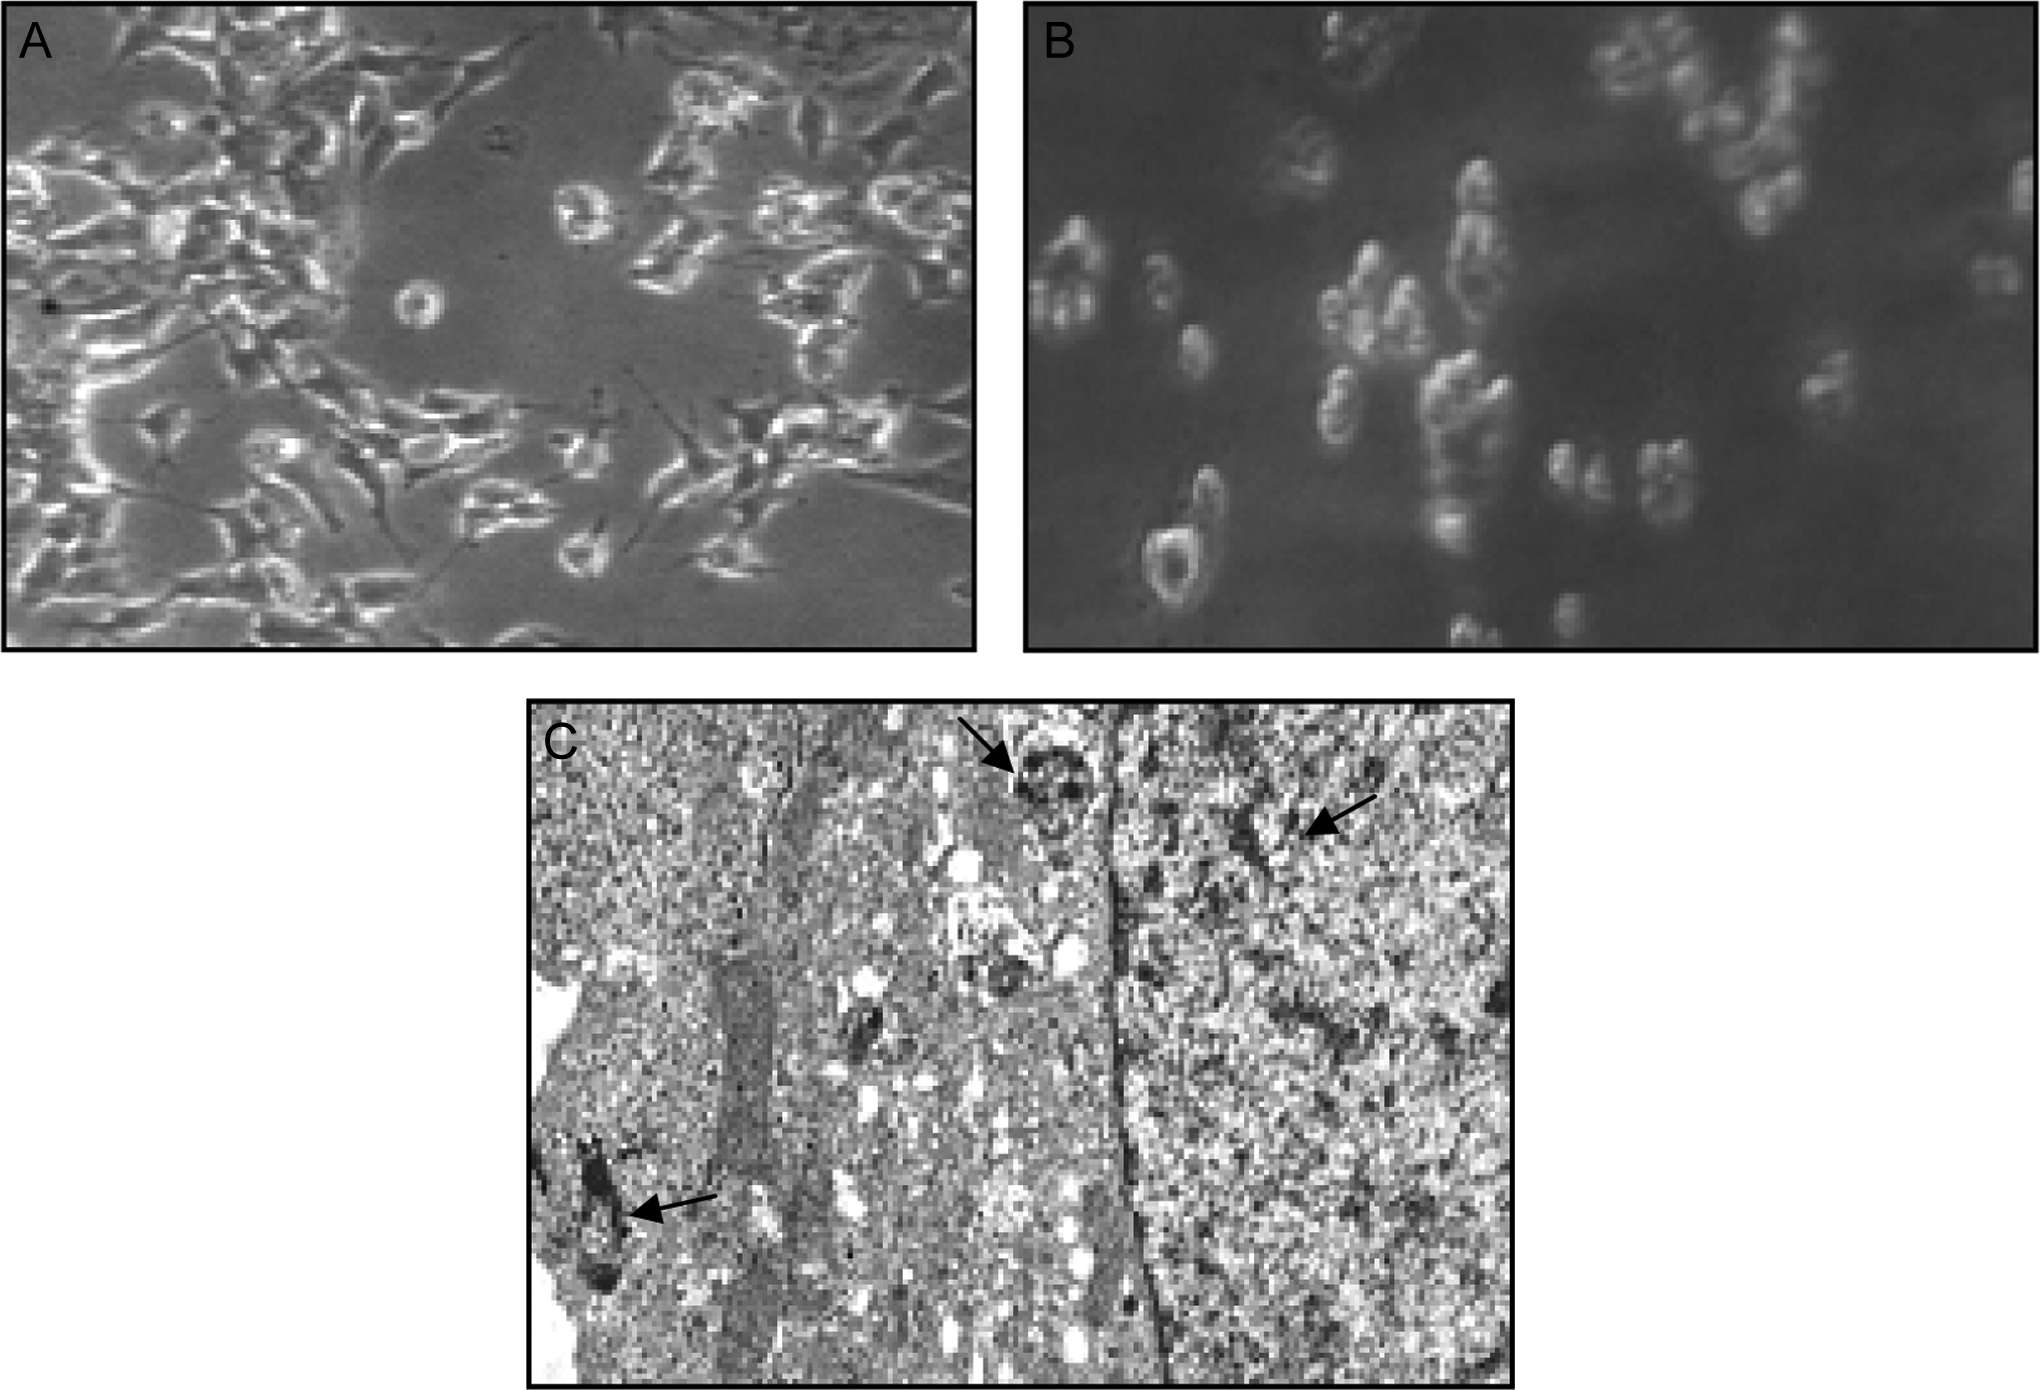
Morphology of the human skin epidermal cells (HaCaT). A, Control, (B) treated at 20 μg/mL of CuONPs, and (C) transmission electron microscopic photomicrographs of HaCaT cells showing internalization of CuONPs (20 µg/mL) in cells, and arrows indicate the presence of CuONPs inside different cellular organelles. CuONP indicates copper oxide nanoparticle.
Copper Oxide NPs Induced Cytotoxicity in HaCaT Cells
We examined the mitochondrial function (MTT reduction) and membrane damage (LDH leakage) as cytotoxicity end points. The MTT results demonstrated a concentration- and time-dependent cytotoxicity after exposure to CuONPs in HaCaT cells (Figure 3A). The cell toxicity observed after 24 hours of exposure at the concentrations of 5, 10, 20, and 30 μg/mL was 3.8%, 13.99%, 30%, and 50.3% respectively, with a further reduction of 7.04%, 20.10%, 41.57%, and 69.60% after 48 hours of exposure. The LDH release, a marker of cell membrane damage, was measured in human skin keratinocytes HaCaT cells when exposed to CuONPs at concentrations of 0, 5, 10, 20, and 30 μg/mL for 48 hours. At 5 μg/mL, the CuONPs did not induce significant membrane damage (LDH release). However, as the concentration of CuONPs increases to 10, 20, and 30 μg/mL, there was a significant LDH leakage in a dose- and time-dependent manner (Figure 3B).
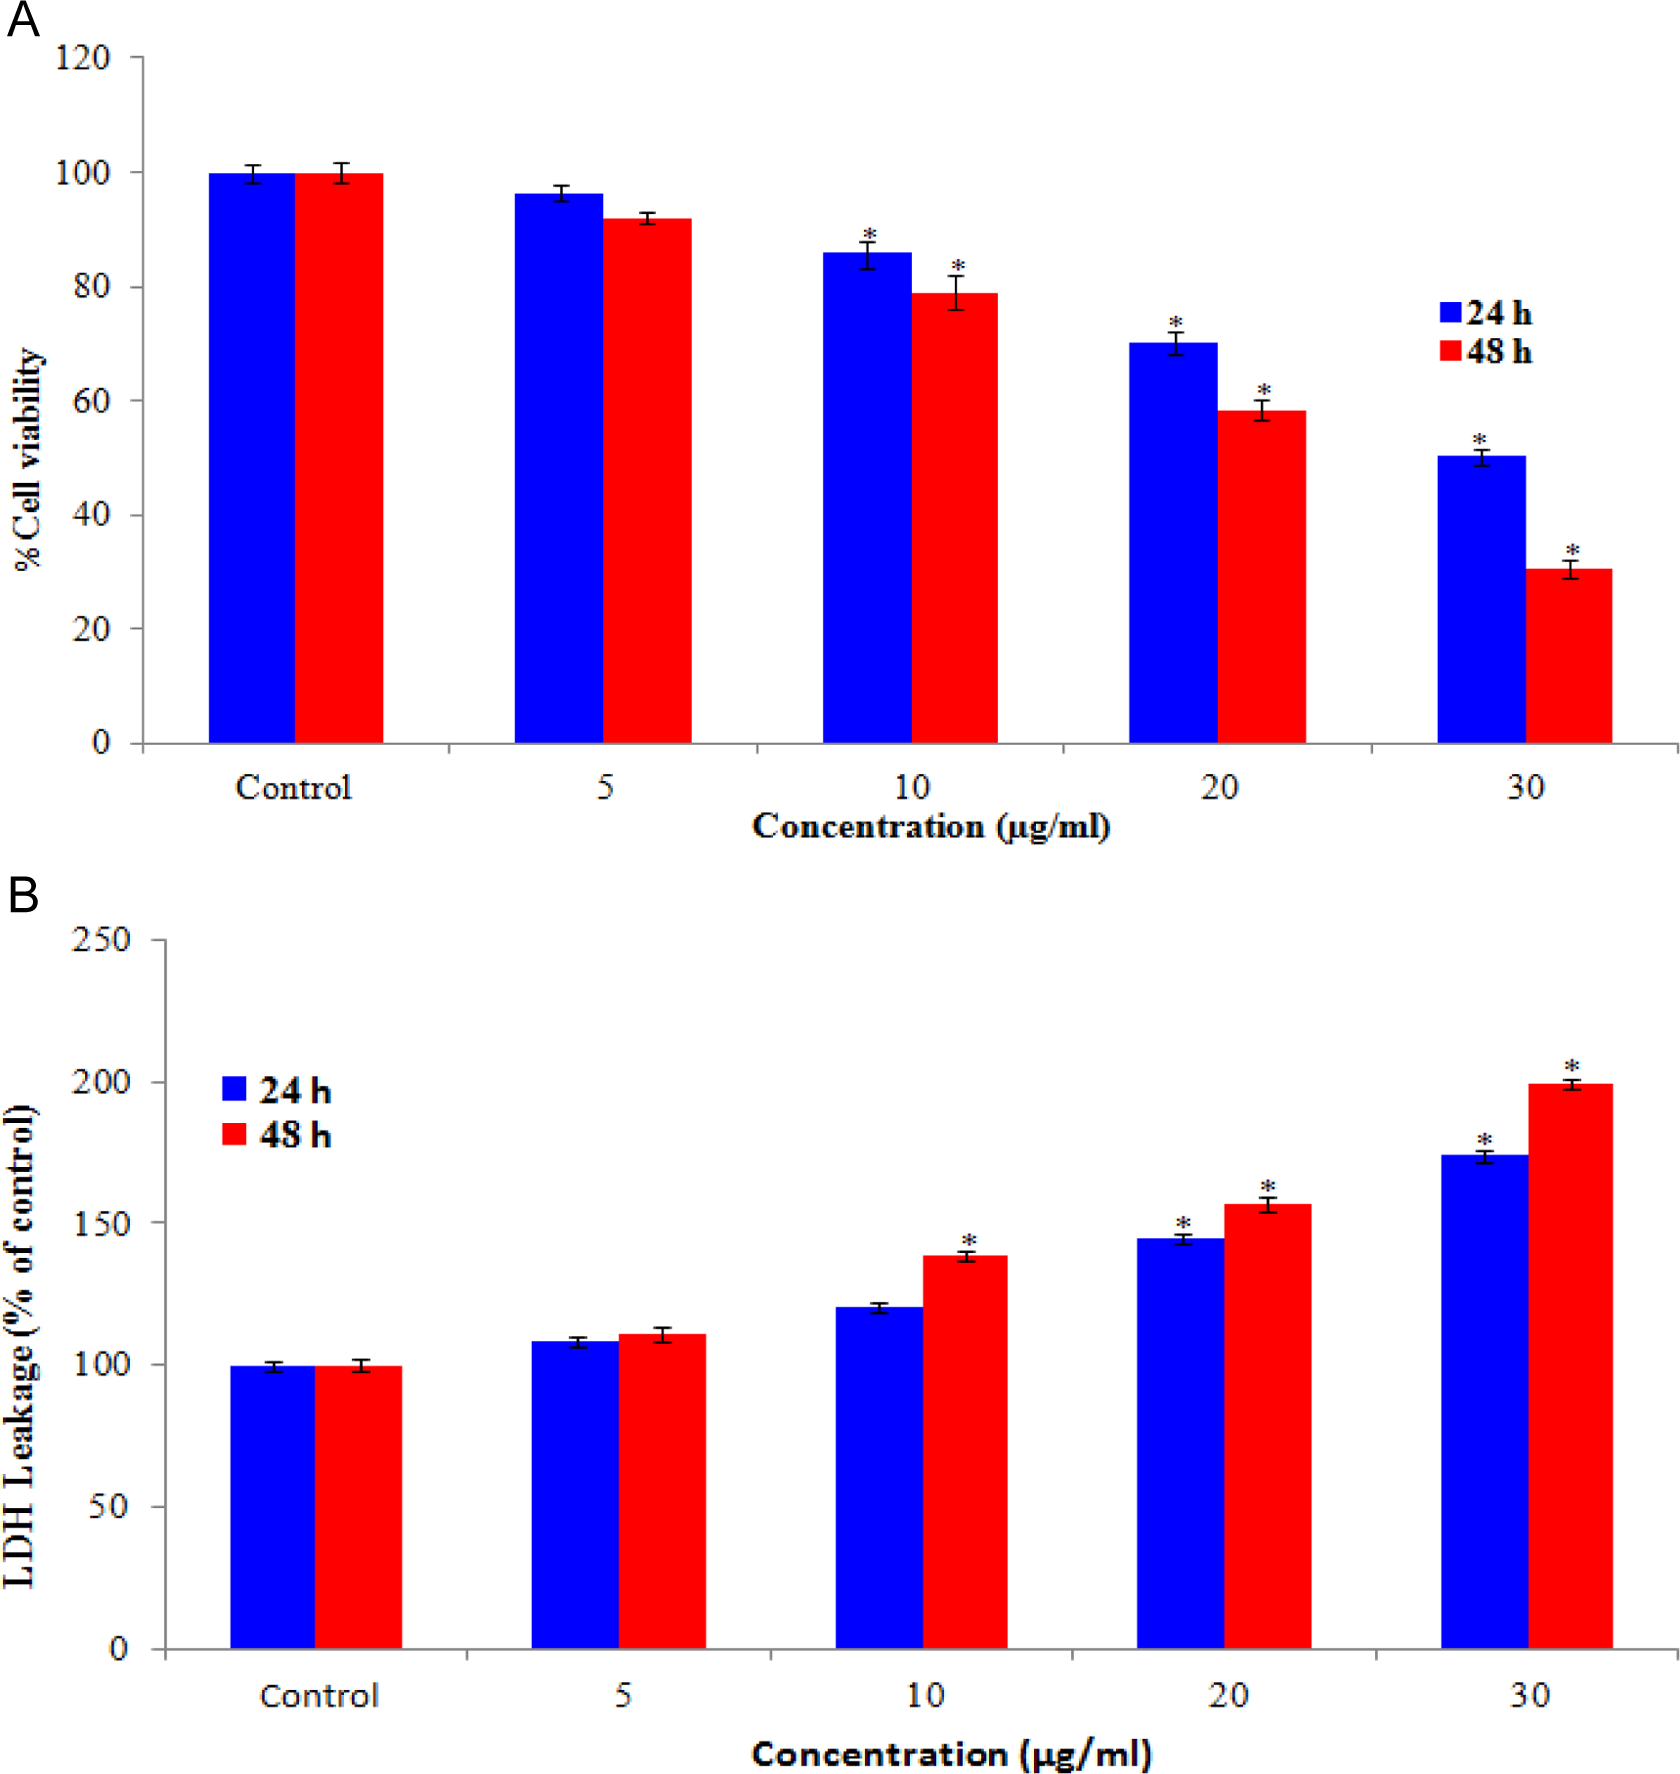
Cytotoxicity of copper oxide nanoparticles (CuONPs) on HaCaT cells for 24 and 48 hours. A, Percentage of cell viability and (B) lactate dehydrogenase (LDH) leakage. Each value represents the mean ± standard error (SE) of 3 experiments performed in duplicate.*P < 0.01 versus control.
Copper Oxide NP-Induced ROS Generation and Oxidative Stress
The ability of CuONPs to induce oxidative stress was evaluated by measuring the levels of ROS, LPO, GSH, SOD, and CAT in HaCaT cells. Results showed that CuONPs induced the intracellular ROS generation in a dose- and time-dependent manner (Figure 4). The CuONP-induced oxidative stress was further evidenced by depletion of GSH (Figure 5A) and elevation of LPO, SOD, and CAT with concentrations and time of CuONPs exposure (Figure 5B–D).
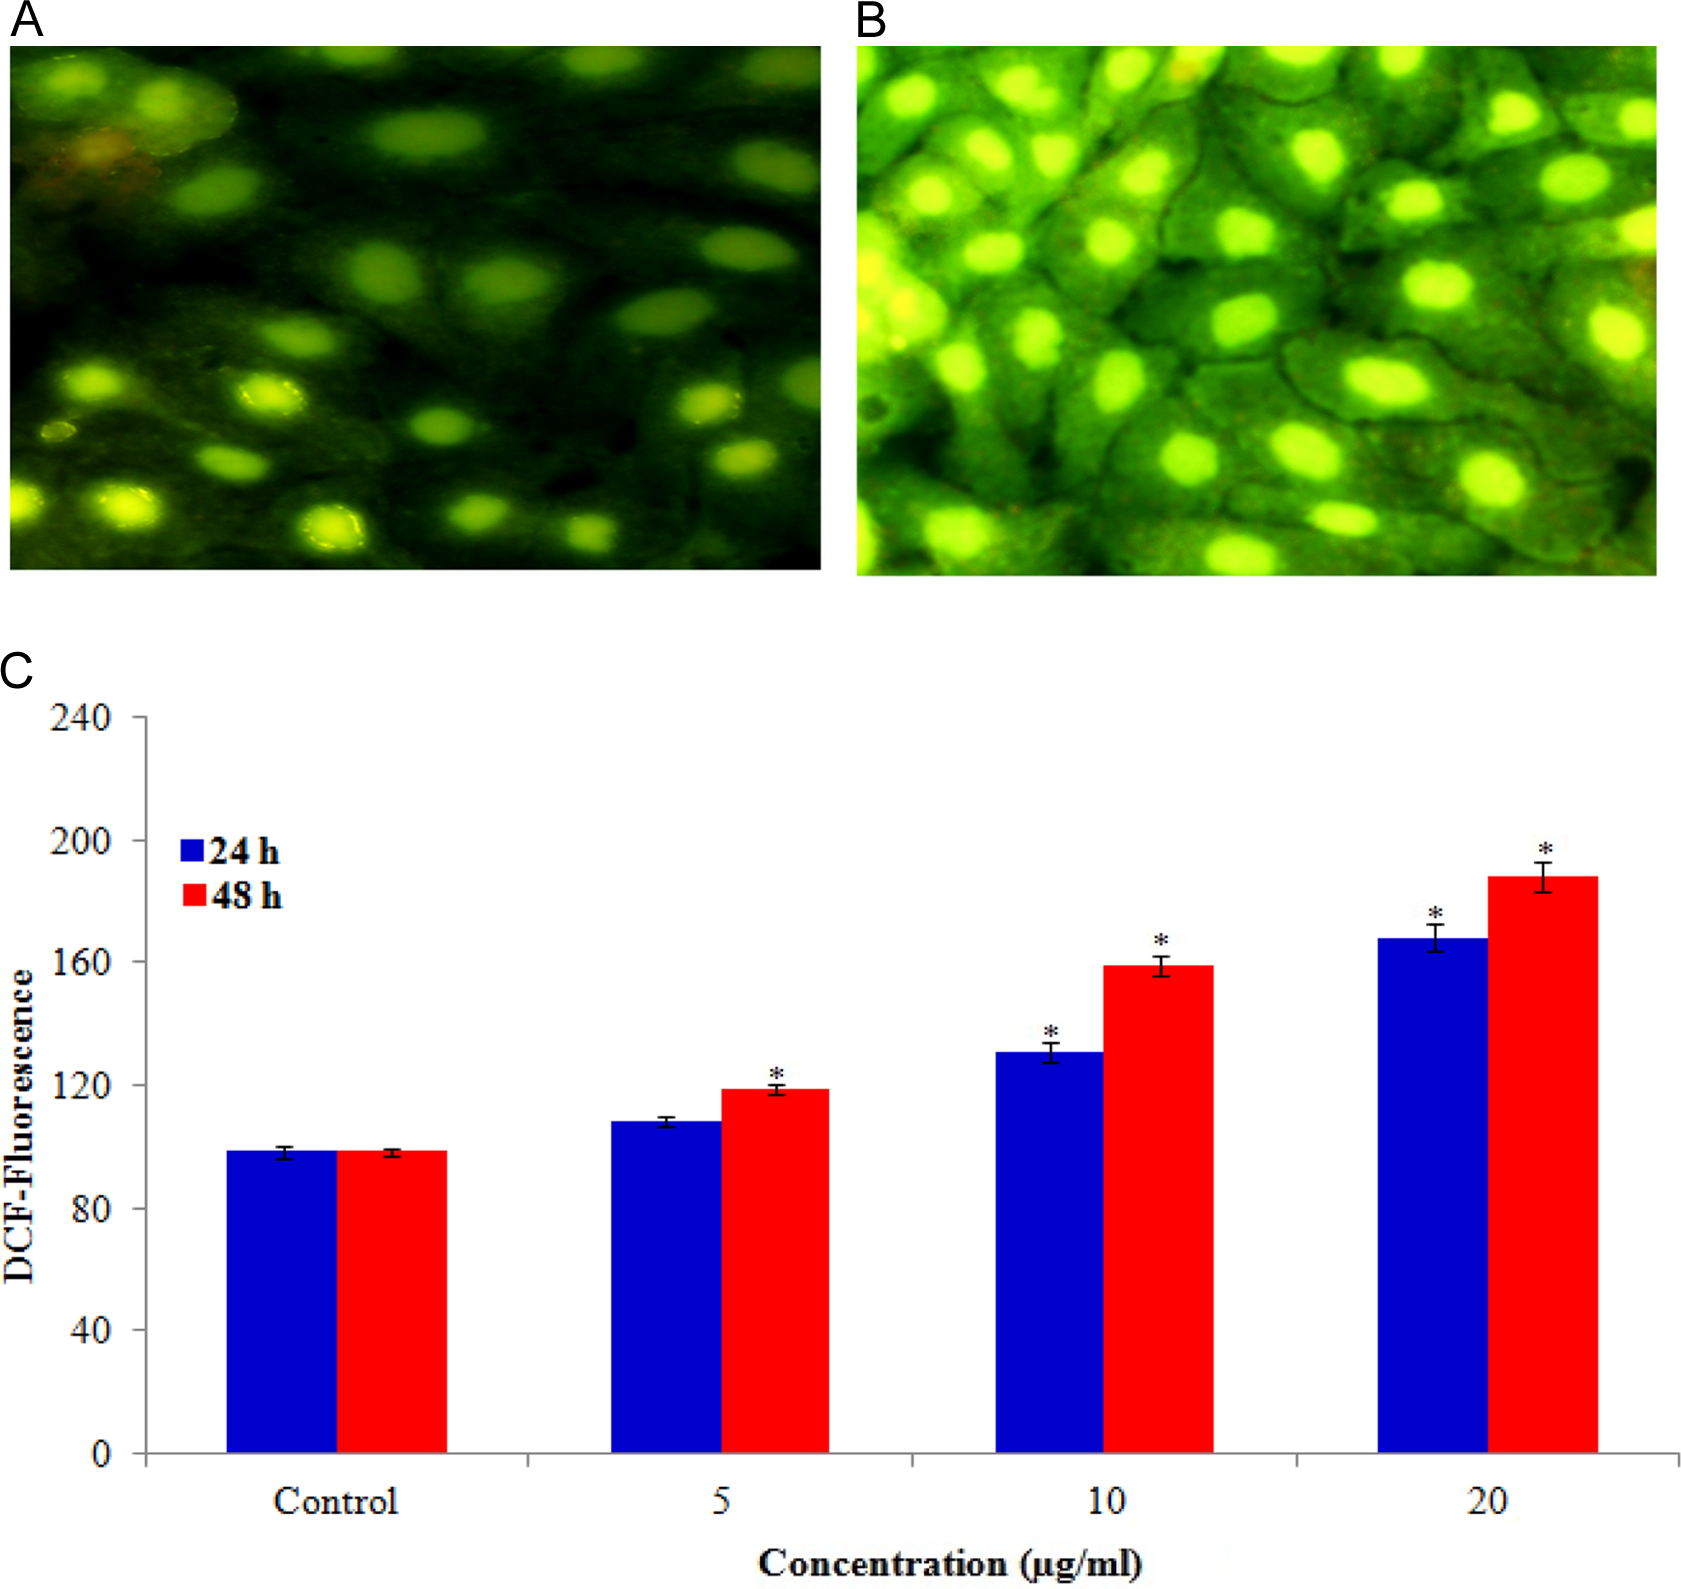
Representative microphotographs showing CuONPs induced ROS generation in HaCaT cells. Images were snapped in Nikon phase contrast cum fluorescence microscope (model 80i). A, Control, (B) at 10 µg/mL of CuONPs, and (D) Percentage change in ROS generation for 24 and 48 hours exposure to various concentrations of CuONPs in HaCaT cells. Each value represents the mean ± standard error (SE) of 3 experiments, performed in duplicate.*P < 0.01 versus control. CuONP indicates copper oxide nanoparticle; ROS, reactive oxygen species.
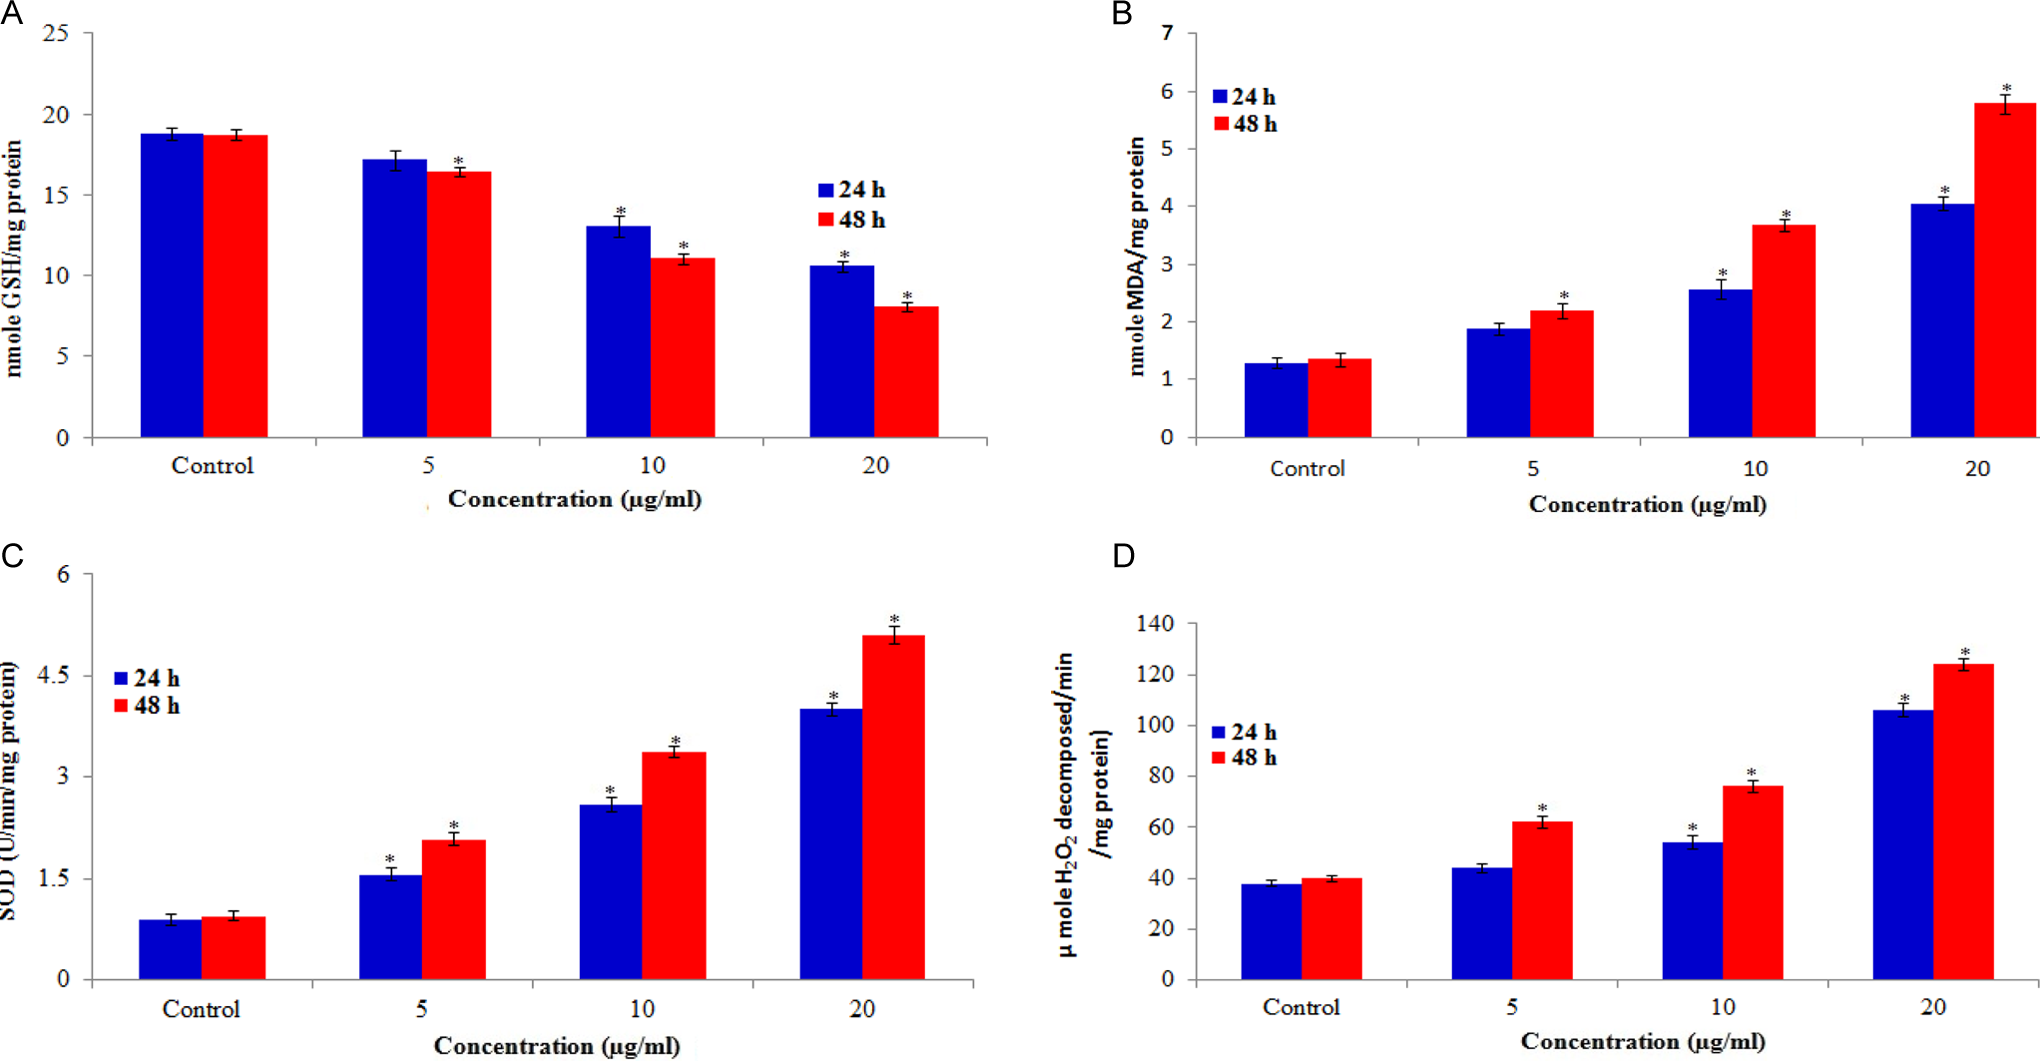
A, Levels of glutathione (GSH), (B) lipid peroxidation (LPO), (C) superoxide dismutase (SOD), and (D) catalase in HaCaT cells after exposure to copper oxide nanoparticles (CuONPs) for 24 and 48 hours. Each value represents the mean ± standard error (SE) of the 3 experiments, performed in duplicate.*P < 0.01 versus control.
Apoptosis Induction by CuONPs
Apoptotic and viable cells were scored under fluorescence microscope. The study revealed that CuONPs triggered morphological features, which relate to the apoptosis that occurred (Figure 6A and B). The untreated cells were observed with a green intact nuclear structure (Figure 6A). In addition, late stages of apoptosis such as apoptotic body separation and presence of reddish-orange color due to the binding of AO to denatured DNA were observed (Figure 6B).
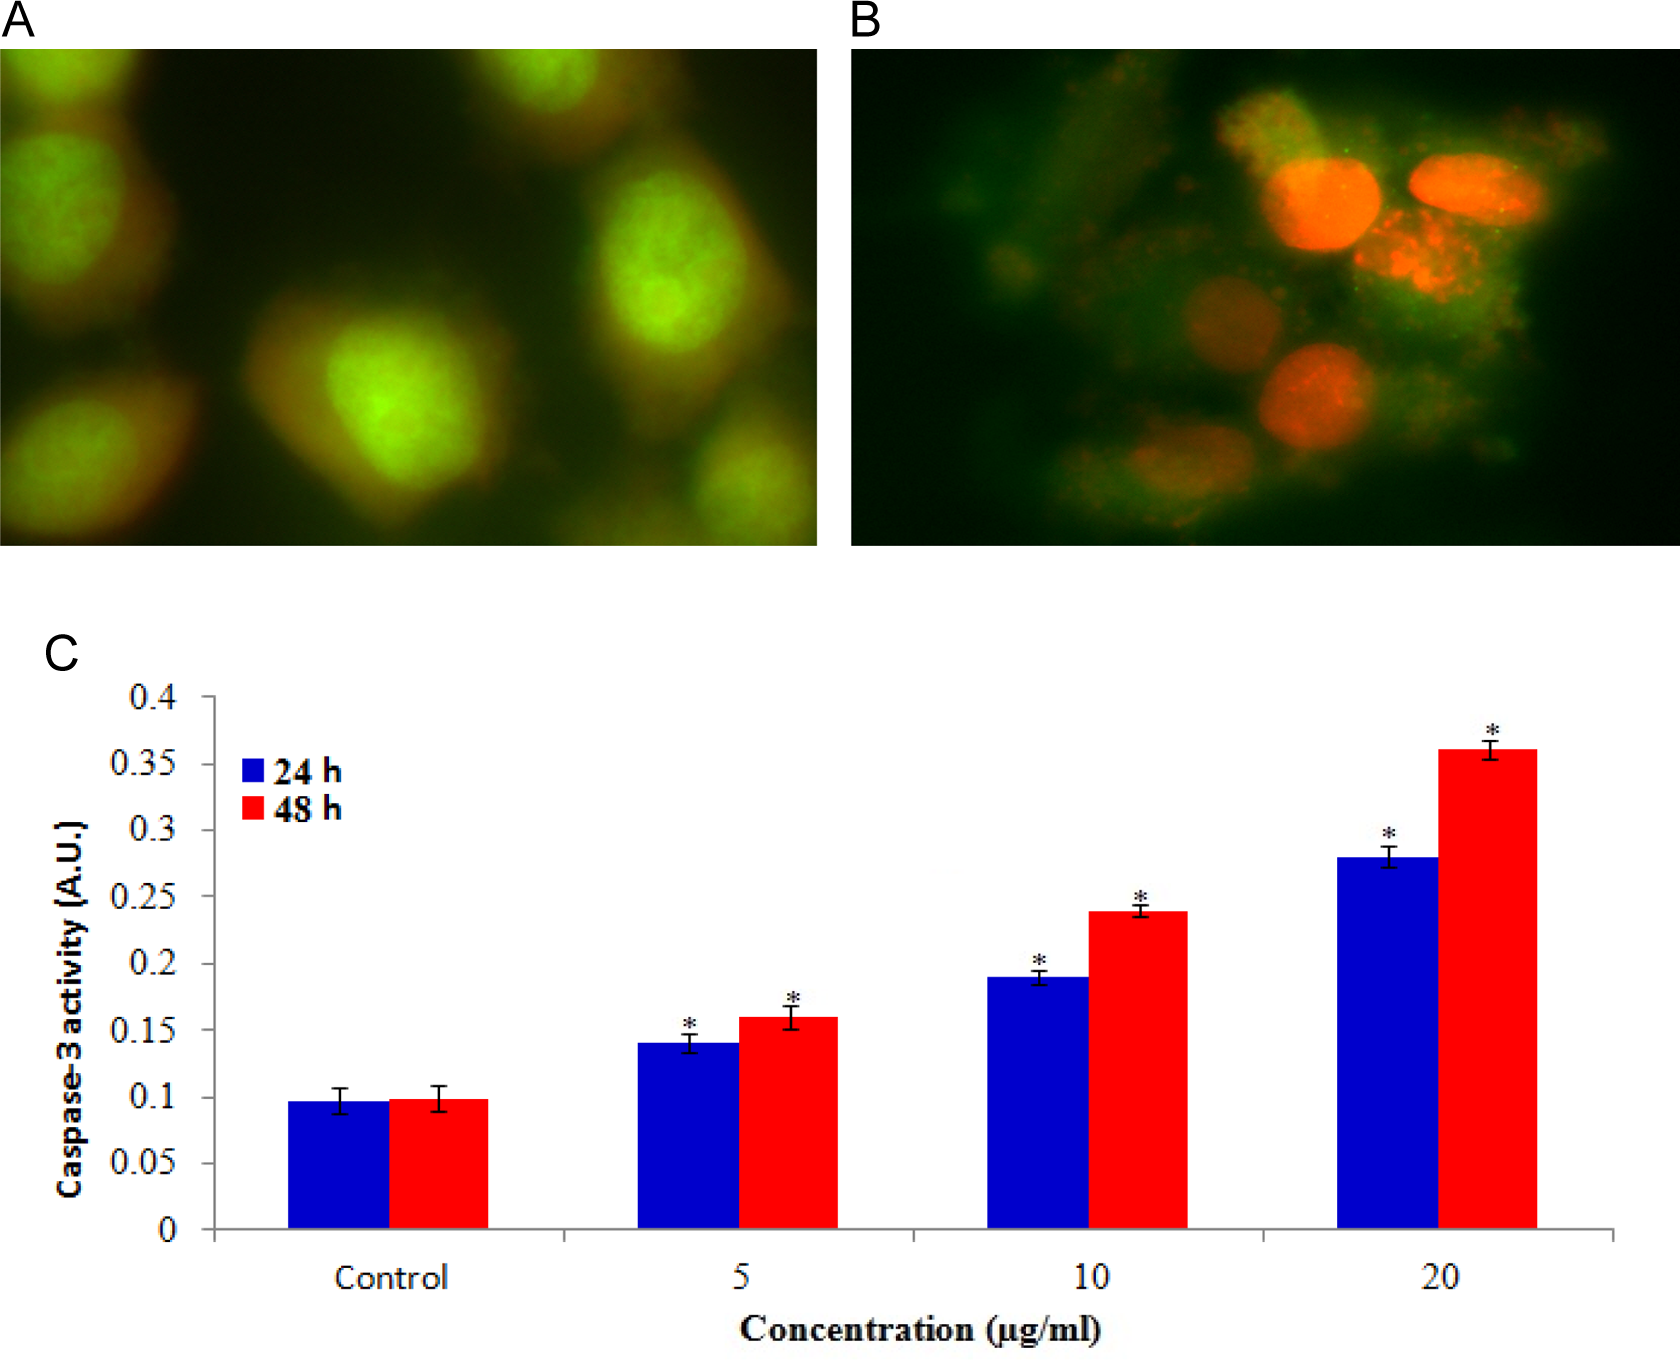
Increase in apoptotic and caspase-3 activity in HaCaT cells after exposure of CuONPs for 24 and 48 hours. A, Control (viable) cell, (B) exposed at 10 µg/mL of CuONPs, and (C) caspase-3 activity. Each value represents the mean ± standard error (SE) of 3 experiments. *P < 0.01 versus control. CuONP indicates copper oxide nanoparticle.
Caspase-3, which plays a key role in the apoptotic pathway of cells, was induced following the treatment with CuONPs (Figure 6C). When cells were treated with 5, 10, and 20 µg/mL concentrations of CuONPs for 24 and 48 hours, the activity of caspase-3 was increased in a concentration and time-dependent manner.
DNA Damage
The DNA damage was measured as percentage of tail DNA in the control as well as in the exposed cells. During electrophoresis, the cell DNA was observed to migrate more rapidly toward the anode at the highest concentration than the lowest concentration. The cells exposed to different concentrations of CuONPs exhibited significantly (P > 0.01) higher DNA damage in cells than those of the control groups. The gradual nonlinear increase in DNA damage was observed in cells as dose and time of CuONPs exposure increased. The highest DNA damage was recorded at 20 µg/mL CuONPs in HaCaT cells (Figure 7).
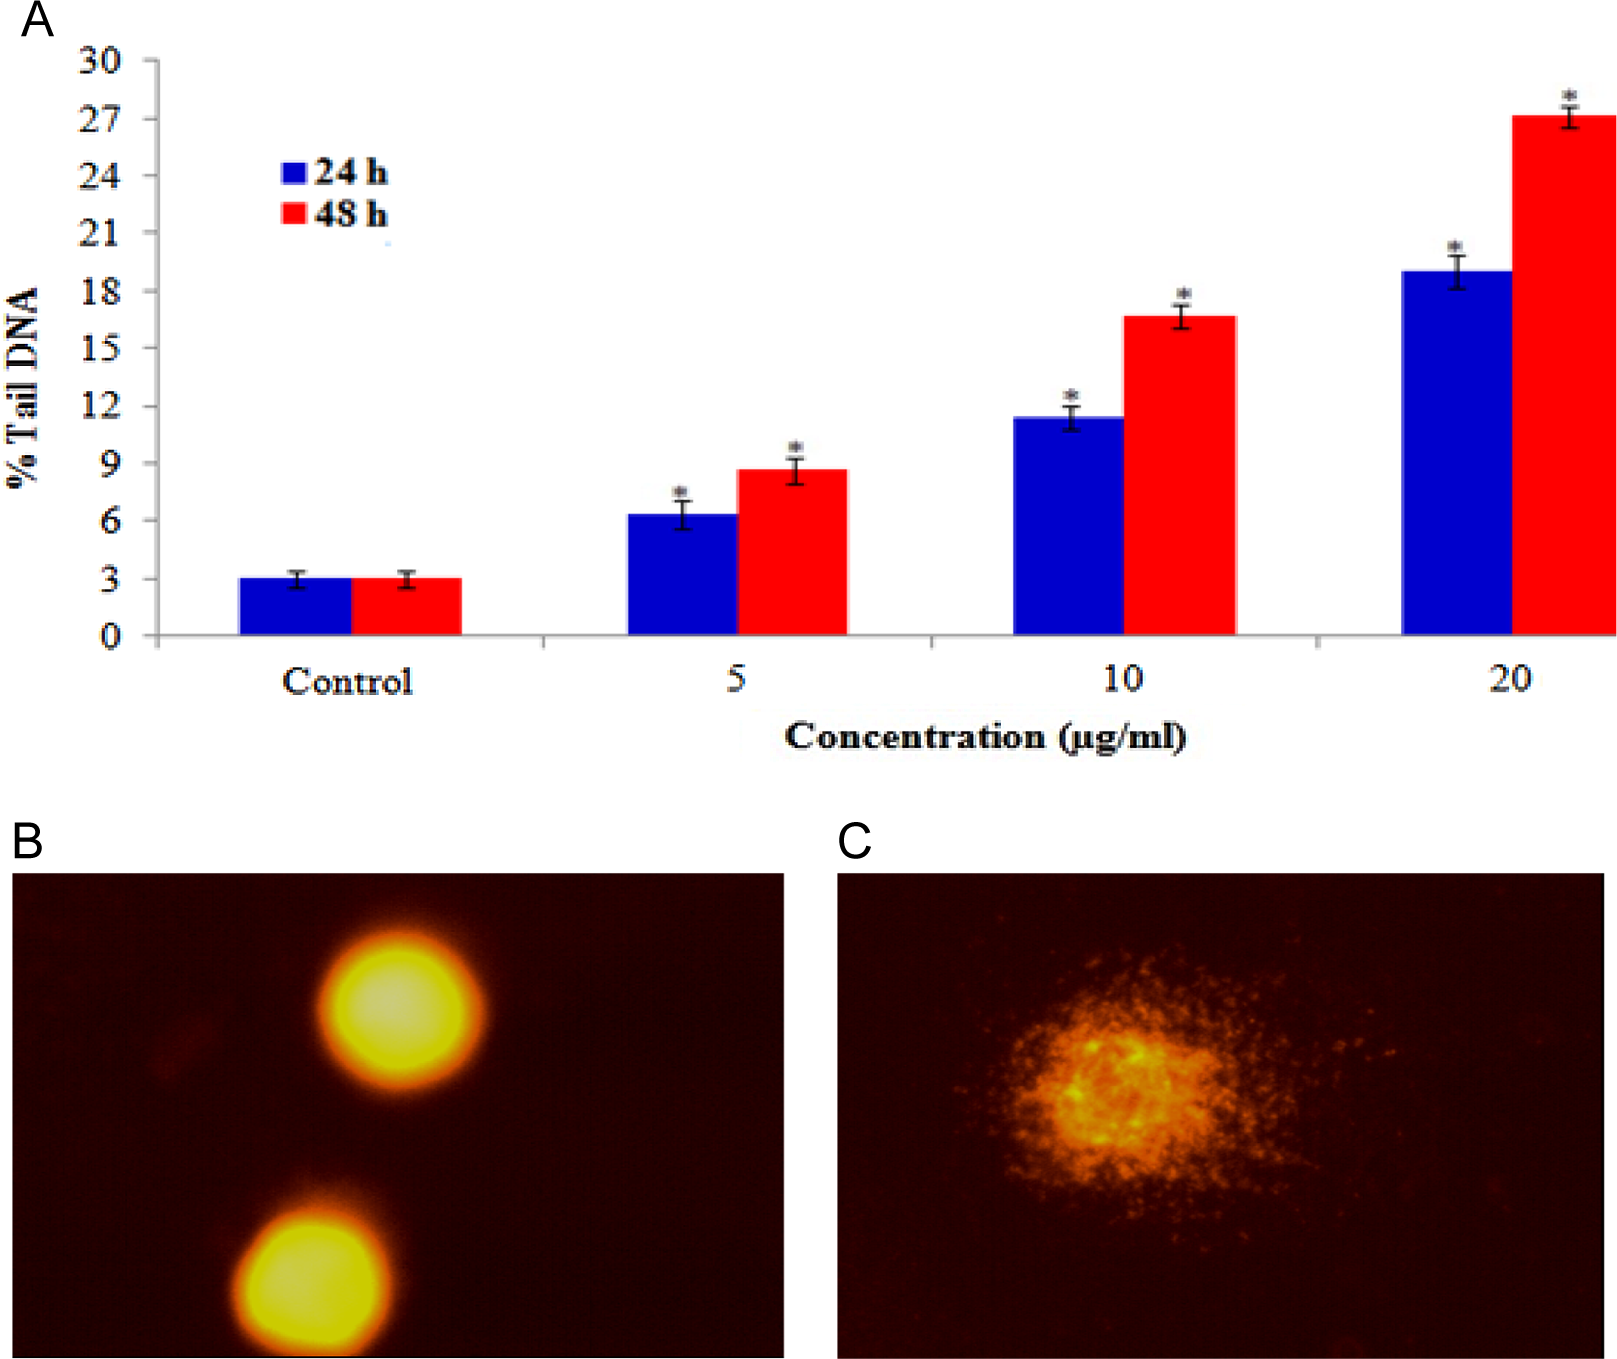
DNA damage in HaCaT cells after 24 and 48 hours of exposure to different concentrations of copper oxide nanoparticles (CuONPs). A, Percentage of tail DNA, (B) control cell, and (C) exposed cell. Each value represents the mean ± standard error (SE) of 3 experiments, performed in duplicate.*P < 0.01 versus control.
Discussion
The present study reveals the effect of CuONPs on human skin cells and provides significant insight into the possible mechanism through which CuONPs exert their toxic effect on these cells. The CuONPs were found to get internalized into the human skin epidermal cells or adhere to the cell membrane depending on their size. The NPs of 30 to 100 nm were internalized into the cytoplasm, vesicles, and also the nucleus, while larger particles (>500 nm) remained outside the cells. Our data demonstrate that CuONPs has cytotoxic and genotoxic effect on human skin epidermal cells (HaCaT). Our results also revealed that the mode of cell death was apoptosis, which was mediated by the ROS-triggered mitochondrial pathway as evidenced by cleavage of caspase-3.
Prior to studying genotoxicity and cytotoxic potential of CuONPs, we had characterized its ζ potential and size by DLS as well as TEM. However, the size obtained from DLS was more than the size measured by TEM. The difference in size is due to the fact that different size determination methods give different results based on these principles used; first, DLS measures Brownian motion and subsequent size distribution of an ensemble collection of particles in solution and gives mean hydrodynamic diameter, which is usually larger than TEM diameter as it includes a few solvent layers; second, during DLS measurement, there is a tendency of particles to agglomerate in the aqueous state thereby giving the size of clustered particles rather than individual particles; third, it reports an intensity weighted average hydrodynamic diameter of a collection of particles, so any polydispersity of the sample will skew the average diameter toward larger particle sizes. 27
The interference of some NPs with commonly used cytotoxicity test systems has been well documented in the literature. Therefore, it has been suggested that the cytotoxicity of NPs should be assessed with 2 or more independent test systems for validating the findings. 28 We have evaluated the cytotoxicity of CuONPs by 2 different assays namely the MTT and LDH release to increase the strength of the data. In the present study, CuONPs induced cytotoxicity in dose- and time-dependent manner as measured by the MTT and LDH assays. Induction of cytotoxicity as observed in the present study is in accordance with the findings of Cohen et al 29 in human skin organ culture for copper (II) oxide NP.
The LPO and oxidative stress have been cited to be one of the more important mechanisms of toxicity related to NP exposure.
30
This has been attributed to their small size and large surface area that are generally thought to produce ROS and oxidative stress.
31
The CuONPs in our study were also found to be capable of generating intracellular ROS when examined by the cell-permeable dye DCFH-DA. The ROS typically include the superoxide radical (O2
−), hydrogen peroxide (H2O2), and hydroxyl radical (OH
Apoptosis is one of the main types of programed cell death and involves a series of biochemical events leading to cellular morphological changes and cell death. The CuONP-induced cell death observed in this study can occur by 2 distinct modes—apoptosis and necrosis, which can be distinguished by morphological and biochemical features. The AO/PI staining of CuONP-treated HaCaT cells resulted in nuclear condensation and fragmentation, which is another morphological hallmark of apoptosis. Some NPs owing to their small size are capable of reaching the nucleus and interact with DNA. 41,42 They may also exhibit an indirect effect on DNA through their ability to generate ROS. 42 This DNA damage may either lead to carcinogenesis or cell death, thus disrupting normal cell functions. We observed the genotoxic potential of CuONPs in HaCaT cells in the alkaline comet assay, which is capable of detecting single as well as double DNA strand breaks and alkali labile sites even at low levels of DNA damage. 43 Our earlier studies have also revealed the DNA damaging potential of these NPs in somatic cells (hepatic cells) and germ cells. 44 As ROS are known to react with DNA molecule causing damage to both purine and pyrimidine bases as well as the DNA backbone. 45
In conclusion, our results indicated that CuONPs possess a DNA damaging potential in human skin cells, which may be mediated through the ROS and oxidative stress. Long-term biological safety is another issue, which needs clarification in future investigation.
Footnotes
Authors’ Contribution
Saud Alarifi and Daoud Ali contributed equally to this work.
Declaration of Conflicting Interests
The author(s) declared no potential conflicts of interest with respect to the research, authorship, and/or publication of this article.
Funding
The author(s) disclosed receipt of the following financial support for the research, authorship, and/or publication of this article: The authors extend their appreciation to the Deanship of Scientific Research at King Saud University for funding the work through the research group project no. RGP-VPP-180.