
Abstract
The extensive production and wide application of carbon nanotubes have made investigations of its toxic potentials necessary. In the present study, we explored the underlying mechanism through which multi-walled carbon nanotubes (MWCNTs) induce toxicity in mouse fibroblast cells (L929). 3-(4,5-Dimethylthiazol-2-yl)-2,5-diphenyltetrazolium bromide and neutral red uptake viability assays were used to examine mechanisms of cytotoxicity. Dose and time-dependent cytotoxicity was observed in L929 cells. The MWCNTs significantly increased the generation of reactive oxygen species, lipid peroxidation, superoxide dismutase, and decreased glutathione. It was observed that the MWCNTs induced caspase 3 activity. The highest DNA strand breakage was detected by comet assay at 300 µg/mL of MWCNTs. Thus, the data indicate that MWCNTs induced cytotoxicity and apoptosis in L929 cells via oxidative stress.
Introduction
Carbon nanotubes (CNTs) are categorized as single-walled CNTs (SWCNTs) and multi-walled CNTs (MWCNTs). Due to wide use of MWCNTs in manufacturing industries, concerns about potential toxic effects in humans and environmental effects have increased. Bottini et al 1 reported that exposure to CNTs inhibited proliferation, reduced cell adherence, induced membrane destabilization, and caused oxidation stress. In addition, CNTs interact with cellular membranes in a unique way; some types of CNTs have been reported to enter mammalian cells by an endocytosis-independent, needle-like penetration mechanism. 2 The CNTs have been used successfully in delivery of anticancer drugs to human cancer cells or tumor xenografts. 3
Toxic impacts of MWCNTs are still a matter of investigation and our actual knowledge on the effects of nano-sized contaminants on biological systems remains incomplete. 4 These effects need to be assessed in order to provide a scientific basis for safe development of nanotechnologies. Li and Chen 5 reported that nanoparticles crossed biological barriers to reach different tissues according to its surface and size properties and accumulated in different organs. Reactive oxygen species (ROS) generation and oxidative stress elicit a wide variety of cellular events including DNA damage and apoptosis. 6 The genotoxic potential of CNTs is of particular concern, since the changes of the genetic material have potential for cell death, tissue malfunction, cancer development, and reproductive adverse effects. Oxidative stress plays an important role in cellular signaling, inflammatory, and genotoxic and proliferative responses. 7 We evaluated the oxidative stress biomarkers including reduced glutathione (GSH), ROS, and lipid peroxidation (LPO) in response to MWCNTs exposure.
Therefore, the current study was designed to assess the cellular toxicity and apoptotic potential of MWCNTs in mouse fibroblast cells (L929) as well as to understand its possible mechanism.
Materials and Methods
Chemicals and Reagents
Multi-walled carbon nanotube (Product No. 724769, average diameter 5.5 nm), GSH, 5,5-dithio-bis-(2-nitrobenzoic acid; DTNB), 3-(4,5-dimethylthiazol-2-yl)-2,5-diphenyltetrazolium bromide (MTT), 2,7-dichlorofluorescin diacetate (DCFH-DA), neutral red dye, acridine orange, and propidium iodide were obtained from Sigma-Aldrich (St Louis, Missouri). Fetal bovine serums, penicillin–streptomycin, and Dulbecco Modified Eagle Medium: Nutrient Mixture F-12 (DMEM/F-12) medium were purchased from Invitrogen Co (Carlsbad, California). All other chemicals were purchased from commercial sources.
Preparation and Characterization of MWCNTs
The MWCNTs were suspended in Milli-Q water at a concentration of 1 mg/ mL. Stock suspension was sonicated at 40 W for 15 minutes. Samples for transmission electron microscopy (TEM) analysis were prepared by drop-coating MWCNTs suspension on carbon-coated copper TEM grids. The films on the TEM grids were allowed to dry prior to measurement. The TEM measurements were performed on a JEOL model 2100 F instruments operated at an accelerating voltage of 200 kV.
Cell Culture and Exposure of MWCNTs
Mouse fibroblast (L929) cells were procured from American Type Culture Collection (Rockville, Maryland), and it was preserved and subcultured in the laboratory and was used to determine the cytotoxicity against MWCNTs. Cells were cultured in DMEM/F-12 medium supplemented with 10% fetal bovine serum and 100 U/mL penicillin–streptomycin at 5% CO2 and 37°C. At 85% confluence, cells were harvested using 0.25% trypsin and were subcultured into 75-cm2 flasks, 6-well plates, and 96-well plates according to experiments. Cells were left to attach the surface of culture flasks/plates for 24 hours prior to treatment. The MWCNTs were suspended in cell culture medium and diluted to appropriate concentrations. The appropriate dilutions of MWCNTs were sonicated using a sonicator bath at room temperature for 10 minutes at 40 W to avoid particle agglomeration before exposure to the cells. Cells not exposed to MWCNTs served as control in each experiment.
Cell Morphology
The morphology of L929 cells was observed after exposure of MWCNTs for 24 and 48 hours using an inverted microscope (DMIL, Leica, Wetzlar, Germany).
Assay Thiazolyl Blue (MTT)
The MTT assay was used to investigate mitochondrial function as described by Ali et al. 8 Briefly, 104 cells/well were seeded in 96-well plates and exposed to different concentrations (0, 10, 50, 150, and 300 μg/mL) of MWCNTs for 24 and 48 hours. At the end of the exposure, culture media were replaced with new media containing MTT solution (0.5 mg/mL) and incubated for 4 hours at 37°C. Formazan product was dissolved in dimethyl sulfoxide (DMSO) following the incubation. The plates were kept on shaker for 10 minutes at room temperature and then analyzed at 530 nm using multi-well microplate reader (Omega Fluostar). Untreated sets were also run under identical conditions and served as controls.
Neutral Red Uptake Assay
The neutral red uptake (NRU) assay was done according to the method of Ali et al. 9 After the exposure of MWCNTs, medium was discarded and 100 µL of neutral red dye (50 µg/mL) dissolved in serum-free medium was added to each well. After incubation at 37°C for 3 hours, cells were washed with a solution of 0.5% formaldehyde and 1% CaCl2. The accumulated dye was extracted with 50% ethanol containing 1% (v/v) acetic acid and plates were kept for 20 minutes on a shaker. The absorbance was recorded at 540 nm using multi-wall micro plate reader (Omega Fluostar).
Measurement of Intracellular ROS
The generation of ROS was assessed in L929 cells after exposure of different concentrations (0, 10, 50, 150, and 300 μg/mL) of MWCNTs using DCFH-DA dye as fluorescence agent. 10 In the fluorometric analysis, cells (1 × 10⁴ per well) were seeded in 96-well black culture plates and incubated for 24 hours in a CO2 incubator at 37°C. The L929 cells were exposed to the above-mentioned concentrations of MWCNTs for 24 and 48 hours. On completion of respective exposure periods, cells were incubated with DCFH-DA (10 mmol/L) for 30 minutes at 37°C. The reaction mixture was aspirated and replaced by 200 µL of phosphate-buffered saline (PBS) in each well. The plates were kept on shaker for 10 minutes at room temperature in the dark. Fluorescence intensity was measured using multi-well micro plate reader (Omega Fluostar) at excitation wavelength (485 nm) and emission wavelength (528 nm), and values were expressed as percentage of fluorescence intensity relative to control wells.
A parallel set of cells (5 × 10⁴ per well) was analyzed for intracellular fluorescence using upright fluorescence microscope equipped with a CCD cool camera (Nikon Eclipse 80i equipped with a Nikon DS-Ri1 12.7 mega pixel camera, Nikon, Tokyo, Japan).
Oxidative Stress Biomarkers
The cells at a final density of ∼6 × 10⁶ in a 75-cm2 culture flask were exposed to MWCNTs (0, 10, 50, 150, and 300 μg/mL) for 24 and 48 hours. After exposure, the cells were scraped and washed twice with chilled PBS. The harvested cell pellets were lysed in cell lysis buffer (20 mmol/L Tris-HCl [pH 7.5], 150 mmol/L NaCl, 1 mmol/L Na2EDTA, 1% Triton, and 2.5 mmol/L sodium pyrophosphate). The cells were centrifuged at 15000g for 10 minutes at 4°C, and the supernatant (cell lysates) was maintained on ice until assayed for oxidative stress biomarkers. Protein content was measured by the method of Bradford, 11 using bovine serum albumin as the standard.
Lipid Peroxidation Assay
Lipid peroxidation was estimated by measuring the formation of malondialdehyde (MDA) using the method of Ohkawa et al. 12 A mixture of 0.1 mL cell extract and 1.9 ml of 0.1 mol/L sodium phosphate buffer (pH 7.4) was incubated at 37°C for 1 hour. The incubation mixture, after precipitation with 5% TCA, was centrifuged (2300g for 15 minutes at normal temperature) and the supernatant collected. Then, 1.0 mL of 1% tert-butyl alcohol was added to the supernatant and placed in boiling water for 15 minutes. After cooling to room temperature, absorbance of the mixture was taken at 532 nm and expressed in n mol MDA/h/mg protein using a molar extinction coefficient of 1.56 × 10⁵/M/cm.
Estimation of GSH
The GSH level was quantified using Ellman reagent. 13 The assay mixture contained phosphate buffer, DTNB, and cell extract. The reaction was examined at 412 nm, and the amount of GSH was expressed in terms of n mol GSH/mg protein.
Measurement of superoxide dismutase
Activity of superoxide dismutase (SOD) was estimated by employing a method described by Alarifi et al. 14 The assay mixture contained sodium pyrophosphate buffer, nitroblue tetrazolium, phenazine methosulfate, reduced nicotinamide adenine dinucleotide, and the required volume of cell extract. One unit of SOD enzyme activity is defined as the amount of enzyme required for inhibiting the chromogen production (560 nm) by 50% in 1 minute under assay conditions and expressed as specific activity in units/min/mg protein.
Staining of 4′,6-Diamidino-2-phenylindole for Chromosome Condensation
Chromosome condensation in L929 cells due to MWCNTs exposure was observed by 4′,6-diamidino-2-phenylindole (DAPI) staining. The DAPI solution was used to stain the exposed cells in 8 chamber slides, and the slides were incubated for 10 minutes in the dark at 37°C. Images of the nucleus were captured using a fluorescence microscope (Nikon).
Caspase-3 Assay
The L929 cells were seeded in 96-well plates at a density of 5 × 10⁵ cells per well and incubated at 37°C in CO2 incubator. After 24 hours, we have exposed to MWCNTs (50,150, and 300 µL) over 48 hours. After exposure, we have centrifuged it at 1000g for 10 minutes. The cells were lysed in lysis buffer for 30 minutes and centrifuged at 1000g for 10 minutes. Cell lysates (100 µL) were transferred to another 96-well plates and incubated with (100 µL) caspase-3 substrate I (N-acetyl-DEVD-p-nitroaniline) at 37ºC for 30 minutes. The p-nitroaniline was used as the standard. Cleavage of the substrate was observed at 405 nm, by multi-well micro plate reader (Omega Fluostar) and the specific activity was expressed in picomoles of the product (nitroaniline) per min/mg of protein.
Determination of DNA Damage
The alkaline single cell gel electrophoresis was performed as a 3 layer procedure with slight modification. 9 In brief, 70 000 cells/well were seeded in a 6-well plate. After 24 hours of seeding, cells were treated with different concentrations of MWCNTs for 24 and 48 hours. After treatment, L929 cells were trypsinized and suspended in DMEM, and cell suspension was centrifuged at 1200 rpm at 4ºC for 5 minutes. The cell pellet was finally suspended in chilled PBS for comet assay. The samples showing cell viability higher than 84% were further processed for comet assay. In brief, about 15 µL of cell suspension (approximately 20 000 cells) was mixed with 85 µL of 0.5% low-melting point agarose and layered on one end of frosted plain glass slide, precoated with a layer of 200 µL normal agarose (1%). Thereafter, it was covered with a third layer of 100 µL low-melting point agarose. After solidification of the gel, the slides were immersed in lysing solution (2.5 mol/L NaCl, 100 mmol/L Na2EDTA, 10 mmol/L Tris pH 10 with 10% DMSO, and 1% Triton X-100 added fresh) overnight at 4°C. The slides were then placed in a horizontal gel electrophoresis unit. Fresh cold alkaline electrophoresis buffer (300 mmol/L NaOH, 1 mmol/L Na2EDTA, and 0.2% DMSO, pH 13.5) was poured into the chamber and left for 20 minutes at 4°C for DNA unwinding and conversion of alkali-labile sites to single-strand breaks. Electrophoresis was carried out using the same solution at 4°C for 20 minutes, at 15 V (0.8 V/cm) and 300 mA. The slides were neutralized gently with 0.4 mol/L tris buffer at pH 7.5 and stained with 75 µL ethidium bromide (20 µg/mL). For positive control, the A375 cells were treated with 100 µmol/L H2O2 for10 minutes at 4°C. Two slides were prepared from each well (per concentration), and 50 cells per slide (100 cells per concentration) were scored randomly and analyzed using an image analysis system (Komet-5.0, Kinetic Imaging, Liverpool United Kingdom) attached to fluorescence microscope (DMLB, Leica, Germany) equipped with appropriate filters. The parameters, for example, percentage of tail DNA (ie, % tail DNA = 100 − % head DNA), were selected for quantification of DNA damage in L929 cells as determined by the software.
Statistical Analysis
At least 3 independent experiments were carried out in duplicate for each evaluation. Data were expressed as mean (±standard error) and analyzed by 1-way analysis of variance. The P value less than 0.05 was considered statistically significant.
Results
Multi-walled Carbon Nanotubes
The TEM image of MWCNTs is shown in Figure 1.
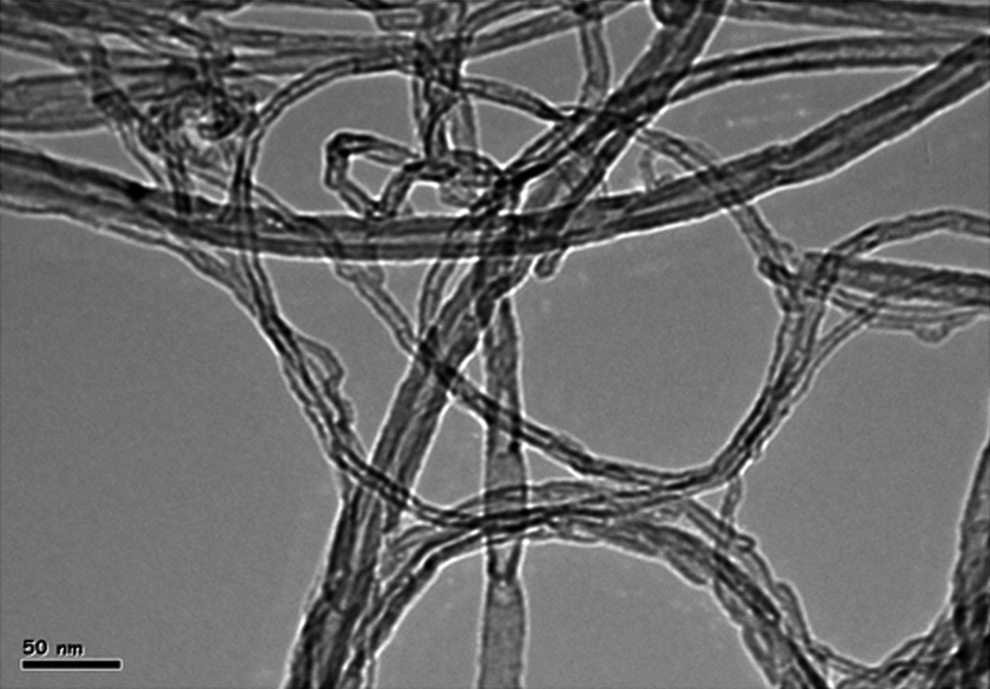
TEM image of MWCNTs. TEM indicates transmission electron microscopy; MWCNTs, multi-walled carbon nanotubes.
Morphological Alterations of L929 Cells
Figure 2 shows the comparative morphology of untreated and MWCNTs treated L929 cells. The L929 cells treated with MWCNTs (300 µg/mL) changed into spherical shape and detached from surface (Figure 2B).
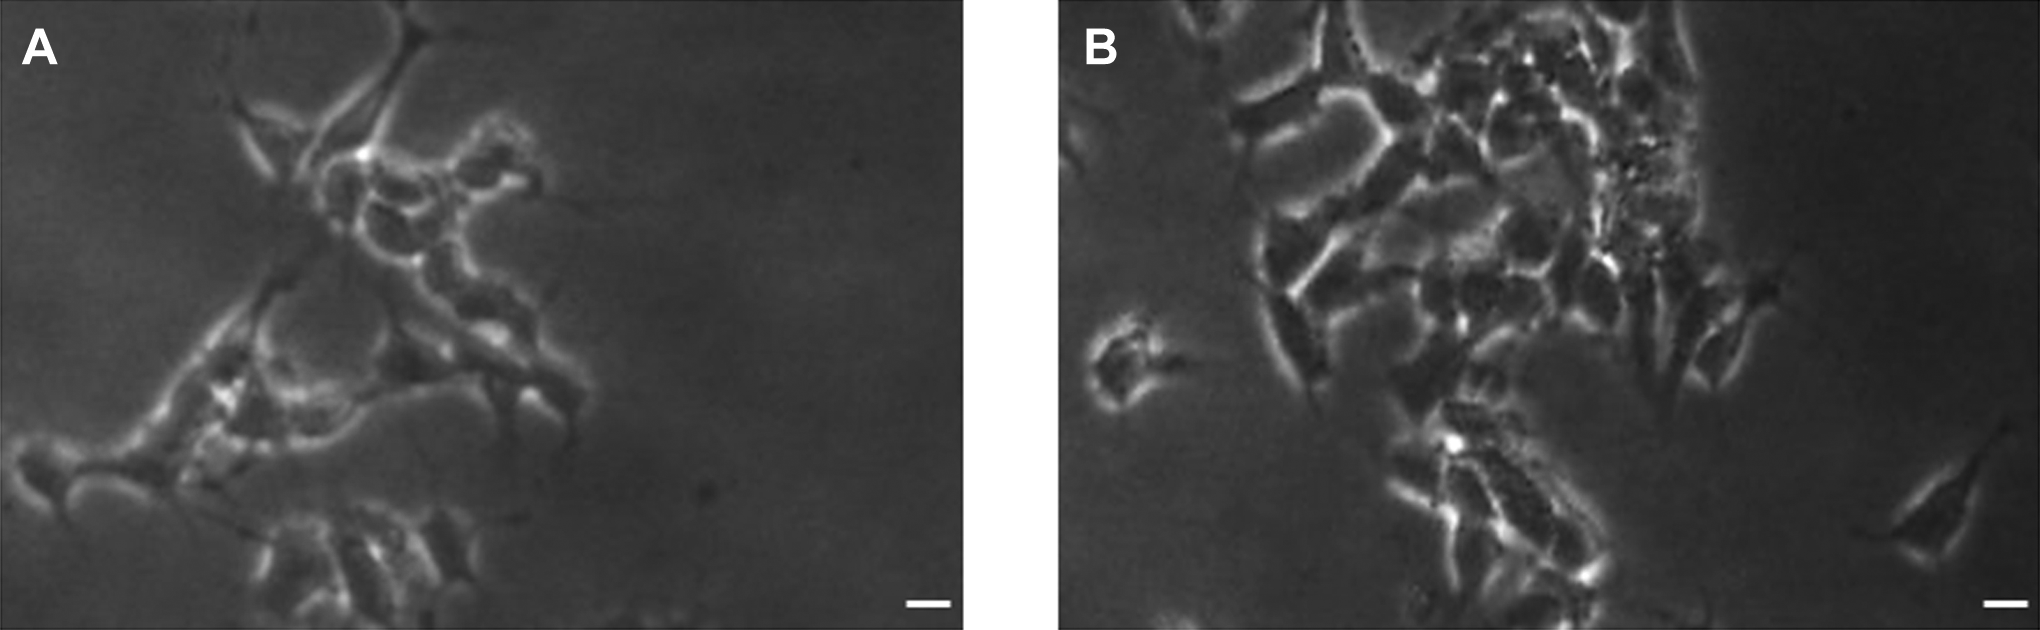
Morphology of L929 cells. A, Control and (B) at 300 µg/ml of MWCNTs for 24 hours. Scale bar (
Multi-walled Carbon Nanotubes–Induced Cytotoxicity in L929 Cells
The mitochondrial function (MTT reduction) and lysosomal activities (NRU) were examined as cytotoxicity end points. The MTT results demonstrated a concentration and time-dependent cytotoxicity after exposure to MWCNTs in L929 cells (Figure 3A). Result of NRU assay showed concentration and time-dependent reduction in cell viability (Figure 3B).
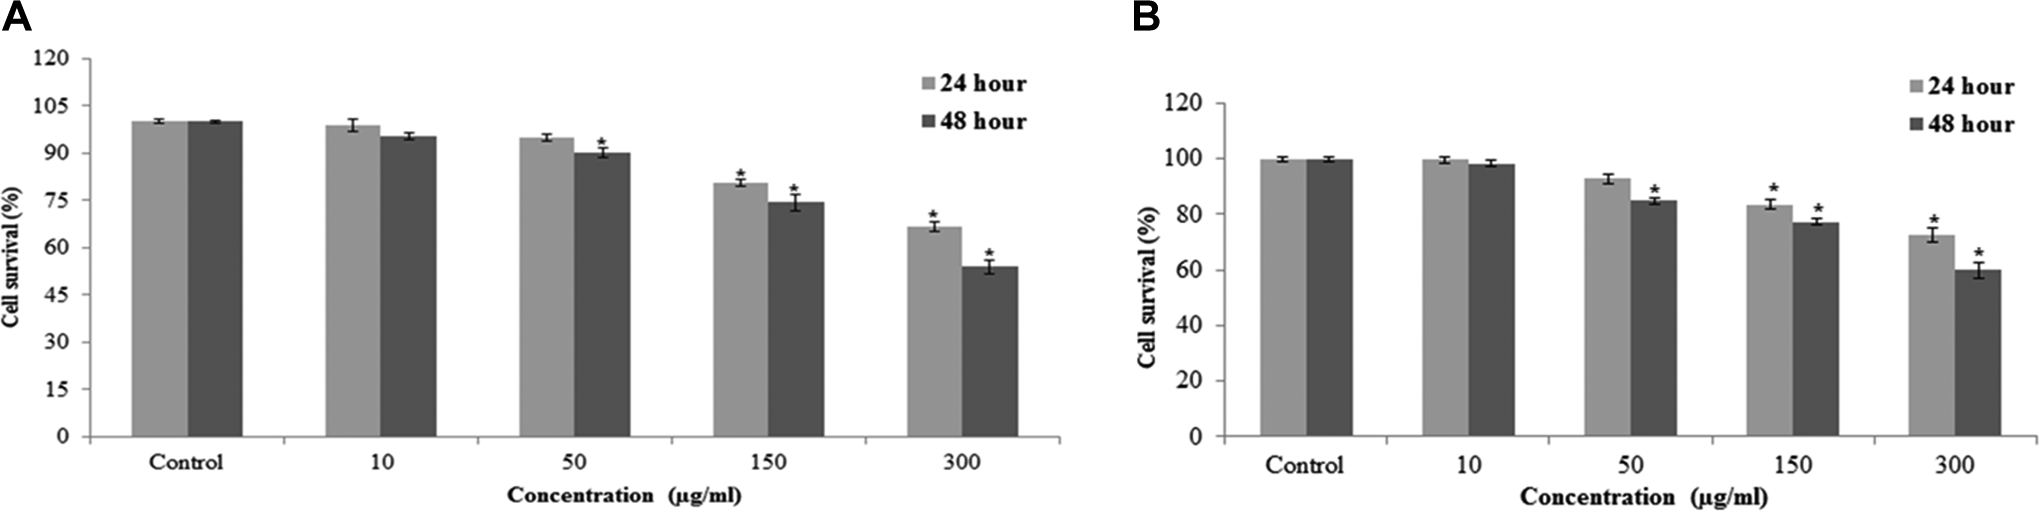
Cytotoxicity of MWCNTs in L929 cells for 24 and 48 hours, as measured by (A) MTT and (B) NRU tests. Each value represents the mean ± SEM of 3 experiments. *P < 0.05 versus control. MWCNTs indicate multi-walled carbon nanotubes; MTT, 3-(4,5-dimethylthiazol-2-yl)-2,5-diphenyltetrazolium bromide; NRU, neutral red uptake; SEM, standard error of the mean.
Multi-walled Carbon Nanotubes–Induced ROS Generation and Oxidative Stress
The ability of MWCNTs to induce oxidative stress was evaluated by measuring the levels of ROS, LPO, GSH, and SOD in L929 cells. Results showed that MWCNTs induced the intracellular ROS generation in L929 cells (Figure 4). The MWCNTs-induced oxidative stress was further evidenced by depletion in GSH (Figure 5A) and elevation in LPO, and SOD with concentrations and time of MWCNTs exposure (Figures 5B and C).
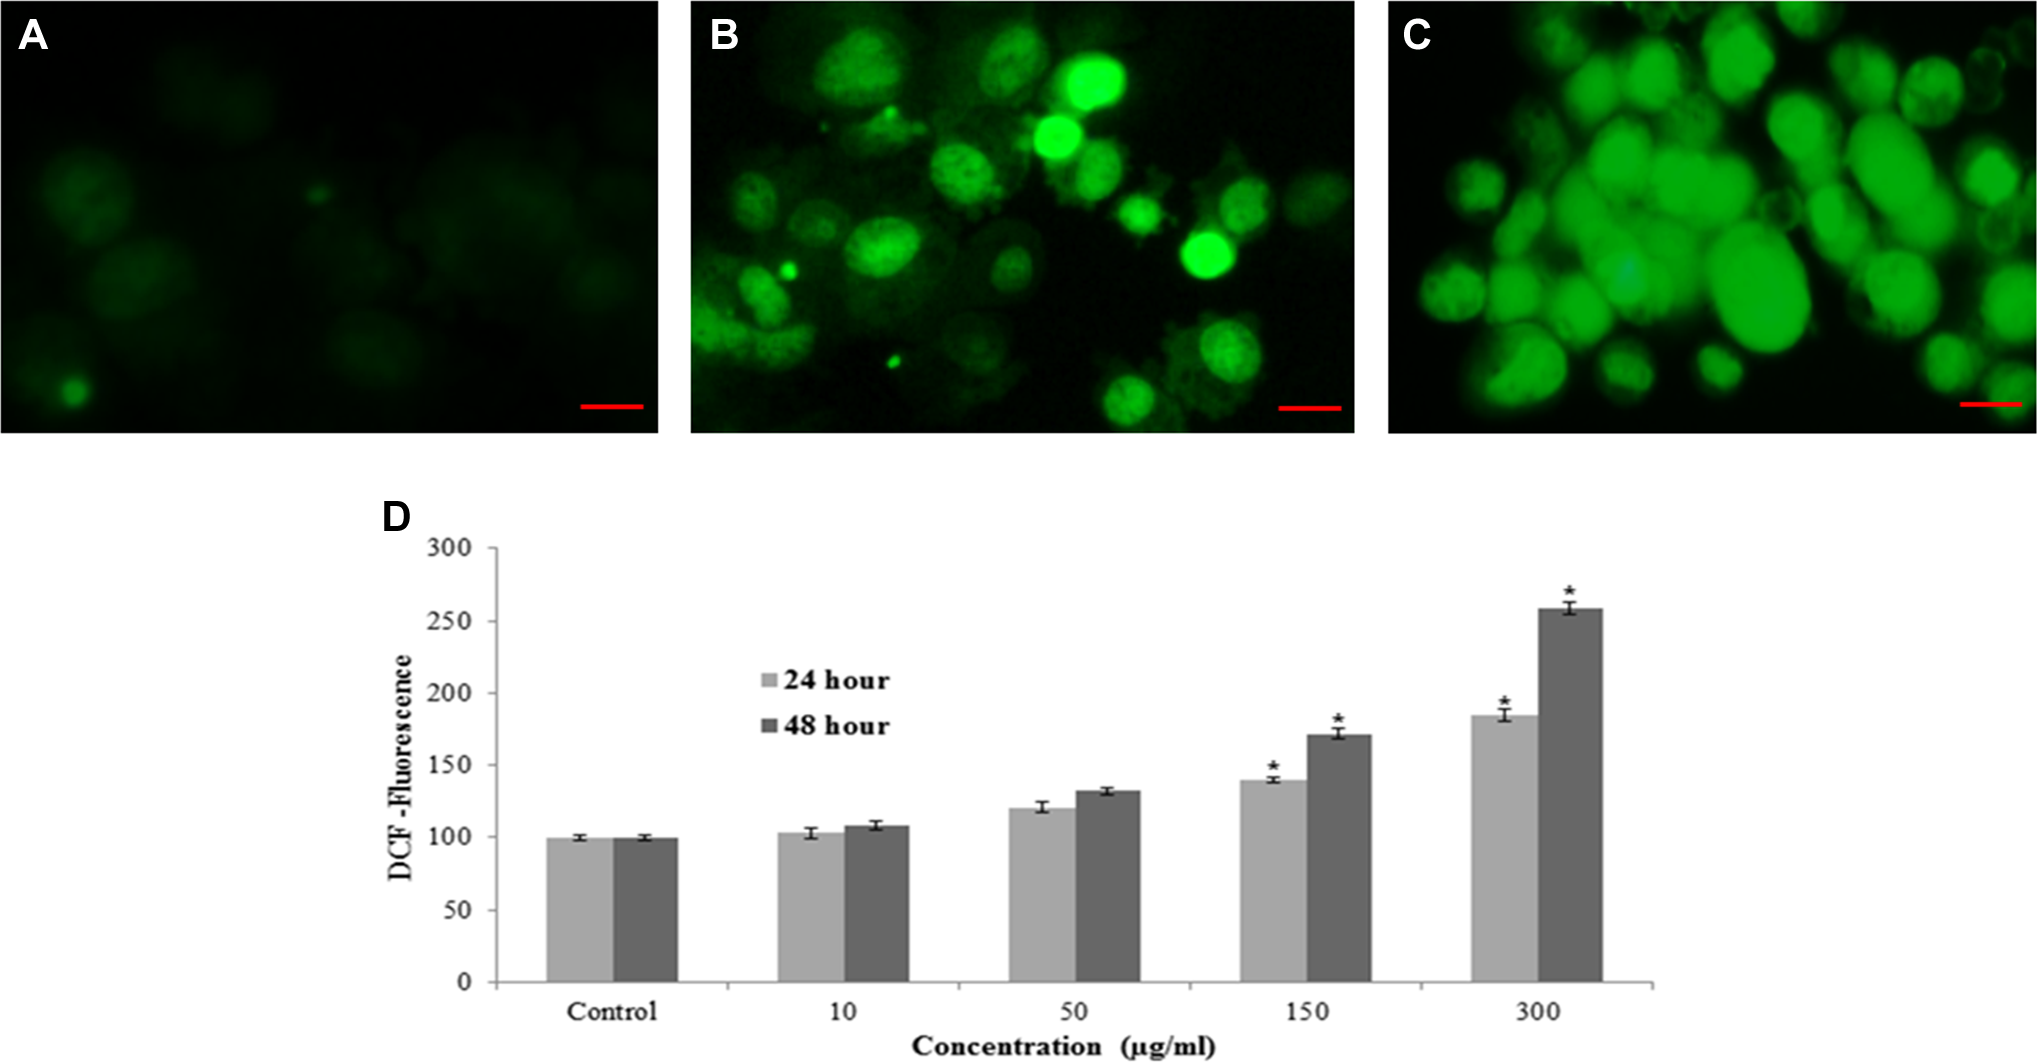
MWCNTs induced ROS in L929 cells. A, Control; (B) at 300 µg/mL of MWCNTs for 24 hour; (C) at 300 µg/mL of MWCNTs for 48 hours; (D) percentage of ROS production at various doses of MWCNTs in L929 cells. Images were snapped in phase contrast cum fluorescence microscope (Nikon, model 80i). Each value represents the mean ± SEM of 3 experiments. *P < 0.05 versus control. Scale bar (
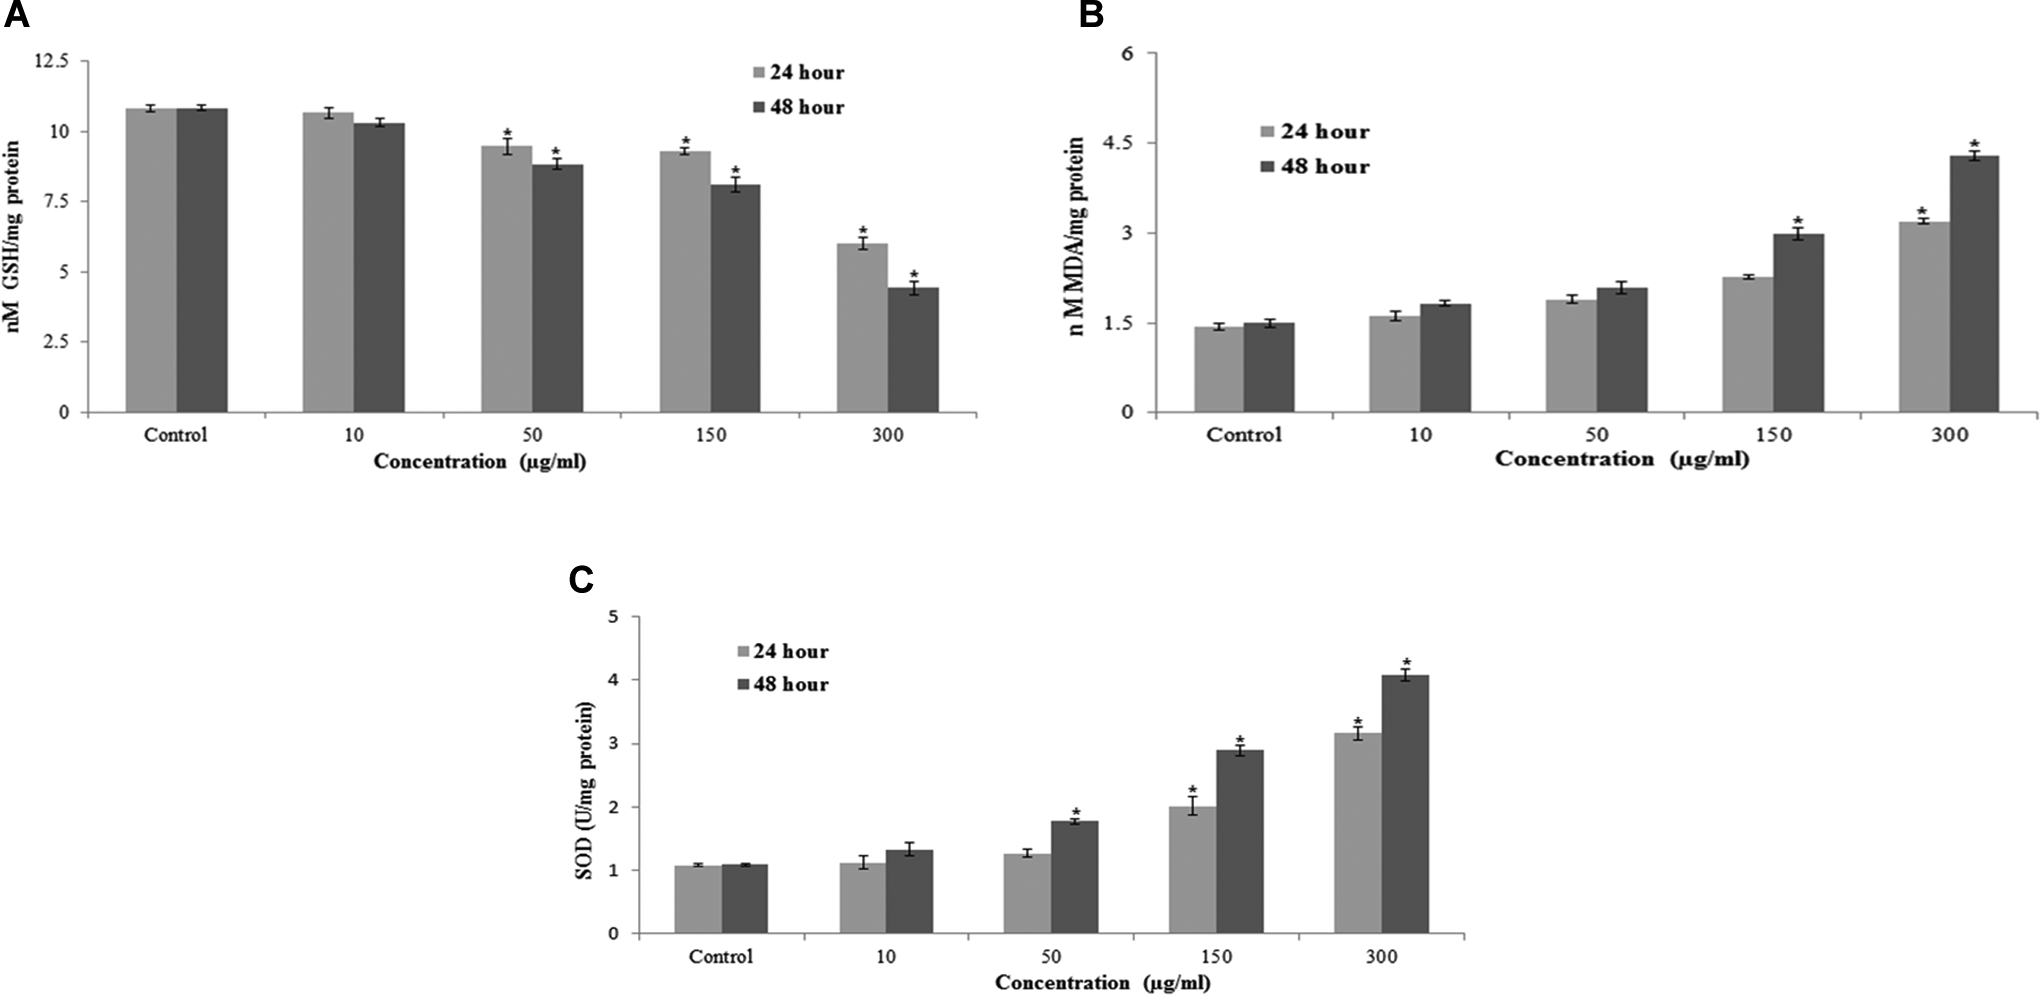
A, Levels of GSH, (B) LPO, and (C) SOD in L929 cells after treatment to MWCNTs for 24 and 48 hours. Each value represents the mean ± SEM of 3 experiments. *P < 0.05 versus control. GSH indicates glutathione; LPO, lipid peroxidation; SOD, superoxide dismutase; MWCNTs, multi-walled carbon nanotubes; SEM, standard error of the mean.
Induction of Chromosomal Condensation and Caspase-3 Activity by MWCNTs
Chromatin condensation was determined by DAPI staining. The L929 cells treated with MWCNTs (50, 150, and 300 μg/mL) for 48 hours produced chromatin condensation (Figure 6A-C).
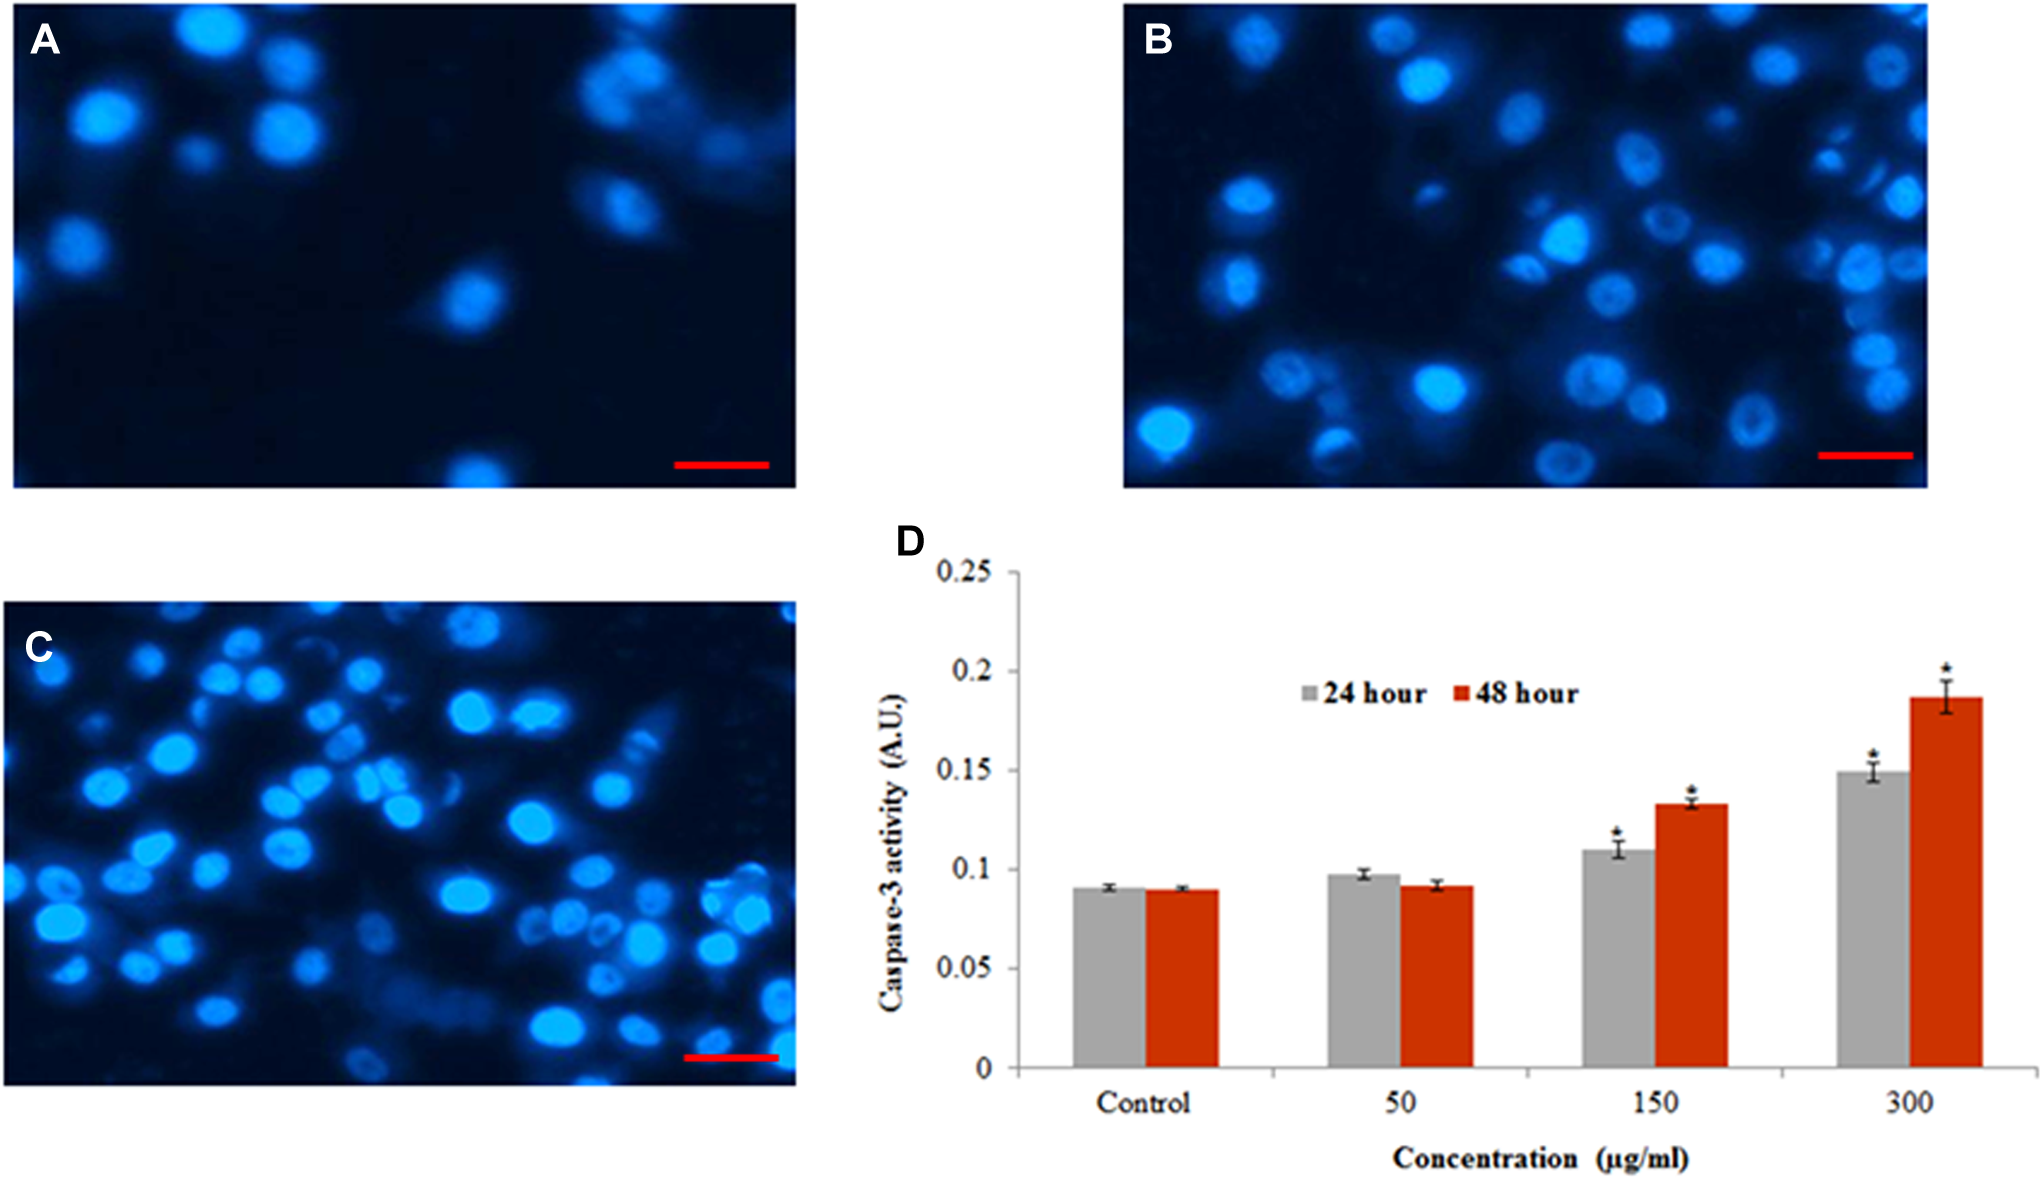
Chromosomal condensation and induction of caspase-3 activity in L929 cells after treatment to MWCNTs. A, Control, (B) at 300 µg/mL of MWCNTs for 24 hours, (C) at 300 µg/mL of MWCNTs for 48 hours, and (D) caspase-3 activity. Each value represents the mean ± SEM of 3 experiments. *P < 0.05 versus control. Scale bar (
Caspase-3, which plays a key role in the apoptotic pathway of cells, was induced following the treatment with MWCNTs (Figure 6D). When cells were treated with MWCNTs (50, 150, and 300 μg/mL) for 24 and 48 hours, the activity of caspase 3 was increased in a concentration and time-dependent manner.
DNA Strand Breakage
The DNA damage was measured as percentage of tail DNA in the control as well as MWCNTs-treated cells. The cells treated to different concentrations of MWCNTs exhibited significantly (P > 0.05) higher DNA damage in cells than those of control. The highest DNA damage was recorded at 300 µg/mL MWCNTs in L929 cells (Figure 7).
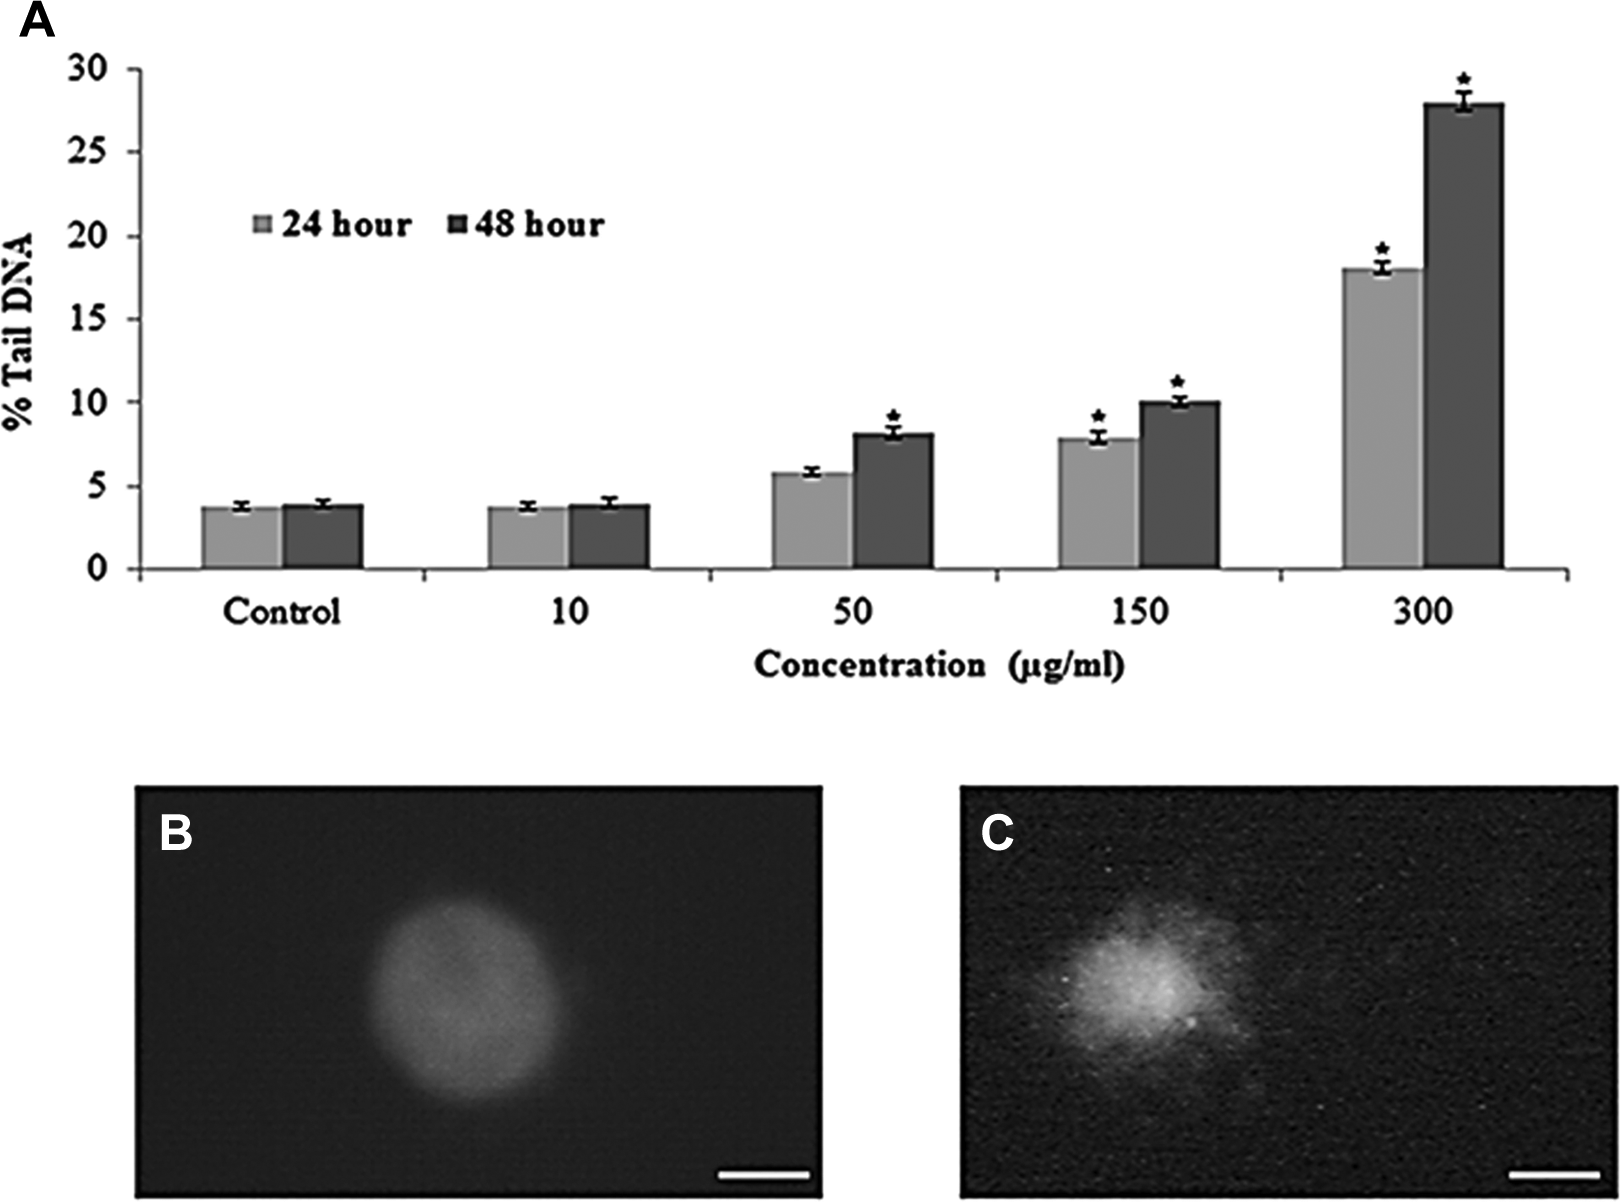
DNA lesions in L929 cells due to MWCNTs. A, Tail DNA (%), (b) control cell, and (c) at 300 µg/mL of MWCNTs for 48 hours. Each value represents the mean ± SEM of 3 experiments. *P < 0.05 versus control. Scale bars (
Discussion
The current study was designed to assess the cytotoxicity of MWCNTs using in vitro cultured mouse fibroblast (L929) cells. Our results indicate that MWCNTs have potential cytotoxic and genotoxic effects on L929 cells. The results also showed that the mode of cell death was apoptosis via ROS triggered mitochondrial pathway as evidenced by cleavage of caspase 3 and chromosome condensation. The size of MWCNTs had been characterized by TEM prior to study its toxicity in L929 cells.
The interference of some nanoparticles with used cytotoxicity assays has been well reported in the literature. Therefore, it has been suggested that the cytotoxicity of nanoparticles should be assessed with 2 or more independent test systems for validating the findings. 15 We have evaluated the cytotoxicity of MWCNTs by 2 different assays, for example, the MTT and NRU to increase the strength of the data. In the present study, MWCNTs induced cytotoxicity in dose and time-dependent manner.
Nel et al 16 had reported that oxidative stress is most important mechanism of toxicity related to nanoparticles. Nanoparticles have been attributed to its small size and large surface area which is generally thought to produce ROS and oxidative stress. 17 In our study, MWCNTs produced intracellular ROS as examined by cell permeable dye DCFH-DA. Reactive oxygen species typically include the superoxide radical, hydrogen peroxide, and the hydroxyl radical which cause damage to cellular components including DNA damage and ultimately apoptotic cell death. 18,19 Our observation is consistent with the other previous studies that showed similar effects on human SMMC-7721 cells. 20
We observed rise in LPO and SOD as well as decrease in GSH level in L929 cells after exposure to MWCNTs. Lipid peroxidation can further give rise to more free radicals and damage biomolecules such as DNA and protein in combining with ROS. Depletion of GSH in MWCNTs exposed cells combined with the increased level of LPO and SOD indicate that oxidative stress may be the primary mechanism for toxicity of MWCNTs in L929 cells. The MWCNTs can induce free radicals generation after interaction with cell components, such as mitochondrial damage. When free radicals interact with the cellular organelles, they may oxidize and reduce macromolecules (DNA, lipids, and proteins) resulting in significant oxidative damage to cell. Nanoparticles-induced LPO and oxidative stress lead to DNA damage and apoptosis. 21 Our results are consistent with other findings demonstrating metal oxide nanoparticles have the potential to induce DNA damage. 22
The MWCNTs-induced cell death observed in this study may occur by 2 distinct modes, that is apoptosis and necrosis, which can be distinguished by morphological and biochemical features. The DAPI staining of MWCNTs-treated L929 cells resulted in chromosomal condensation and fragmentation which is another morphological hallmark of apoptosis. Chen and Mikecz 23 reported that nanoparticles due to their small size are capable of reaching to the nucleus and interact with DNA. They may also exhibit an indirect effect on DNA through their ability to generate ROS. DNA damage induce cell death, thus disrupting normal cell functions. 24 We detected the genotoxic potential of MWCNTs in L929 cells by comet assay which is capable of detecting single as well as double DNA strand breaks and alkali labile sites even at low levels of DNA damage. 25 Our results demonstrate that MWCNTs induce apoptosis and DNA damage in L929 cells, which may be mediated through ROS and oxidative stress.
Footnotes
Acknowledgments
The authors would like to extend their sincere appreciation to the Deanship of Scientific Research at King Saud University for its funding of this research through the research Group Project No. RGP-180.
Authors’ Contribution
Saud Alarifi contributed to conception, contributed to acquisition, drafted the manuscript, critically revised the manuscript, gave final approval, and agreed to be accountable for all aspects of work ensuring integrity and accuracy. Daoud Ali contributed to conception, contributed to acquisition, drafted the manuscript, critically revised the manuscript, gave final approval, and agreed to be accountable for all aspects of work ensuring integrity and accuracy.
Declaration of Conflicting Interests
The author(s) declared no potential conflicts of interest with respect to the research, authorship, and/or publication of this article.
Funding
The author(s) received no financial support for the research, authorship, and/or publication of this article.