
Abstract
Metabolic profiling of urine from pesticide-treated rats was investigated by the nuclear magnetic resonance (NMR)-based metabonomic strategy. Twenty-four-hour urine samples of rats were collected after administration with propoxur at doses of 0.85, 1.70, and 8.51 mg/kg, respectively, for 28 consecutive days. Liver tissue was fixed and the histopathological alterations were examined. The results showed that propoxur at high dose induced liver histopathological injury. Metabonomic analysis demonstrated that the levels of creatine and taurine markedly increased together with slight elevation of hippurate, glucose, and amino acids in low- and medium-dose groups. However, concentrations of urinary lactate, acetate, acetone, succinate, citrate, and 2-oxoglutarate increased in high-dose group. All these results suggested that propoxur could inhibit liver function through altering the energy and lipid metabolism. These data also supported the contention that the NMR-based metabonomic approach represents a promising new technology for the development of pesticide toxicity screening and mechanism exploration.
Introduction
Agricultural pesticides have been widely used in indoor and outdoor applications for agricultural, medicinal, and veterinary purposes. 1 Propoxur is a widely used, broad spectrum, the most representative carbamate insecticide, which is mainly applied in household pest control and for residual spraying in malaria eradication program. The widespread use of propoxur leads to severe environmental pollution and potential health hazards, which deserves careful investigation. Previous studies of propoxur have concentrated on the neurotoxicity; however, minimal attention was paid to the study of the comprehensive toxicology of the pesticide. Some studies are carried out on acute toxicity of propoxur at relatively high doses (toxic levels) 2 ; however, there is a clear lack of information on prolonged, repeated toxicity studies on low (nontoxic levels) and subtoxic doses. To understand the adverse health effects arising from the application of the pesticide, the establishment of sensitive methods to detect the changes in the organism caused by repeated low-dose exposure at early stage is necessary.
Current pesticide regulatory toxicological practice as it applies to the evaluation of general organ and tissue damage is found in the measurements of serum enzyme levels, hematological evaluation, and histopathological assessment. 3,4 These toxicological methods have been the gold standard for 50 years. However, a nuclear magnetic resonance (NMR) spectroscopy-based metabonomic approach combined with the knowledge of biology, chemistry, and physics is more sensitive and rapid throughput compared with the traditional methods. 5 This new approach was defined as the quantitative measurement of the dynamic multiparametric metabolic response of living systems to pathophysiological stimuli or genetic modification. 6 It is a useful tool for physiological evaluation, drug safety assessment, 7 diagnosis of human disease, and characterization of genetically modified animal models of disease. 8 –10 The metabonomic analysis for toxicological assessment, biomarker discovery, and target organ localization could serve as new approaches to address the problems in molecular toxicology. 11 –13 Especially, metabonomic technique showed a powerful prospect in hepatotoxicity and nephrotoxicity studies. 12,14 Changes in urinary metabolites can reflect significant hepatotoxicity induced by combined exposure to toxicants. 15 Actually, urine metabolites as the terminal product of cellular processing could reflect the system level biological stress response. Therefore, the adverse effects on the biochemical process induced by the exogenous compounds can be directly reflected from the alterations of the urine metabolites. Also because such urine sample can be collected using minimally invasive approaches, this should be an advantage of the approach. Some researchers have already adopted this approach to investigate the metabolic response of rat after oral administration of tributyl phosphate 16 and the combined effect of chlorpyrifos with carbaryl. 17 In this study, we focused our attention on the potential of NMR-based metabonomic analysis to detect the alteration of urinary profiles of endogenous metabolites of rats exposed subacutely to propoxur.
Materials and Methods
Reagents
Propoxur (isopropoxiphenylmethylcarbamate) of 99.4% purity was the precious donation by the Institute of Chemical Industry (Hunan, China). 2,2′,3,3′-Deuterotrimethylsilylproprionic acid (TSP), heavy water (D2O), and other chemicals were purchased from Sigma Chemical Co (St Louis, Missouri).
Animals and Treatments
A total of 20 male Wistar rats with body weight of 200 ± 10 g purchased from Weitonglihua Company (Beijing, China) were housed individually in cages and kept under controlled conditions (12-hour light–dark cycle, 22°C ± 2°C, 50% ± 10% relative humidity). Food and tap water were provided ad libitum. After 7 days of acclimatization, the rats were randomly allocated to 4 groups according to body weight, with 5 rats per group. All animal procedures were performed in accordance with current China legislation and approved by the Institute of Zoology Animal and Medical Ethics Committee.
Previous studies have shown that the approximate oral median lethal dose (LD50) of propoxur for male rat was 85.1 mg/kg18; in the present study, we chose 1/10, 1/25, and 1/100 LD50 of the pesticides as high (H; 8.51 mg/kg)-, medium (M; 1.70 mg/kg)-, and low (L; 0.851 mg/kg)-dose groups, respectively. Propoxur was dissolved in corn oil and the solutions were applied per os by gavage in a volume of 1 mL/kg body weight basis and were adjusted daily for body weight. The rats were administrated daily for 28 consecutive days.
Samples Collection
After 28-day oral dosing, 24-hour urine samples of each rat were collected into ice-cold vessel containing 1% sodium azide (0.1 mL) to prevent bacterial contamination. The overnight urine was then centrifuged at 3000g for 10 minutes to remove any particulate matter, after which an aliquot was taken from each sample and stored at −80°C prior to NMR analysis. Twenty-four hours after the final administration, all rats were euthanized by exsanguinations with sodium pentobarbital (50 mg/kg, intraperitoneally).
Histological Analysis
A fraction of the liver tissues were immediately dissected and fixed in buffered neutral formalin solution (10%, v/v). The fixed tissues were processed into paraffin wax, then cut into sections of 5 to 6 μm thickness and stained with hematoxylin–eosin and observed microscopically.
1H NMR Spectroscopic Measurement of Urine Sample
Urine samples were thawed, and aliquots of 400 μL urine were mixed with 200 μL phosphate buffer (0.2 mol/L Na2HPO4/0.2 mol/L NaH2PO4, pH 7.4) to minimize chemical shift variation due to different pH in urine samples. The urine–buffer mixture were allowed to stand for 10 minutes and then centrifuged at 3500g for 5 minutes to remove any precipitates. An aliquot of 500 μL was put into a 5-mm NMR tube and mixed with 50 μL of TSP dissolved in D2O solution (1 mmol/L, final concentration). The TSP acted as the internal chemical shift reference (δ0.0), whereas D2O was used for deuterium lock signal for NMR spectrometer. Urine analysis was carried out on a Bruker-Av600 spectrometer (Bruker Co, Germany) at 298 K. Water signals were suppressed by presaturation.1H NMR spectra were acquired at 30°C, with 90° pulse widths over a spectral width of 8992.8 Hz. Typically, 32 free induction decays (FIDs) were collected into 64 k data points with a relaxation delay of 5 seconds and an acquisition time of 0.91 seconds. The FIDs were multiplied by an exponential function equivalent to a 0.3-Hz line-broadening factor prior to Fourier transformation.
Data Reduction of 1H NMR Spectra
Using MestReC (version 4.8.1.1, Mestrelab Research, A Coruna, Spain), each 1H NMR spectrum was automatically phased, baseline corrected, and segmented range in size from 0 to 10 parts per million (ppm) in the spectral region, and each 1H NMR spectrum was divided with δ 0.04 ppm. For the urine data, the water and urea regions were removed (δ 4.2-6.0) prior to the pattern recognition (PR) analysis, and the spectra were normalized to the total urine volume collected at each time point, to correct the variation in concentration.
Pattern Recognition of the 1H NMR Spectra
The reduced data described above were scaled to the total integral of each spectrum before PR analysis. Statistical analysis was processed with the soft independent modeling of class analogy (SIMCA) software package (version 11.5; Umetrics AB, Umeå, Sweden).
There are a large number of multivariate data analysis methods. Principal component analysis (PCA), an unsupervised PR method, was performed to examine the dominant intrinsic variation in the data set. In the PCA model, data were visualized using the principal component (PC) scores and loadings plots. 19 Yet one of the most popular methods is projections to latent structures by means of partial least squares (PLSs), which can be described as the regression extension of PCA. 20 The NMR data can be analyzed using PLS discriminant analysis (PLS-DA) that applies the PLS algorithm to classification, using a “dummy” Y matrix that comprises an orthogonal unit vector for each class. 21 The PLS-DA can improve the discrimination between the 1H NMR urine profiles of these 3 treatment groups. Therefore, the unknown samples can then be predicted into the model to determine which class they belong to.
Results
Histopathological Changes
The histopathological results of liver tissue of rats treated with different doses of propoxur were shown in Figure 1. After 28 days of administration of high dose of propoxur, liver section of rats from high-dose group showed hepatocellular necrosis and vacuolation (Figure 1D). Compared with that of the control rats, no discernible differences were found in the liver sections of rats exposed to low and medium dose of propoxur (Figure 1B and C).
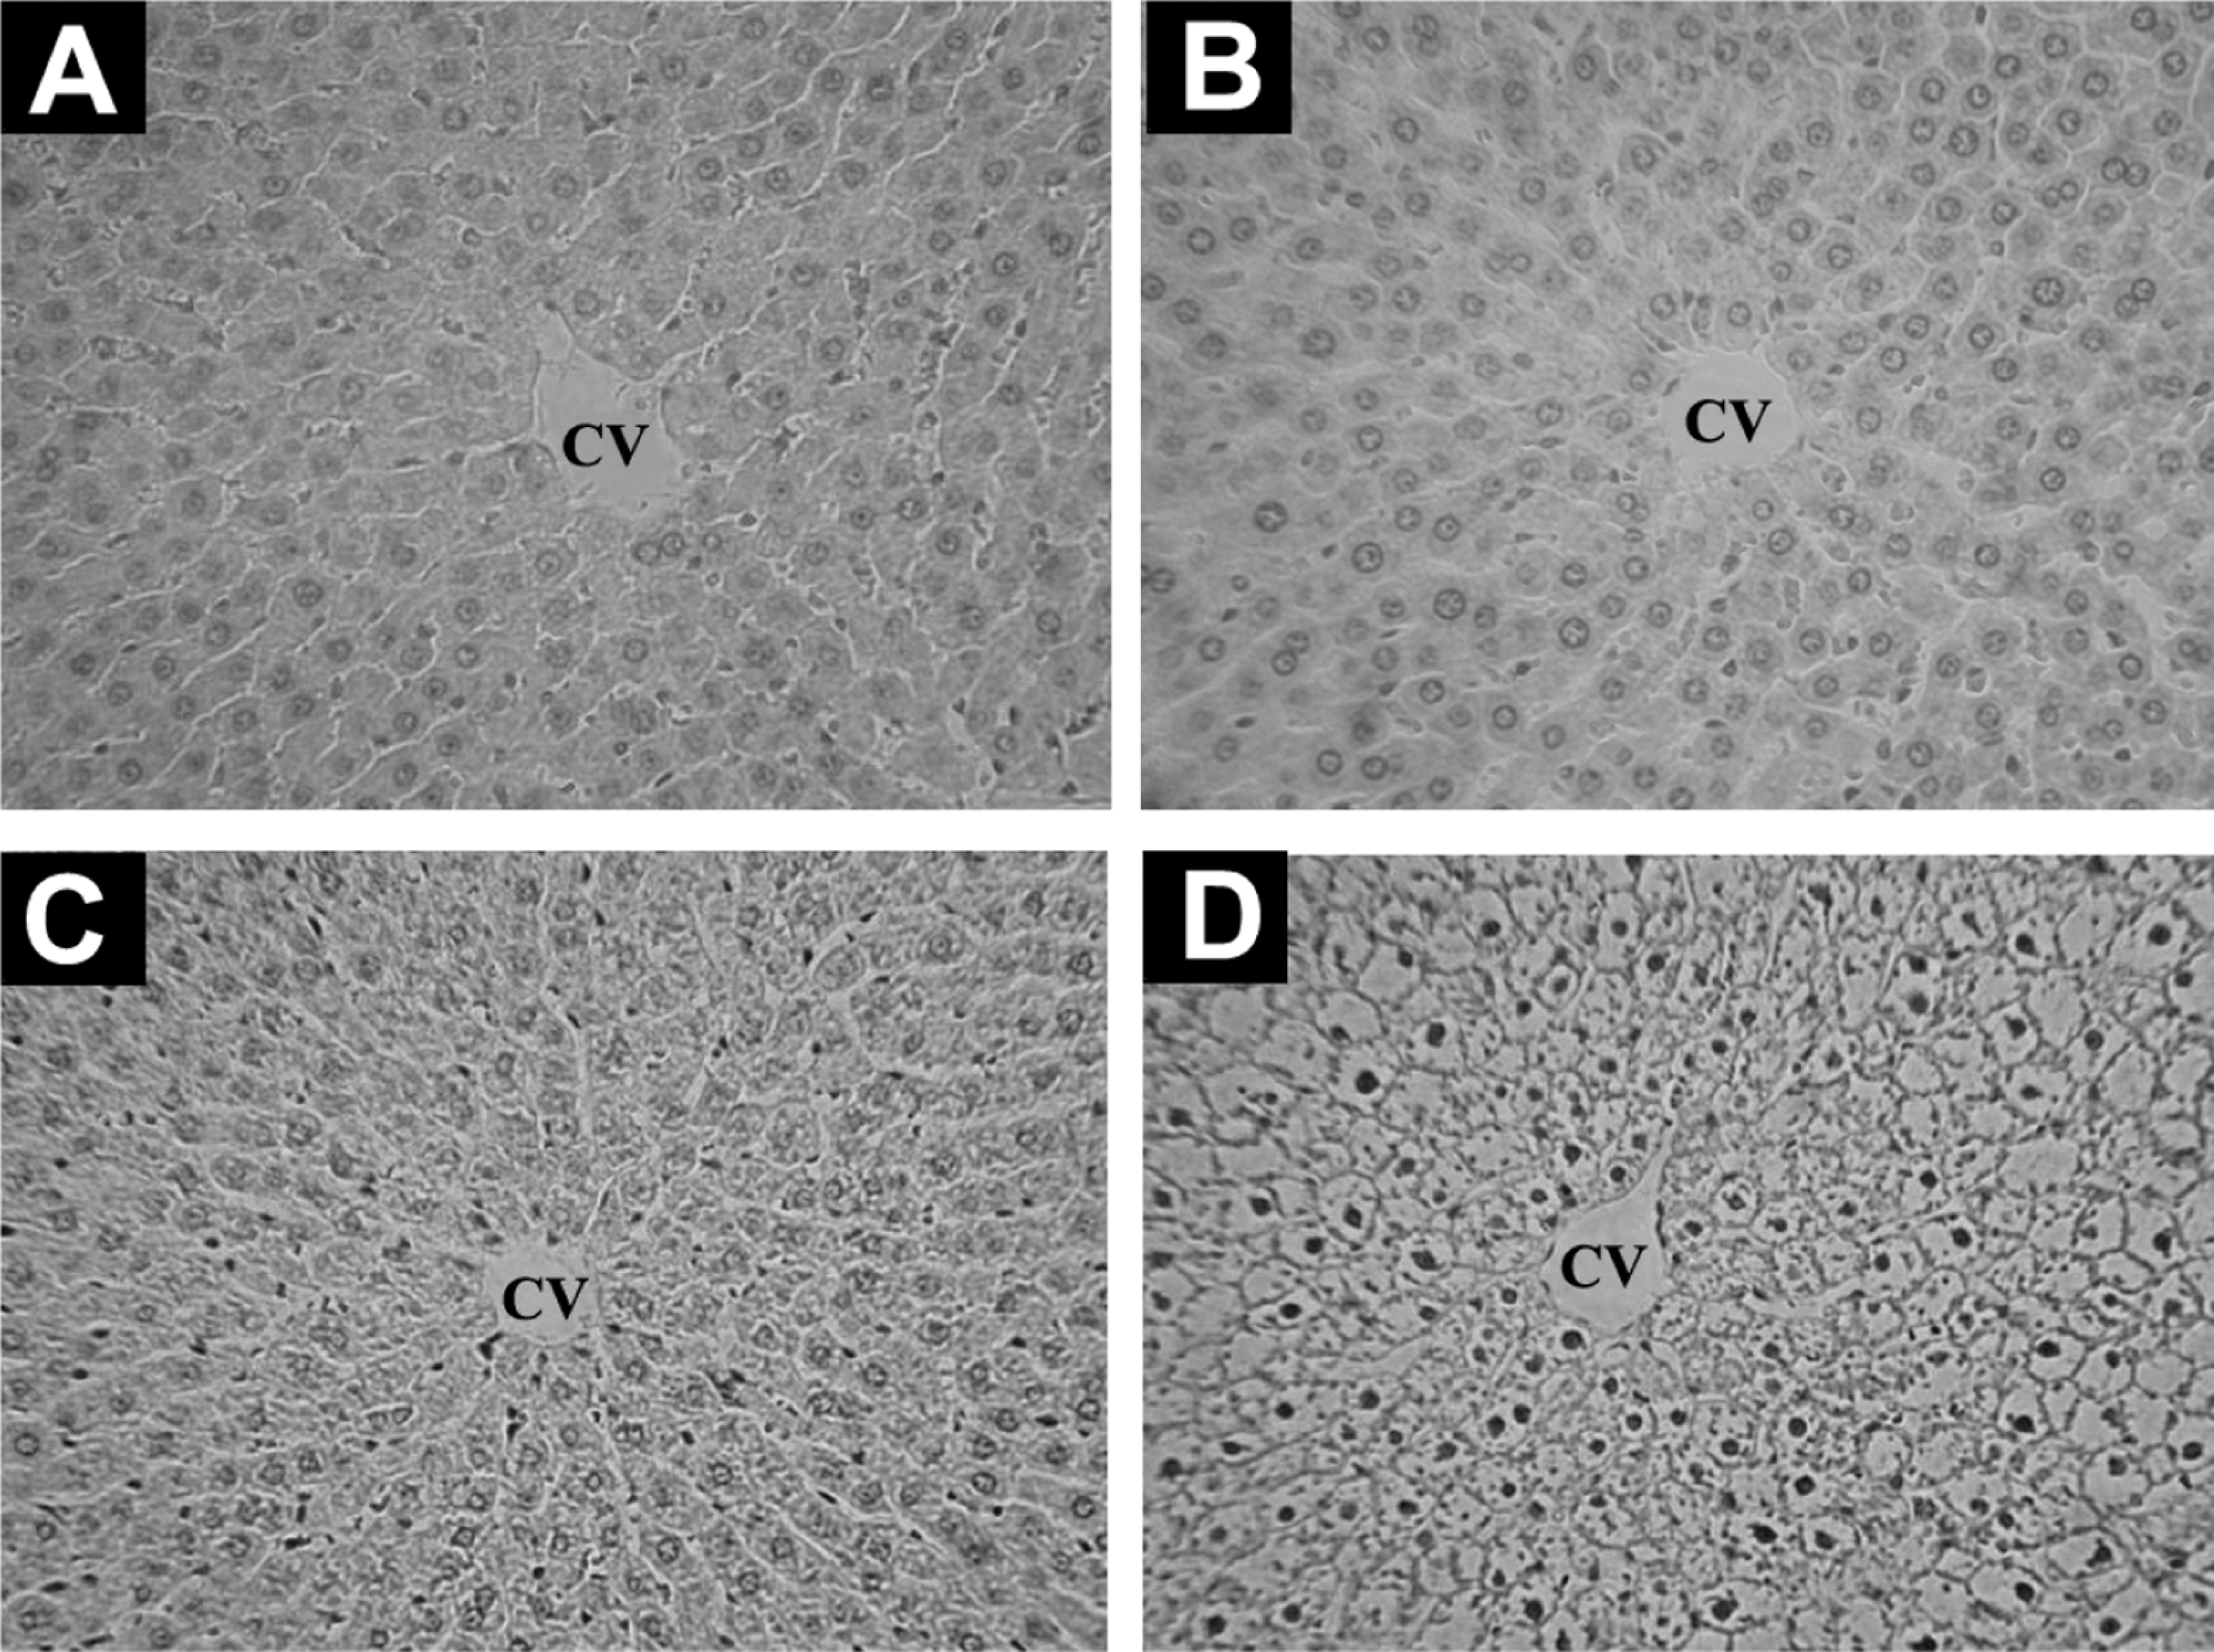
Representative micrographs of liver histopathological sections from rats treated for 28 consecutive days with propoxur at different doses of 0 mg/kg per d (A), 0.851 mg/kg per d (B), 1.70 mg/kg per d, (C) and 8.51 mg/kg per d (D; H&E, magnification ×100). CV indicates ventral vein.
1H NMR Spectra and PR Analysis of Urinary Metabolites Induced by Propoxur
Figure 2 displayed the representative 1H NMR spectra of urine samples from rats after the 28-day treatment of propoxur at different doses. Dose-related alterations to the urinary profile were readily apparent in the NMR spectra following visual examination, with increases in acetate and glycine being observed in the spectra of urine samples from high-dose group, but not low- and medium-dose group. However, it is not possible to visibly distinguish other changes in metabolic profiles. In order to fully characterize the metabolic changes, PLS was employed revealing a clear clustering of the data according to different dosing groups. All 3 PLS-DA models displayed a treatment-related clustering of urine phenolic profiles, but better group clustering and clear separation were obtained among the control and all treatment groups by the score plots (Figure 3). The low-, medium-, and high-dose groups were clearly separated, suggesting that these groups had different kinds of metabonomic profiles.
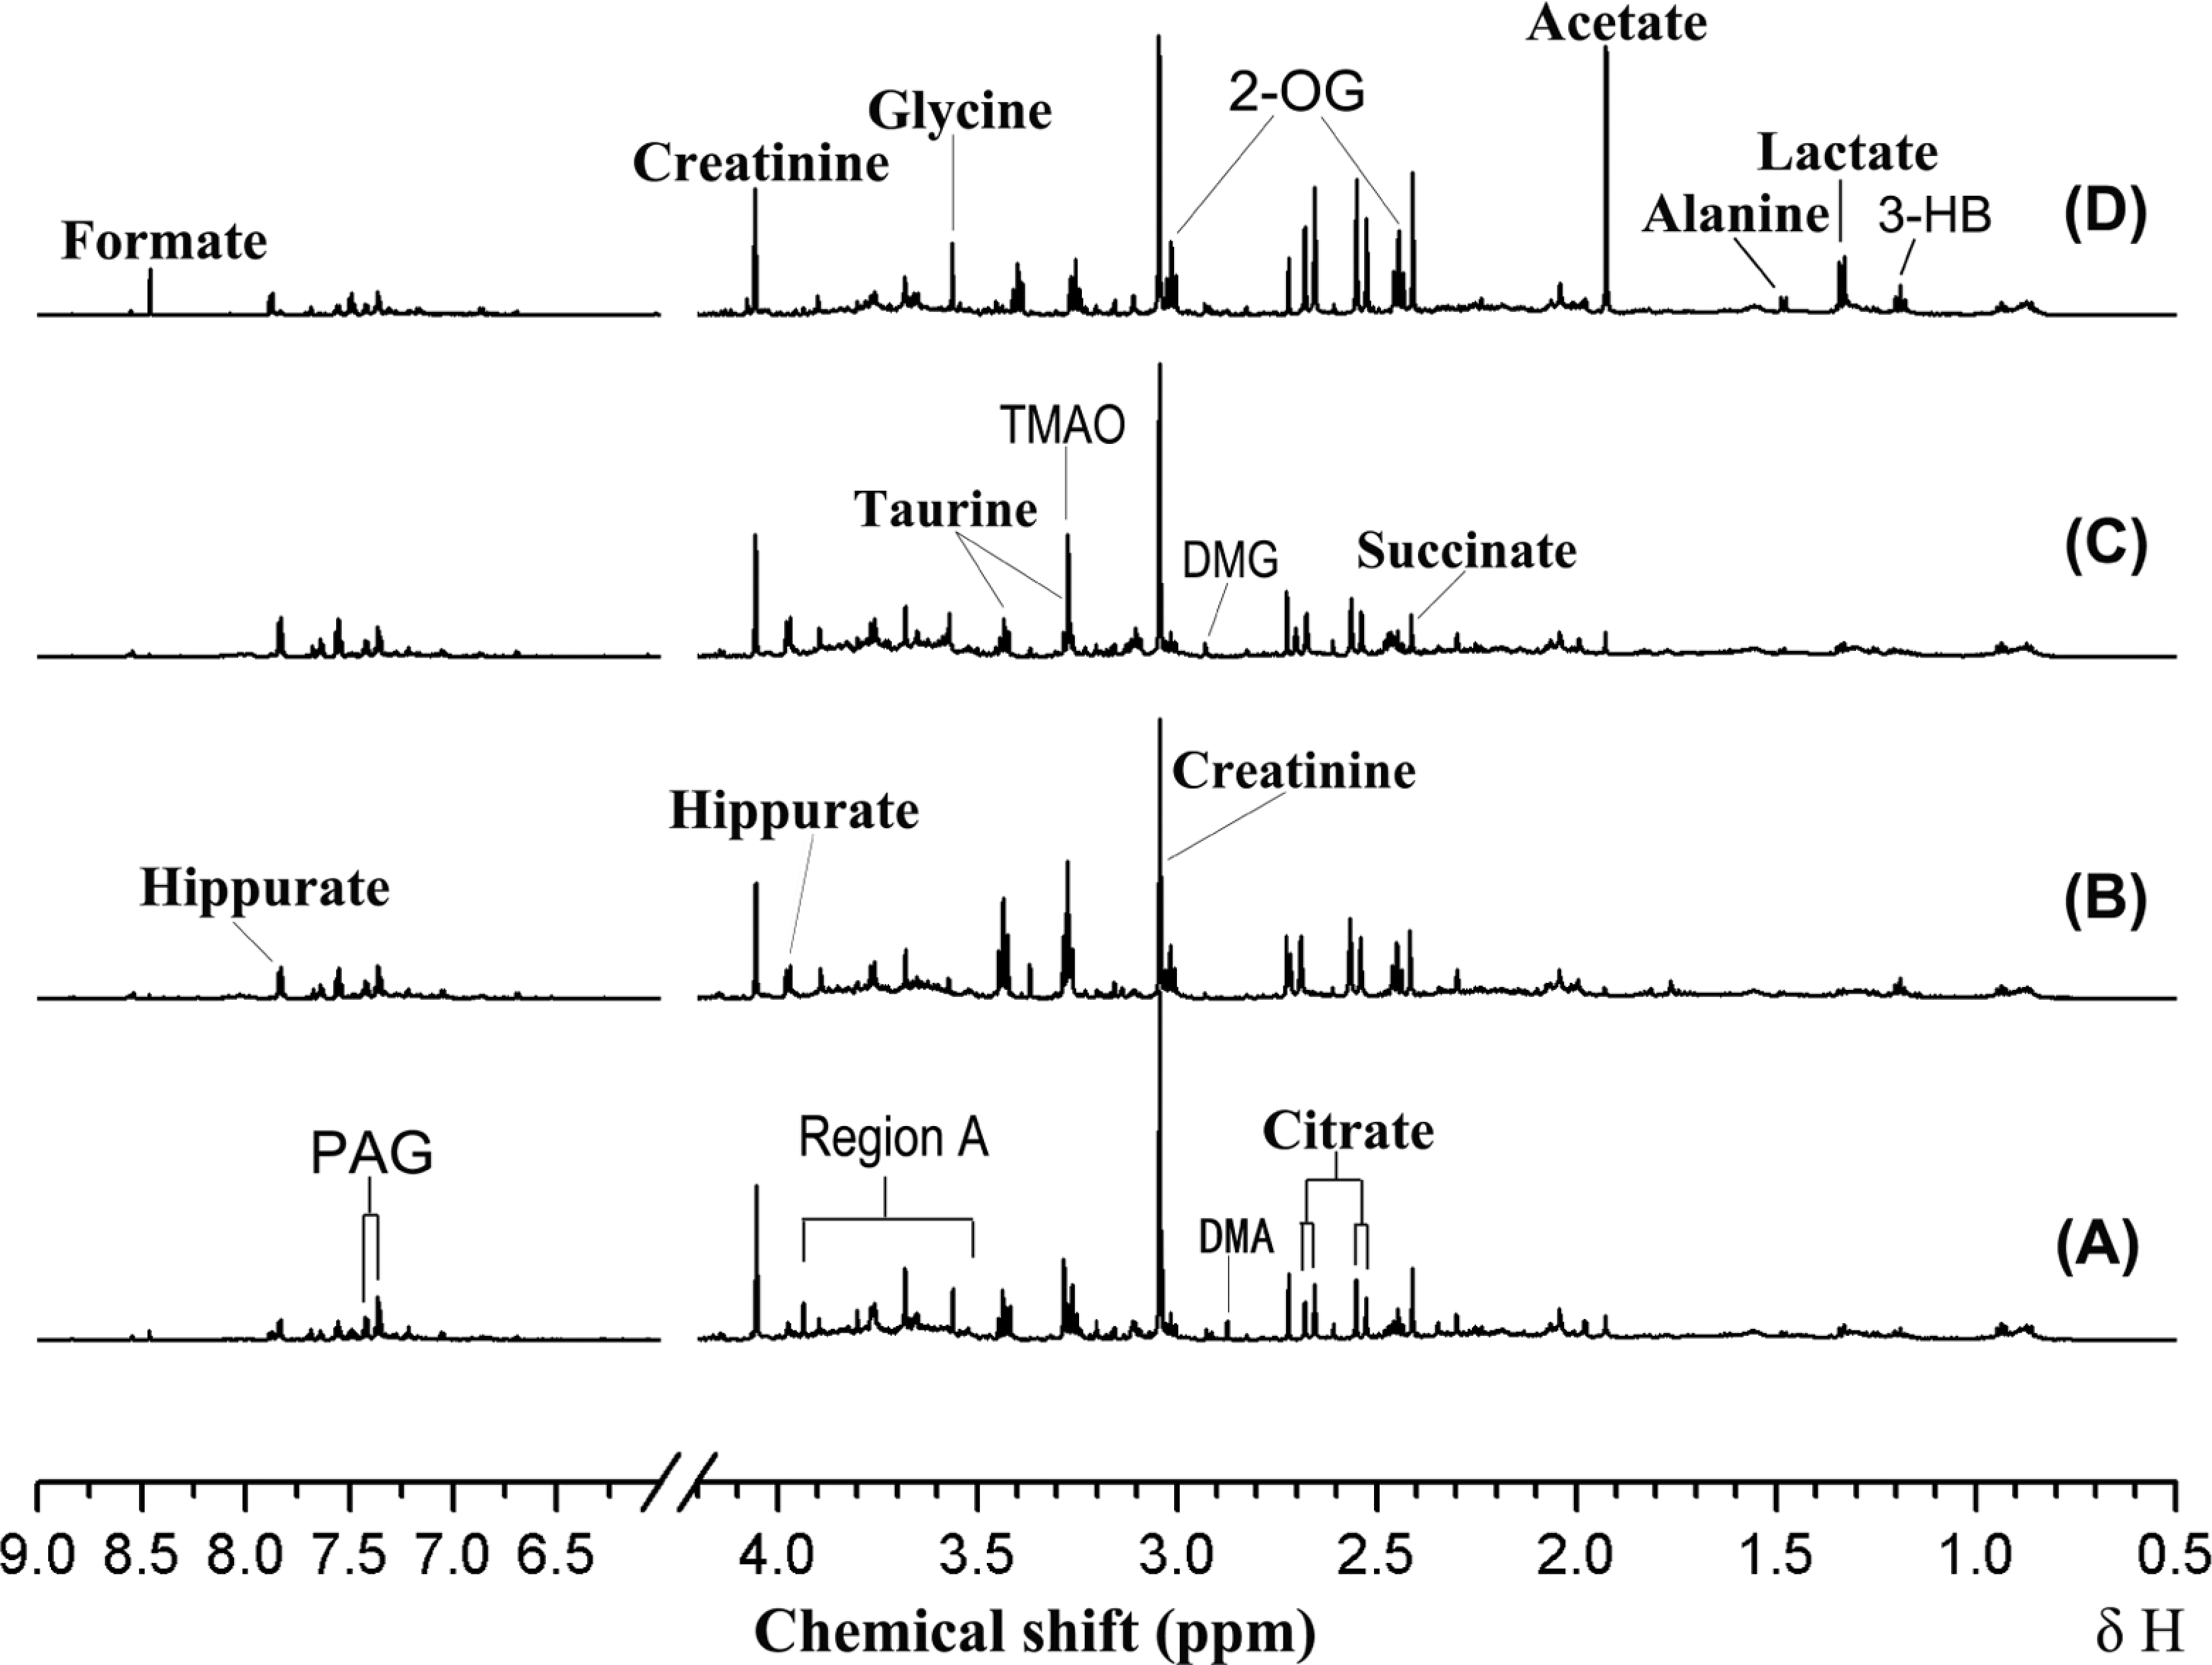
Representative 1H NMR spectra (600 MHz) of urine samples from rats treated with propoxur for 28 days at doses of 0 mg/kg per d (A), 0.85 mg/kg per d (B), 1.70 mg/kg per d (C), and 8.51 mg/kg per d (D). Key: 3-HB, 3-
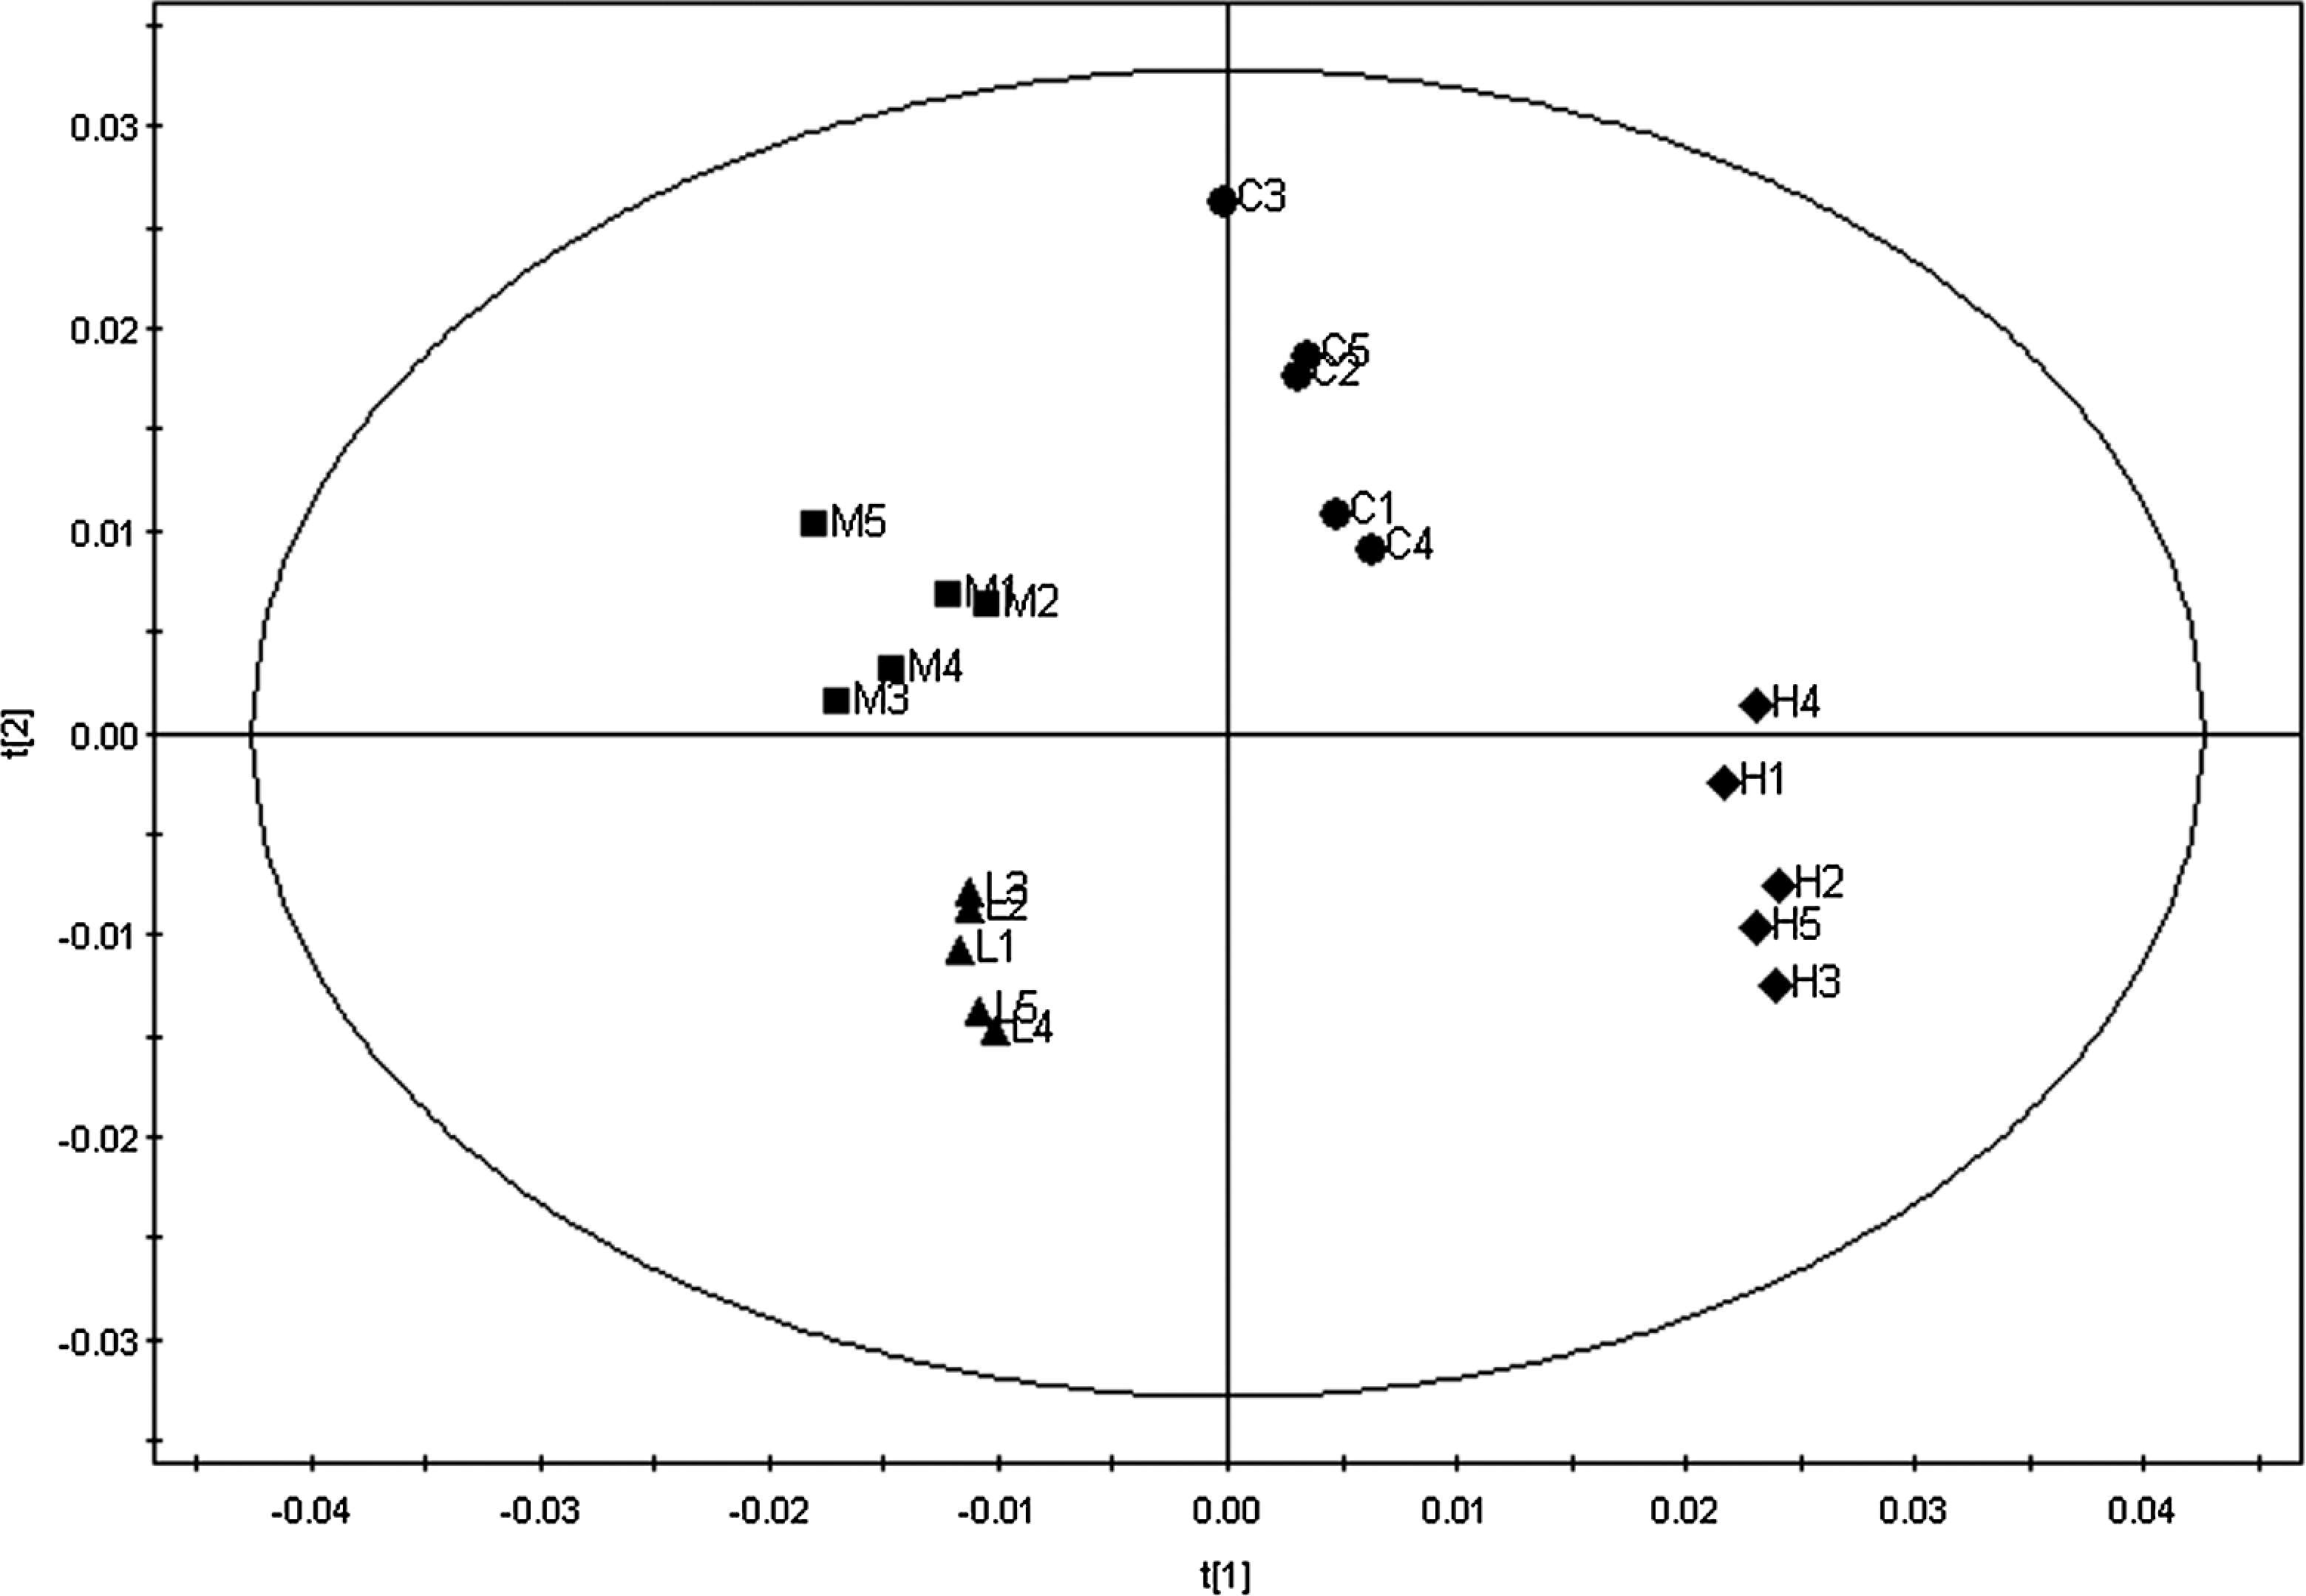
Scores map of t[1]/t[2] PLS-DA scores plot based on the 1H NMR spectra of urine from control rats (C) and rats treated with propoxur at doses of 0.85 mg/kg per d (L), 1.70 mg/kg per d (M), and 8.51 mg/kg per d (H), respectively, for 28 consecutive days. The numbers after characters represent the rat numbers. NMR indicates nuclear magnetic resonance.
The corresponding loading plots (Figure 4) identified the spectral regions that contribute most to the separation of samples in the scores plots. A variety of biochemical changes were identified from the analysis of the corresponding loadings plot and NMR spectra. The plot showed significant increase in the creatine (3.04 ppm) and taurine (3.24, 3.28 ppm) together with slight elevation of hippurate (3.96, 7.56, 7.64, and 7.84 ppm), glucose, and animo acids (3.44, 3.6, 3.68, 3.76, 3.96, and 7.36 ppm) levels in urine of low- and medium-dosed rats (Table 1). However, the concentration of lactate (1.32 ppm), acetate (1.92 ppm), acetone (2.24 ppm), succinate (2.4 ppm), citrate (2.52, 2.64, and 2.68 ppm), and 2-oxoglutarate (2.44, 3.00 ppm) was increased in high-dose group (Table 1). These metabolites contribute mostly to the separation between high- and medium-dose groups and control group.
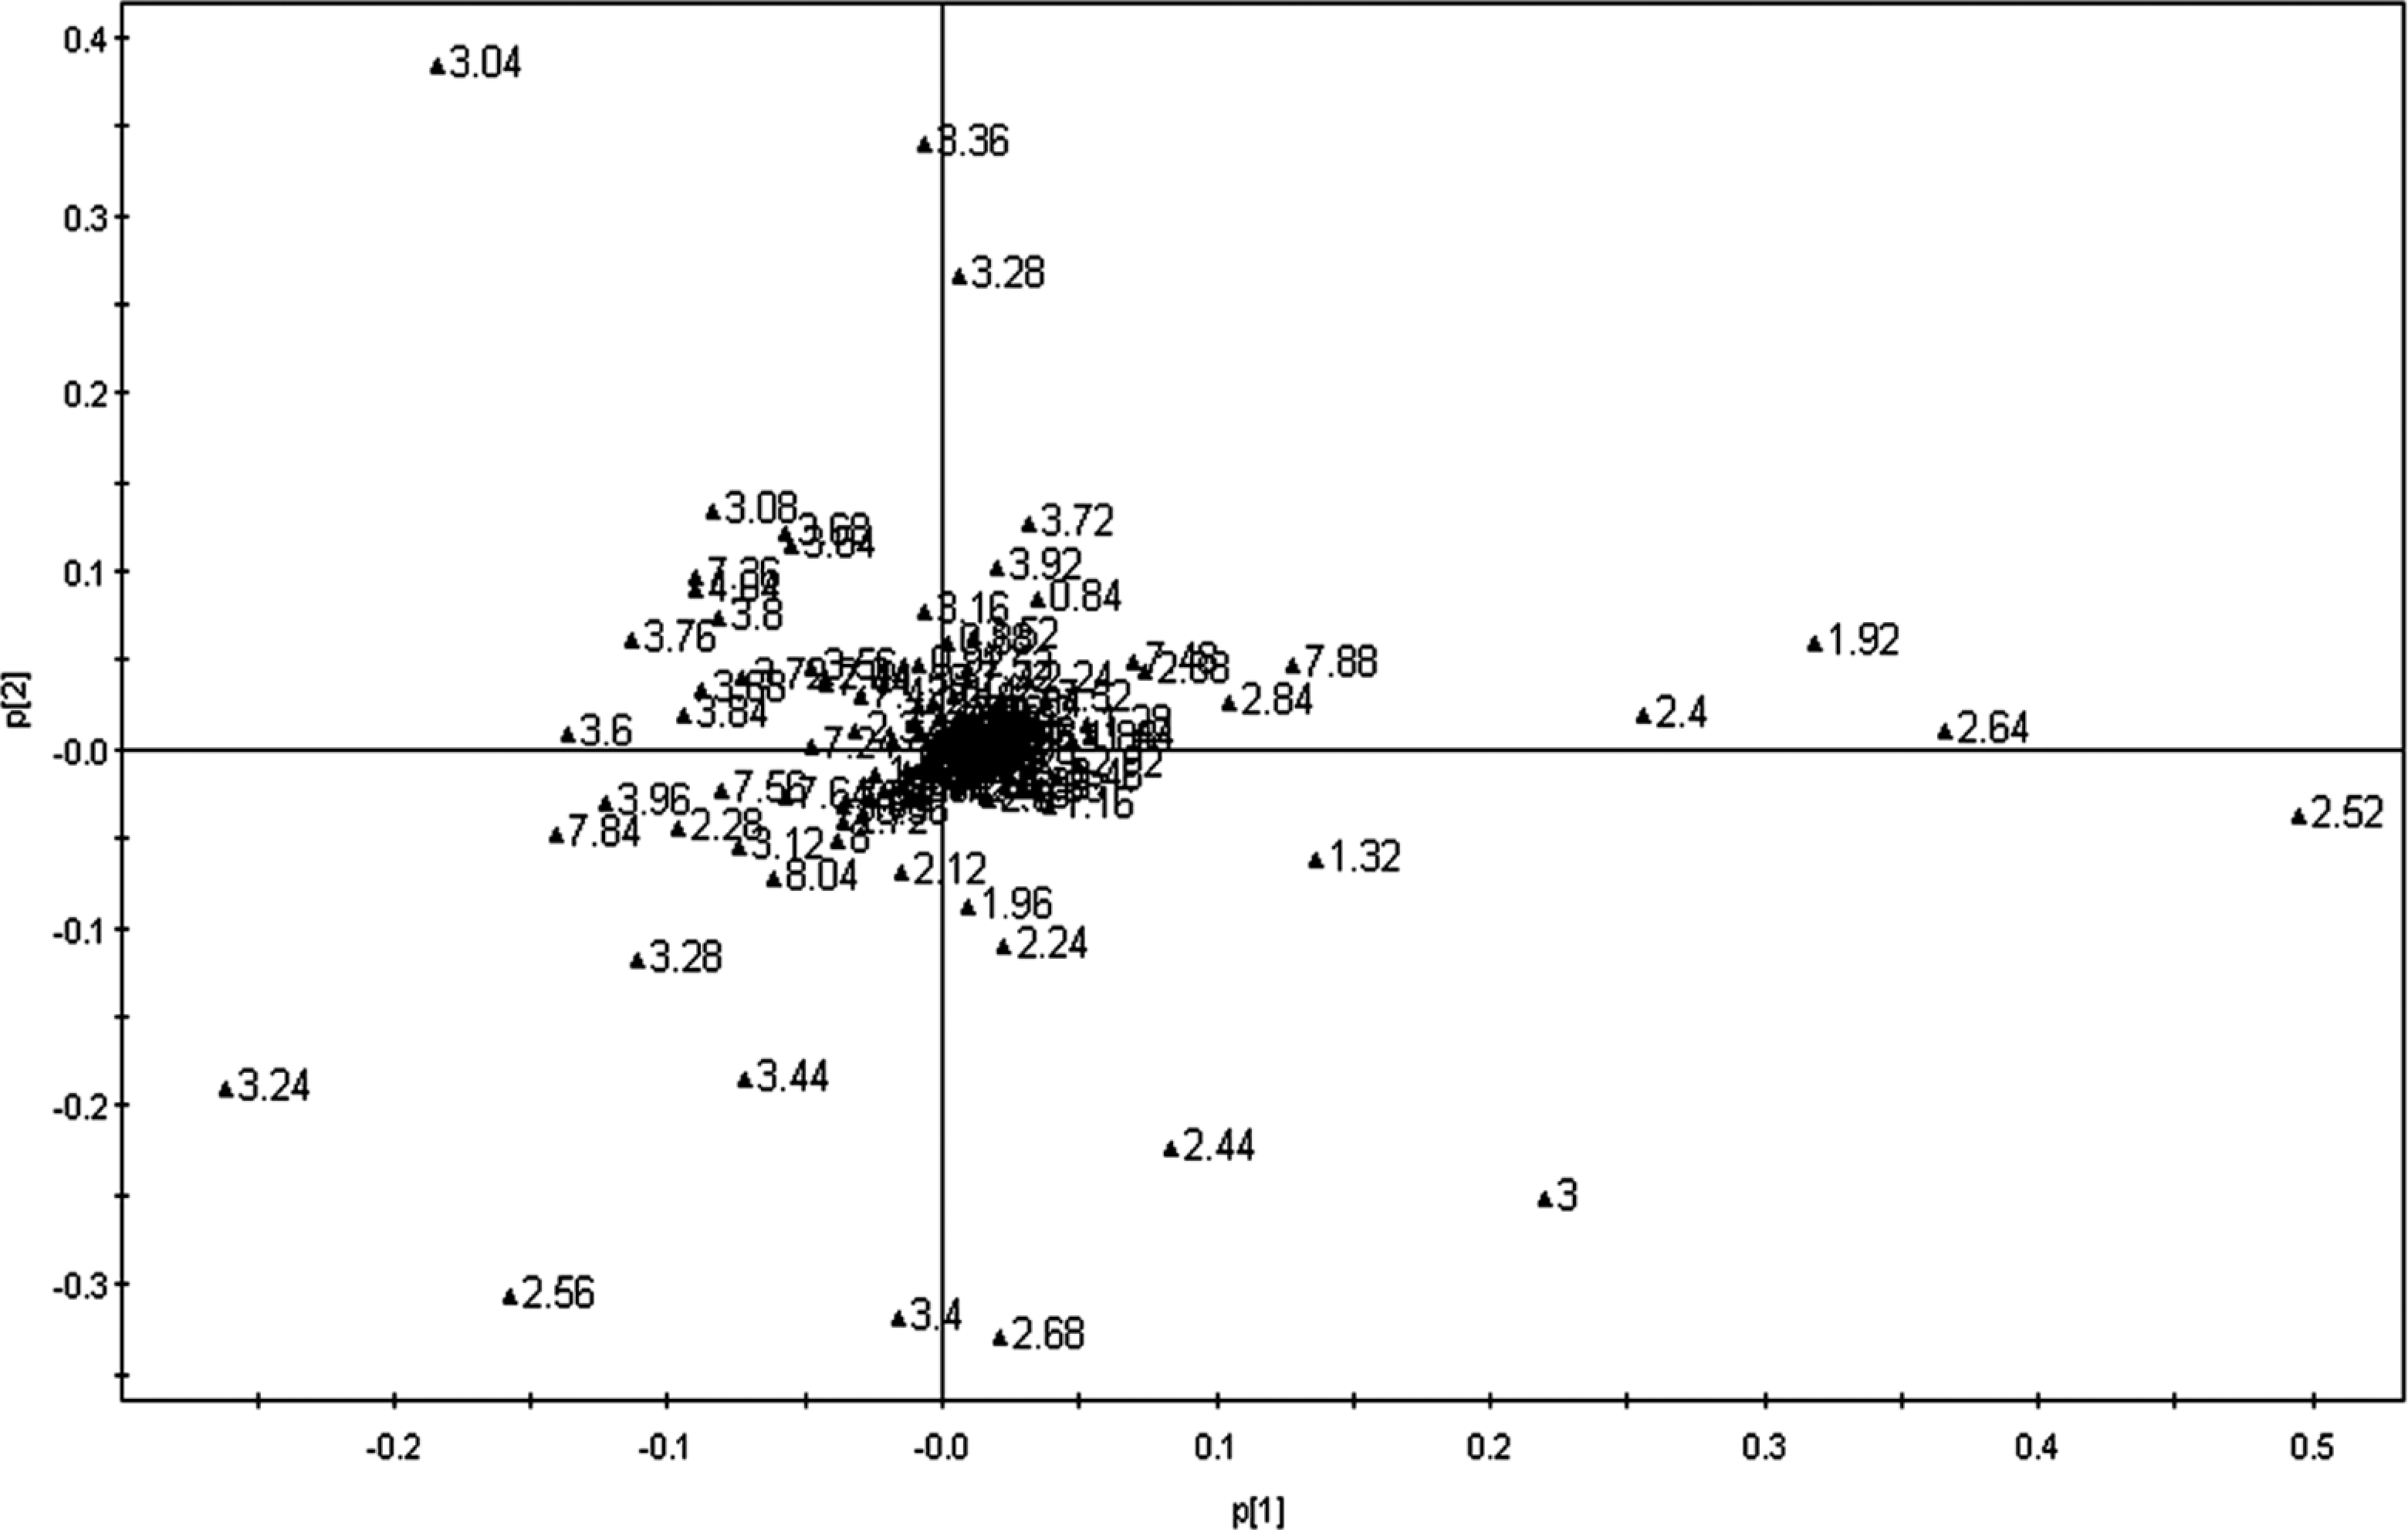
Loadings plot for the corresponding score plots (shown in Figure 3) based on the 1H NMR spectra of rat urine. Rats were treated with propoxur at doses of 0, 0.85, 1.70, and 8.51 mg/kg per d, respectively, for 28 consecutive days. For details, see the Materials and Methods section. NMR indicates nuclear magnetic resonance.
1H NMR Chemical Shifts and Assignments for Urinary Metabolites From Rats Treated With Different Doses of Propoxura
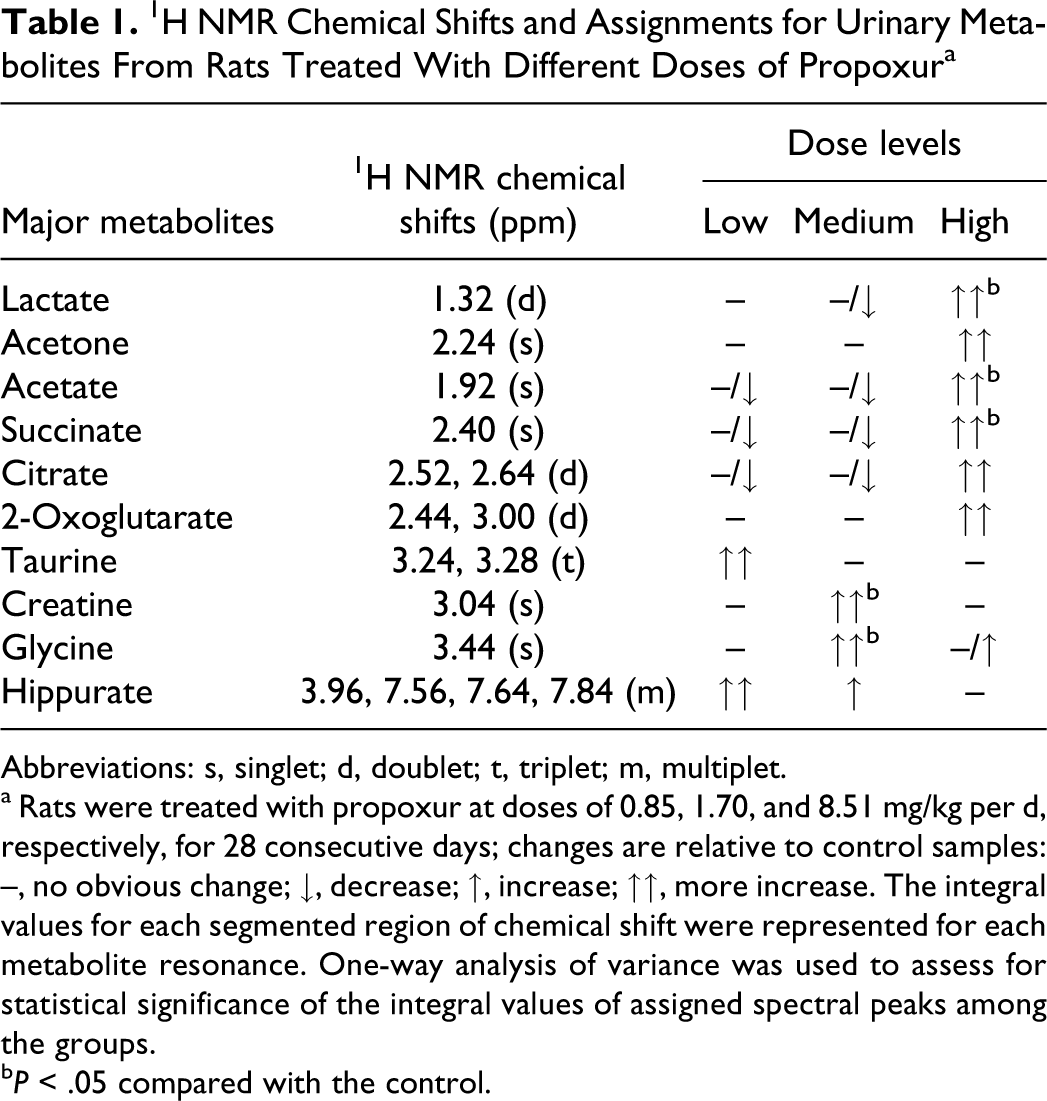
Abbreviations: s, singlet; d, doublet; t, triplet; m, multiplet.
a Rats were treated with propoxur at doses of 0.85, 1.70, and 8.51 mg/kg per d, respectively, for 28 consecutive days; changes are relative to control samples: –, no obvious change; ↓, decrease; ↑, increase; ↑↑, more increase. The integral values for each segmented region of chemical shift were represented for each metabolite resonance. One-way analysis of variance was used to assess for statistical significance of the integral values of assigned spectral peaks among the groups.
b P < .05 compared with the control.
Discussion
Although the acute or subacute effect of propoxur have been well established, 22 much less is concerning on their low-level dose effects, especially the dose level lower than no-observed-adverse-effect level (NOAEL). All 3 dosage levels of propoxur, even the highest dose (8.51 mg/kg per d) of this pesticide investigated in the present study are lower than the NOAEL value (10.0 mg/kg per d), which was established by the World Health Organization/Food and Agriculture Organization (WHO/FAO) Working Groups. 23 However, in our study, hepatotoxicity was observed in the rats when exposed to high dose of propoxur. Hepatotoxicity induced by pesticides especially carbamate/organophoshate is of great concern. It has previously been shown that a significant dose-dependent increase in the relative weight of liver in rats after exposure to propoxur. 18,24
The metabonomic profile analysis of urine sample not only validated the abovementioned histopathological findings but also further indicated the information underlying hepatotoxicity of propoxur. All 3 dose groups of rats exposed to propoxur for 28 days exhibited an altered biochemical composition in the 1H NMR spectra of urine.
Through the loading plots and spectra, we found that the apparent biochemical changes included the elevation of the single intensity of creatine, taurine, lactate, acetate, and other urinary metabolites. The elevation of both urinary taurine and creatine has been found to be a biomarker for liver damage. 25,26 The increased tricarboxylic acid (TCA) cycle intermediates, such as citrate, succinate, and 2-oxoglutarate, indicated that the activity of enzymes of TCA cycle in hepatocytes was influenced by propoxur. It is possible that propoxur affected the energy metabolism in liver.
Acetate is an end product of fatty acid oxidation (degradation of short-chain fatty acid: acetoacetate + acetyl-CoA → acetoacetyl-CoA + acetate).
27
The observed increases in ketone bodies (3-
The observed increase in glucose levels and the concomitant increase in lactate indicated an enhancement in anaerobic metabolism, which possibly indicate that propoxur could cause depletion in liver glycogen stores and stimulates glycolysis. The metabonomic data obtained from the present study provide new important mechanistic clues about the effects of propoxur on liver metabolism and energy utilization, which may be important for understanding the pathogenesis of liver injury.
Previous studies validated that 1H NMR-based metabonomics is much more sensitive than histopathology and clinical blood chemistry in recognizing early events of liver toxicity. 29 In this study, comparison of NMR-PR data with histopathological changes in rats suggests that the NMR-PR analysis is able to detect the biomarker which could predict hepatotoxicity in rats exposed to even lower dose pesticide although impairment of liver could only be observed in the rats of high-dose group.
In conclusion, the present study investigated toxic effects of propoxur at doses below the NOAEL. The results clearly showed that propoxur can cause significant changes in the urine metabolites of rats and induce liver toxicity. These results also indicated that propoxur could inhibit liver function through altering the energy and lipid metabolism in rats. Taken together, the analysis of metabonomic profiling based on 1H NMR is a useful method of in vivo assay for pesticide toxicity at low exposure level.
Footnotes
The author(s) declared no potential conflicts of interest with respect to the research, authorship, and/or publication of this article.
The author(s) disclosed receipt of the following financial support for the research, authorship and/or publication of this article: supported by the CAS Innovation Program (No. KZCX2-EW-404); the SKLECE program (KF2010-16); and the NSFC program (No. 31071919).