
Abstract
Male Sprague-Dawley rats were exposed to 1,2,4-tribromobenzene (TBB) by gavage for 5 days, 2, 4, and 13 weeks at 0, 2.5, 5, 10, 25, or 75 mg/kg per d. There were no TBB exposure-related clinical signs of toxicity or changes in body weight. Liver weight increases were dose and exposure time related and statistically significant at ≥10 mg/kg per d. Incidence and severity of centrilobular cytoplasmic alteration and hepatocyte hypertrophy were dose and time related. The 75 mg/kg per d group had minimally increased mitoses within hepatocytes (5 days only). Hepatocyte vacuolation was observed (13 weeks) and was considered TBB exposure related at ≥25 mg/kg per d. Concentrations of blood TBB increased linearly with dose and at 13 weeks, ranged from 0.5 to 17 µg/mL (2.5-75 mg/kg per d). In conclusion, rats administered TBB doses of 10-75 mg/kg per d for 13 weeks had mild liver effects. A no observed adverse effect level of 5 mg/kg per d was selected based on the statistically significant incidence of hepatocyte hypertrophy at doses ≥10 mg/kg per d.
Introduction
1,2,4-Tribromobenzene (TBB; CAS no 615-54-3) is part of a group of bromobenzenes that are used primarily as intermediates in the manufacture of organic chemicals including pharmaceuticals, pesticides, and flame retardants for polymeric materials. TBB is listed in the US Environmental Protection Agency’s Integrated Risk Information System (IRIS) 1 database with a chronic oral reference dose (RfD) of 0.005 mg/kg per d. The critical noncarcinogenic effect used for the point of departure in calculating the RfD was increased liver-to-body weight ratio and hepatic microsomal enzyme induction based on the results of a 90-day oral gavage toxicity study in rats. 2 There are only a few studies describing toxicity or metabolism of TBB. In the rat, Carlson and colleagues have shown the induction of a number of enzymes following exposure to TBB, including cytochrome P450, nicotinamide adenine dinucleotide phosphate-oxidase (NADPH) cytochrome c reductase, and arylesterase 2 –4 . In mice, levels of liver glutathione (GSH) decreased, while serum alanine aminotransferase (ALT) and serum γ-glutamyltransferase (GGT) increased following acute exposure of TBB. 5 Acute doses of TBB also produced coagulative or hemorrhagic necrosis in the liver centrilobular zone of mice. 5 Hepatotoxicity of TBB is frequently evaluated with other bromobenzenes. 6 Szymanska 5 observed that the acute toxicity of bromobenzenes decreased with an increase in the number of bromine atoms in the molecule; perhaps due, in part, to the increase of lipophilicity and molecule size.
The objective of this study was to focus on liver toxicity associated with TBB exposure and characterize both the dose-response and time course relationships. The choice of liver toxicity was due to its selection as the critical effect in the noncancer IRIS risk assessment. Five doses of TBB and 4 time points were selected to assess liver toxicity in male Sprague-Dawley (SD) rats. End points evaluated included clinical observations, body weights, liver weights, serum chemistry, gross pathology, and liver histopathology. In addition, blood samples collected at necropsy were analyzed for TBB.
Materials and Methods
Test Materials
1,2,4-Tribromobenzene (CAS no 615-54-3), 95% purity, was obtained from International Laboratories USA (San Bruno, California; Catalog no 1617321). Corn oil (CAS no 8001-30-7) was obtained from VWR Scientific (Radnor, Pennsylvania; Catalog no 700000-134). Both the test materials were stored at room temperature until use. The TBB purity was verified by the analysis of the neat compound dissolved in hexane using gas chromatography with flame ionization detection (GC/FID). Compound purity was calculated to be >97% TBB. Qualitative identification of impurity peaks was conducted through the analysis of a dilute stock solution of TBB in hexane using an Agilent 6980 GC coupled to an Agilent 5973 MS. Using this procedure, 4 impurities (2 isomers of tri-bromobenzene and 2 isomers of tetra-bromobenzene) were identified.
Study Design, Animals, and Animal Husbandry
In total, 245 male SD (Rat/Crl: CD(SD)) rats of 4- to 5-week old from Charles River Laboratories (Raleigh, North Carolina) were used in this study (Table 1). An additional 1 or 2 rats were assigned to the control group per time point to assure a group size of at least 10 for evaluation of biological end points. Upon arrival, rats were acclimated to housing and animal room environment for 12 to 14 days. Rats were weighed and randomized using Provantis 8 (Provantis, Conshohocken, Pennsylvania) to ensure mean body weight in each treatment group was approximately the same. Animals were ear tagged and housed, 2 or less rats per cage in shoebox style cages separated by treatment group. Alpha-Dri cellulose bedding (Shepard Specialty Papers, Kalamazoo, Michigan) was used. Animals had access to reverse osmosis water (Hydro Systems, Durham, North Carolina) and pellet NIH-07 certified feed (Zeigler Brothers, Gardners, Pennsylvania) ad libitum. The animal room was kept within the standard temperature and humidity parameters (64°F-79°F with 30%-70% relative humidity) and standard light cycle (7:00-19:00 hours).
Study Design Showing Number of Male SD Rats Assigned Per TBB Dose Group and Time Point
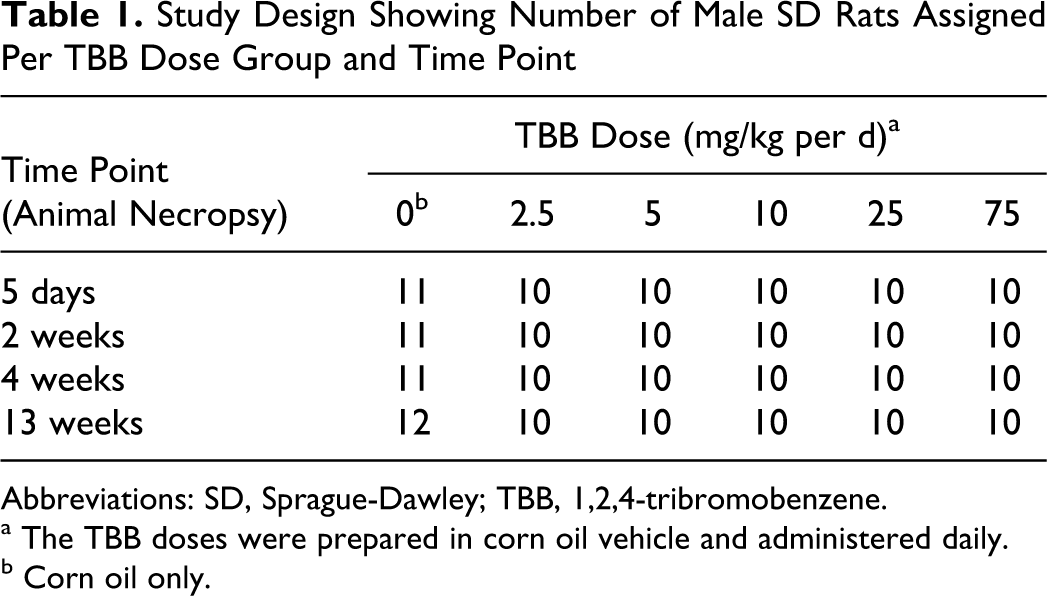
Abbreviations: SD, Sprague-Dawley; TBB, 1,2,4-tribromobenzene.
a The TBB doses were prepared in corn oil vehicle and administered daily.
b Corn oil only.
Preparation and Administration of TBB
Doses of TBB selected for study were 0, 2.5, 5, 10, 25, and 75 mg/kg per d. Dose selections matched those of Carlson and Tardiff 2 and extended beyond (25 and 75 mg/kg per d), since overt liver toxicity was not observed in their study. Using the Carlson and Tardiff 2 results, IRIS 1 selected 10 mg/kg per d as the lowest observed adverse effect level (LOAEL) and 5 mg/kg per d as the no observed adverse effect level (NOAEL) on the basis of increased liver-to-body weight ratio and hepatic microsomal enzyme induction.
Dosing solutions of TBB were prepared in corn oil and administered by oral gavage at a volume of 5 mL/kg body weight. Dosing solutions were prepared weekly and submitted for analysis on the same day they were prepared. Upon receipt, dosing solutions were diluted in triplicate with a sufficient amount of nanograde hexane (Mallinckrodt, St Louis, Missouri) to allow the theoretical dose concentrations to fall within a freshly prepared calibration curve sample. The TBB calibration curve samples were prepared in corn oil and diluted to a final concentration range of 15 to 200 µg/mL with hexane. Samples and standards were analyzed by GC/FID using a 60 m × 320 µm × 0.25 µm Restek Rtx-1 column (Restek, Bellefonte, Pennsylvania) and helium as the carrier gas. Analysis was carried out in split mode (5:1) with a total flow rate of 11.8 mL/min and an injector temperature of 280°C. The GC temperature gradient used was as follows: (1) initial temperature was held at 150°C for 2 minutes; (2) following the 2-minute hold, the temperature was ramped up at 30°C/min until the final temperature of 300°C was obtained; (3) the final temperature was held for 2 minutes for a total analysis time of 9 minutes. Chromatograms were manually integrated and dosing solution concentrations were calculated through the use of the generated calibration curves and dilution factors.
Dosing solution stability for TBB was conducted at 2 concentrations, 0.5 and 15 mg/mL in corn oil, and under 3 different environmental conditions. Aliquots of the prepared doses were stored at (1) room temperature; (2) room temperature and covered in aluminum foil; or (3) 4°C and covered in aluminum foil. Subsamples of the aliquots were analyzed by GC/FID following dilution with hexane (final concentration of 20 and 150 µg/mL after dilution) and quantified through comparison with a freshly prepared calibration curve sample (described above). Sample analysis was conducted every week for a total of 3 weeks (4 total analyses including time 0). Following completion of the stability studies, it was observed that there was no significant difference between any of the storage conditions and that the dosing solution concentrations remained within ±10% of the original time 0 concentration.
The mean ± standard deviation of the weekly dosing solution preparations were 0.50 ± 0.05, 0.99 ± 0.07, 2.00 ± 0.09, 5.22 ± 0.24, and 15.5 ± 0.7 mg TBB/mL corn oil for target concentrations of 0.5, 1.0, 2.0, 5.0, and 15 mg TBB/mL corn oil, respectively. Animals were orally gavaged with 5 mL of dosing solution per kilogram body weight resulting in weekly mean analytical doses of 2.5, 5.0, 10.0, 26.1, and 77.5 mg TBB/kg body weight. Control animals received 5 mL/kg body weight corn oil vehicle only. Gavage exposure occurred in the morning, 7 d/wk, for the selected time period (Table 1).
Mortality Checks, Clinical Observations, Body Weights, and Organ Weights
Animals were checked daily for clinical signs of toxicity, morbidity, or death. Body weights were measured daily just before gavage dosing and prior to scheduled necropsy. At necropsy, the liver was removed and weighed. Clinical observations, body weights, and organ weights were recorded in Provantis 8.
Necropsy, Serum Clinical Chemistry, Blood TBB Analysis, and Tissue Histopathology
Animal necropsies occurred on scheduled days (Table 1) within a few hours following the administration of TBB (or corn oil for controls). Animals were weighed and anesthetized with a lethal intraperitoneal injection of sodium pentobarbital. A cardiac puncture was performed to collect blood samples, and the animal was then exsanguinated via transection of the abdominal aorta. Blood samples were placed in a serum separator tube (gel barrier) and centrifuged for clinical chemistry analysis. The following analytes were measured in the serum within a few hours of collection: aspartate aminotransferase (AST), ALT, alkaline phosphatase (ALP), bilirubin (total), and lactate dehydrogenase (LDH). Reagent sets for the serum analytes and quality control materials including standards were obtained from Pointe Scientific, Inc (Canton, Michigan). Instructions supplied with the reagent sets were followed. A Roche COBAS FARA II chemistry analyzer was used for the analysis of serum samples. The COBAS operator’s manual and our laboratory’s standard operating procedure were followed for conducting analyte analyses using the COBAS analyzer.
Another aliquot of at least 0.5 mL of blood was collected from at least 5 animals per dose per time point (animals selected randomly), placed in an anticoagulated tube (EDTA), and stored in a freezer (−80°C). These samples were analyzed for TBB concentration using GC with electron capture detection. Aliquots (250 µL) of thawed blood samples were diluted with 250 µL of saturated sodium chloride solution. Diluted samples were then extracted through the addition of 500 µL of hexane. Samples were briefly vortexed, placed on a sample rotator for 30 minutes at room temperature, and allowed to sit for 5 minutes prior to centrifugation at 8000g for 5 minutes. The top hexane layer was removed and transferred to a GC sample vial for analysis. Calibration curve samples were prepared by spiking whole blood with known amounts of TBB to a range of 0.28 to 18.68 µg/mL. The limit of quantitation for TBB was below 0.1 µg/mL blood. Samples and standards were analyzed on a 30 m × 320 µm × 0.25 µm Restek Rtx-1 column using helium as a carrier gas. Instrumental analysis was carried out in splitless mode with a total flow rate of 8.5 mL/min and an injector temperature of 250°C. The GC temperature gradient used was as follows: (1) initial temperature was held at 150°C for 1 minute; (2) following the 1 minute hold, the temperature was ramped up at 25°C/min until the final temperature of 300°C was obtained; (3) the final temperature was held for 4 minutes for a total analysis time of 11 minutes. Chromatograms were manually integrated and dosing solution concentrations were calculated through the use of the generated calibration curves and dilution factors.
Following gross examination for abnormalities, a slice from 3 of 4 liver lobes (median, right, and left) was placed in a labeled cassette. The cassette was placed into a 10% neutral buffered formalin cup for approximately 48 hours. The cassette was then transferred to a cup containing 70% ethanol followed by paraffin embedding. Liver-embedded cross-sections (5 μm) were stained with hematoxylin and eosin for microscopic evaluation by a board-certified pathologist. Histopathology observations were ranked based on the following severity score: 1 = minimal, 2 = slight/mild, 3 = moderate, 4 = moderately severe, 5 = severe/high. An average severity score was calculated by totaling the severity scores for an observation at a specified exposure site for an exposure cohort and divided by the total number of animals affected.
Statistical Analysis
Body weight and organ weight data were analyzed using the default statistical method of the Provantis software system (NT2000 versions 8.2.0.1 or 8.2.0.6; Instem, Coshohoken, Pennsylvania) that was used to capture the data. Briefly, the system utilizes a Decision Tree to determine the “best” data transformation (if any) to perform, whether parametric or nonparametric methods are indicated, the presence of a treatment effect, and pairwise comparisons between control and test groups. For example, a log or rank transformation was used, if necessary. Homogeneity of variances was assessed (eg, Bartlett test). A one-way analysis of variance (ANOVA), Williams and Shirley Trend test, or nonparametric ANOVA would then be performed, followed by a Dunnett test or modified Steel test. Serum chemistry data were analyzed using JMP 9.0.0 software (SAS Institute, Inc, Cary, North Carolina). A goodness of fit test (Shapiro-Wilk W) and homogeneity of variances test (Levene) were conducted. If pretest assumptions were met, a one-way ANOVA was used and, if significant, TBB-exposed groups were compared with the control group using Dunnett test. For data sets of unequal variances, a Welch ANOVA followed by Steel test was used. For incidence data (histopathology), a Fisher exact test (1-tailed) was done comparing each TBB dose group with the corresponding control group and applying the Bonferroni correction to P values. A result of P < 0.05 was considered significant.
Results
Clinical Observations and Body Weights
There were no TBB exposure-related clinical signs of toxicity during the study. Mean body weights were not statistically significantly different between the control and TBB exposure groups throughout the study. For example, the mean ± standard deviation of body weights for control versus high dose (75 mg/kg per d) animals at each scheduled necropsy were 303 ± 18 g versus 307 ± 23 g (5 days), 355 ± 33 g versus 344 ± 44 g (2 weeks), 391 ± 57 g versus 413 ± 17 g (4 weeks), and 529 ± 66 g versus 511 ± 65 g (13 weeks). Similar results were observed for all other TBB dose groups. Individual animal data are provided as supplementary material (Supplement Table 1).
TBB in Blood
Blood samples for TBB analysis were collected approximately 2 hours postdosing at each time point. Concentrations of blood TBB increased linearly with dose. For example, at 13 weeks, mean concentrations of TBB blood ranged from 0.5 to 17 µg/mL for TBB dose groups of 2.5 to 75 mg/kg per day, respectively (Table 2). The concentrations of TBB blood also increased with exposure duration in all dose groups. For example, concentrations of blood TBB following 2 weeks versus following 13 weeks exposure increased 20% to 51% among the 5 TBB dose groups (Table 2).
Concentrations of Blood TBB (µg/mL) in Male SD Rats Following 5 Days, 2, 4, and 13 Weeks of Daily Exposure of TBB by Oral Gavage
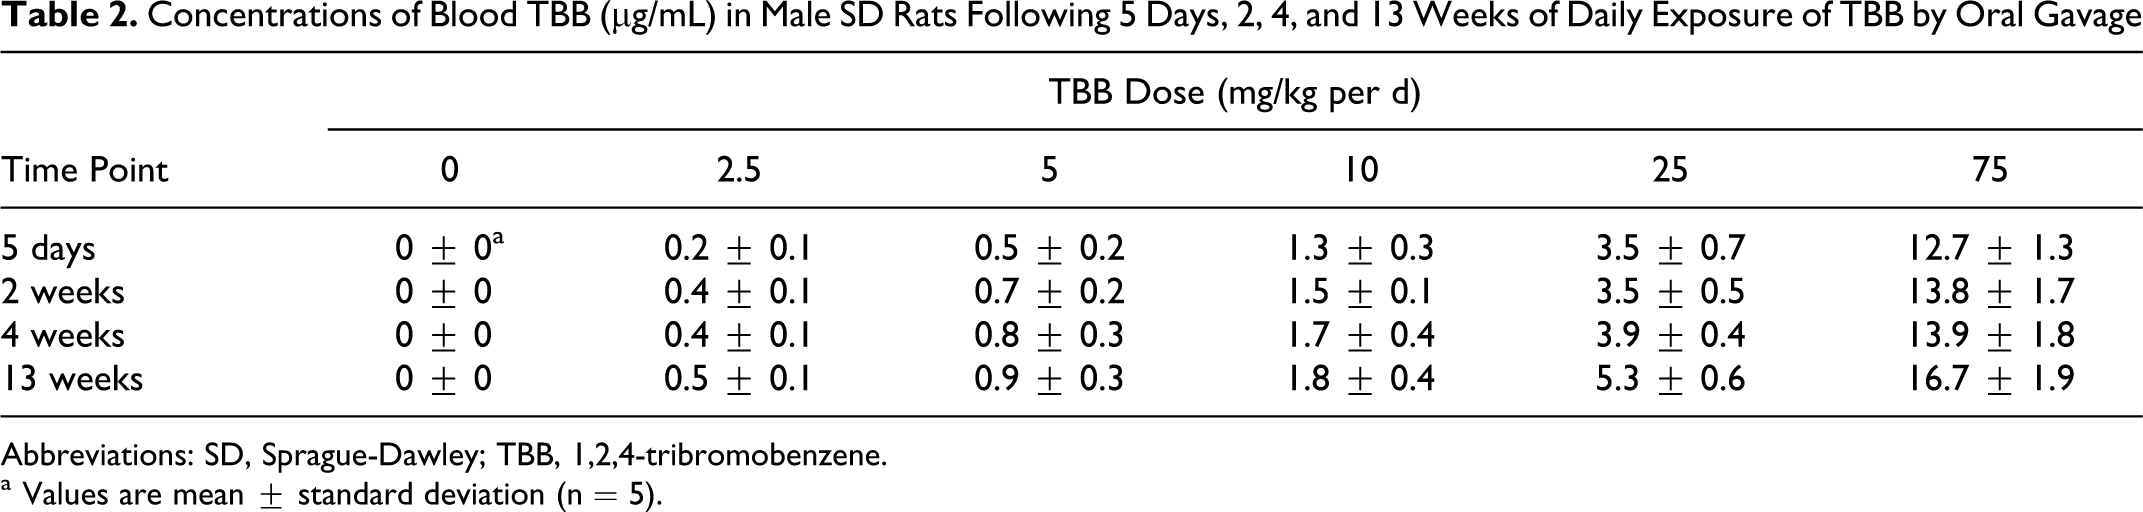
Abbreviations: SD, Sprague-Dawley; TBB, 1,2,4-tribromobenzene.
a Values are mean ± standard deviation (n = 5).
Serum Chemistry
Total bilirubin levels were significantly increased in the 25 and 75 mg/kg per d groups following 5 days exposure, but this finding was not observed at the 2-, 4-, or 13-week time points (data not shown). There were no TBB exposure-related changes in AST, ALT, ALP, and LDH throughout the study.
Organ Weights
Statistically significant increases in absolute and relative mean liver weights were observed in rats exposed to TBB at doses of 10 mg/kg per d and higher (Table 3). Liver weight increases were both dose and exposure time dependent. For example, at 13 weeks, the mean relative liver weights, expressed as percentage of control, were 104%, 108%, 121%, 134%, and 158% for the 2.5, 5, 10, 25, and 75 mg/kg per d groups, respectively. Statistical significance (P < 0.05) was observed in the 10, 25, and 75 mg/kg per d groups (Table 3). Mean liver weights were significantly increased in the 25 and 75 mg/kg per d groups as early as 5 days exposure, but significant increases in liver weights were not observed in the 10-mg/kg per d group until 2 weeks of exposure. Furthermore, the magnitude of the liver weight gains (compared with respective control values) increased with exposure duration and was of the greatest magnitude following 13 weeks of TBB exposure for the 10, 25, and 75 mg/kg per d groups (Table 3). Individual animal data are provided as supplementary material (Supplement Table 1).
Absolute and Relative (to Body Weight) Liver Weights of Male SD Rats Following 5 Days, 2, 4, and 13 Weeks of Daily Exposure of TBB by Oral Gavage
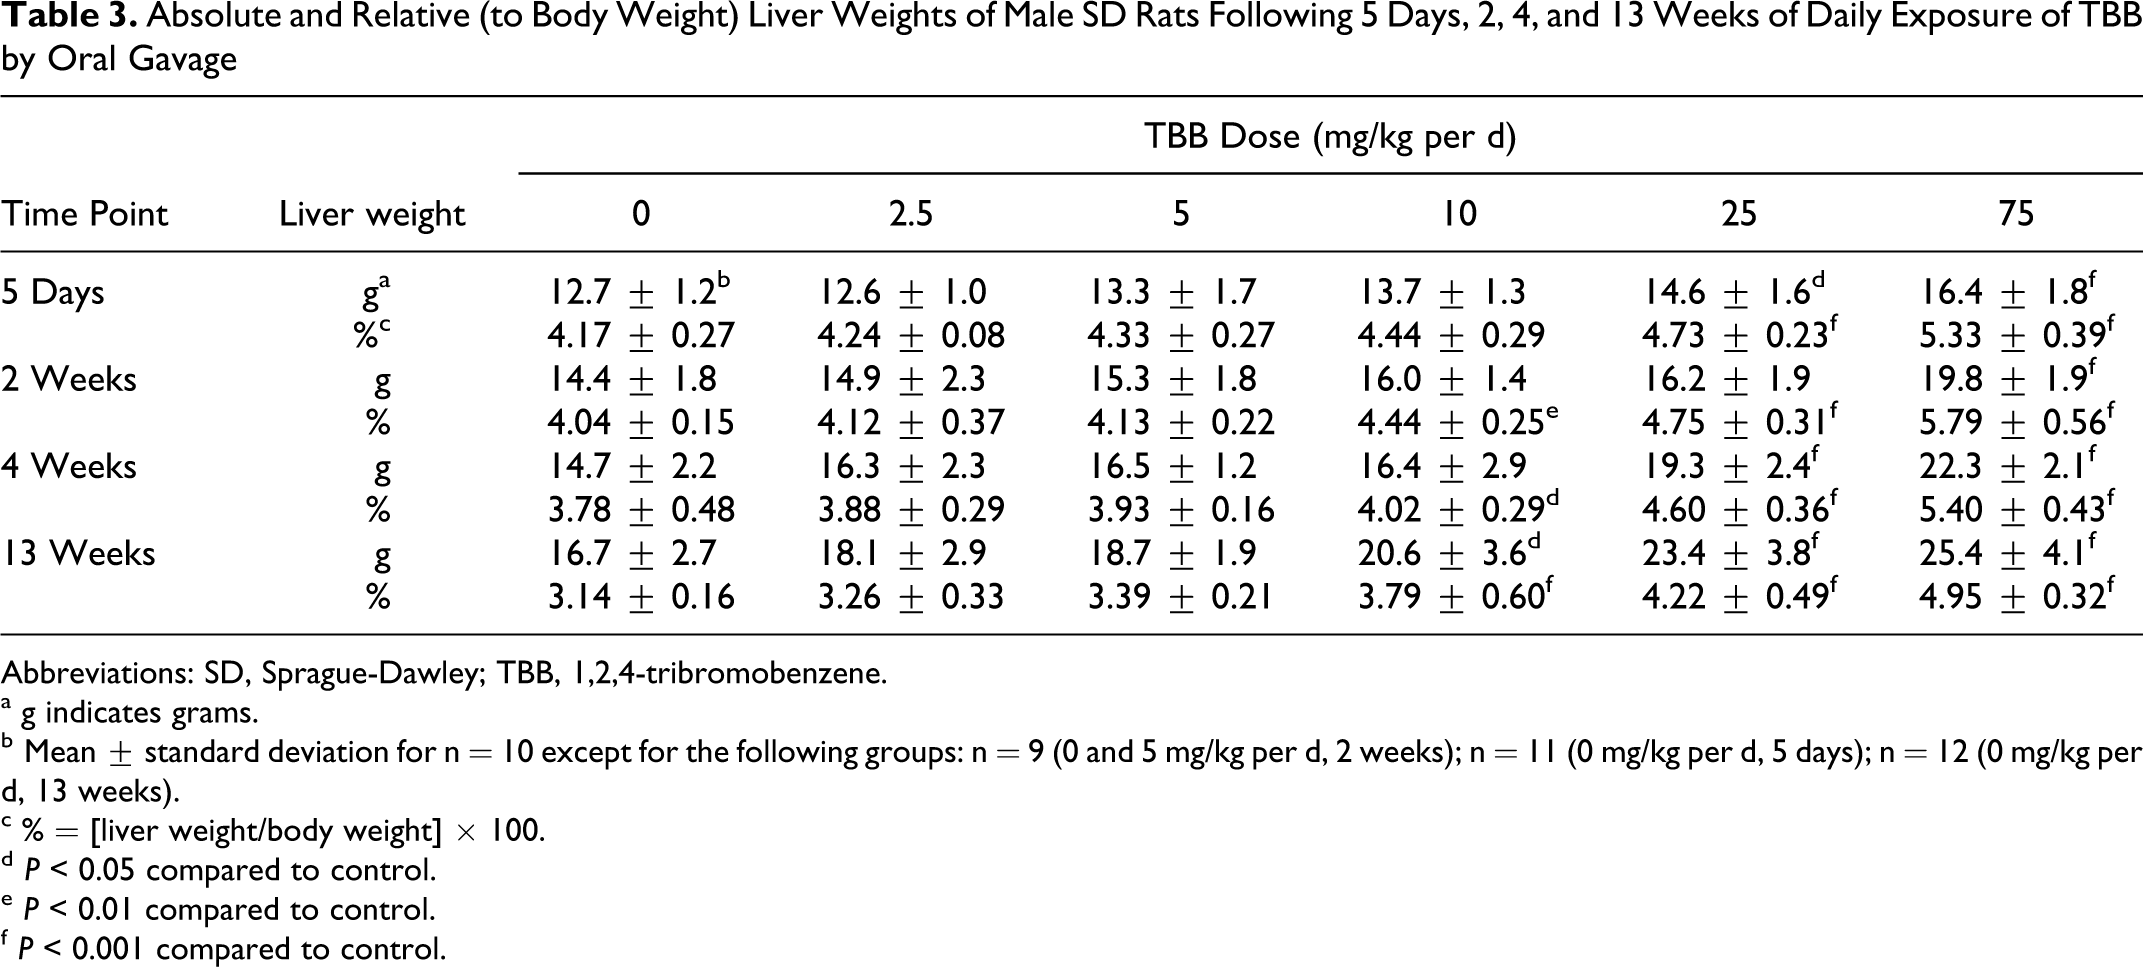
Abbreviations: SD, Sprague-Dawley; TBB, 1,2,4-tribromobenzene.
a g indicates grams.
b Mean ± standard deviation for n = 10 except for the following groups: n = 9 (0 and 5 mg/kg per d, 2 weeks); n = 11 (0 mg/kg per d, 5 days); n = 12 (0 mg/kg per d, 13 weeks).
c % = [liver weight/body weight] × 100.
d P < 0.05 compared to control.
e P < 0.01 compared to control.
f P < 0.001 compared to control.
Histopathology
At necropsy, occasional gross observations were noted in the livers (e.g., prominent centrilobular patterns or mottled lobes) of a few animals, but there was no consistent TBB-related finding. There were TBB-related microscopic observations in the liver. Table 4 has incidence and severity results for centrilobular cytoplasmic alteration and hepatocyte hypertrophy. Centrilobular cytoplasmic alteration was characterized by tinctorial changes in the cytoplasm of hepatocytes around the central veins. These cells sometimes had a glassy appearance and prominence of intracytoplasmic basophilic accumulations interpreted as cytoplasmic organelles (endoplasmic reticulum). Centrilobular cytoplasmic alteration and hepatocyte hypertrophy (Figure 1A and 1B) were observed at all time points, but the number of dose groups affected and the number of affected animals within each group changed with time (Table 4). Both incidence and severity of these lesions were clearly related to dose and time. An additional observation occurring in rats of the highest TBB dose (75 mg/kg per d) at the 5-day time point only was the presence of minimal increased mitoses within hepatocytes (incidence was 6 of 10). Hepatocyte vacuolation was observed in rats of all TBB dose groups, including control, at the 13-week necropsy, but occurred at a higher incidence and mean severity in TBB dose groups ≥25 mg/kg per d. The vacuolation was predominantly in centrilobular to midzonal regions and comprises both microvesicular cytoplasmic change as well as single large vacuoles (macrovesicular; Figure 1B). The pattern of vacuolation was not consistent in all lobes of animals.
Incidence and Mean Severity of Select Histopathologic Changes in the Liver Hepatocyte of Male SD Rats Following 5 Days, 2, 4, and 13 Weeks of Daily Exposure of TBB by Oral Gavage
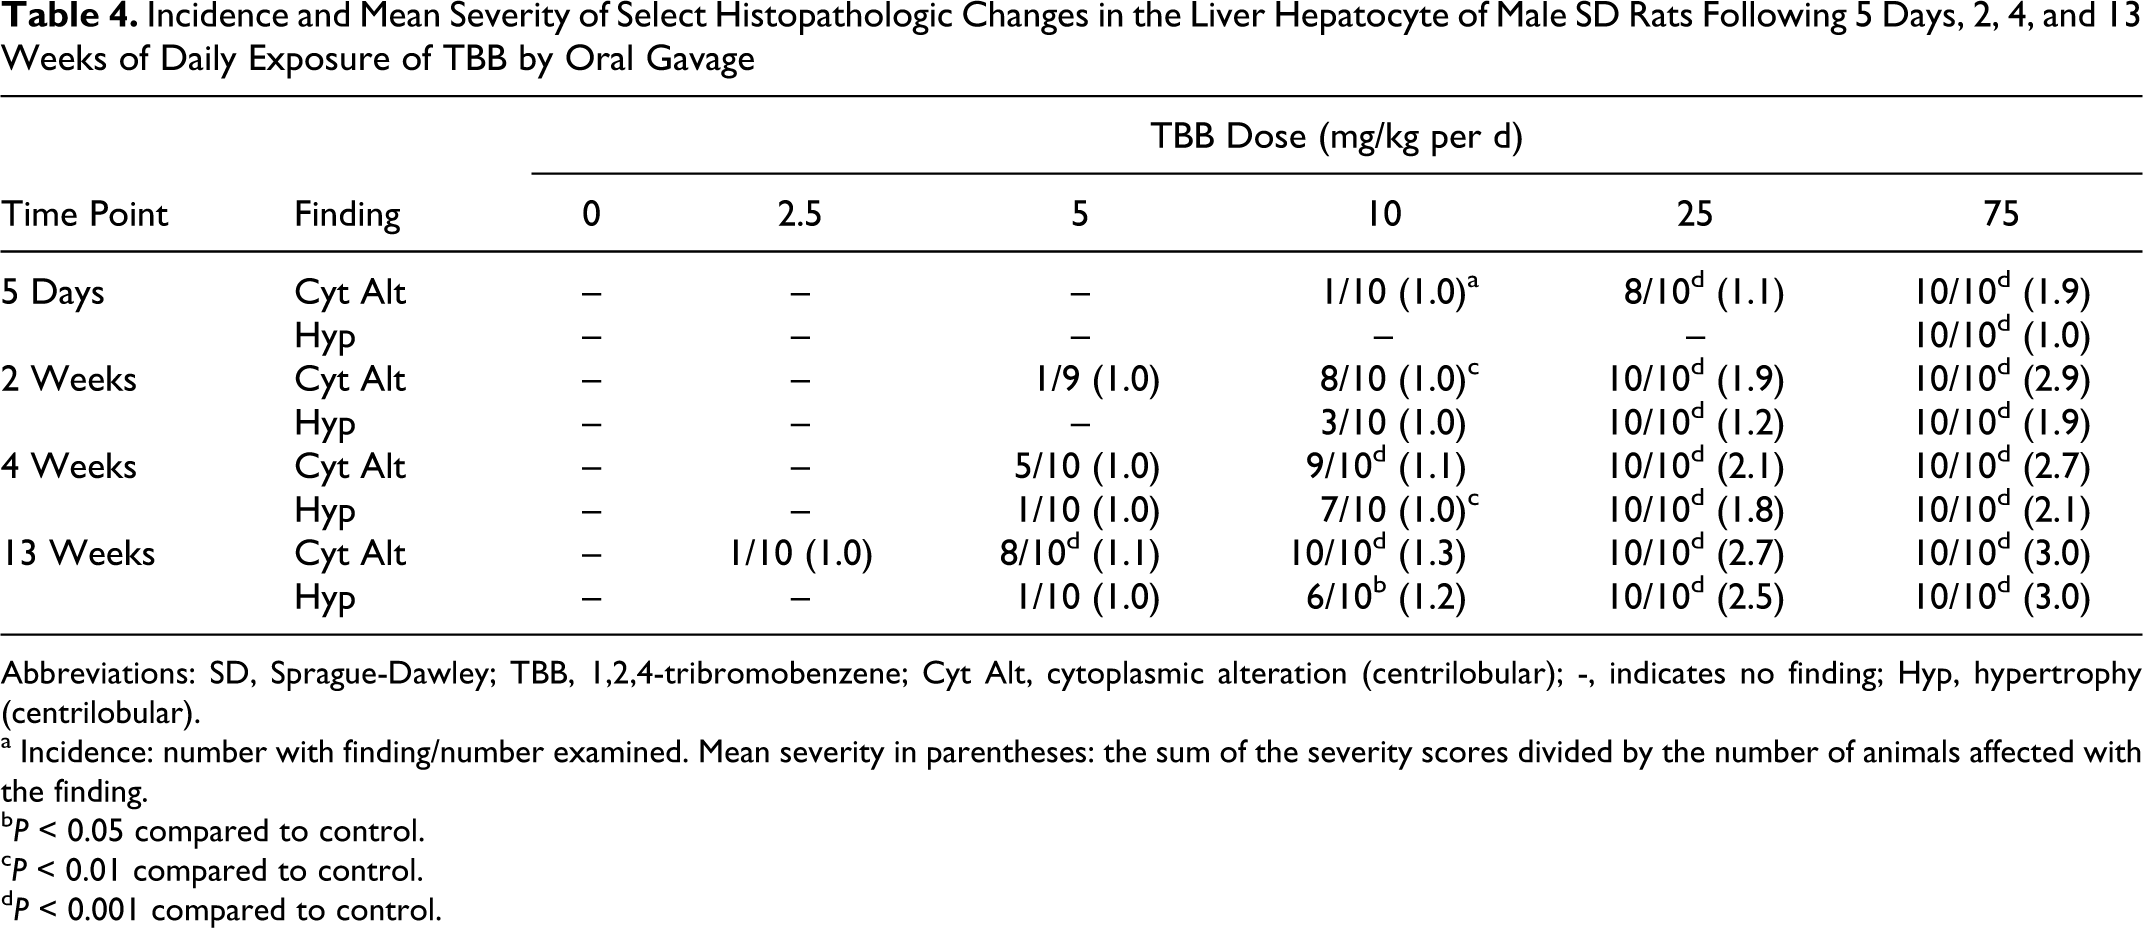
Abbreviations: SD, Sprague-Dawley; TBB, 1,2,4-tribromobenzene; Cyt Alt, cytoplasmic alteration (centrilobular); -, indicates no finding; Hyp, hypertrophy (centrilobular).
a Incidence: number with finding/number examined. Mean severity in parentheses: the sum of the severity scores divided by the number of animals affected with the finding.
b P < 0.05 compared to control.
c P < 0.01 compared to control.
d P < 0.001 compared to control.
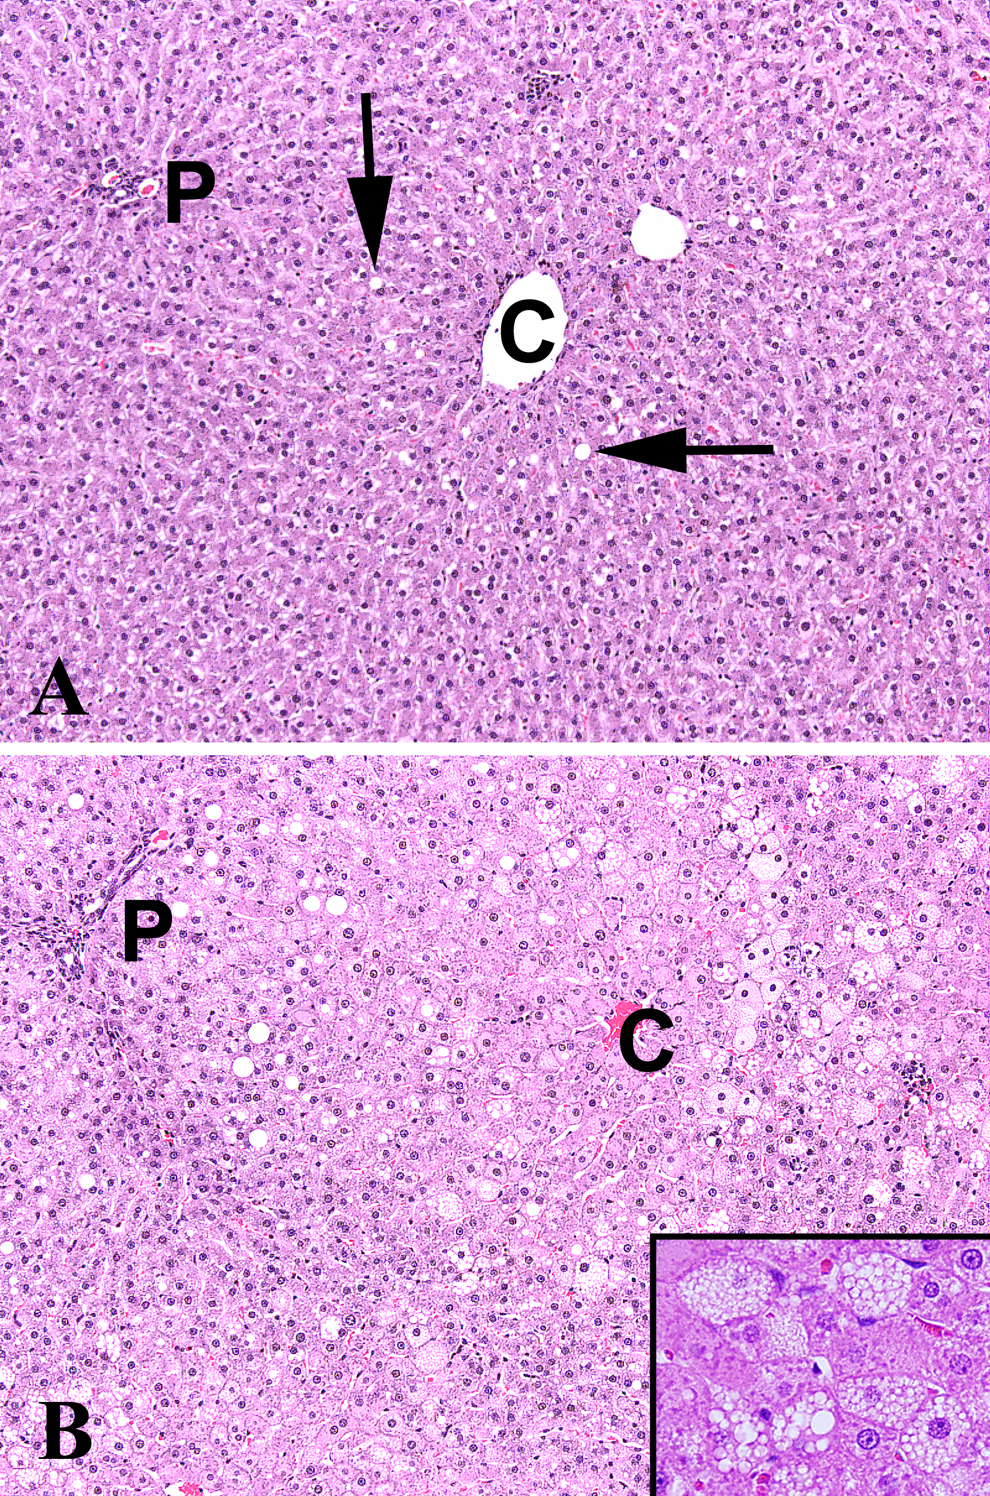
A, Normal liver (0 mg/kg per d TBB following 13 weeks of exposure) showing absence of centrilobular effects. Scattered vacuolated hepatocytes (arrows) are incidental background findings. B, Liver (75 mg/kg per d TBB following 13 weeks of exposure) showing the presence of centrilobular hepatocyte hypertrophy (compare to hepatocyte size in A), cytoplasmic alteration and microvesicular and macrovesicular vacuolation. C indicates central vein; P, portal triad; H&E, hematoxylin and eosin (10×). Inset is ×40.
Discussion
Laboratory animal toxicity studies investigating TBB have been primarily acute (single dose) studies and with an emphasis on enzyme induction. Szymanska 5 observed increases in serum ALT and GGT, reduction in liver GSH, and coagulative or hemorrhagic necrosis in the liver centrilobular zone of mice dosed intraperitoneally at 20% to 88% of the approximate lethal dose of TBB (500-2200 mg/kg, respectively). Carlson and Tardiff 2 dosed male SD rats by gavage for 45 or 90 days at TBB doses of 0, 2.5, 5, or 10 mg/kg per d. In their study, there were no overt signs of toxicity, and body weight gain was similar between the control and the treated animals. A statistically significant increase in liver weight/body weight ratio was observed in the 10-mg/kg per d group only following 45 or 90 days exposure. Increases in the activities of liver cytochrome P-450, NADPH cytochrome c reductase, O-ethyl O-p-nitrophenyl phenylphosphonothioate (EPN) detoxification, azoreducatase, and benzpyrene hydroxylase were observed in TBB-exposed rats. Results of the current study focused on liver toxicity and were, for the most part, in agreement with and extended the findings reported by Carlson and Tardiff. 2 For example, in the current study, statistically significant increases in liver-to-body weight ratio were observed at TBB doses ≥10 mg/kg per d, but not at lower TBB doses (Table 3). Increases in liver/body weight ratio at 10 mg/kg per d were observed following 2 or 4 weeks of TBB exposure in the current study, extending the observation by Carlson and Tardiff 2 of an increase in liver/body weight ratio following 6 weeks (45 days) of TBB exposure. In the current study, minimal alterations in liver morphology were observed at TBB doses of 5 and 10 mg/kg per d (Table 4), but microscopic liver changes were not observed by Carlson and Tardiff 2 in animals receiving the same TBB doses for 45 or 90 days duration. In the current study, histopathologic evaluation of 3 different liver lobes from each animal revealed considerable variation among the lobes with respect to cytoplasmic alteration, hypertrophy, and vacuolation (microvesicular and macrovesicular changes). In all the cases, the histopathologic score assigned to an animal represented the most advanced lesion seen among the various lobes. Liver histopathologic evaluation and scoring details were not described by Carlson and Tardiff. 2 The cytoplasmic alteration and hypertrophy, usually indicative of increased endoplasmic reticulum and protein synthesis, are the typical changes observed with enzyme induction 7,8 and correlate well with the study of Carlson and Tardiff reporting enzyme elevations in all TBB dose groups. 2
Liver histopathology observed in the current study was subclinical with respect to clinical signs, body weight changes, and serum chemistry alterations. The fact that ALT was not elevated in any of the current dose groups is not surprising since ALT is a marker of hepatocellular permeability and none of the histopathological changes seen were severe enough to indicate a sublethal injury. Necrosis, the most obvious cause of ALT elevations, was not observed in this study. The elevated total bilirubin observed transiently at 5 days may be a result of passive obstruction of bile flow (cholestasis) secondary to hepatocyte swelling with adaptation occurring at the later time points. Additionally, the hepatocyte vacuolation that occurred at 13 weeks at 75 mg/kg per d indicates perturbation of lipid metabolism, a common sequel to hepatic injury. Lipid accumulation could have a number of causes although the most probable one is oxidative stress and biotransformation of TBB to electrophilic intermediates, conjugation with GSH, and ultimately GSH depletion, a mechanism that has been reported with bromobenzene (review by US EPA 9 ), a compound similar to TBB. Furthermore, EPA 9 selected liver cytomegaly (hypertrophy) as the critical effect for derivation of oral and inhalation noncancer reference values for bromobenzene. Liver cytomegaly was viewed as part of a pathological continuum that included inflammation, necrosis, and mineralization. In the current study, the authors considered liver hypertrophy as the critical effect for selecting the LOAEL and NOAEL. Hepatocytic cytoplasmic alteration was not considered an adverse effect since its identity in liver injury remains unclear. Results of statistical analysis of incidence data for liver histopathological changes were used to identify statistically significant differences between TBB exposure and control groups.
In conclusion, male SD rats administered TBB by gavage at doses up to 75 mg/kg per d for up to 13 weeks had mild liver effects manifested as increased liver weights, centrilobular cytoplasmic alteration, hepatocyte hypertrophy, and hepatocyte vacuolation. Both liver weight increase and liver histopathology were dose related and exposure duration dependent. A NOAEL of 5 mg/kg per d was selected based on the statistically significant incidence of hypertrophy in the livers of rats at TBB doses ≥10 mg/kg per d. The NOAEL of 5 mg/kg per d is in agreement with the selections by IRIS 1 of 10 mg/kg per d as a LOAEL and 5 mg/kg per d as a NOAEL on the basis of increased liver-to-body weight ratio and hepatic microsomal enzyme induction.
Footnotes
Acknowledgments
We would like to thank Paul Ross, Nigel Edgerton, and other members of The Hamner Institutes’ laboratory animal care and necropsy staffs and EPL’s histology staff for their technical support.
The author(s) declare no conflicts of interest with respect to the authorship and/or publication of this article.
The author(s) disclosed receipt of the following financial support for the research, authorship, and/or publication of this article: The study was funded by the American Chemistry Council’s Long-Range Research Initiative.