
Abstract
Male F344 rats were exposed to hydrazobenzene (HZB) by dietary feed at concentrations of 0, 5, 20, 80, 200, or 300 ppm for 5 days, 2 weeks, 4 weeks, or 13 weeks duration. End points evaluated included clinical observations, body weights, liver weights, serum chemistry, blood HZB, gross pathology, and liver histopathology. There were no HZB exposure-related clinical signs of toxicity. During study weeks 8 through 13, body weight means in rats of the 300 ppm group were 6% lower compared to control rat means. Serum alkaline phosphatase concentrations were decreased in rats of the 300 ppm group at all time points. Relative (to body weight) liver weight increases were observed in rats of the 200 and 300 ppm groups following 5 days (300 ppm only), 2 weeks, 4 weeks, and 13 weeks of exposure. Following 13 weeks of exposure, microscopic findings in the liver were observed only in rats of the 200 and 300 ppm groups and consisted of hypertrophy, macrovesiculation, eosinophilic granular cytoplasm, and bile duct duplication. Blood HZB concentrations ranged from 0.002 to 0.006 µg/mL in rats of the 200 or 300 ppm groups. A no observed effect level of 80 ppm (4.80 mg/kg per d) was selected based on the observation of microscopic hepatocyte alterations at ≥200 ppm HZB.
Introduction
Hydrazobenzene (HZB) is a colorless solid that is stable under ambient conditions, very soluble in ethanol, practically insoluble in water, and has a low vapor pressure (4.4 × 10⁻⁴ mm Hg) at ambient conditions. Hydrazobenzene is used primarily as a chemical intermediate in the manufacture of dye intermediates (eg, benzidine) and pharmaceuticals, such as sulfinpyrazone and phenylbutazone. 1 Production of HZB in the United States was at least 450 000 kg in 1977, and US imports were 23 200 kg in 1982, 1 but the current production may be much less due to the cessation of manufacturing benzidine-based dyes in 1988. 2 Routes of potential human exposure to HZB are inhalation, ingestion, and dermal contact, with ingestion being the most likely route currently due to trace amounts (≤10 µg/L) of HZB either in the environment or as a metabolite of drug ingredients.
Human health hazard information of HZB is limited to toxicity studies reported by the National Toxicology Program and a small number of genotoxicity or metabolism studies cited in the scientific literature. The Agency for Toxic Substances and Disease Registry (ATSDR) issued a toxicological profile for HZB (a.k.a. 1,2-diphenylhydrazine) in 1990. 2 Hydrazobenzene is classified reasonably anticipated to be a human carcinogen based on the results of a carcinogenicity study in laboratory animals. 3 Specifically, F344 rats and B6C3F1 mice were fed diets ranging from 40 to 400 ppm HZB for 78 weeks followed by several weeks of postexposure evaluation (17-18 weeks for mice and 28-30 weeks for rats). 4 The incidence of hepatocellular carcinoma was increased in male rats administered 80 or 300 ppm HZB. A no observed adverse effect level (NOAEL) was not achieved in male rats. High-dose male rats also showed increases in tumors of the Zymbal gland, ear canal, and skin of the ear. Female rats had significant increases in mammary adenocarcinomas and neoplastic liver nodules. Female mice, but not male mice, showed an increase in hepatocellular carcinoma. 4 Results of additional carcinogenicity studies with 1,2-diphenylhydrazine in laboratory animals were considered inconclusive by ATSDR 2 due to incomplete details of study designs and histopathology data. Results of in vitro genotoxicity assays using HZB were primarily positive in the presence of an exogenous metabolic activation system, 2 and testicular DNA synthesis was inhibited in mice administered an acute dose of 1,2-diphenylhydrazine (100 mg/kg, intraperitoneally). 5 However, in Drosophila administered HZB by feed or injection, sex-linked recessive lethal mutations were not observed. 6
A metabolism study in rats following acute oral or ip doses of HZB identified the presence of HZB, aniline, and benzidine in the urine. 7 The metabolism of HZB to aniline may result from reductive and hydrolytic pathways of the gastrointestinal microflora. 8 Bolton and Griffiths 9 reported in vitro metabolism of HZB to aniline by rat intestinal microorganisms. The formation of the metabolites aniline and benzidine may contribute to HZB toxicity and carcinogenicity. 2
A reference dose for chronic oral exposure or for chronic inhalation exposure has not been promulgated by the US Environmental Protection Agency’s Integrated Risk Information System (IRIS) 10 due to insufficient data for HZB. An estimate of carcinogenic risk from oral exposure was calculated. The critical dose–response data for estimating carcinogenic risk were the increased incidence of hepatocellular carcinomas in male F344 rats administered dietary feed concentrations of 0 (control), 80, and 300 ppm HZB for 78 weeks (followed by 28-30 weeks’ postexposure observation). The objective of the current study was to focus on liver toxicity associated with oral HZB exposure and characterize both the dose response and time course relationships. It was anticipated that a more thorough characterization of the hepatotoxic effect with dose and exposure time would provide more definitive results to support the selection of a NOAEL and to improve human risk assessment of HZB. The choice of liver toxicity was due to its selection as the critical effect in the IRIS cancer risk assessment. Five concentrations of HZB and 4 time points were selected to assess hepatotoxicity in male F344 rats. End points evaluated included clinical observations, body weights, food consumption, serum chemistry, liver weights, gross pathology, and liver histopathology. In addition, blood samples collected at necropsy were analyzed for HZB. To our knowledge, no acute or subchronic animal toxicity studies have been conducted using HZB with an objective to evaluate potential hepatotoxicity.
Materials and Methods
Test Materials
Hydrazobenzene ([HZB]; CAS No. 122-66-7) was obtained from Sigma-Aldrich (St Louis, Missouri; Product No. 126721). Hydrazobenzene purity was verified by analysis of the test material dissolved in methanol using gas chromatography with flame ionization (GC/FID). Compound purity was calculated to be >99.9% HZB.
Study Design, Animals, and Animal Husbandry
Two hundred and forty-five 4- to 5-week-old male Fisher 344 rats (Rat F344/DuCrl, strain code 002) from Charles River Laboratories (Kingston, New York) were used in this study. Group size was 10 rats per HZB concentration per time point. An additional 1 or 2 rats were assigned to the control group per time point to be used to assure a group size of at least 10 for evaluation of biological end points. Upon arrival, rats were acclimated to housing and animal room environment for 12 to 14 days. Rats were weighed and randomized using Provantis 8 (Provantis, Conshohocken, Pennsylvania) to ensure mean body weight in each treatment group was approximately the same. Animals were ear tagged and housed 2 or less rats per cage in shoe box style cages separated by treatment group. Alpha-dri cellulose bedding (Shepard Specialty Papers, Kalamazoo, Michigan) was used. Animals had access to reverse osmosis water (Hydro Systems, Durham, North Carolina) and NIH-07 certified meal feed (Zeigler Brothers, Gardners, Pennsylvania) ad libitum. The animal room was kept within the standard temperature and relative humidity parameters (64°F-79°F and 30%-70% relative humidity) and standard light cycle (07:00-19:00 hours).
The Hamner Institutes for Health Sciences is fully accredited by the Association for Assessment and Accreditation of Laboratory Animal Care International. Currently acceptable practices of good animal husbandry were followed per National Research Council’s Guide for the Care and Use of Laboratory Animals 11 and were in compliance with all appropriate parts of the Animal Welfare Act regulations. 12,13 In addition, the study design and protocol were approved by The Hamner Institutes’ Institutional Animal Care and Use Committee prior to the initiation of study.
Preparation and Administration of HZB
Hydrazobenzene test material was pulverized using an MM-301 ball grinder (Retsch, Newtown, Pennsylvania) with a Teflon grinding jar and Teflon-coated grinding bearing. The test material was ground with the ball grinder set to 15 Hz for 1.5 minutes, after which a fine powdery consistency was observed. A feed premix was prepared by hand grinding a weighed amount of the pulverized test material into 500 g of rodent meal using a mortar and pestle. The 500 g premix sample was blended with rodent meal using a Patterson-Kelly 3 ft3 twin-shell blender fitted with an intensifier bar until homogeneity was achieved.
Dietary feed concentrations of HZB selected for the study were 0, 5, 20, 80, 200, or 300 ppm. Selection of feed concentrations was based on the concentrations used in National Cancer Institute’s (NCI’s) 2-year dietary feed bioassay for the male F344 rats 4 of 0, 80, or 300 ppm, but extended lower (5 and 20 ppm) to ensure an NOAEL dose group. Feed concentrations did not exceed 300 ppm, since HZB-exposure-related depression of body weights was observed at 300 ppm in the NCI study. In NCI’s 6-week dose-range-finder study, 4 2 of the 5 male rats died when administered 1080 ppm HZB in the diet.
Batches of HZB feed concentrations were prepared approximately every 3 weeks and submitted for analysis on the same day they were prepared. Upon receipt, triplicate aliquots (approximately 1 g each) from each of the top, middle, and bottom locations of the blended feed batch were placed into labeled screw cap glass vials. Five milliliters of ACS grade methanol (Sigma-Aldrich) were added to the aliquots prior to tightly capping and placing the vials in a sample rotator for approximately 1 hour. Samples were allowed to settle for 5 minutes before an aliquot of supernatant was removed and placed in a microcentrifuge tube. Feed sample extracts were then centrifuged at 8000g for 5 minutes at room temperature prior to dilution of the supernatant at 1:20 with methanol. Calibration curves (2.5-450 µg/g prior to 1:20 dilutions) were prepared on the same day as sample analysis by spiking control feed with a freshly prepared stock solution of HZB in methanol. Samples and standards were analyzed by high-performance liquid chromatography (HPLC) with a UV-Vis detector and using a 4.6 × 250 mm Beckman Ultrasphere ODS C18 column with 5 µm particle size (Beckman-Coulter, Brea, California). Analysis was carried out on sample injection sizes of 25 µL at ambient temperature and using a detector wavelength of 254 and 313 nm. The HPLC gradient used was as follows: (1) initial solvent conditions were 70% methanol (organic) and 30% 10 mmol/L ammonium acetate at pH 7 (aqueous) at a total flow rate of 1 mL/min; (2) over the next 5 minutes, the organic phase was ramped linearly to 100% and then held for 5 minutes; (3) over the next 1 minute, the gradient was ramped linearly back to the initial gradient conditions and held for 2 minutes prior to the next analysis. The total analysis time was 13 minutes. Chromatograms were manually integrated and feed concentrations were calculated through the use of the generated calibration curves and dilution factors.
Mixed HZB-feed concentration stability was conducted at 2 concentrations, 5 and 300 ppm, and under 2 different environmental conditions. Samples of prepared feed were stored at either room temperature and covered with aluminum foil or 4°C and covered with aluminum foil. Subsamples of the various storage conditions were analyzed and quantified through comparison to a freshly prepared calibration curve (described above). Sample analysis was conducted every week for a total of 3 weeks. Following completion of the stability studies, it was observed that the concentration of HZB in feed stored in foil at either temperature provided similar results, with final concentrations within ±10% of the original feed concentration (5 or 300 ppm).
The concentration (mean ± standard deviation) of the prepared feed batches were 0 ± 0, 5.8 ± 0.4, 23 ± 1, 88 ± 6, 194 ± 24, and 280 ± 28 ppm of HZB for target concentrations of 0, 5, 20, 80, 200, and 300 ppm, respectively. Mixed HZB feed was provided to animals ad libitum for the selected time period.
Mortality Checks, Clinical Observations, Body Weights, Food Consumption, Administered Dose, and Organ Weights
Animals were checked daily for clinical signs of toxicity, morbidity, or death. Body weights and food consumption were measured daily for the first week and then weekly, including immediately prior to scheduled necropsy. At necropsy, the liver was removed and weighed. Clinical observations, body weights, food consumption, and organ weights were recorded in Provantis 8. The administered dose of HZB was calculated using the mean (relative to body weight) food consumption data and the mean analytical concentration of HZB in the administered diet. Means of weekly measurements were combined. Results were expressed as milligram HZB per kilogram body weight per day.
Necropsy, Serum Chemistry, Blood HZB Analysis, and Tissue Histopathology
Animal necropsies occurred in the morning of the day following scheduled time points. Animals were weighed and anesthetized with a lethal intraperitoneal injection of sodium pentobarbital. A cardiac puncture was performed to collect blood samples, and the animal was then exsanguinated via transection of the abdominal aorta. Blood samples were placed in a serum separator tube (gel barrier) and centrifuged for serum chemistry analysis. The following analytes were measured in the serum within a few hours of collection: aspartate aminotransferase (AST), alanine aminotransferase (ALT), alkaline phosphatase (ALP), bilirubin (total), and lactate dehydrogenase (LDH). Reagent sets for the serum analytes and quality control materials, including standards were obtained from Pointe Scientific, Inc (Canton, Michigan). Instructions supplied with the reagent sets were followed. A Roche COBAS FARA II chemistry analyzer was used for analysis of serum samples. The COBAS operator manual and laboratory standard operating procedures were followed for conducting analyte analyses.
Another aliquot of at least 0.5 mL of blood was collected from at least 5 animals per concentration per time point (animals selected randomly), placed in an anticoagulated tube (EDTA), and stored in a freezer (−80°C). These samples were analyzed for HZB concentration using liquid chromatography with tandem mass spectrometric detection (LC/MS/MS). Aliquots of thawed whole blood samples were mixed 1:1 with Chromasolv plus grade acetonitrile (Sigma-Aldrich). Each sample was spiked with internal standard (Isoxaben) and vortexed for 15 to 20 seconds prior to centrifugation at 8000g for 5 minutes. Sample supernatant was transferred to silinated glass inserts, placed in labeled sample vials, and analyzed using an Applied Biosystems API-3000 mass spectrometer (Life Technologies, Carlsbad, California) coupled to a Perkin Elmer PE-200 HPLC system (Perkin-Elmer, Waltham, Massachusetts). Calibration curve samples were prepared by spiking whole blood with known amounts of HZB to a range of 0.001 to 0.1 µg/mL. The limit of quantitation for the analyte was approximately 0.001 µg/mL in whole blood. Samples and standards were analyzed on a 2.1 × 50 mm Allure C18 column with 5 µm particles (Restek, Bellefonte, Pennsylvania). Instrumental analysis was carried out on injection sizes of 10 µL, with a column temperature of 35°C and a constant HPLC flow rate of 200 µL/min (electrospray flow split of 1:5). The HPLC solvent gradient used was as follows: (1) initial conditions consisted of 50% aqueous (0.1% formic acid) and 50% organic (methanol) phases; (2) following a 1-minute hold on the initial conditions, the organic phase was ramped linearly to 100% over a 3-minute period and then maintained for 2.5 minutes; (3) a return to initial gradient conditions over the span of 1 minute and then maintained for 2 minutes prior to analysis of the next sample. The total analysis time was 9.5 minutes. Ion mass pairs analyzed in the MS were +183.0/+77.0 amu for HZB and +333.2/+165.2 amu for isoxaben.
Following gross examination for abnormalities, a slice from 3 of the 4 liver lobes (median, right, and left) was placed in a labeled cassette. The liver lobes were not evaluated independently to identify or assess interlobe variability but were evaluated together to characterize an overall hepatic effect of HZB exposure. The cassette was placed into a 10% neutral-buffered formalin cup for approximately 48 hours. The cassette was then transferred to a cup containing 70% ethanol followed by paraffin embedding. Liver embedded cross sections (5 μm) were stained with hematoxylin and eosin for microscopic evaluation by a board-certified pathologist. Histopathology observations were ranked based on the following severity score: 1 = minimal, 2 = slight/mild, 3 = moderate, 4 = moderately severe, 5 = severe/high. An average severity score was calculated by totaling the severity scores for an observation at a specified exposure site for an exposure cohort and dividing by the total number of animals affected.
Statistical Analysis
Body weight, food consumption, and organ weight data were analyzed using the Provantis software system (NT2000 versions 8.2.0.1 or 8.2.0.6, Instem, Coshohoken, Pennsylvania) that was used to capture the data. A 1-way analysis of variance (ANOVA) was used and, if significant, it was followed by a Dunnett test to compare HZB concentration groups with the control group. Serum chemistry data were analyzed using JMP 9.0.0 software (SAS Institute, Inc, Cary, North Carolina). A goodness-of-fit test (Shapiro-Wilk, P < .01) and homogeneity of variances test (Levene, P < .05) were conducted. If pretest assumptions were met, a 1-way ANOVA was used and, if significant (P < .05), HZB-exposed groups were compared to the control group using Dunnett test. For data sets of nonnormal distributions or unequal variances, a Welch ANOVA followed by Steel test was used.
Results
Clinical Observations, Body Weights, Food Consumption, Administered Dose, and Blood HZB
There were no HZB-exposure-related clinical signs of toxicity during the study. Mild, but statistically significant decreases were observed in mean body weights of rats of the 300 ppm group compared to controls beginning week 8 of dosing (Table 1). The decreases in mean body weights were attributed to reduced body weight gains and not body weight losses. By study week 13, the mean body weight was 6% lower than control animals. Mean body weights of rats of the 200-ppm group were marginally reduced (2%-3%) compared to controls during the study, but these reductions were not statistically significant (Table 1). Mean body weights were similar between control and HZB-exposure groups of ≤80 ppm throughout the study (Table 1). There were occasional mild decreases in mean food consumption in rats of the 300-ppm group compared to controls (data not shown), but the occurrence was not consistent throughout the 13-week study. The mean administered doses calculated from weekly food consumption (relative to body weight) and analytical diet concentration data were 0.32, 1.26, 4.80, 10.3, and 15.5 mg HZB/kg body weight/d for 5, 20, 80, 200, and 300 ppm HZB diet concentrations, respectively. At necropsy, blood was removed from animals of all concentration groups and time points for HZB analysis. Hydrazobenzene blood concentrations in rats exposed to ≤80 ppm were below the limit of quantitation (approximately 0.001 µg/mL) throughout the study. In rats exposed to 200 or 300 ppm, the mean HZB blood concentrations ranged from 0.002 to 0.006 µg/mL. An exposure concentration or time relationship could not be established at these low levels of detection.
Mean Body Weights (g) in Male F344 Ratsa Following Daily Exposure of HZB by Dietary Feed.
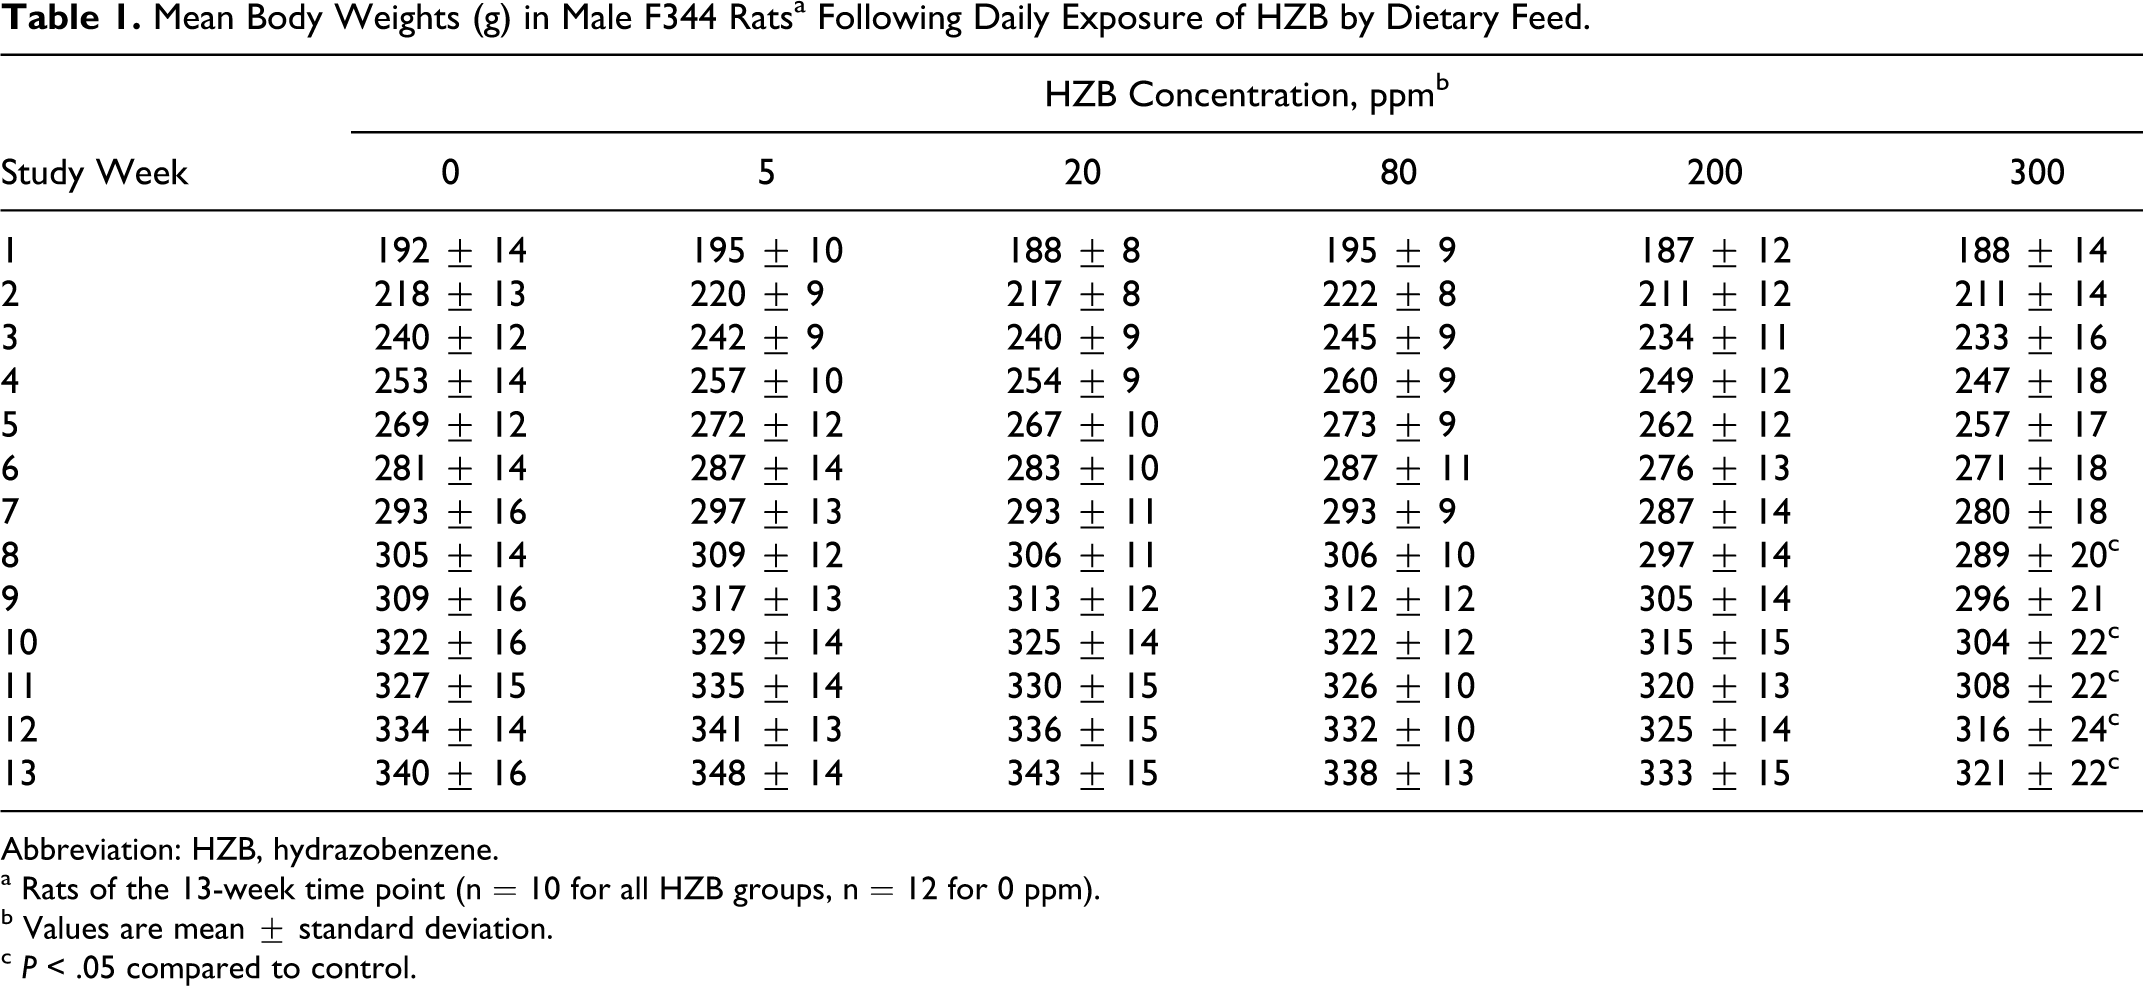
Abbreviation: HZB, hydrazobenzene.
a Rats of the 13-week time point (n = 10 for all HZB groups, n = 12 for 0 ppm).
b Values are mean ± standard deviation.
c P < .05 compared to control.
Serum chemistry
Serum AST, ALT, ALP, LDH, and total bilirubin were measured in rats following necropsy at 5 days, 2 weeks, 4 weeks, and 13 weeks. The only consistent alteration was a statistically significant reduction in mean ALP in rats of the 300 ppm group compared to control values at all time points (Table 2). At 13 weeks, the mean AST was also decreased in the 300-ppm exposure group (Table 2). Statistically significant decreases in mean ALP were also observed in rats of the 200-ppm group at 2 weeks, and in the 200-, 80-, and 5-ppm groups following 13 weeks of exposure (Table 2).
Select Serum Chemistry Concentrations (IU/L) of Male F344 Rats Following Daily Exposure of HZB by Dietary Feed.
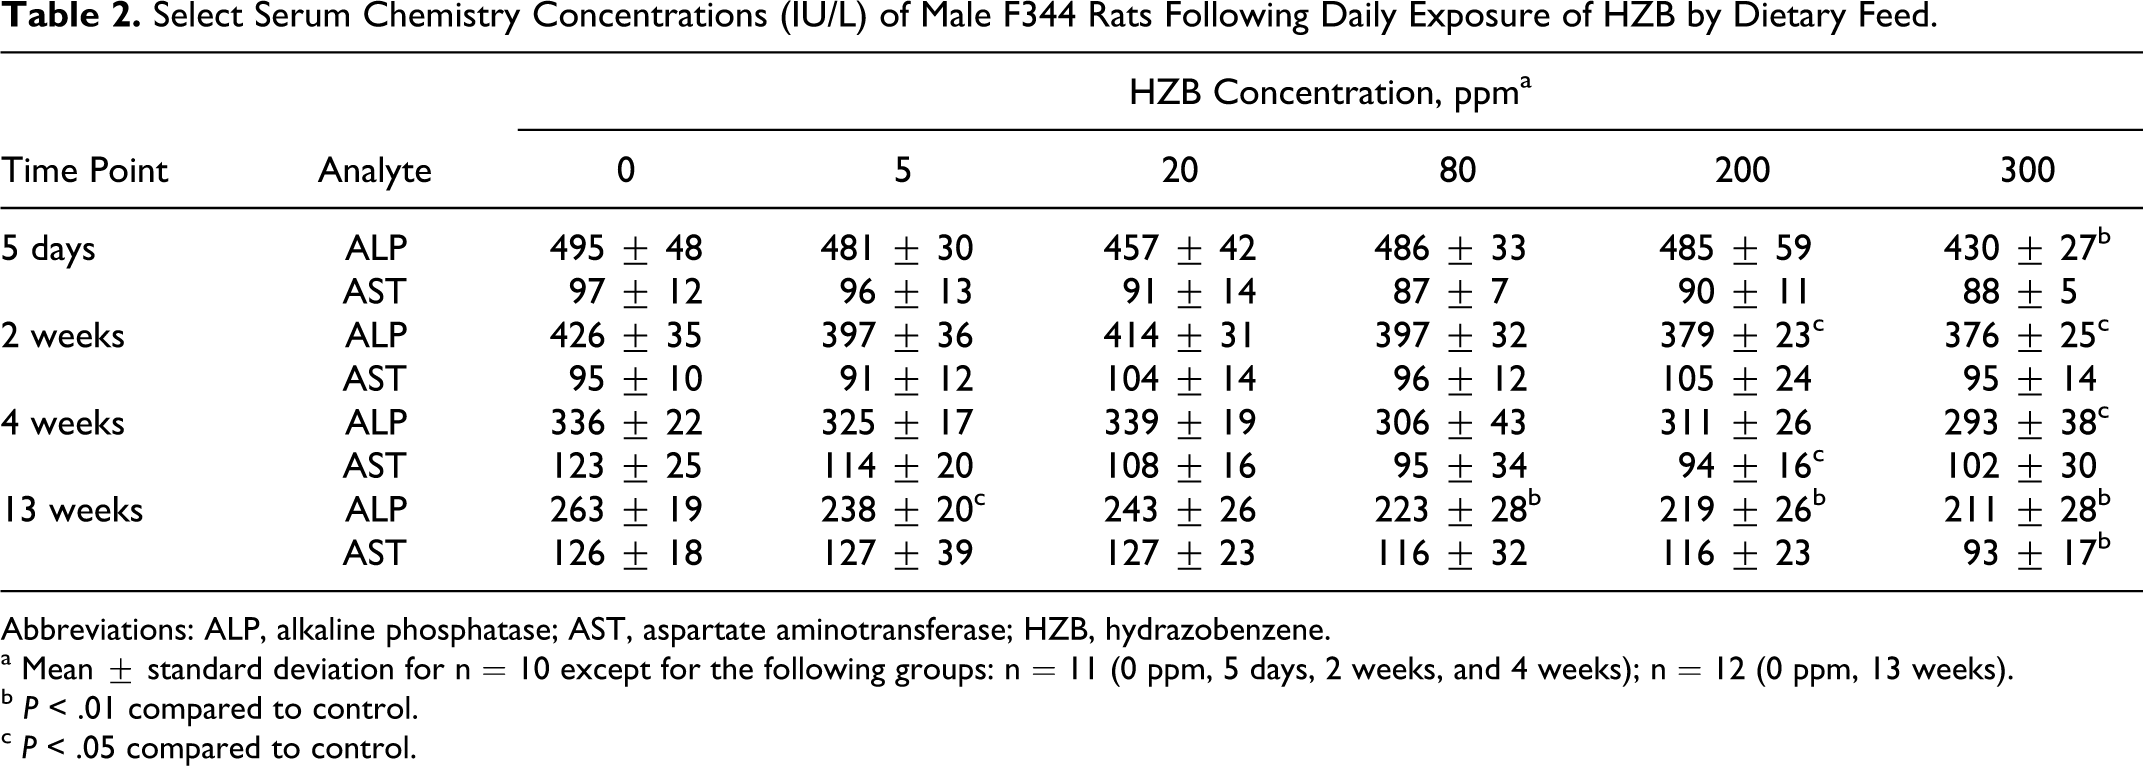
Abbreviations: ALP, alkaline phosphatase; AST, aspartate aminotransferase; HZB, hydrazobenzene.
a Mean ± standard deviation for n = 10 except for the following groups: n = 11 (0 ppm, 5 days, 2 weeks, and 4 weeks); n = 12 (0 ppm, 13 weeks).
b P < .01 compared to control.
c P < .05 compared to control.
Organ weights
Statistically significant increases in mean relative (to body weight) liver weights compared to controls were observed in rats of the 200- and 300-ppm groups following 5 days (300 ppm group only), 2 weeks , 4 weeks, and 13 weeks exposure (Table 3). The mean absolute liver weights were higher than the control values but not statistically significant. At the 2-week necropsy, the mean relative liver weight was increased (P < .05) compared to controls in rats of the 80 ppm group but at no other time point (Table 3). The relative liver weight increases were mildly HZB concentration related and exposure time dependent.
Absolute and Relative (to Body Weight) Liver Weights of Male F344 Rats Following Daily Exposure of HZB by Dietary Feed.
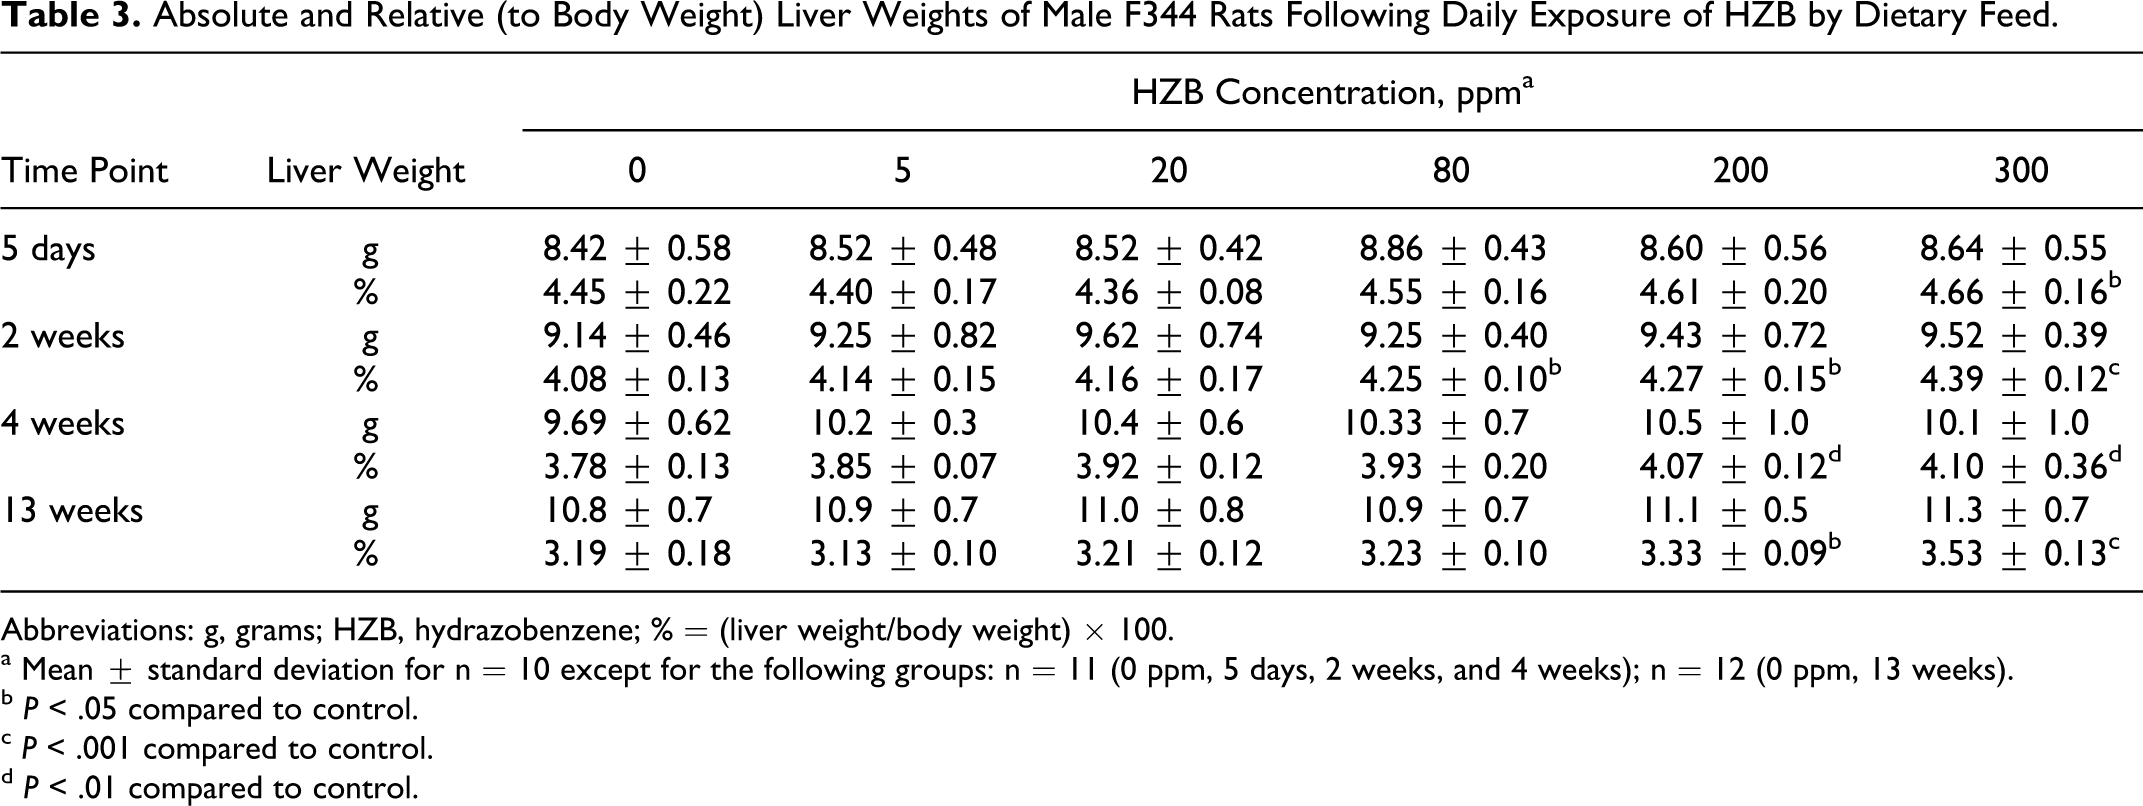
Abbreviations: g, grams; HZB, hydrazobenzene; % = (liver weight/body weight) × 100.
a Mean ± standard deviation for n = 10 except for the following groups: n = 11 (0 ppm, 5 days, 2 weeks, and 4 weeks); n = 12 (0 ppm, 13 weeks).
b P < .05 compared to control.
c P < .001 compared to control.
d P < .01 compared to control.
Histopathology
There were no HZB-exposure-related gross observations during necropsies of the 5-day, 2-week, 4-week, and 13-week time points. Hydrazobenzene-related liver microscopic alterations were only observed at the 13-week time point and consisted of hypertrophy, macrovesiculation, eosinophilic granular cytoplasm, and bile duct duplication. These changes only affected rats exposed to HZB concentrations ≥200 ppm (Table 4). The livers of rats in the 5, 20, and 80 ppm HZB groups were similar in microscopic appearance to those of the control group (0 ppm) at all time points.
Selected Histopathologic Changes in the Hepatocyte of Male F344 Rats Following Daily Exposure of HZB by Dietary Feed for 13 Weeks.
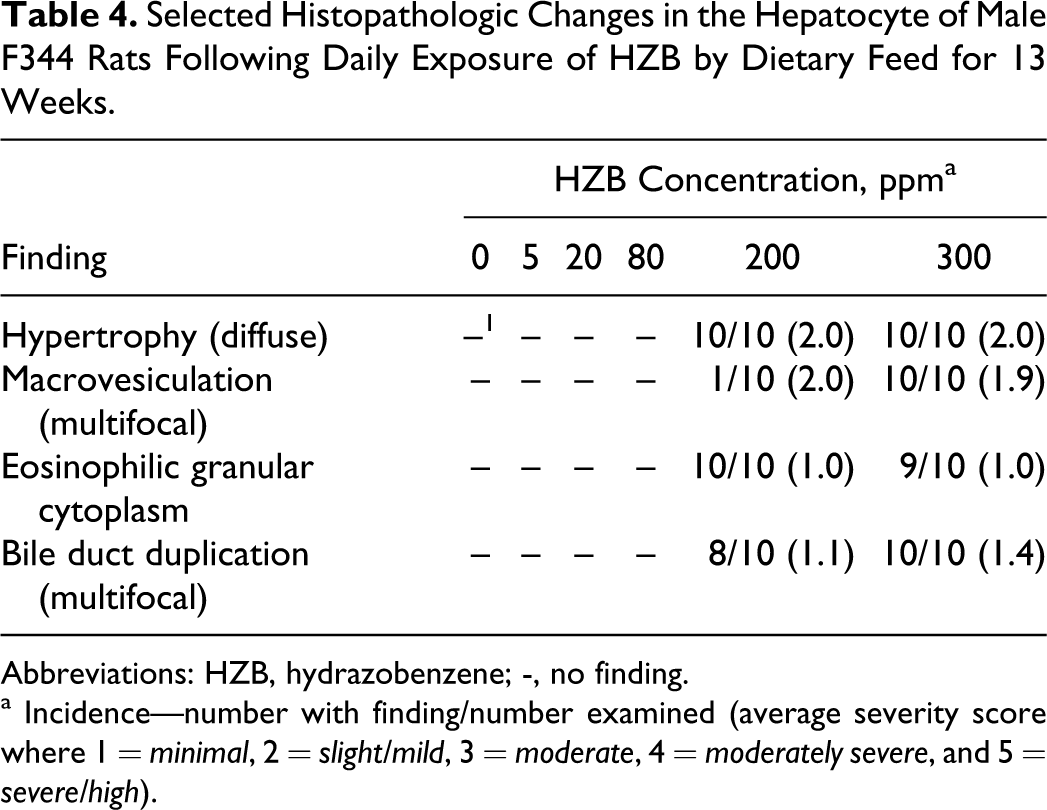
Abbreviations: HZB, hydrazobenzene; -, no finding.
a Incidence—number with finding/number examined (average severity score where 1 = minimal, 2 = slight/mild, 3 = moderate, 4 = moderately severe, and 5 = severe/high).
Slight/mild hepatocytic hypertrophy was observed in all rats of the 200 and 300 ppm groups following the 13-week necropsy (Table 4). Slight/mild macrovesiculation was also observed in all rats of the 300 ppm group and in a single rat of the 200 ppm group. Figure 1 shows the liver of a 300 ppm rat and highlights slight/mild diffuse hepatocytic hypertrophy and multiple vacolated hepatocytes (slight/mild multifocal macrovesiculation) in comparison to the liver of a control rat at the 13-week time point (Figure 2). The enlarged hepatocytes in rats of the 200 and 300 ppm groups also had minimal eosinophilic granular cytoplasm (Table 4). Figure 3 shows multiple bile ducts consistent with slight/mild and multifocal bile duct duplication in the portal hepatic triad of a 300-ppm HZB-exposed rat. Control rats had a single bile duct in the hepatic triad region (Figure 4).
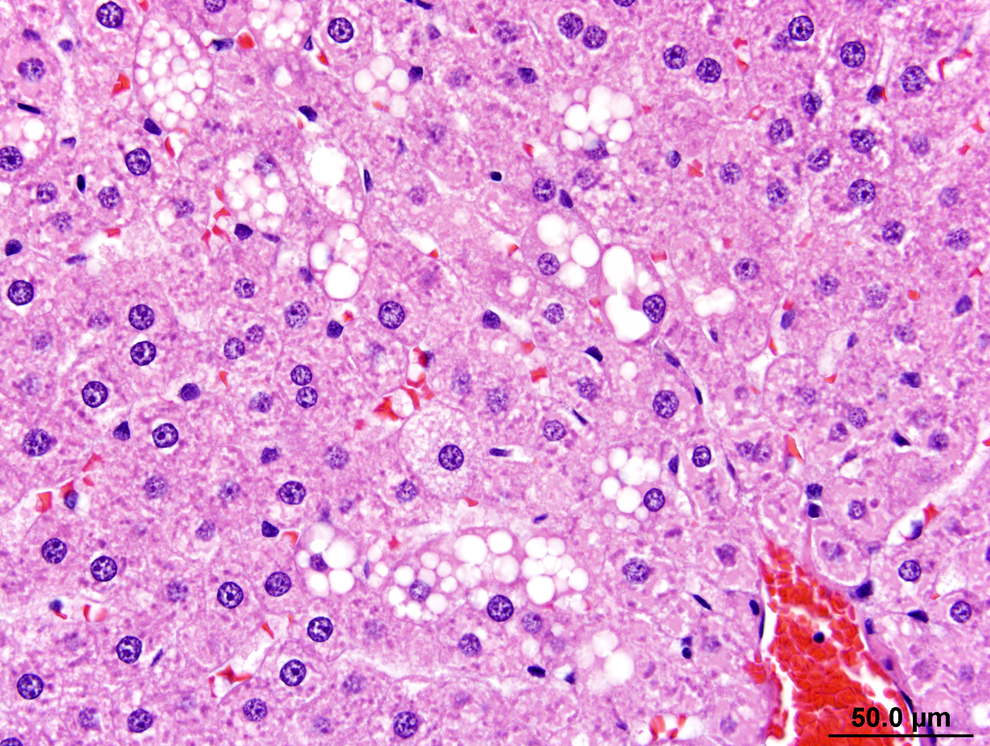
Liver from a rat exposed to 300 ppm hydrazobenzene (HZB) for 13 weeks. Part of the centrilobular area (zone 1) of a lobule is shown. The central vein is at the lower right of the image. The cords of hepatocytes that radiate from the central vein show slight/mild diffuse hepatocytic hypertrophy. The enlarged hepatocytes slightly compress the sinusoids that are between the hepatic cords. The multiple vacuolated hepatocytes are typical of slight/mild multifocal macrovesiculations, a change that indicates lipid accumulation within the hepatocytes. Hematoxylin and eosin (H&E).
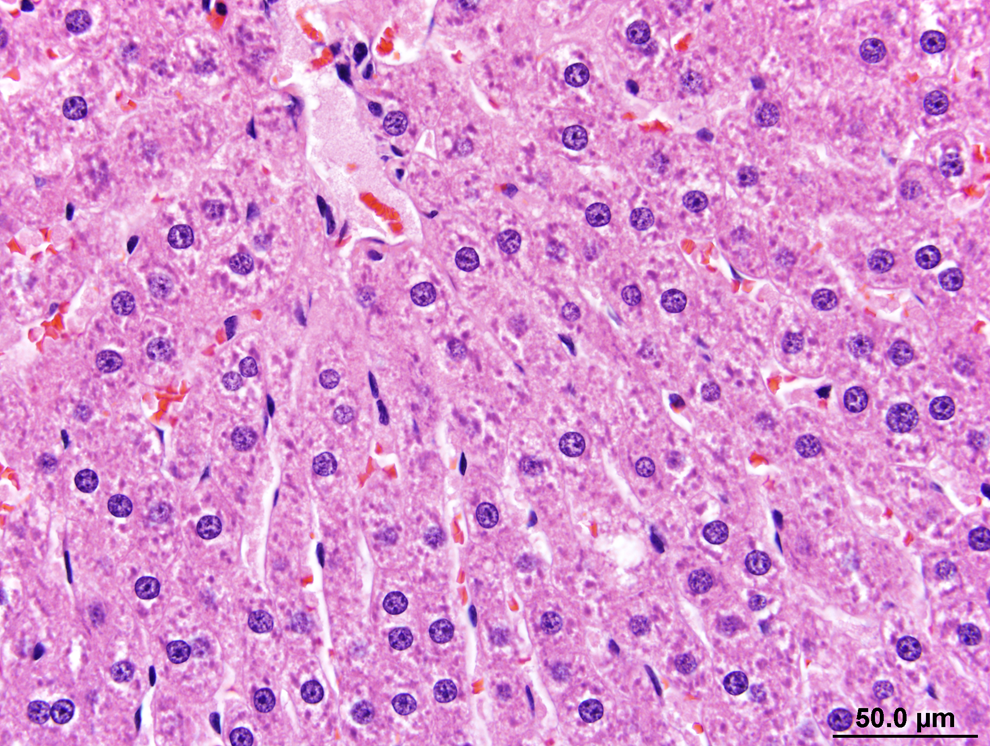
Liver from a control rat (0 ppm) after the 13-week exposure period. Normal hepatocytes are depicted in hepatocytic cords that radiate from the central vein of a hepatic lobule. As typical of liver with normal hepatocytes, the sinusoids are relatively open between hepatic cords and the hepatocytes lack changes (vacuoles, size, or tinctorial changes) that may be indicative of antemortem adaptive or pathological changes. The few clear spaces around several hepatocytic nuclei are indicative of glycogen loss during tissue processing. Hematoxylin and eosin (H&E).
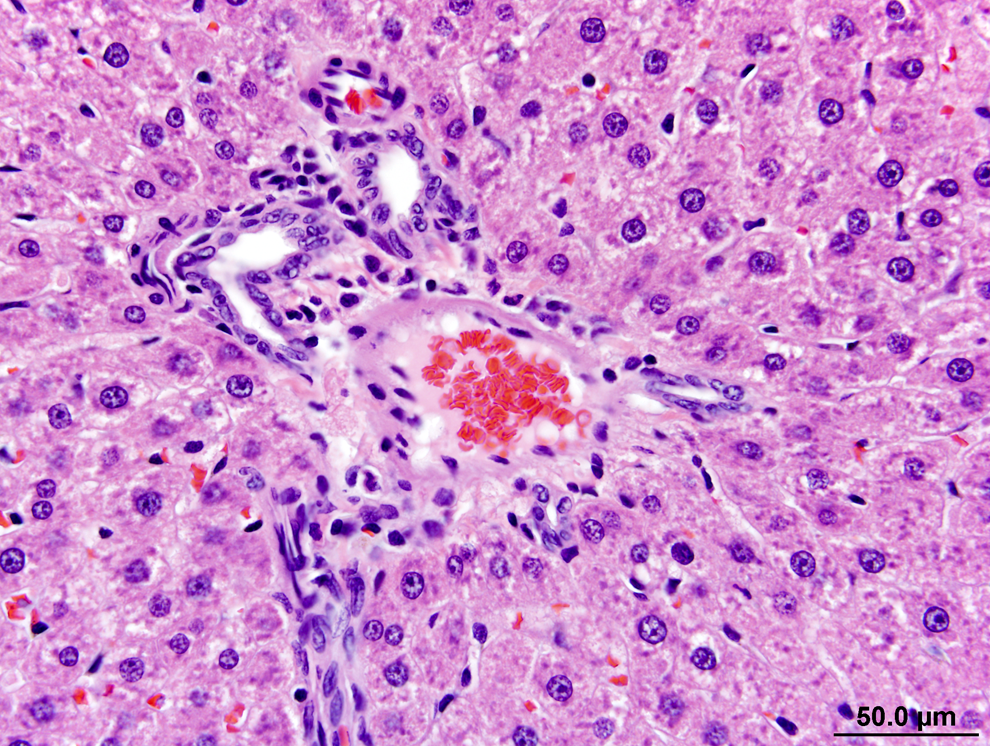
Liver from a rat exposed to 300 ppm hydrazobenzene (HZB) for 13 weeks. A portal triad at the periphery of zone 3 of adjacent lobules is depicted. It shows in a single portal triad, multiple bile ducts below the hepatic artery in the upper part of the image and at the periphery of the hepatic vein toward the right of the image. The multiple bile ducts are consistent with bile duct duplication, a finding that was considered mild and multifocal in this animal. Hematoxylin and eosin (H&E).
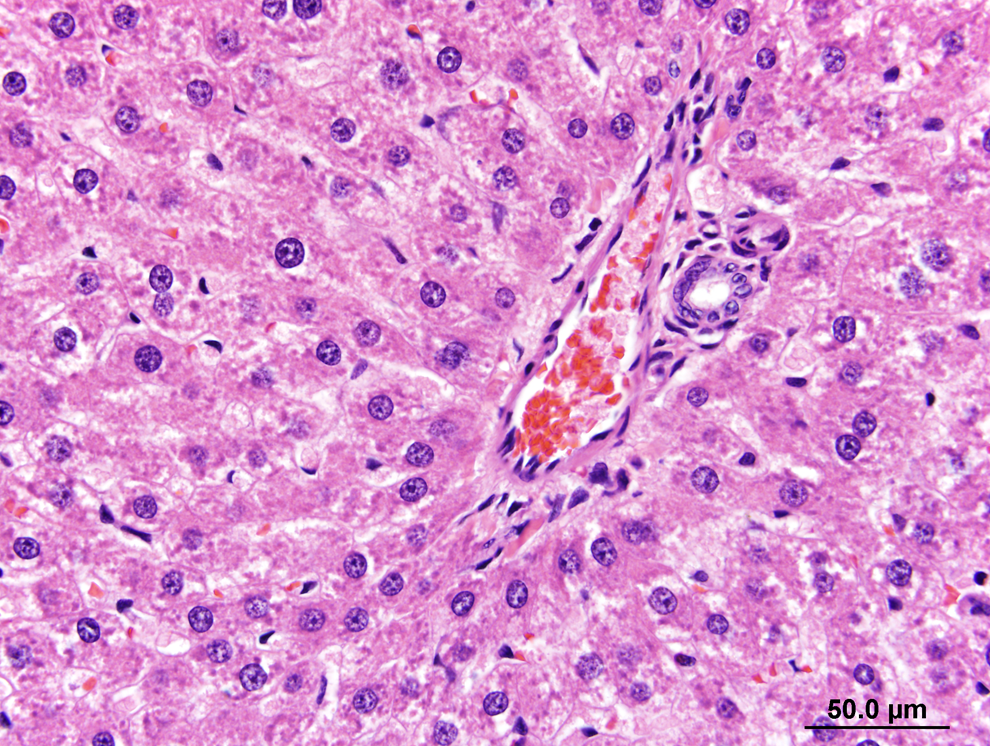
Liver from a control rat (0 ppm) at 13 weeks showing a normal portal triad at the periphery of zone 3 of adjacent lobules. It shows a single bile duct, hepatic vein, and hepatic artery, the structure of a normal hepatic triad. Hematoxylin and eosin (H&E).
Discussion
In a previous dietary carcinogenic study with HZB, the liver was identified as the critical target organ of effect in male F344 rats following chronic exposure. 4 Specifically, hepatocellular carcinoma or neoplastic liver nodules were observed in 37 of 49 male rats administered dietary feed of 300 ppm HZB compared to 1 of 48 control males. At a lower dose of 80 ppm, 13 of 49 male rats had hepatocellular carcinoma or neoplastic liver nodules compared to 5 of 47 control males. (The low-dose HZB group [80 ppm] and concurrent control group were conducted separately from the 300-ppm HZB group and concurrent control group.) Short-term (≤90 days) toxicity studies with HZB have not been located in the scientific literature. In NCI’s dose-range-finding study of 6 weeks’ duration (4 weeks dosing and 2 weeks postexposure observation), F344 rats (5/sex per dose) were administered HZB in the diet at concentrations ranging from ≤1to ≥50 000 ppm. The only end points reported were body weights, gross abnormalities (at necropsy), and mortality. Mortality was observed in male rats at all doses of 1080 ppm and higher, and significant body weight depression apparently was observed at 550 ppm, thus 300 ppm was selected as the high concentration for male rats in the carcinogenicity study. 4 For comparison, a 6% decrease in mean body weights was observed in the current study in rats of the 300 ppm group during study weeks 8 through 13 (Table 1). No HZB-related gross lesions were observed in rats during necropsies of the 5-day, 2-week, 4-week, or 13-week time points. The results of NCI’s dose-range-finding study and the current study were similar.
Increased liver weights and microscopic liver effects were the critical HZB-related observations in the current study. The decrease in serum ALP in rats of the 300 ppm group at all time points was unexpected and could not be explained in relation to the HZB-related liver effects. While these decreases were probably associated with exposure of HZB at 300 ppm, decreases in ALP have no known biological relevance and, therefore, this finding was not considered to be biologically significant. The relative (to body weight) liver weight increases were observed in rats of the 200 and 300 ppm groups as early as 2 weeks, but the microscopic liver effects correlating with the weight increase, such as hepatocytic hypertrophy, were observed only after 13 weeks’ exposure. This is likely due to the mild severity of effects observed at the 200- and 300-ppm diet concentrations. Blood HZB concentrations were slightly above the minimum detection limit even at the highest diet concentration of 300 ppm and did not increase with exposure time. Unchanged HZB was detected in the urine of HZB-dosed rats, 7 and based on the mild liver effects, it does not appear that potentially toxic metabolites of HZB, for example, aniline or benzidine, accumulate significantly with HZB exposure time. Metabolic pathways and toxicokinetics of HZB have not been clearly identified and usually default to those of other aromatic amines, such as azobenzene or aniline. 2
The liver histopathological findings reported in this study did not include extensive cell injury, for example, necrosis, nor did they include characteristic preneoplastic alterations, such as hyperplasia or dysplasia. A longer exposure duration than 13 weeks appears to be required to achieve more distinct preneoplastic liver morphology. Plausible mechanistic events that may relate to the observed histopathology include but are not limited to (1) cytochrome P450 enzyme induction that correlates with hepatocytic hypertrophy and the presence of groundglass cytoplasm in hypertrophic hepatocytes 14 –16 ; (2) peroxisome proliferation that correlates with the presence of hepatocytes with eosinophilic granular cytoplasm 15,16 ; (3) disordered lipid metabolism or transport that correlates with macrovesiculation in the cytoplasm of hepatocytes 14 ; and (4) hepatocytic necrosis or direct biliary epithelial cell injury that may have induced biliary duct duplication. 16 –19
The observed decreases in serum ALP or AST (Table 2) are unlikely to be correlated with biliary disease. Decreased serum ALP and the absence of bile duct duplication at the 5-day, 2-week, and 4-week time points in rats exposed to 200 or 300 ppm HZB may be correlated indications of the absence of cholestatic biliary injury. At 13 weeks, decreased serum ALP and AST and the presence of bile duct duplication in the 200- or 300-ppm groups may also be correlated but also indicative of the absence of active cholestatic biliary disease. It is possible and even likely that the minimal-to-slight/mild bile duplication is an indication that there was an earlier event that stimulated biliary proliferation. However, the morphology of the liver at the 13-week time point did not show bile plugs in canaliculi or periportal inflammatory changes, suggestive of bile duct obstruction and active biliary disease that might be correlated with increased serum ALP levels. 20
In conclusion, male F344 rats administered HZB by dietary feed at concentrations up to 300 ppm for up to 13 weeks had mild liver effects manifested as increased liver weights and increased incidences of hypertrophy, macrovesiculation, eosinophilic granular cytoplasm, and bile duct duplication. Microscopic hepatic effects were observed in rats of the 200 or 300 ppm groups at the 13-week time point only. An NOEL of 80 ppm (4.80 mg/kg per d) HZB was selected based on the absence of liver histopathology.
Footnotes
Acknowledgments
Paul Ross, Nigel Edgerton, and other members of The Hamner Institutes’ laboratory animal care and necropsy staffs and EPL’s histology staff for technical support. The study was funded by the American Chemistry Council’s Long-Range Research Initiative.
Declaration of Conflicting Interests
The author(s) declared no potential conflicts of interest with respect to the research, authorship, and/or publication of this article.
Funding
The author(s) disclosed receipt of the following financial support for the research, authorship and/or publication of this article: the American Chemistry Council’s Long-Range Research Initiative.