
Abstract
This study determined the metabolism of 3 drinking water disinfection by-products (halogenated acetic acids [HAAs]), bromodichloroacetic acid (BDCAA), chlorodibromoacetic acid (CDBAA), and tribromoacetic acid (TBAA), using rat, mouse, human liver microsomes, and recombinant P450. Metabolism proceeded by reductive debromination forming a di-HAA; the highest under nitrogen >>2% oxygen > atmospheric headspaces. V max for the loss of tri-HAA was 4 to 5 times higher under nitrogen than atmospheric headspace. Intrinsic metabolic clearance was TBAA>CDBAA>>BDCAA. At the high substrate concentrations, tri-HAA consumption rate was 2 to 3 times higher than the formation of di-HAA. Liberation of Br− from TBAA corresponded to the expected amount produced after DBAA formation, indicating retention of Br− by additional metabolite/metabolites. Subsequent experiments with CDBAA detected negligible formation of chlorodibromomethane (CDBM) and failed to account for the missing tri-HAA. Carbon monoxide and especially diphenyleneiodonium ([DPI] P450 reductase inhibitor) blocked CDBAA metabolism. Other chemical inhibitors were only partially able to block CDBAA metabolism. Most effective were inhibitors of CYP 2E1 and CYP 3A4. Immunoinhibition studies using human liver microsomes and anti-human CYP 2E1 antibodies were successful in reducing CDBAA metabolism. However, CDBAA metabolism in wild-type (WT) and CYP 2E1 knockout (KO) mouse liver microsomes was similar, suggesting significant interspecies differences in CYP isoform in tri-HAA metabolism. Additional assessment of CYP isoform involvement was complicated by the finding that recombinantly expressed rat and human P450 reductase was able to metabolize CDBAA, which may be a contributing factor in interspecies differences in tri-HAA metabolism.
Keywords
Introduction
Chlorine- and bromine-substituted trihalogenated acetic acids (tri-HAAs) along with their di-halogenated acetic acid (di-HAAs) analogues are frequently identified in the surveys of municipal drinking water supplies.1–3 When chlorination is the disinfection method, di- and tri-HAAs typically represent a minimum of 13% of the total disinfection by-products present in finished water. 4 This percentage can vary by as much as a factor of 2 depending on the treatment method and mineral content of the source water. In general, bromine-substituted HAAs tend to be formed as by-products of water treatment processes when the source water is high in bromide salts. 5 All possible chlorine and bromine tri- and disubstituted acetic acids have been identified in drinking water. A recent national survey reported the total HAA burden in drinking water varies from 6 to 130 μg/L, 3 which would result in a daily HHA intake of between 11 and 230 μg (water consumption = 1.8 L/day). Values for specific bromine substituted tri-HAAs ranged from undetectable to 9 to 10 μg/L for bromochloro (BDCAA) and chlorodibromoacetic acid (CDBAA; Weinberg et al 3 ). It is also worth noting that the highest levels of tri-HAAs have been reported in chlorinated swimming pools, where values exceeding 1000 μg/L have been measured. 6 Brominated HAAs have been found to be hepatocarcinogenic in mice and rats, typically at high concentrations (concentration in drinking water, 0.5-5 g/L), which produce peak blood and tissue concentrations approaching or exceeding 750 nmol/mL.7,8
Toxicokinetic studies of brominated tri-HAAs indicate that metabolic clearance can account for 40% to 70% of the total body clearance in rats.9,10 The disposition of a 14 C-BDCAA oral dose in mice is known to be largely converted into 14CO2 or 14C-oxalate. 11 Previous studies using BDCAA suggested that metabolism is primarily microsomal, proceeding via reductive dehalogenation to form the corresponding monodebrominated product, which is a di-HAA.12,13 However, in whole animal studies of tri-HAAs, the formation of a di-HAA has been difficult to confirm. For example, no di-HAA was detected in blood and urine of both rats and mice after in vivo dosing of BDCAA, CDBAA, and tribromoacetic acid (TBAA) at both relatively low (25 μmol/kg) or high (100 μmol/kg) oral doses.9,10,14 The lack of di-HAA detection was presumably due to rapid GSH-dependent metabolism that is known to occur for di-HAAs.15,16 Also, the previous in vitro studies of 14 C-BDCAA using mouse liver microsomes and nicotinamide adenine dinucleotide phosphate, reduced (NADPH) as a cofactor could not achieve mass balance between the consumption of BDCAA and the formation of dichloroacetic acid (DCAA). 12 This finding raised questions as to whether microsomal metabolism of tri-HAAs proceeds through additional oxidative pathway/pathways that does not form a di-HAA metabolite or perhaps di-HAAs themselves undergo microsomal metabolism. Thus, the goal of the present study was to characterize the microsomal metabolism of all brominated tri-HAAs and to establish the specific cytochrome P-450 isoenzyme/isoenzymes involvement in their metabolism. Information on the metabolism of brominated tri-HAAs is limited in general and none is available in the literature for rats. This is the first study measuring in vitro metabolism of tri-HAAs in rats, with a goal toward understanding the extent and type of metabolite/metabolites formed. This type of information would be of benefit for future studies determining the carcinogenicity of these compounds in rodent models. Information on the extent of metabolism will also help in predicting toxicity of individual tri-HAAs as metabolic dehalogenation has been reported to reduce their toxicity.17–21 These data will also be useful in predicting the risk of drinking water disinfectant by-products to human populations using rodent models extrapolated to environmentally relevant doses.
Materials and Methods
Reagents
Bromodichloroacetic acid (97% pure), CDBAA (97% pure), TBAA (99% pure), and chlorodibromomethane (CDBM) were purchased from Supelco (Bellefonte, Pennsylvania). Nicotinamide adenine dinucleotide phosphate (NADP), glucose-6-phosphate, and glucose-6-phosphate dehydrogenase were purchased from Sigma (St. Louis, Missouri). Carbon monoxide (CO) and the 2% oxygen:98% nitrogen gas mixtures were obtained from Oxarc Specialty Gases (Pasco, Washington). Chlorzoxazone ([CNZ] inhibitor of CYP 2A6, 2E1), diethyldithiocarbamate ([DDC] inhibitor of CYP 2E1), diphenyleneiodonium ([DPI] inhibitor of NADPH-dependent P450 reductase), n-octylamine ([NOA] nonspecific inhibitor of P450), quinidine ([QND] inhibitor of CYP 2D6), sulfaphenazole ([SPZ] inhibitor of CYP 2C9/2C10), and troleandomycin ([TAO] inhibitor of CYP 3A4) were purchased from Sigma (Milwaukee, Wisconsin). Diazomethane was prepared from N-methyl-N-nirosoguanidine following Aldrich Technical Information Bulletin Number AL-121 as described earlier. 22 All other common chemicals and solvents were of the purest grade available.
Purified complementary DNA (cDNA)-expressed rat CYP 2E1, rat P450 reductase, human P450 reductase, and a mixture of human CYP isoforms (Gentest Supermix; 1A2, 2C8, 2C9, 2C19, 2D6, 3A4) was obtained from Gentest (Woburn, Massachusetts). Monoclonal antibodies for human CYP 2E1 were obtained from Gentest (Woburn, Massachusetts).
Preparation of Microsomes
Male F344 rats (age, 10-12 weeks; body weight range, 195-210 g) were purchased from Charles River Laboratories (Raleigh, North Carolina). Male CYP 2E1+/+ (WT) and CYP 2E1−/− (CYP 2E1 KO) mice, approximately 16 weeks old (20-35 g) were purchased from Charles River Laboratories (Wilmington, Delaware). These mice were originally developed at the National Cancer Institute, Bethesda, MD by Lee et al. 23 and were rederived and bred by the vendor as described by Hoffler et al. 24 All animals were housed at 22°C ±3°C and 40% to 70% humidity under a 12-h light–dark cycle in an AAALAC (Association for Assessment and Accreditation of Laboratory Animal Care)-accredited laboratory. Rats and mice were euthanized by CO2 asphyxiation and the livers perfused in situ with 0.9% NaCl (weight/volume [w/v]) prior to removal. Livers from 3 male rats and 6 male WT and KO mice were pooled prior to subcellular fractionation. Pooled human microsomes were prepared from liver tissues obtained from 5 donors (3 male Caucasian, 1 male Hispanic, and 1 female Caucasian) of ages between 20 and 62 years. Human liver tissues were obtained from the International Institute for the Advancement of Medicine (Exton, Pennsylvania). Causes of their death include cardiovascular disease, brain hemorrhage, anoxia, head injury, and stroke. Preparation of hepatic microsomal fractions was by differential centrifugation as described by Okita and Okita. 25 The microsomal pellet was washed by resuspension in 100 mM phosphate buffer (pH 7.4) and recentrifuged at 105 000 g for 1 hour. The washed pellet was resuspended in phosphate buffer at a volume (mL) corresponding to the original weight of the pooled livers (g) and stored at −70°C until use. Protein concentrations were determined using the Coomassie Protein Assay Reagent (Pierce, Rockford, Illinois).
Kinetic Studies of Tri-HAA Metabolism in Rat Liver Microsomes Under Controlled Atmospheres
Microsomal incubations were performed under normoxic (atmospheric), 2% oxygen (representative of tissue oxygen tension), and reduced oxygen (N2) conditions. All incubations were performed at 37°C in an oscillating water bath and contained 0.5 to 1 mg/mL of microsomal protein, 10 mmol/L MgCl2, and an NADPH regeneration system (8 mmol/L glucose-6-PO4, 1 unit glucose-6-PO4 dehydrogenase, and 1.5 mmol/L NADP) in a 100 mmol/L phosphate buffer (pH 7.4). Normoxic incubations occurred in open Pyrex vials and controlled atmosphere incubations occurred in 4-mL Pyrex vials fitted with gas tight lids and Teflon septa. The 2% oxygen and N2 atmospheres were introduced into the incubation vials via a 27-G needle inserted through the septa with an additional needle inserted to allow venting of gas. The reaction mixture was flushed with each atmosphere for 10 minutes on ice prior to transfer to the 37°C water bath. After 3 minutes, the tri-HAA was added using a 100-μL Teflon-tipped gas tight syringe. Stock solutions of each tri-HAA were prewarmed to 37°C prior to using in experiments. During preliminary experiments, protein concentration and incubation times were varied in order to find the optimal conditions for each substrate where consumption of the added substrates was limited to 10% to 15% and kinetics of the metabolism remained within the linear range. All subsequent kinetic experiments were conducted at the optimal protein concentration and incubation time established for each tri-HAA during the preliminary experiments. Up to 14 initial concentrations of BDCAA, CDBAA, or TBAA were used, ranging between 0.4 and 1200 μmol/L. The incubations were stopped by the addition of 15 μL of 50% (v/v) H2SO4 and the tri- and di-HAA concentrations analyzed using gas chromatography- electron capture detector (GC-ECD) as described by Schultz et al. 10 Briefly, 100 ng of internal standard (either DBAA for BDCAA or CDBAA incubations or DCAA for TBAA incubations) were added to the acidified reaction mixture and then extracted with methyl-tert-butyl-ether (MTBE). The free acids were converted into their methyl esters by the addition of 20 μL of ethereal diazomethane. During CDBAA incubations, which formed the chiral metabolite bromochloroacetic acid (BCAA), separation of each stereoisomer was accomplished by using a cyclodextran chiral GC capillary column as described in Schultz and Sylvester. 15 Care was taken during all extractions and GC analysis to prevent degradation of tri-HAAs as discussed in Schultz et al 10 and Merdink et al. 26
During each experiment, an additional set of tubes containing all reagents and an equivalent concentration of microsomal protein was placed on ice. The initial rate of BDCAA, CDBAA, and TBAA metabolism was determined from consumption of added substrate, calculated from the difference in concentrations measured from incubations kept on ice. The rate of debromination was determined from the formation of DCAA, BCAA, and DBAA, during the respective BDCAA, CDBAA, or TBAA incubations. All assays were carried out in triplicate and the mean values ± standard deviation (SD) for substrate consumption and formation of di-HAA are reported.
Mass Balance Determinations of TBAA and CDBAA Metabolism
Mass balance estimation of TBAA consumption and simultaneous formation of DBAA, glyoxylate, oxalate, and liberated Br− was measured in rat microsomes under N2 atmosphere at initial TBAA concentrations ranging from 77 to 1200 μmol/L. Higher concentrations of substrates were needed for these and other incubations in order to produce high enough metabolic products (glyoxylate, oxalate, Br−, halogenated methane) that remain above the lowest limit of analytical quantifications (GC, GC/MS, Br− electrode). Other incubation conditions were as specified above. The incubations were terminated by the addition of 100 μL of a 1 mol/L H2SO4 solution. A 100-μL aliquot of the mixture was removed and analyzed for TBAA and DBAA as described above. A separate 100-μL aliquot was analyzed for glyoxylate and oxalate using GC/MS after extraction into MTBE and derivatization with diazomethane. The ether extracts were reduced to approximately 25 μL under a gentle stream of dry nitrogen and analyzed for glyoxylate methyl ester and the oxalate dimethyl ester by GC/MS using splitless injection mode. Quantification was made in SIM mode using 59 m/z ion. GC conditions were as follows: injection port, 180°C; initial temperature, 100°C; initial time, 1 minute; temperature ramp, 10°C/min; final temperature, 300°C; and final time, 5 minutes. Quantification was achieved using external standards consisting of microsomes spiked with known amounts of glyoxylate or oxalate. The remaining mixture was analyzed for the liberated Br− using a bromide-specific electrode (Orion model 9435). Briefly, 2 mL distilled water and 0.06 mL 5 mol/L NaNO3 was added to the acidified incubation mixture and centrifuged for 10 minutes at 12 000 g to remove the microsomal protein. The supernatant was transferred to a clean Pyrex tube and the Br− was measured at 25°C after allowing the electrode to equilibrate in the supernatant for 2 minutes. A series of standard Br− solutions were prepared using microsomes spiked with NaBr at various concentrations and treated similarly as the experimental incubations except the addition of TBAA. Background subtraction was made using supernatant prepared from acidified microsomes spiked with TBAA at a concentration equivalent to the initial concentration used in the incubations. Control incubations that contained all reagents but were placed on ice instead of the 37°C water bath were also assayed for liberated Br−. Incubations were performed in triplicate and the mean value ± SD is reported.
Chlorodibromoacetic Acid Metabolism to CDBM
The decarboxylation of CDBAA to CDBM was assessed in rat microsomes at an initial CDBAA concentration of 300 μmol/L. The reactions were performed under N2 headspace in 20-mL gas tight vials as described for kinetic studies. At various times (5, 10, 20, and 40 minutes) during the incubation, 1 mL of headspace was removed using a gas-tight syringe and injected onto the GC for the analysis of CDBM. In other experiments, the reaction was terminated at various times during incubation by injecting 100 μL of methanol through Teflon septum followed by adding internal standard (carbon tetrachloride) before transferring the vials to 60°C. Headspace (˜1 mL) was removed and bubbled into cold ether in GC tubes without a headspace to which 50 μL of diazomethane added to derivatize any CDBAA that might have been sampled with headspace vapors and analyzed by GC as described above.
Inhibition of CDBAA Metabolism
All incubations used 0.5 mg/mL microsomes, 750 μmol/L of CDBAA and lasted 30 minutes under N2 atmosphere with the exception of carbon monoxide (CO) and DPI, which were conducted under normoxic, 2% O2 or N2. For CO, the headspace was flushed with CO for 10 minutes, while the samples were kept on ice prior to flushing the headspace with the desired conditions (normoxic, 2% O2 or N2). Other inhibitors (CNZ, DDC, NOA, QND, SPZ, and TAO) were initially added at varying amounts to the reaction vials in 5 μL of methanol, which was evaporated under N2 prior to adding the microsomes. For the mechanism-based inhibitors (DDC and TAO), a preincubation lasting 15 minutes was performed at 37°C under normoxic conditions with NADPH. The vials were capped and placed on ice for 10 minutes, while the headspace was flushed with N2. The vials were then placed in the 37°C water bath for 3 minutes and CDBAA added. Control vials were added with 5 μL methanol and, depending on the inhibitor, also underwent a preincubation step. Chlorodibromoacetic acid metabolism was also evaluated in microsomes that were previously incubated at 45°C or 50°C for 2 minutes (with and without NADPH) to inactivate flavin-containing monooxygenases (FMO). 27 All incubations were terminated with 15 μL of 50% (volume/volume [v/v]) H2SO4, and the initial rate of CDBAA metabolism and BCAA formation determined as described above. Incubations were performed in triplicate with each inhibitor concentration and the percentage inhibition was determined based on the comparisons with the appropriate control. For each inhibitor concentration, the mean value ± SD is reported.
CDBAA Metabolism in cDNA-Expressed CYP Isoforms
Incubation mixtures contained 150 μmol/L of CDBAA, 1 mmol/L NADPH, and 0.25 mg of B-lymphoblastoid or insect cell microsomal protein in 80 mmol/L phosphate buffer (pH 7.4) in a total volume of 0.5 mL. Reactions were started by the addition of CDBAA and were performed under N2 atmosphere for 60 minutes. Incubations were performed in triplicate and the mean ± SD reported. Control incubations were either blank (no microsomes) or insect cell microsomes that contained only the baculovirus vector. Incubations were terminated with 15 μL of 50% (v/v) H2SO4, and CDBAA and BCAA extracted and quantified as described above.
Immunoinhibition Studies on CDBAA Metabolism in Human and Mouse Microsomes
The inhibitory effect of a mouse monoclonal antibody recognizing human CYP 2E1 on CDBAA metabolism was studied in pooled human microsomes. Microsomes (protein, 0.25 mg) were incubated with 5 μL of the antibody solution (50 μg total added protein dissolved in 25 mmol/L TRIS buffer) for 15 minutes on ice. Control experiments used a non-CYP-specific mouse antibody. After the incubation, 1 mmol/L NADPH, 150 μmol/L of CDBAA, and 100 mmol/L phosphate buffer (pH 7.4) were added (total volume, 0.5 mL) and the reaction mixture incubated for 90 minutes at 37°C under N2 headspace as described above. During the incubation, 20 μL aliquots of the reaction mixture were removed at various times for CDBAA and BCAA analysis. Termination of the incubations and quantification of CDBAA and BCAA were as described above.
Kinetic Analysis
The apparent K m and V max were determined by fitting the mean observed rate vs substrate concentration data to the Michaelis–Menten equation using WinNonlin, a nonlinear regression program (Pharsight Corp, Mountain View, California). For this fitting procedure, observed values were equally weighted (wt = 1). Kinetic analysis was limited to the experiments conducted on endogenously expressed, native rat liver microsomal preparations.
Results
Kinetics of Brominated Tri-HAA Metabolism in Male F344 Rat Microsomes
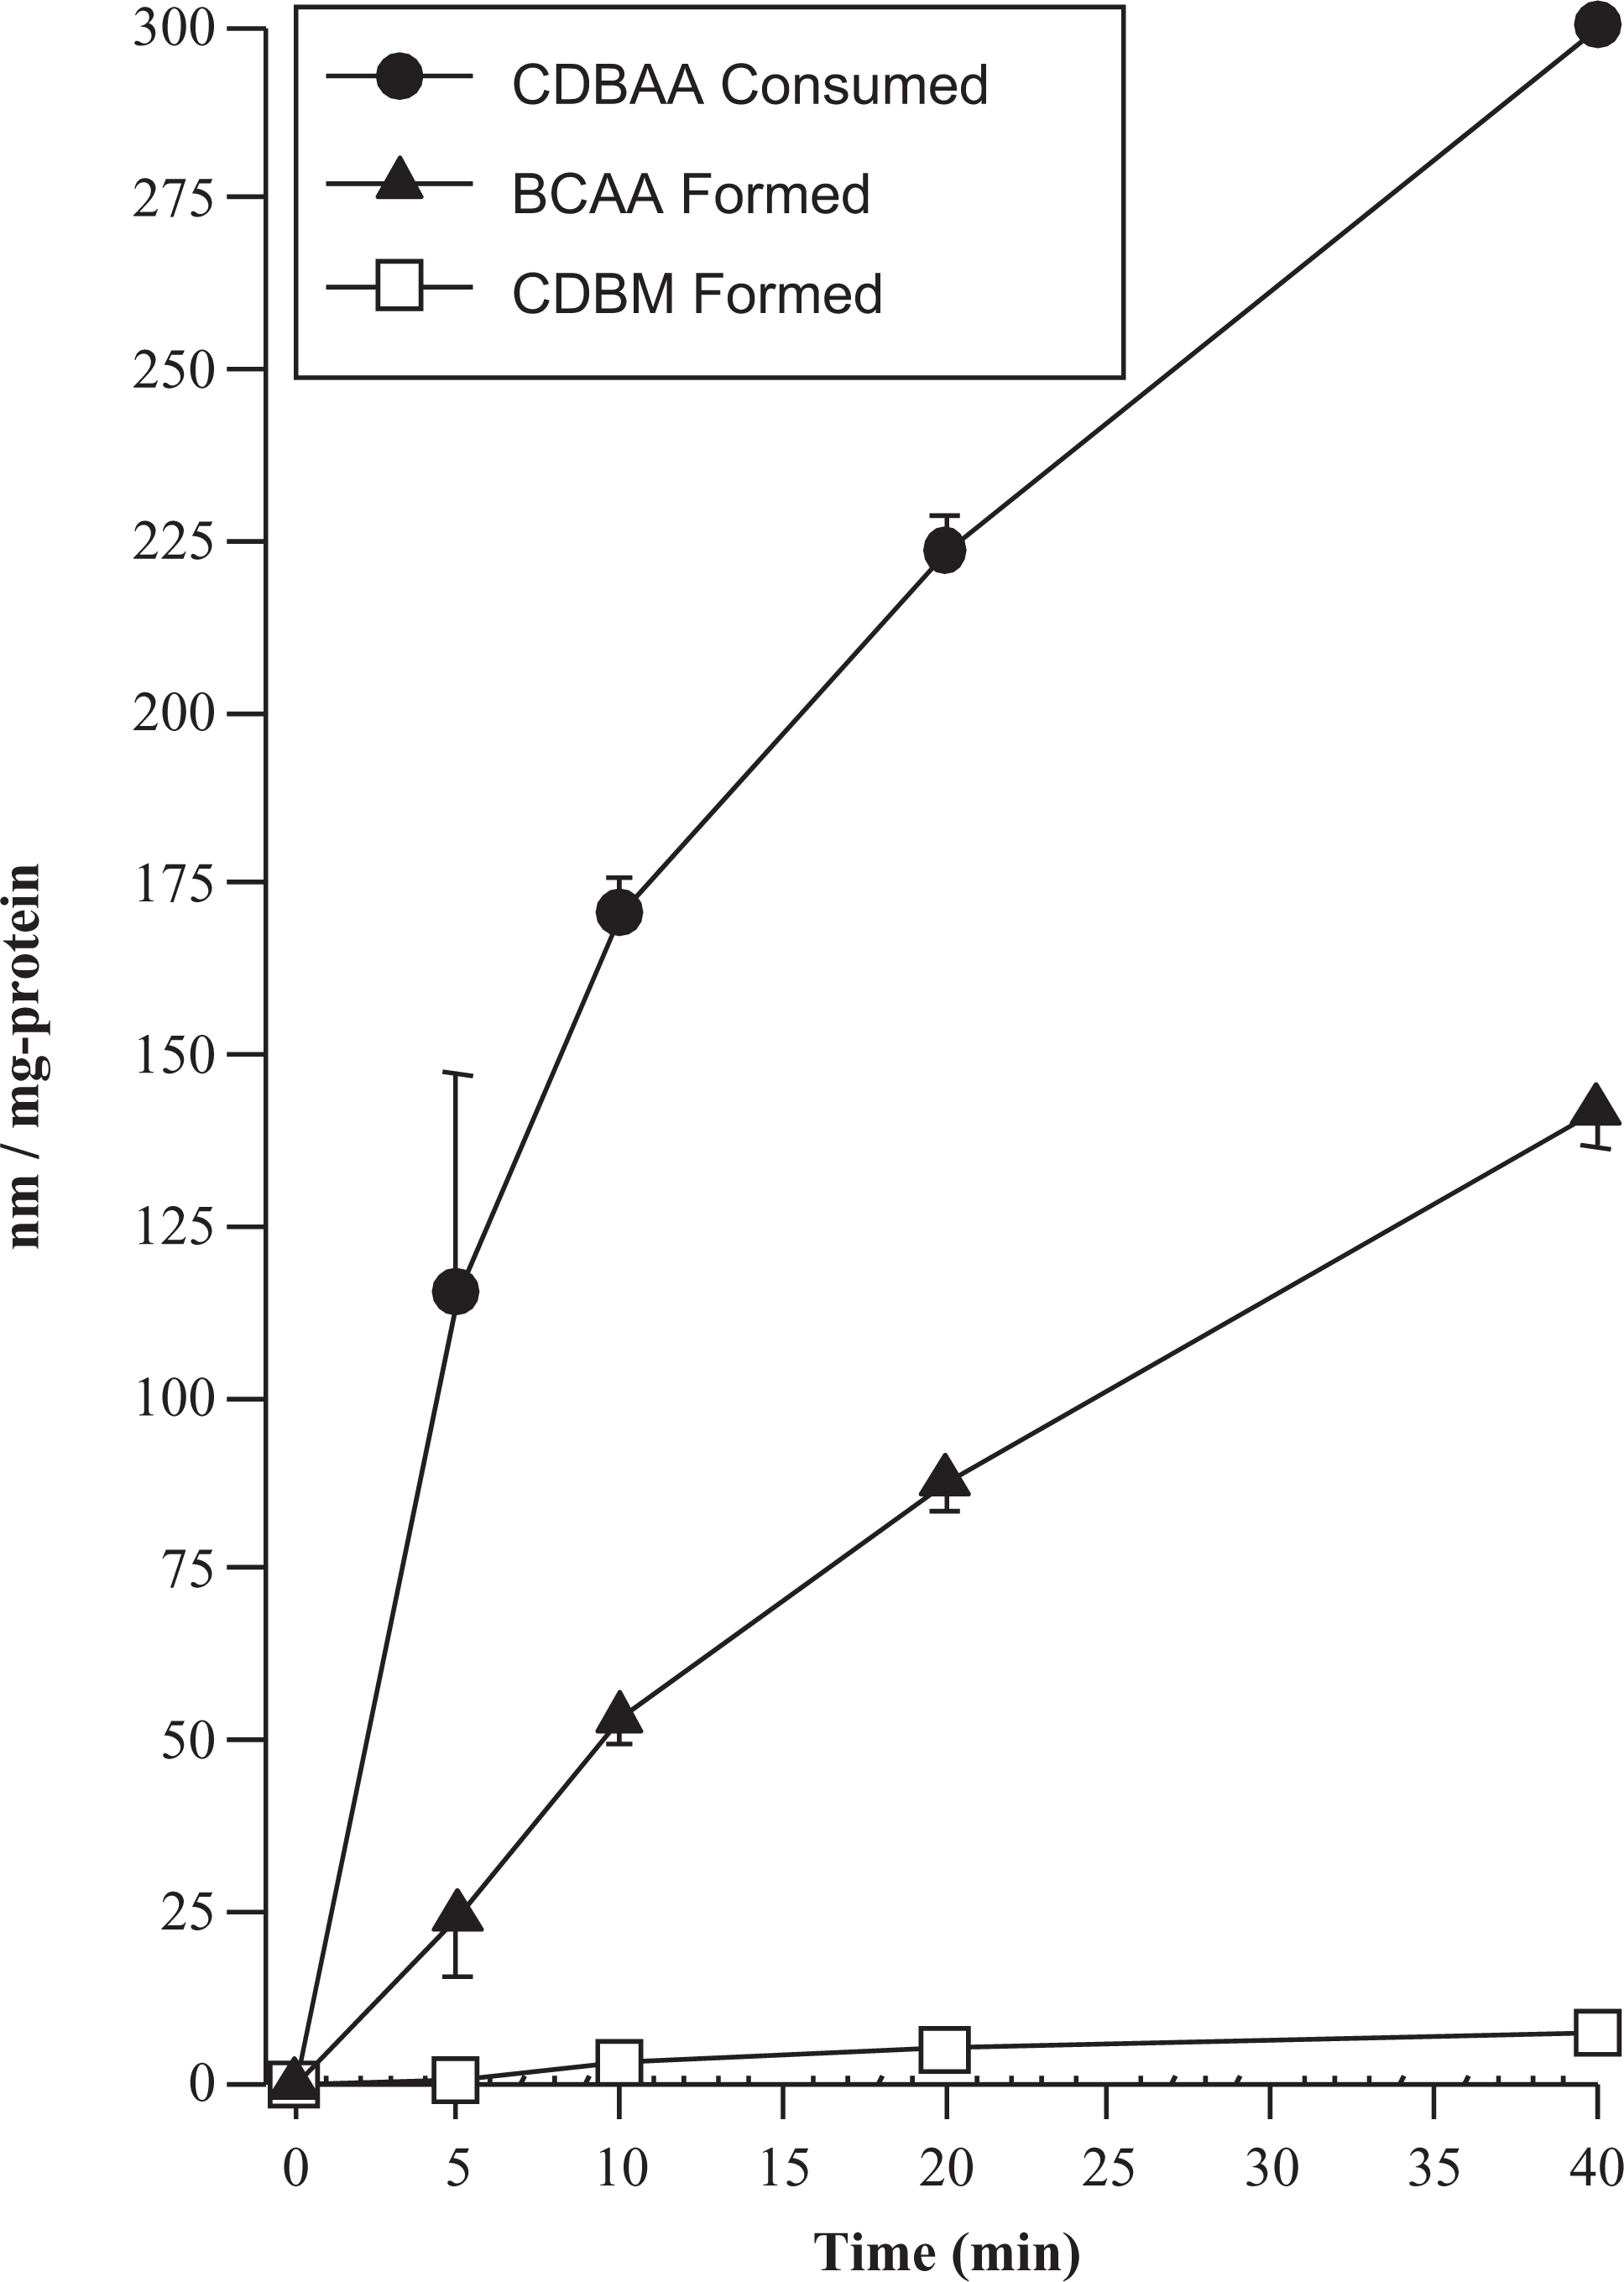
All 3 brominated tri-HAAs were rapidly metabolized by liver microsomes. The predominant metabolite that could be identified in all incubations was the di-HAA product corresponding to loss of a single Br−. Thus, DCAA, BCAA, and DBAA were the primary metabolites formed during incubations with BDCAA, CDBAA, and TBAA, respectively (Figures 1–3). During CDBAA incubations, stereospecific loss of Br− was not observed as equimolar formation of each BCAA stereoisomer always occurred. The overall rate of metabolism and formation of di-HAA metabolites was stimulated under reducing conditions. Metabolism of each tri-HAA was highest under nitrogen headspace followed by 2% O2 and atmospheric headspaces. These results are shown in Figures 1 to 3, which depict the rate of metabolism of each tri-HAA at different substrate concentrations under the various atmospheres (top row) and formation of the respective di-HAA (bottom row). For BCAA, the concentration of the respective (−), (+) stereoisomers was combined and presented as total BCAA formation. Also shown in Figures 1 to 3 are the predicted values (solid lines) obtained from the nonlinear least squares fitting of the observed data to Michaelis–Menten equation. The estimates of V max and K m obtained from this fitting are listed in Table 1. Initial inspection of the Vmax/K m values (intrinsic clearance) in Table 1 indicates that overall metabolism of tri-HAAs is stimulated by a factor of 2 to 3 under reduced oxygen atmosphere. Similarly, increasing bromide substitution (BDCAA → CDBAA→ TBAA) increases the initial rate of metabolism by as much as 3-fold depending on atmosphere. The increases in intrinsic clearance are largely due to increases in V max associated with bromide substitution and/or reduction in oxygen (Table 1). The K m for tri-HAA metabolism measured from most experiments appeared to vary between 200 and 400 μmol/L (Table 1). Consumption of each tri-HAA was higher than the formation of the di-HAA metabolite, especially at higher substrate concentrations. Formation of the di-HAA metabolite was typically 2- to 4-fold lower than the consumption of the parent compound (Figures 1–3), which was most pronounced for TBAA (Table 1).
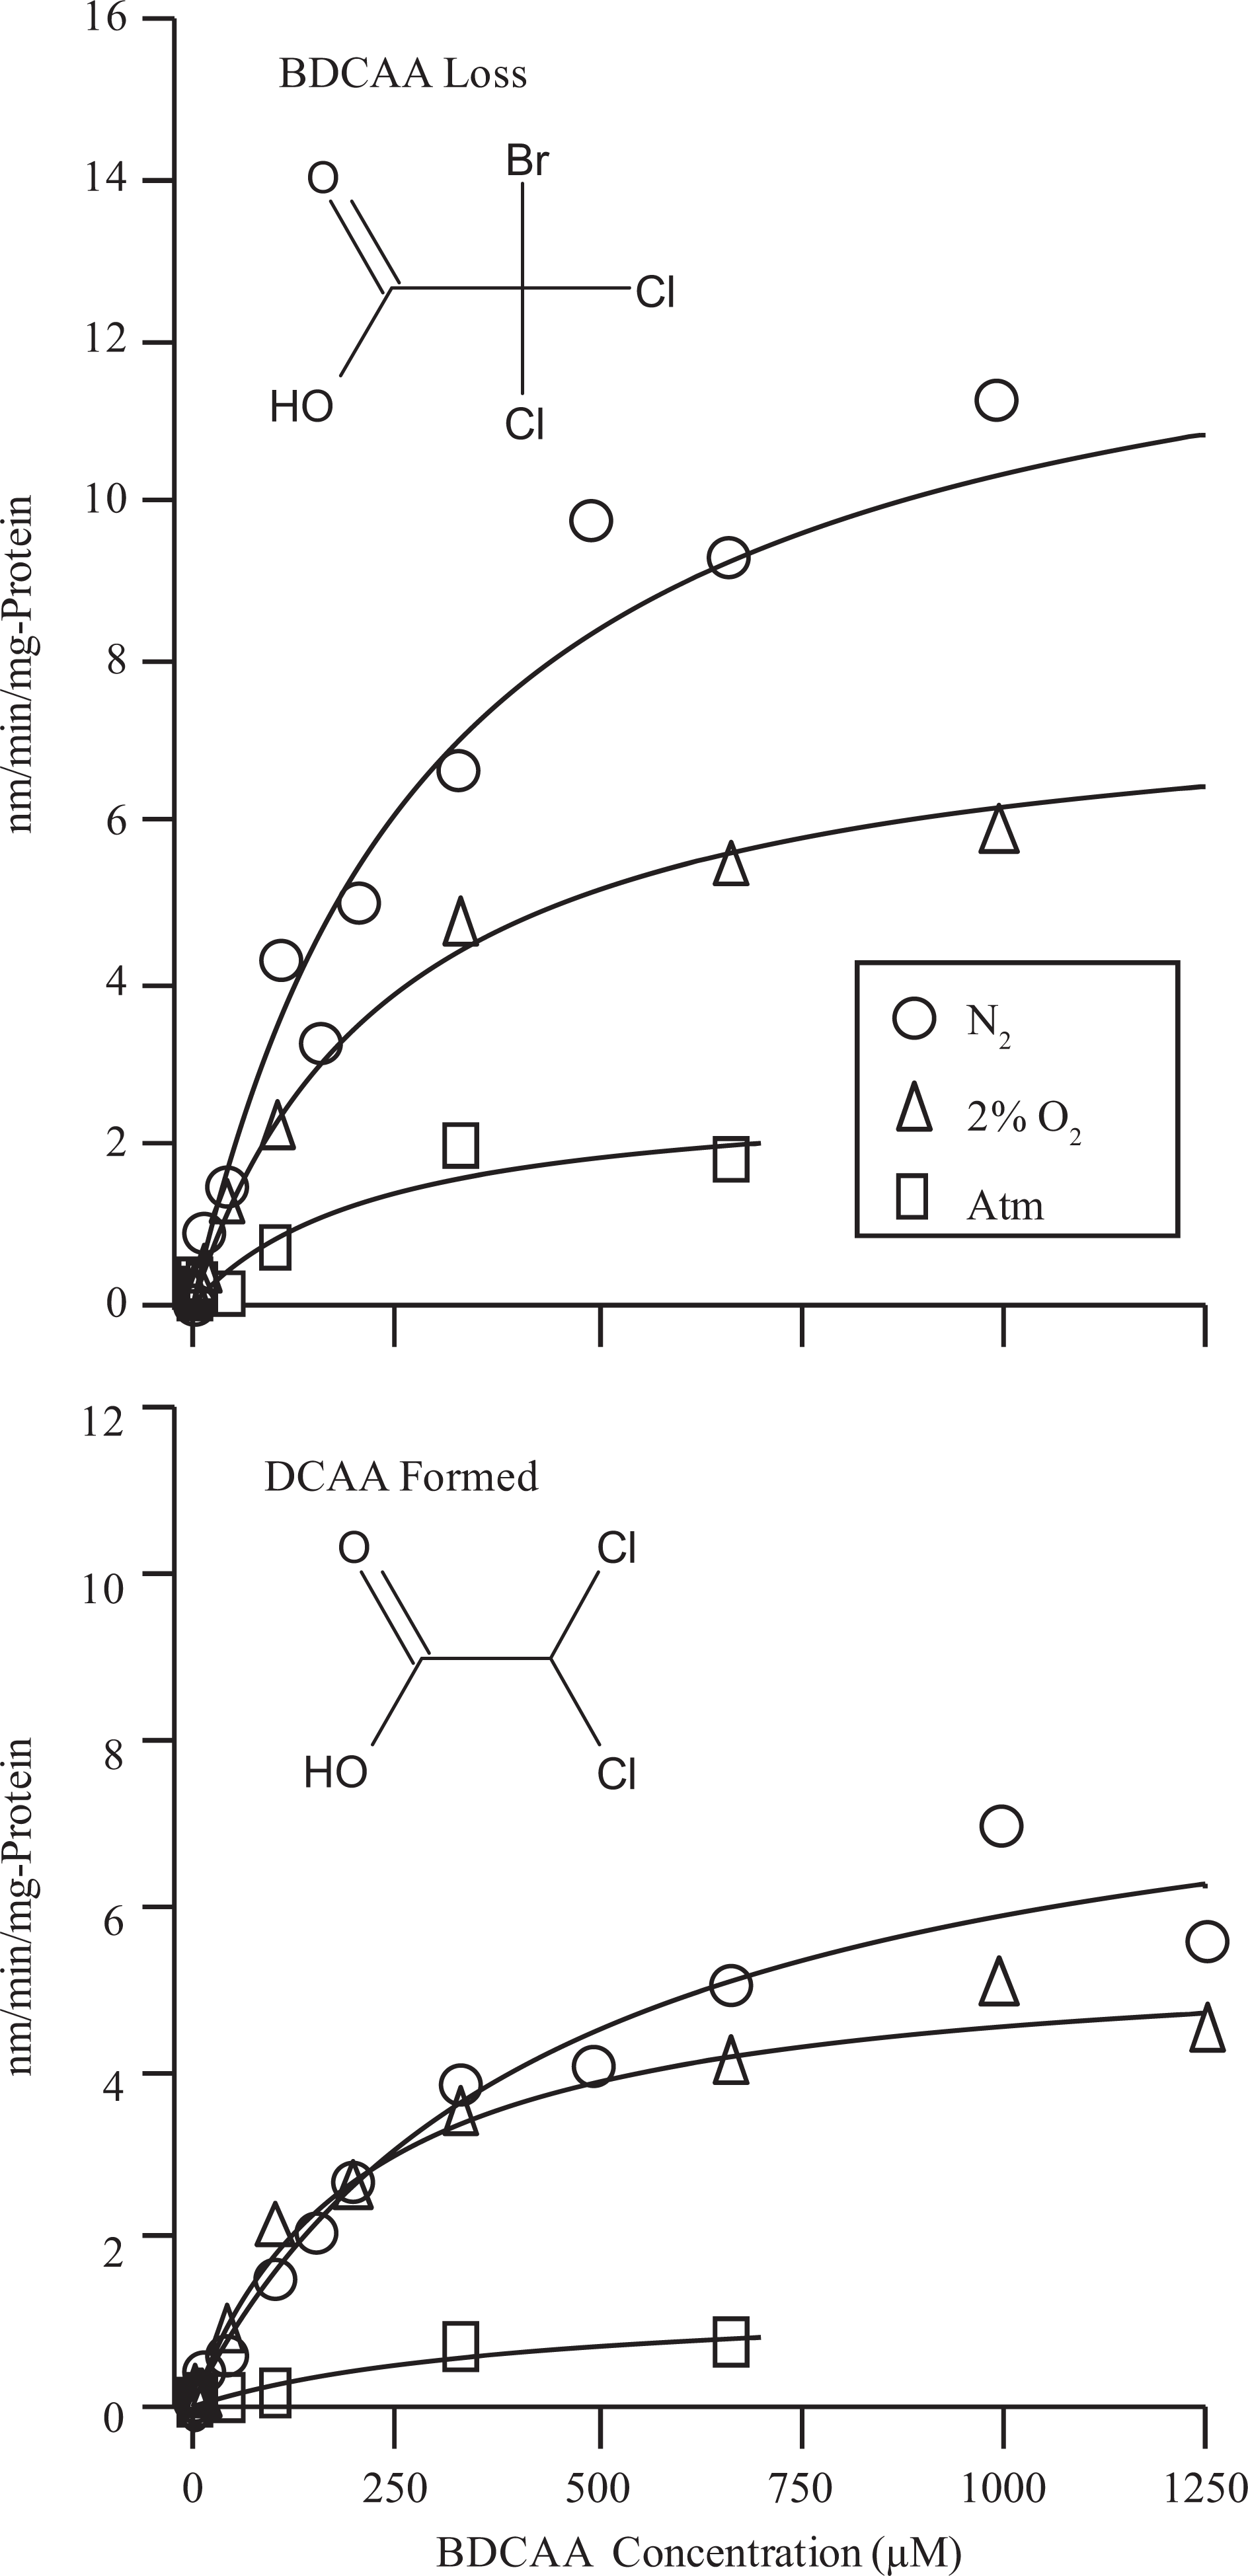
Effects of oxygen tension (ie, pure nitrogen, 2% oxygen, and atmospheric) on the rate of metabolism of BDCAA by rat liver microsomes (top row) and the formation of corresponding di-HAAs (bottom row). Each data point represents a mean of 3 experiments performed with pooled rat liver microsomes. Solid lines represent a nonlinear least squares fit of the observed data to the Michaelis–Menten equation. BDCAA indicates bromodichloroacetic acid; DCAA, dichloroacetic acid; HAAs halogenated acetic acids.
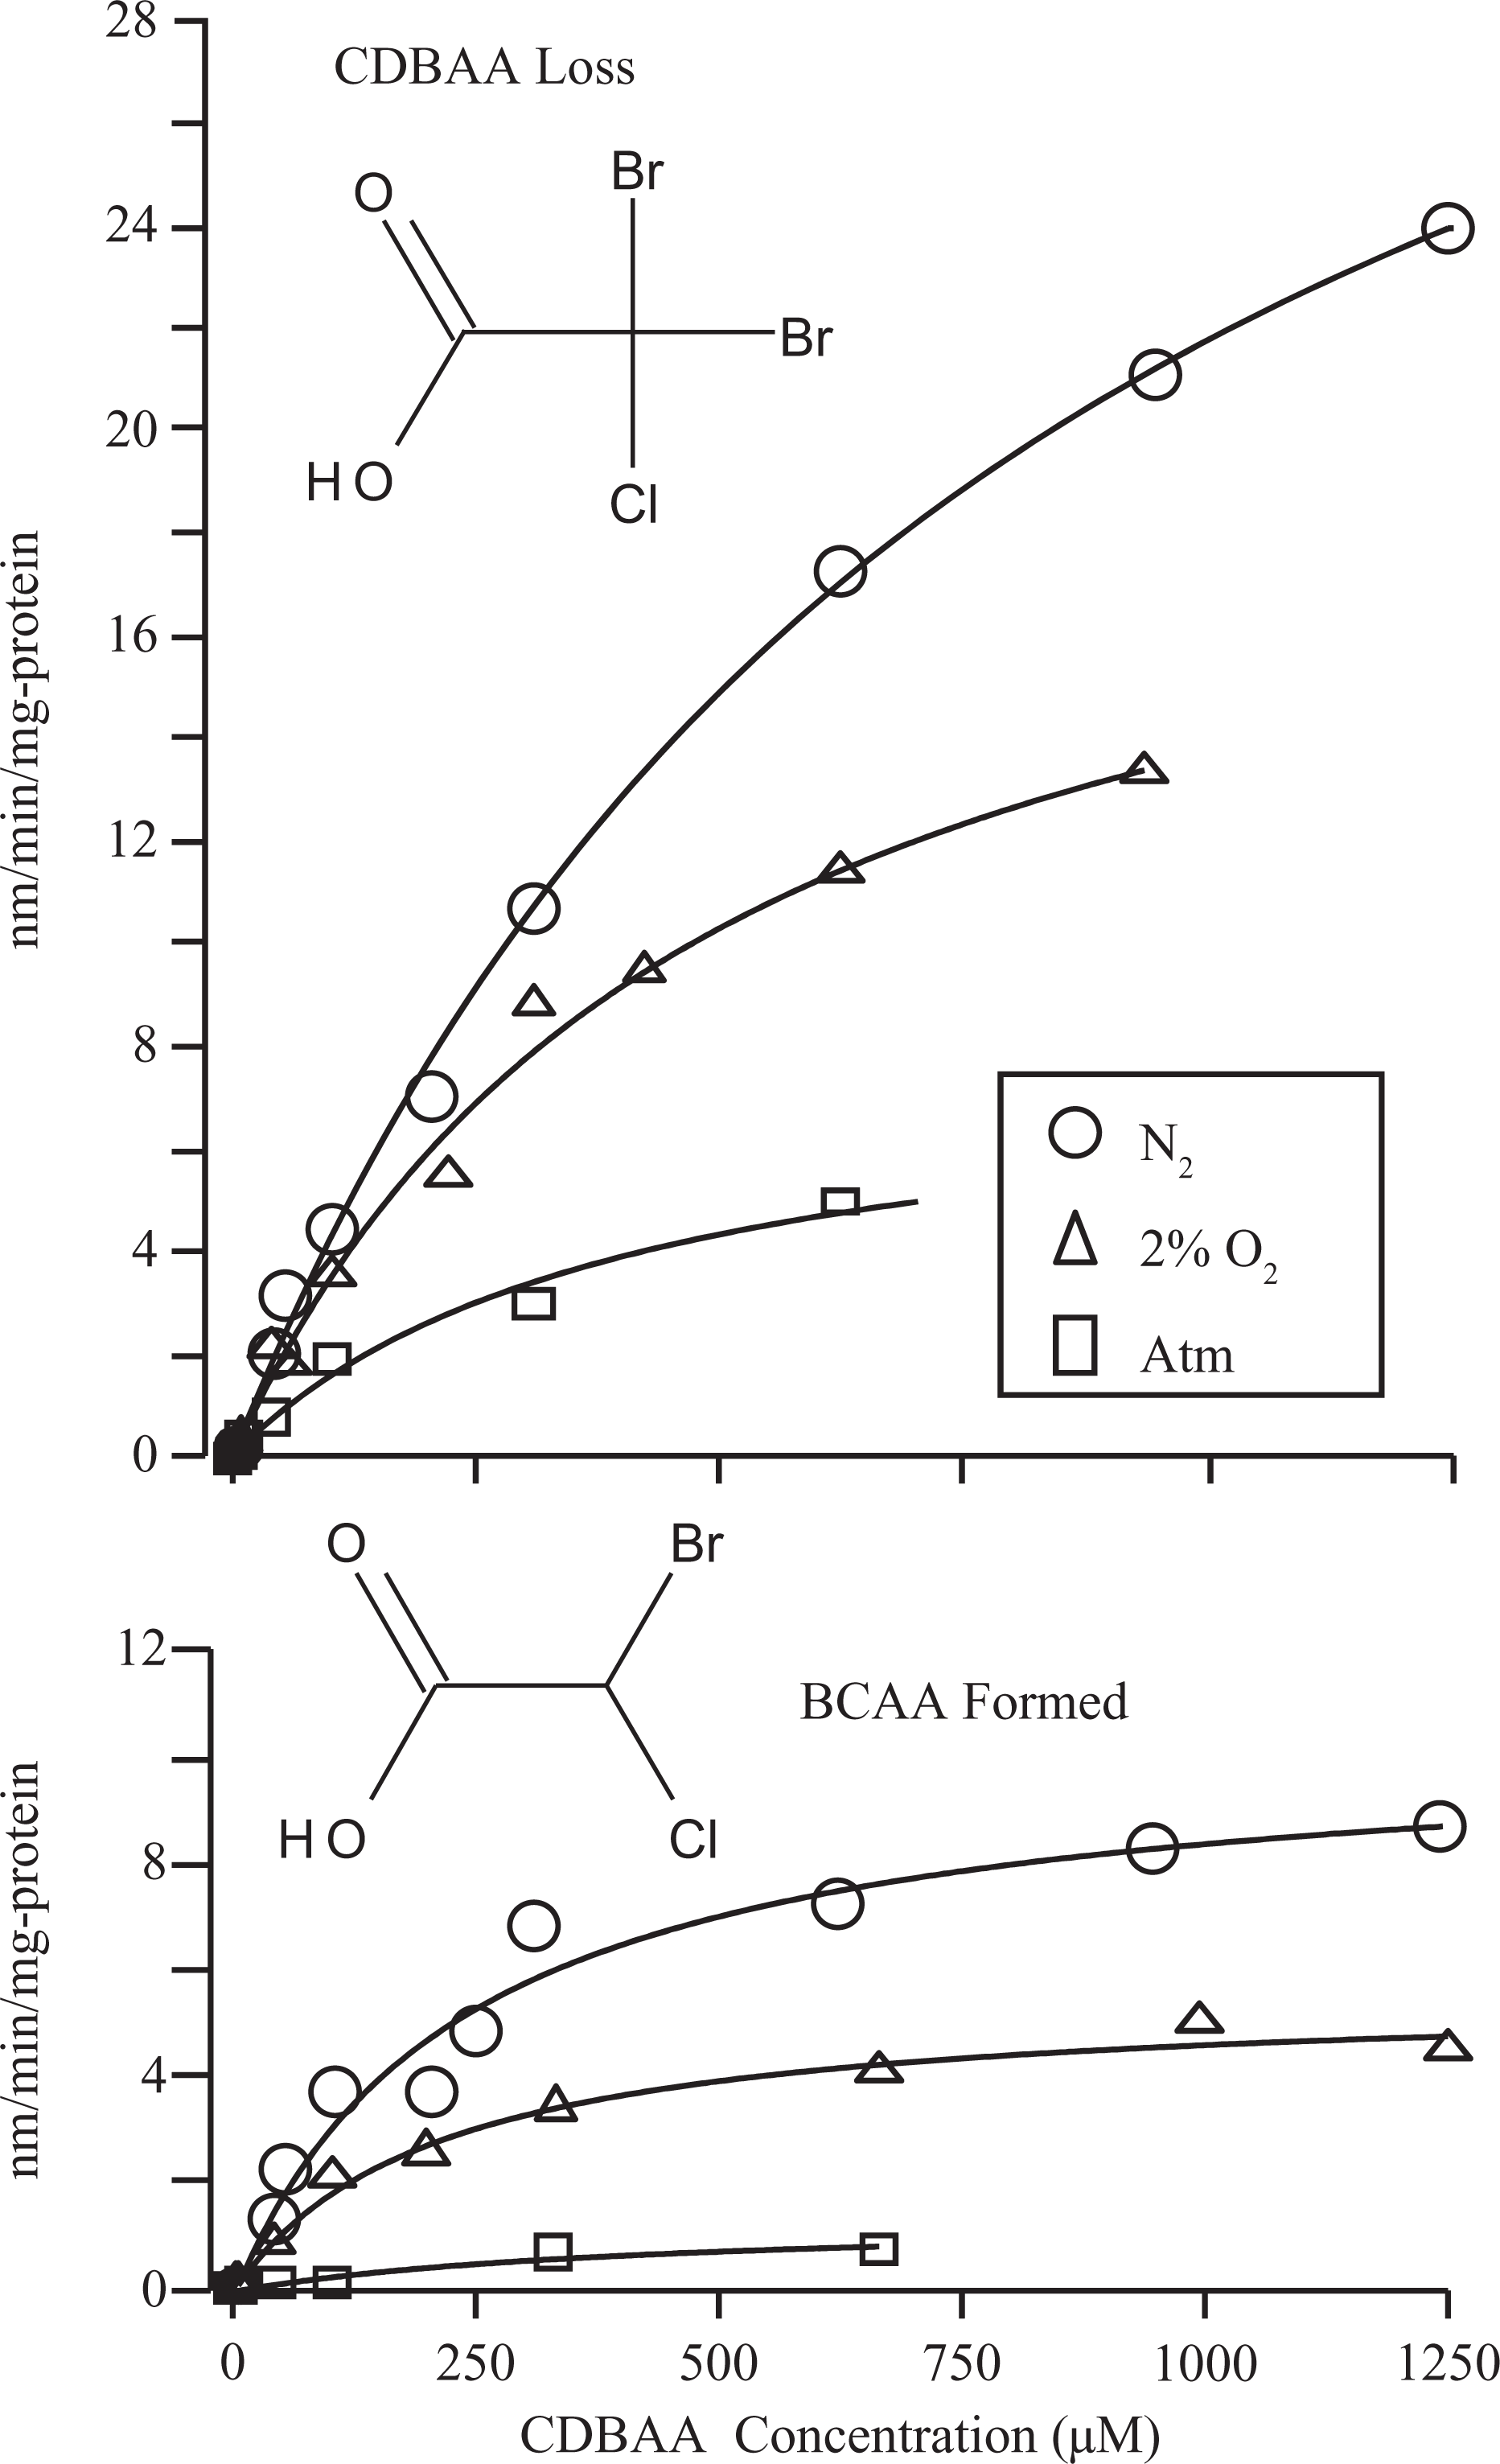
Effects of oxygen tension (ie, pure nitrogen, 2% oxygen, and atmospheric) on the rate of metabolism of CDBAA by rat liver microsomes (top row) and the formation of corresponding di-HAAs (bottom row). Each data point represents a mean of 3 experiments performed with pooled rat liver microsomes. Solid lines represent a nonlinear least squares fit of the observed data to the Michaelis-Menten equation. CDBAA indicates chlorodibromoacetic acid; BCAA, bromochloroacetic acid; HAAs halogenated acetic acids.
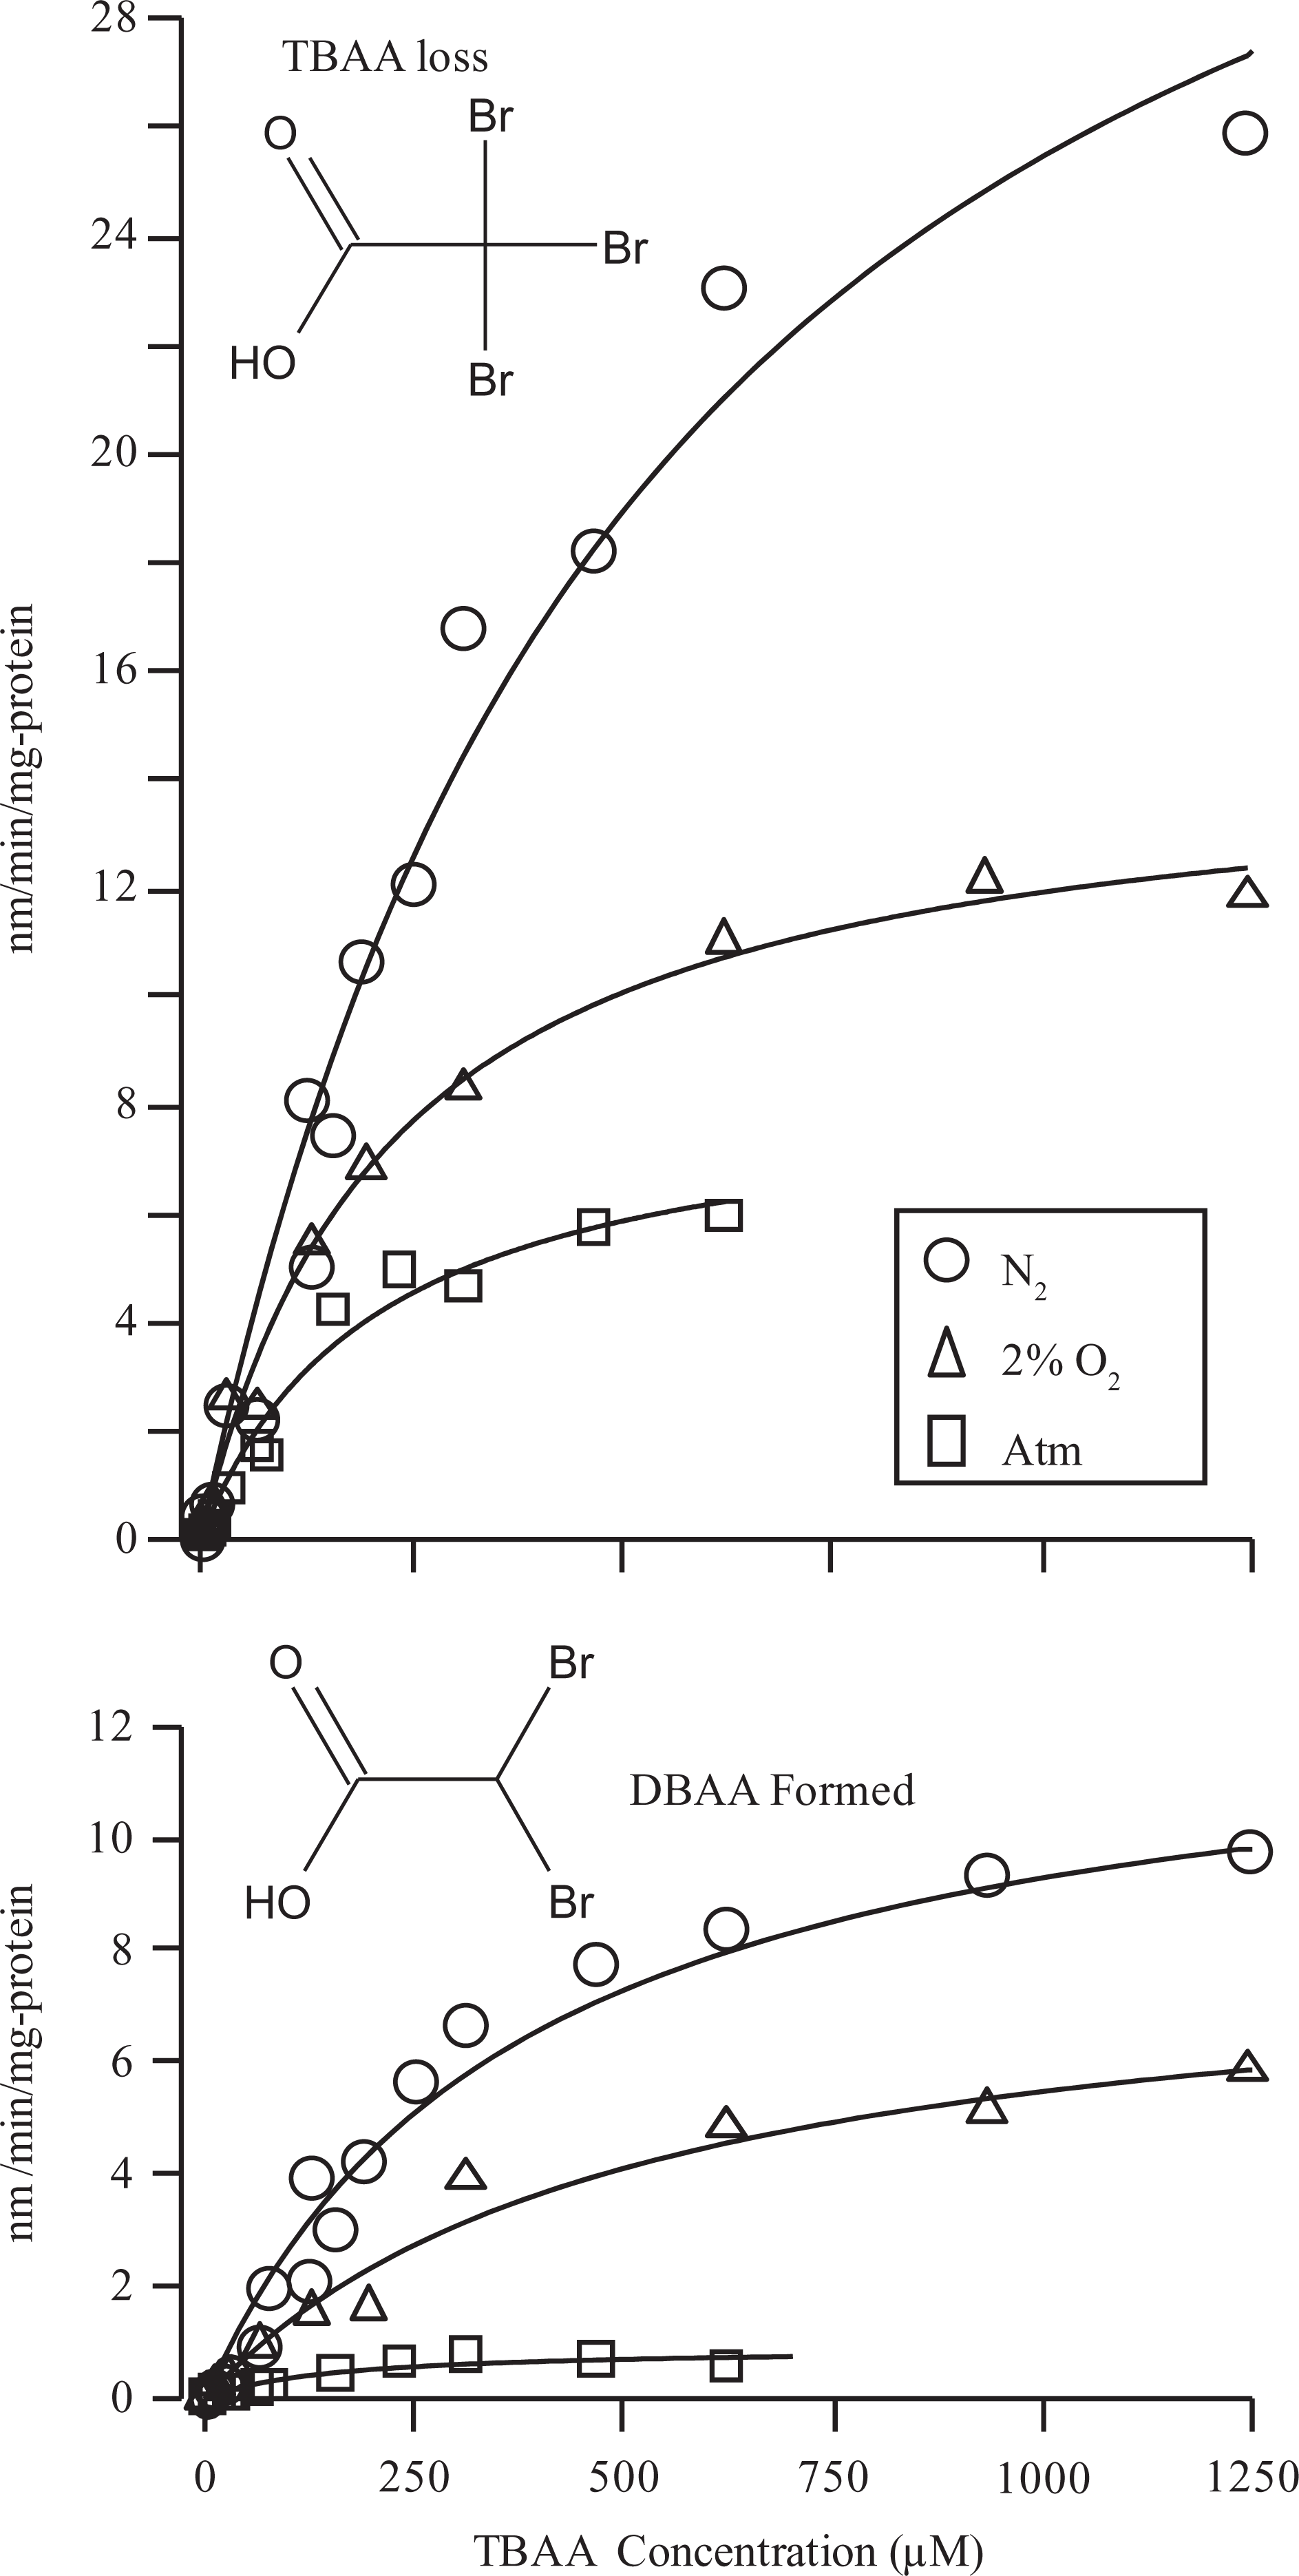
Effects of oxygen tension (ie, pure nitrogen, 2% oxygen, and atmospheric) on the rate of metabolism of TBAA by rat liver microsomes (top row) and the formation of corresponding di-HAAs (bottom row). Each data point represents a mean of 3 experiments performed with pooled rat liver microsomes. Solid lines represent a nonlinear least squares fit of the observed data to the Michaelis–Menten equation. TBAA indicates tribromoacetic acid; DBAA, dibromoacetic acid; HAAs halogenated acetic acids.
Kinetic Parameters of Trihaloacetate Metabolism in Rat Microsomes Under Different Atmospheric Conditions a
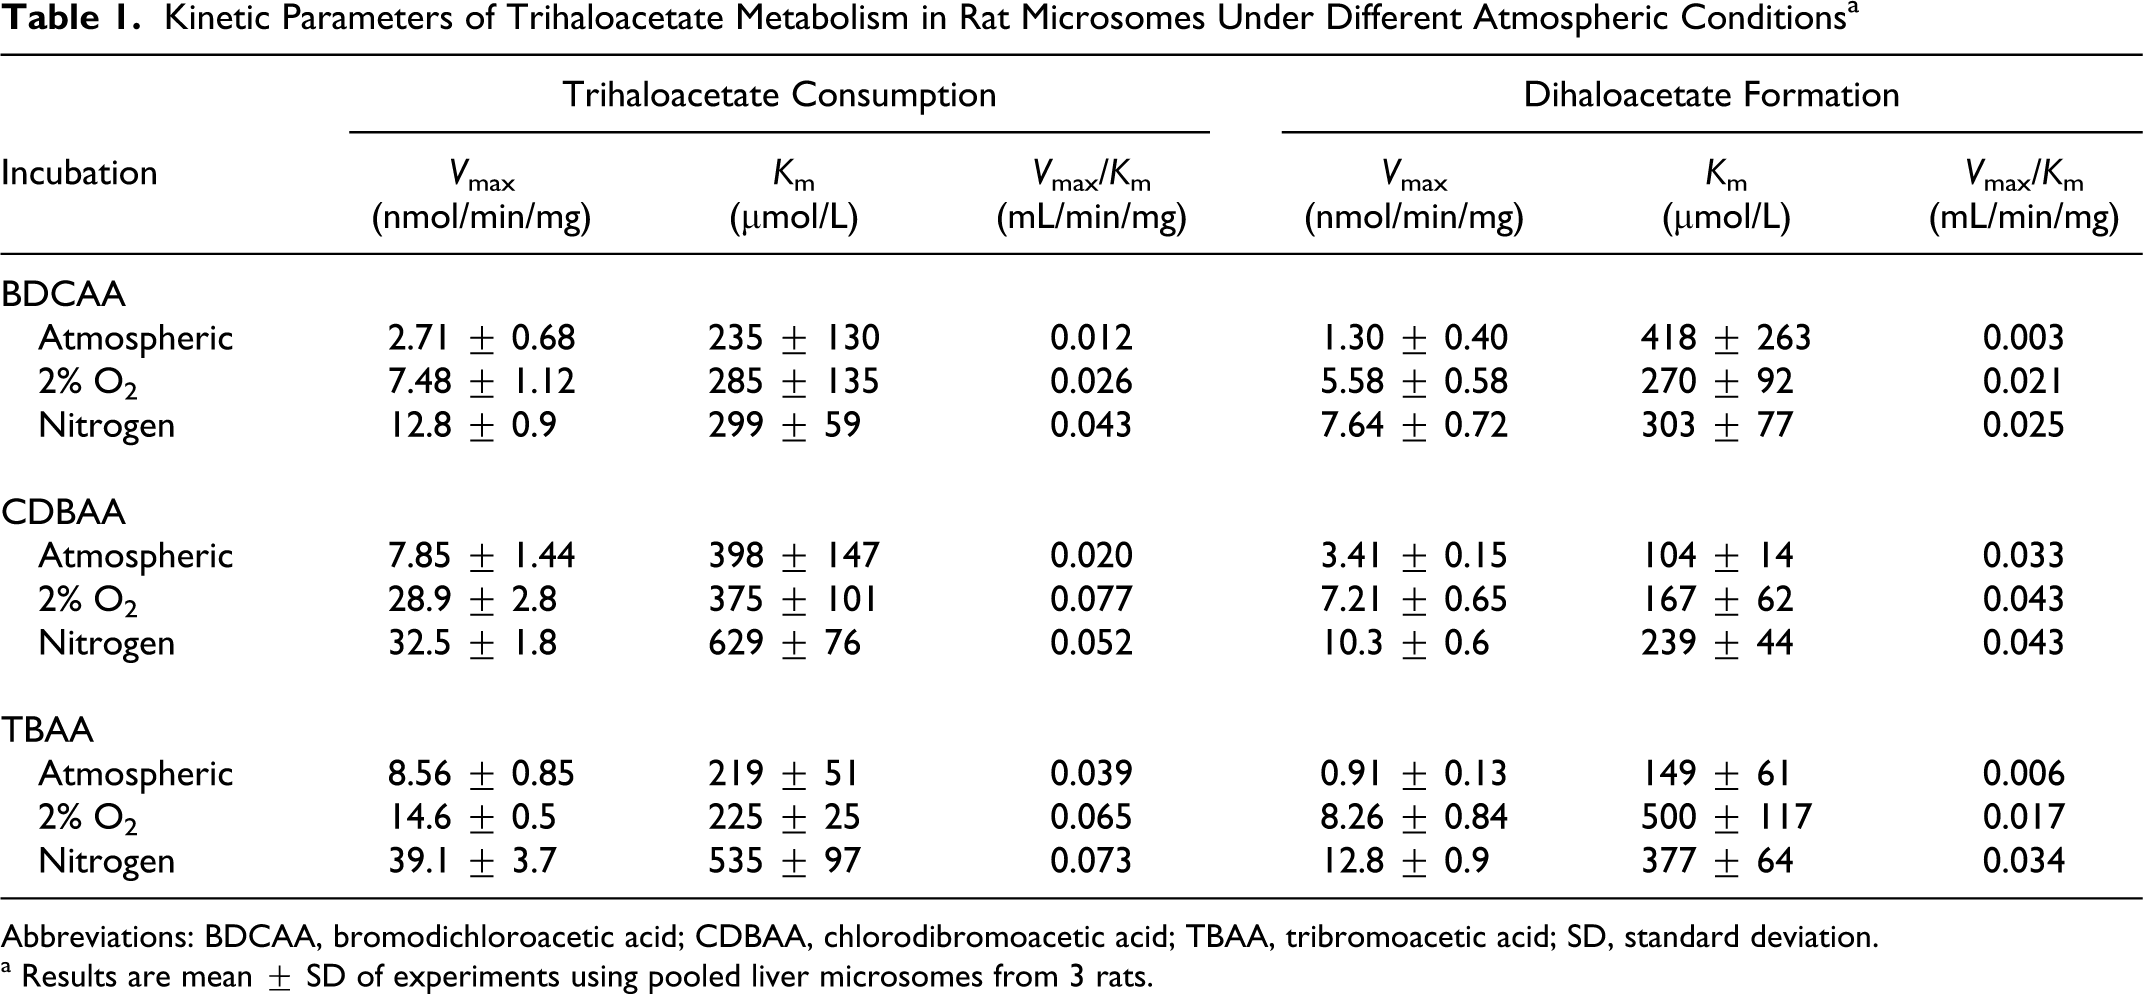
Abbreviations: BDCAA, bromodichloroacetic acid; CDBAA, chlorodibromoacetic acid; TBAA, tribromoacetic acid; SD, standard deviation.
a Results are mean ± SD of experiments using pooled liver microsomes from 3 rats.
Mass Balance Determinations of TBAA and CDBAA Metabolism in F344 Rat Microsomes
The apparent lack of mass balance between consumption of the tri-HAA and formation of the corresponding di-HAA metabolite prompted additional studies with CDBAA and TBAA to clarify whether additional metabolites were being formed. In the case of CDBAA, the formation of CDBM was monitored to determine whether de-carboxylation was occurring. For TBAA, free Br− and the oxidative metabolites glyoxylate and oxalate were determined. The results of these experiments are shown in Figures 4 and 5. During CDBAA incubations, the formation of CDBM was negligible. The total CDBM formed during the metabolic reaction was at most ˜3% of the amount of CDBAA consumed (Figure 4). The sum of the BCAA and CDBM formed accounted for only ˜50% of the total consumption of CDBAA (Figure 4). Thus, the lack of mass balance does not appear to be attributable to decarboxylation and the formation of a volatile metabolite (CDBM) which could be lost from the system.
Metabolism of CDBAA to BCAA and CDBM by the rat liver microsomes, under N2 headspace, showing the loss of substrate is not accounted for by summing the metabolized analyzed using the method of extraction and GC analysis used in this study. The initial concentration of CDBAA was 300 μmol/L. Data are the mean ± SE (n = 3 experiments using pooled rat liver microsomes). CDBAA indicates chlorodibromoacetic acid; BCAA, bromochloroacetic acid; CDBM, chlorodibromomethane; SD, standard deviation.
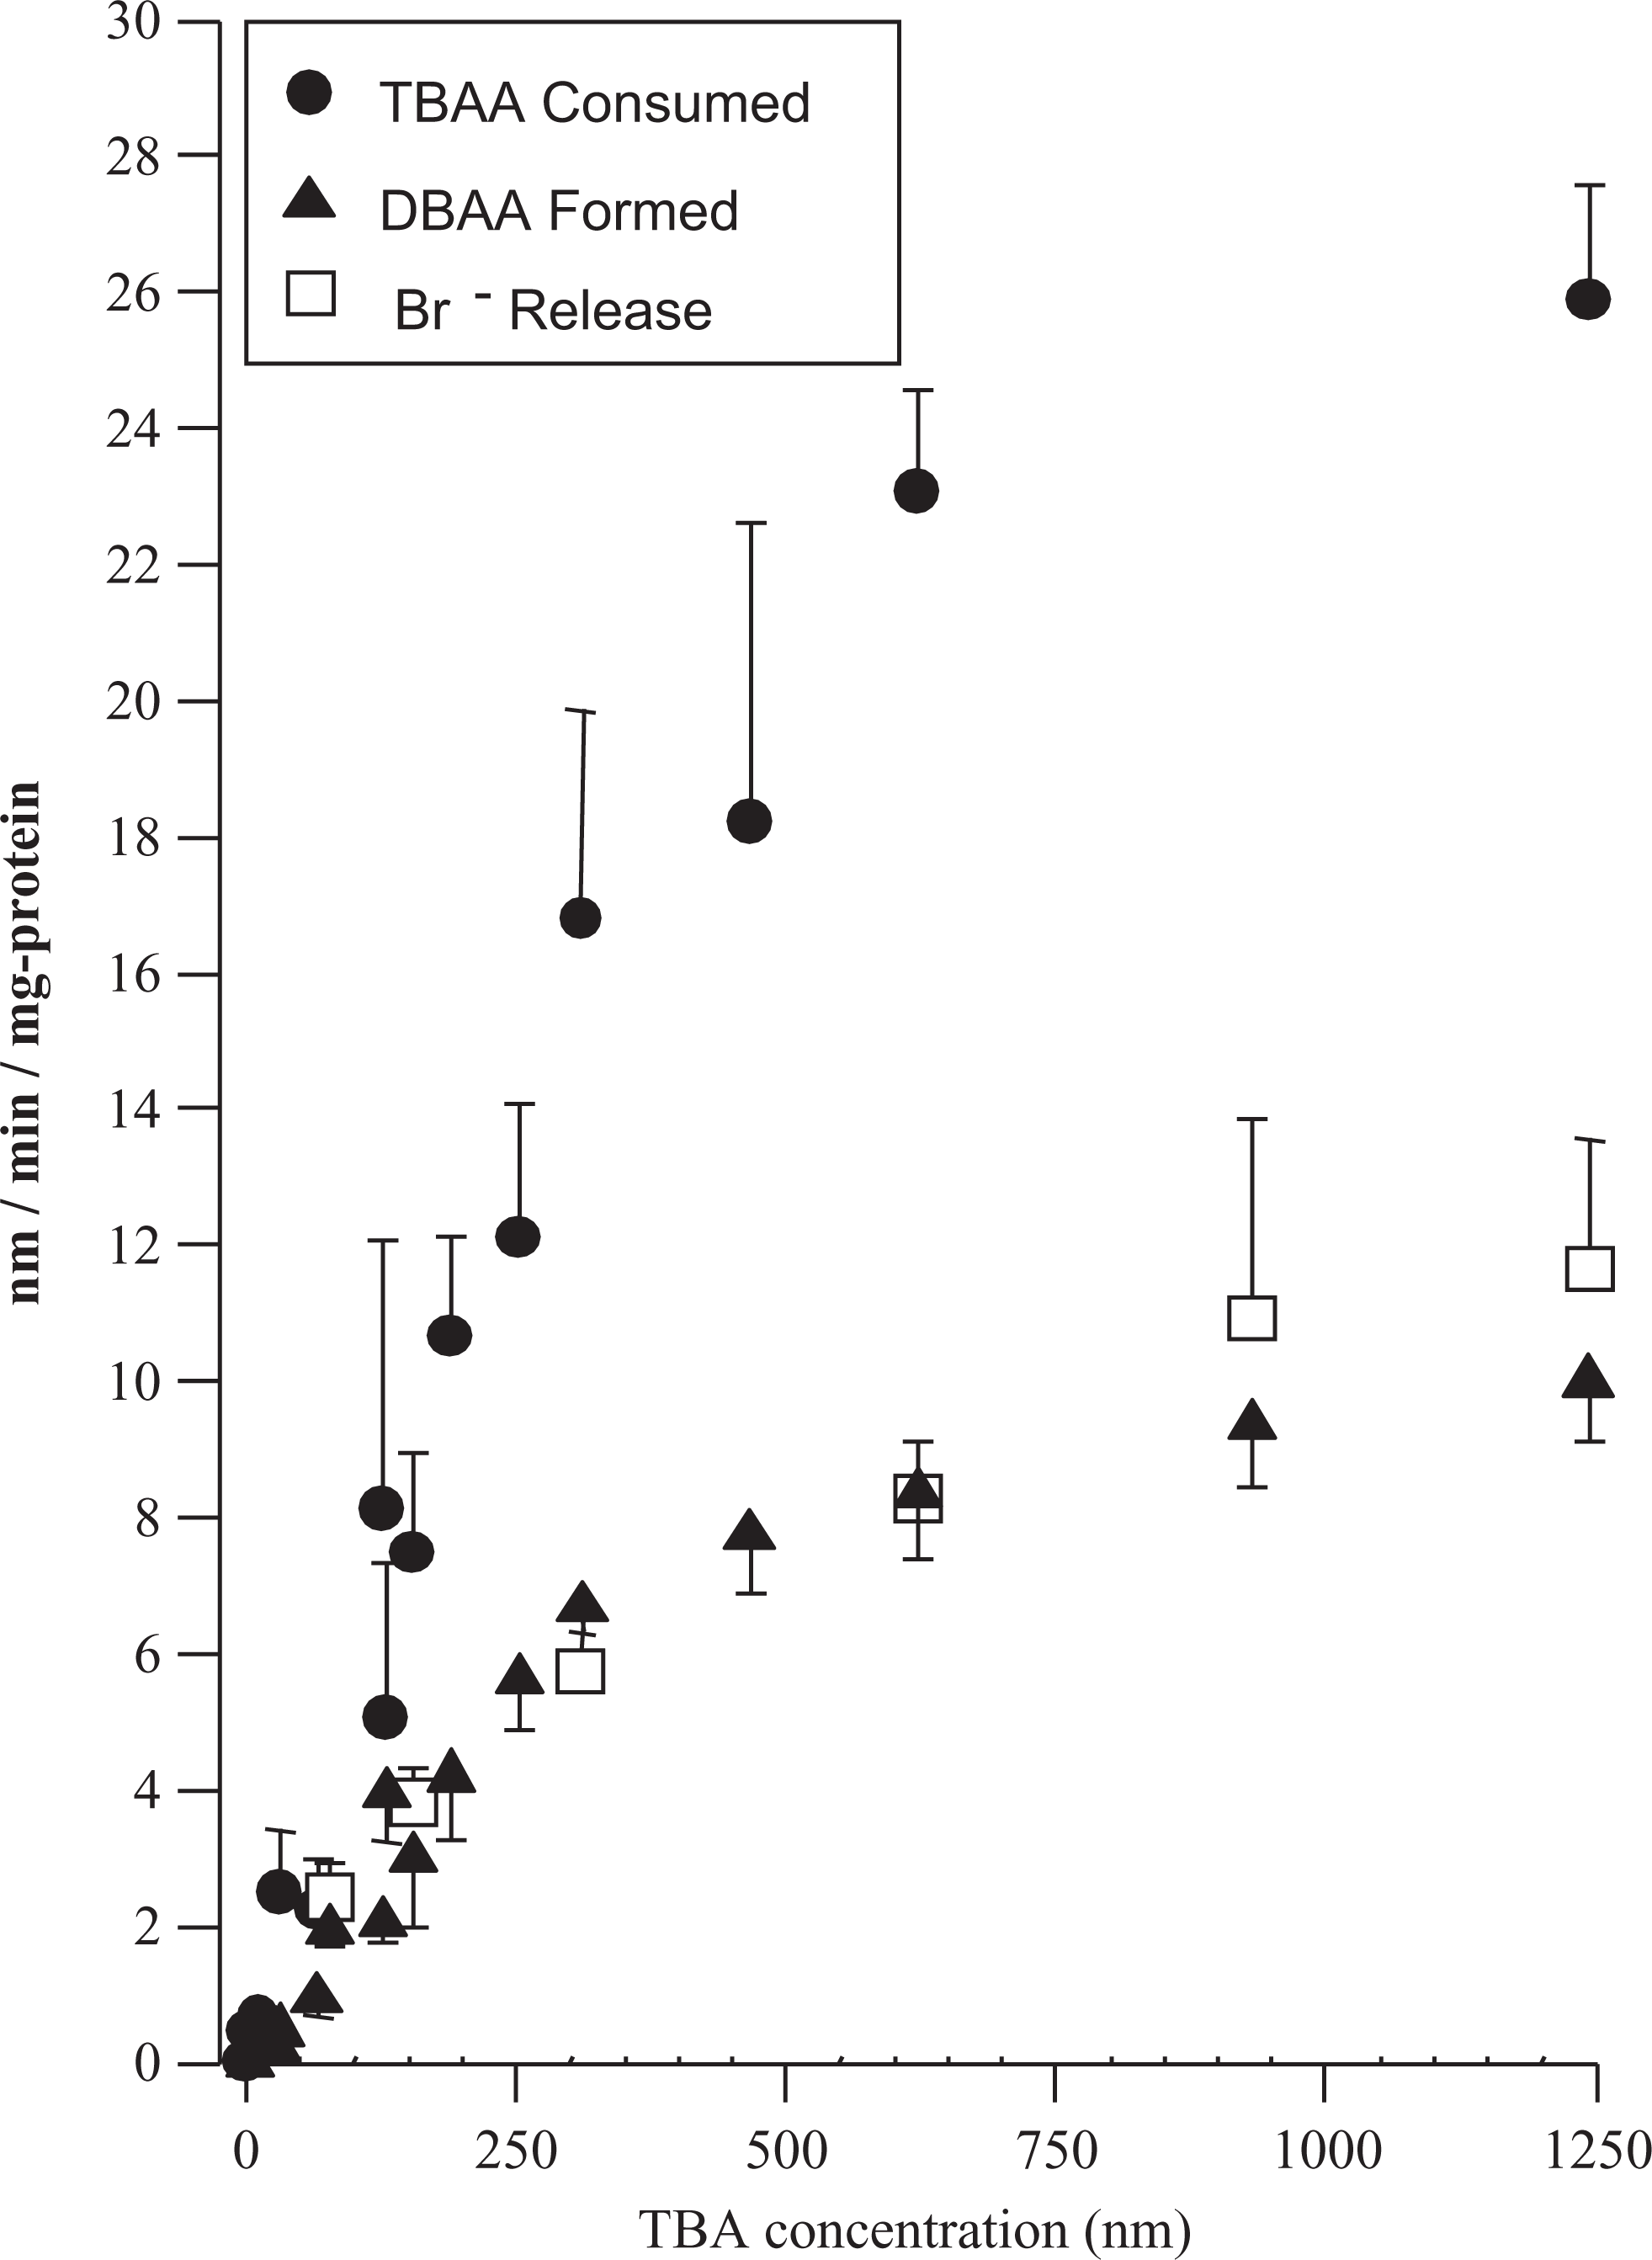
Rat liver microsomal metabolism of TBAA to DBAA and release of Br− into the incubation solution. Experiments were conducted under N2 headspace. Data are the mean ± SE (n = 3 experiments using pooled rat liver microsomes). TBAA indicates tribromoacetic acid; DBAA, dibromoacetic acid; SD, standard deviation.
During TBAA incubations, the amount of liberated Br− was produced in a 1:1 molar ratio with the formation of DBAA (Figure 5). Also, the amount of DBAA formed accounted for only ˜50% of the consumption of TBAA (Figure 5). The formation of glyoxylate or oxalate was not detected during these incubations (data not shown). These results indicate that only one Br− is liberated during the microsomal metabolism of TBAA and corresponds to the amount of DBAA formed. If additional metabolism of either TBAA or DBAA was occurring to glyoxylate or oxalate, then a greater molar quantity of liberated Br− would have been expected. These results suggest the fraction of TBAA that is unaccounted for retains at least 1 or perhaps 2 of the Br− molecules on TBAA.
Inhibition of CDBAA Metabolism in Male F344 Rat Liver Microsomes
The effects of various nonspecific inhibitors and incubation conditions on CDBAA metabolism are shown in Figure 6. The metabolism of CDBAA was most effectively blocked by DPI, an inhibitor of microsomal NADPH-dependent P450 reductase. Preincubation of microsomes with CO (a nonspecific inhibitor of P450) substantially reduced CDBAA metabolism although not to the extent observed with DPI (Figure 6). It is interesting to note that during the reduced oxygen incubations with DPI and CO, the formation of BCAA was more strongly inhibited than the overall consumption of CDBAA (Figure 6). Heating the microsomes for 2 minutes at 45°C to 50°C (a treatment that reduces flavin monooxygenase activity; FMO) failed to inhibit the metabolism of CDBAA, indicating that either FMO plays minor role or in the absence of FMO enzymes P450 compensates the loss of metabolism. Incubations with 1 μmol/L NOA, a nonspecific competitive P450 inhibitor, failed to inhibit the metabolism of CDBAA (data not shown).
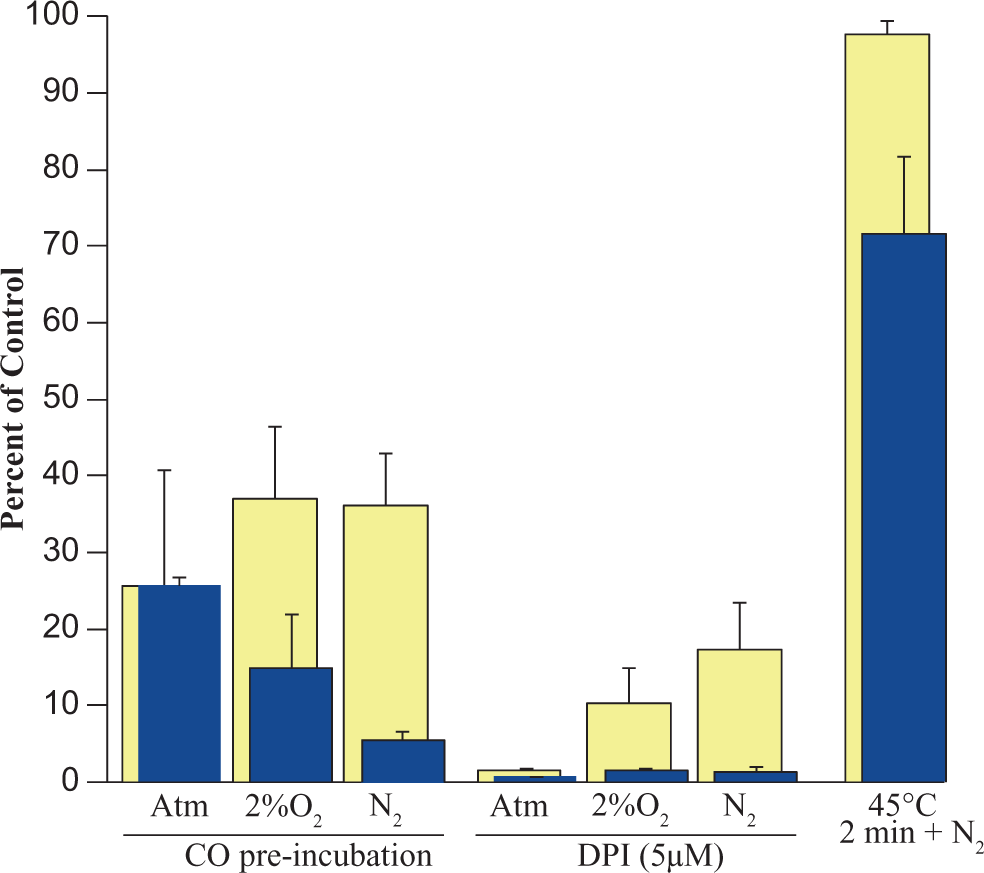
Rat liver microsomal metabolism of CDBAA under normoxic, 2% O2 or N2 headspace showing impact of nonspecific CYP P450 inhibitors or treatments. Light-colored bars show the loss of CDBAA and dark-colored bars represent the BCAA formed. The initial concentration of CDBAA was 300 μmol/L. Data are the mean ± SE (n = 3 experiments using pooled rat liver microsomes). CDBAA indicates chlorodibromoacetic acid; BCAA, bromochloroacetic acid; SD, standard deviation.
Metabolism of CDBAA in cDNA-Expressed P450 Reductase and Supersomes
Chlorodibromoacetic acid was metabolized by both recombinantly expressed rat and human P450 reductase; however, the formation of BCAA accounted for <50% of the consumption of CDBAA (Figure 7). Chlorodibromoacetic acid was metabolized by the mixture of recombinantly expressed human P450 isoforms (CYP1A2, 2C8, 2C9, 2C19, 2D6, and 3A4) and the formation of BCAA appeared to account for the consumption of CDBAA (Figure 7).
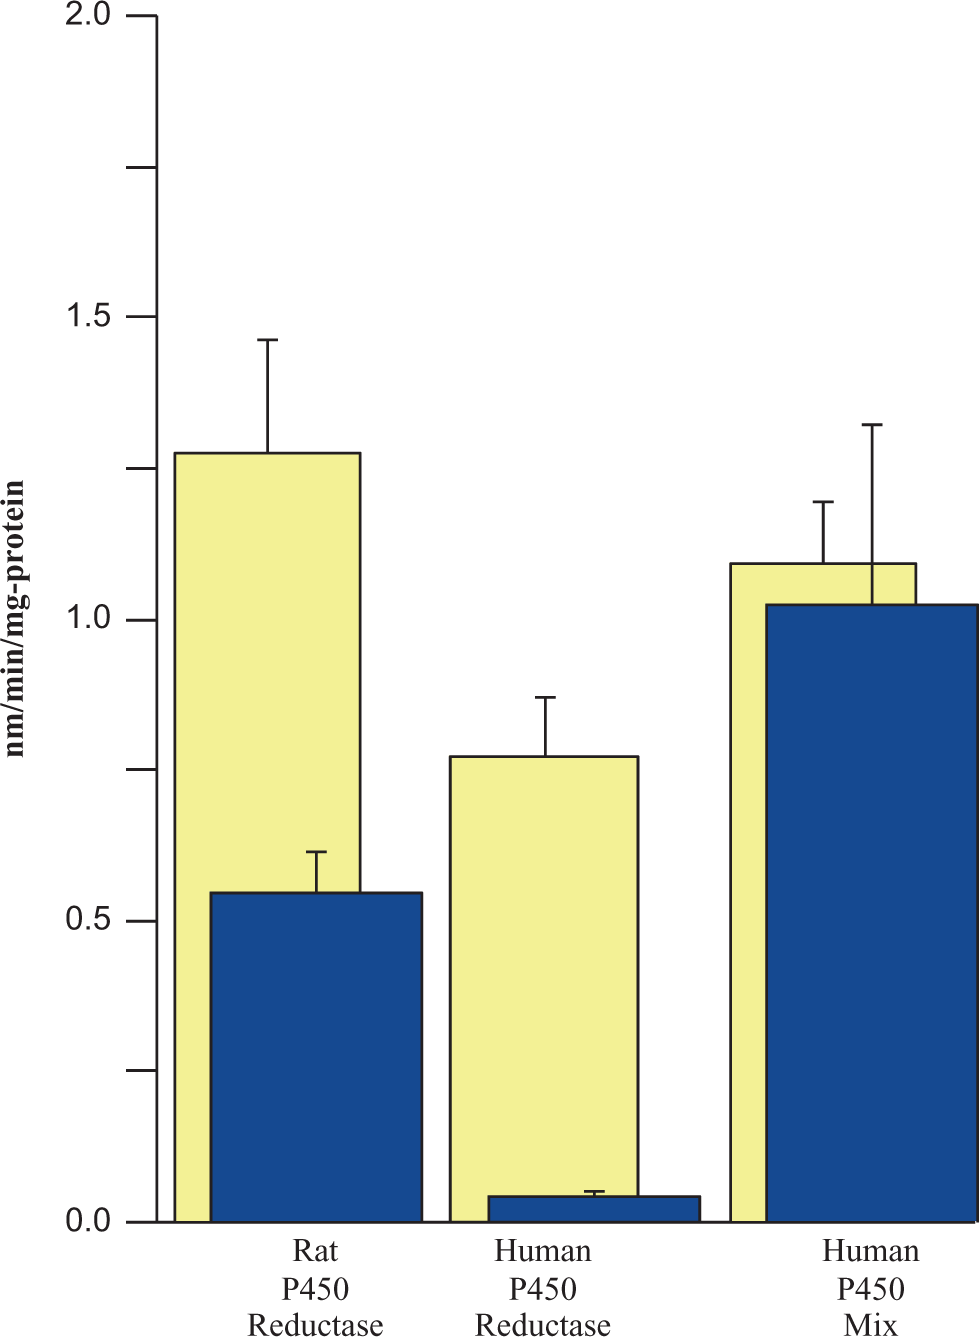
Metabolism of CDBAA using cDNA expressed rat and human P450 reductase and a mixture of human CYPs (1A2, 2C8, 2C9, 2C19, 2D6, and 3A4). The initial concentration of CDBAA was 150 μmol/L and incubations were carried out under N2 headspace. Light-colored bars show the loss of CDBAA and dark-colored bars represent the BCAA formed. Data are the mean ± SE (n = 3 experiments). CDBAA indicates chlorodibromoacetic acid; BCAA, bromochloroacetic acid; cDNA, complementary DNA; SD, standard deviation.
Role of CYP Isoforms in CDBAA Metabolism in Rat, Mouse, and Human Liver Microsomes
Experiments seeking to define the CYP isoform specificity of CDBAA metabolism are shown in the supplement figures. Incubations of rat liver microsomes with various chemical inhibitors of P450 suggested that the most effective of these was DDC (inhibitor of 2E1), which reduced CDBAA metabolism and formation of BCAA by 60% to 80%. Other inhibitors such as TAO (inhibitor of 3A4), SPZ (inhibitor of 2C9/2C10), CZN (inhibitor of 2E1), and QND (inhibitor of 2D6) caused 20% to 50% reduction in metabolism of CDBAA (Supplement Figure 1). This result was the motivation for 2 additional experiments to better clarify the importance of the CYP 2E1 in CDBAA metabolism in liver microsomes. In Supplement Figure 2A, the results of immunoinhibition tests using human liver microsomes incubated with CDBAA in the presence and absence of anti[human]-CYP 2E1 antibodies are shown. Coincubation with the anti-2E1 antibodies decreased the metabolism of CDBAA when compared to incubations in the absence of anti-2E1 antibodies. The consumption of CDBAA in the absence of anti-2E1 antibodies was ˜53%; whereas, only ˜20% was consumed when anti-2E1 antibodies added to the microsomal incubations (Supplement Figure 2A). All of the consumed CDBAA from the microsomal incubations with and without immunoinhibition appeared to be converted into BCAA on an equimolar basis. In contrast to the findings with the immunoinhibition studies, there appeared to be no difference in the rate of metabolism of CDBAA in mouse liver microsomes prepared from CYP 2E1−/− (KO) or +/+ (WT) mice (Supplement Figure 2B). The consumption of CDBAA by the 2E1 KO and WT liver microsomes was almost equal, 51% and 54%, respectively (Supplement Figure 2B).
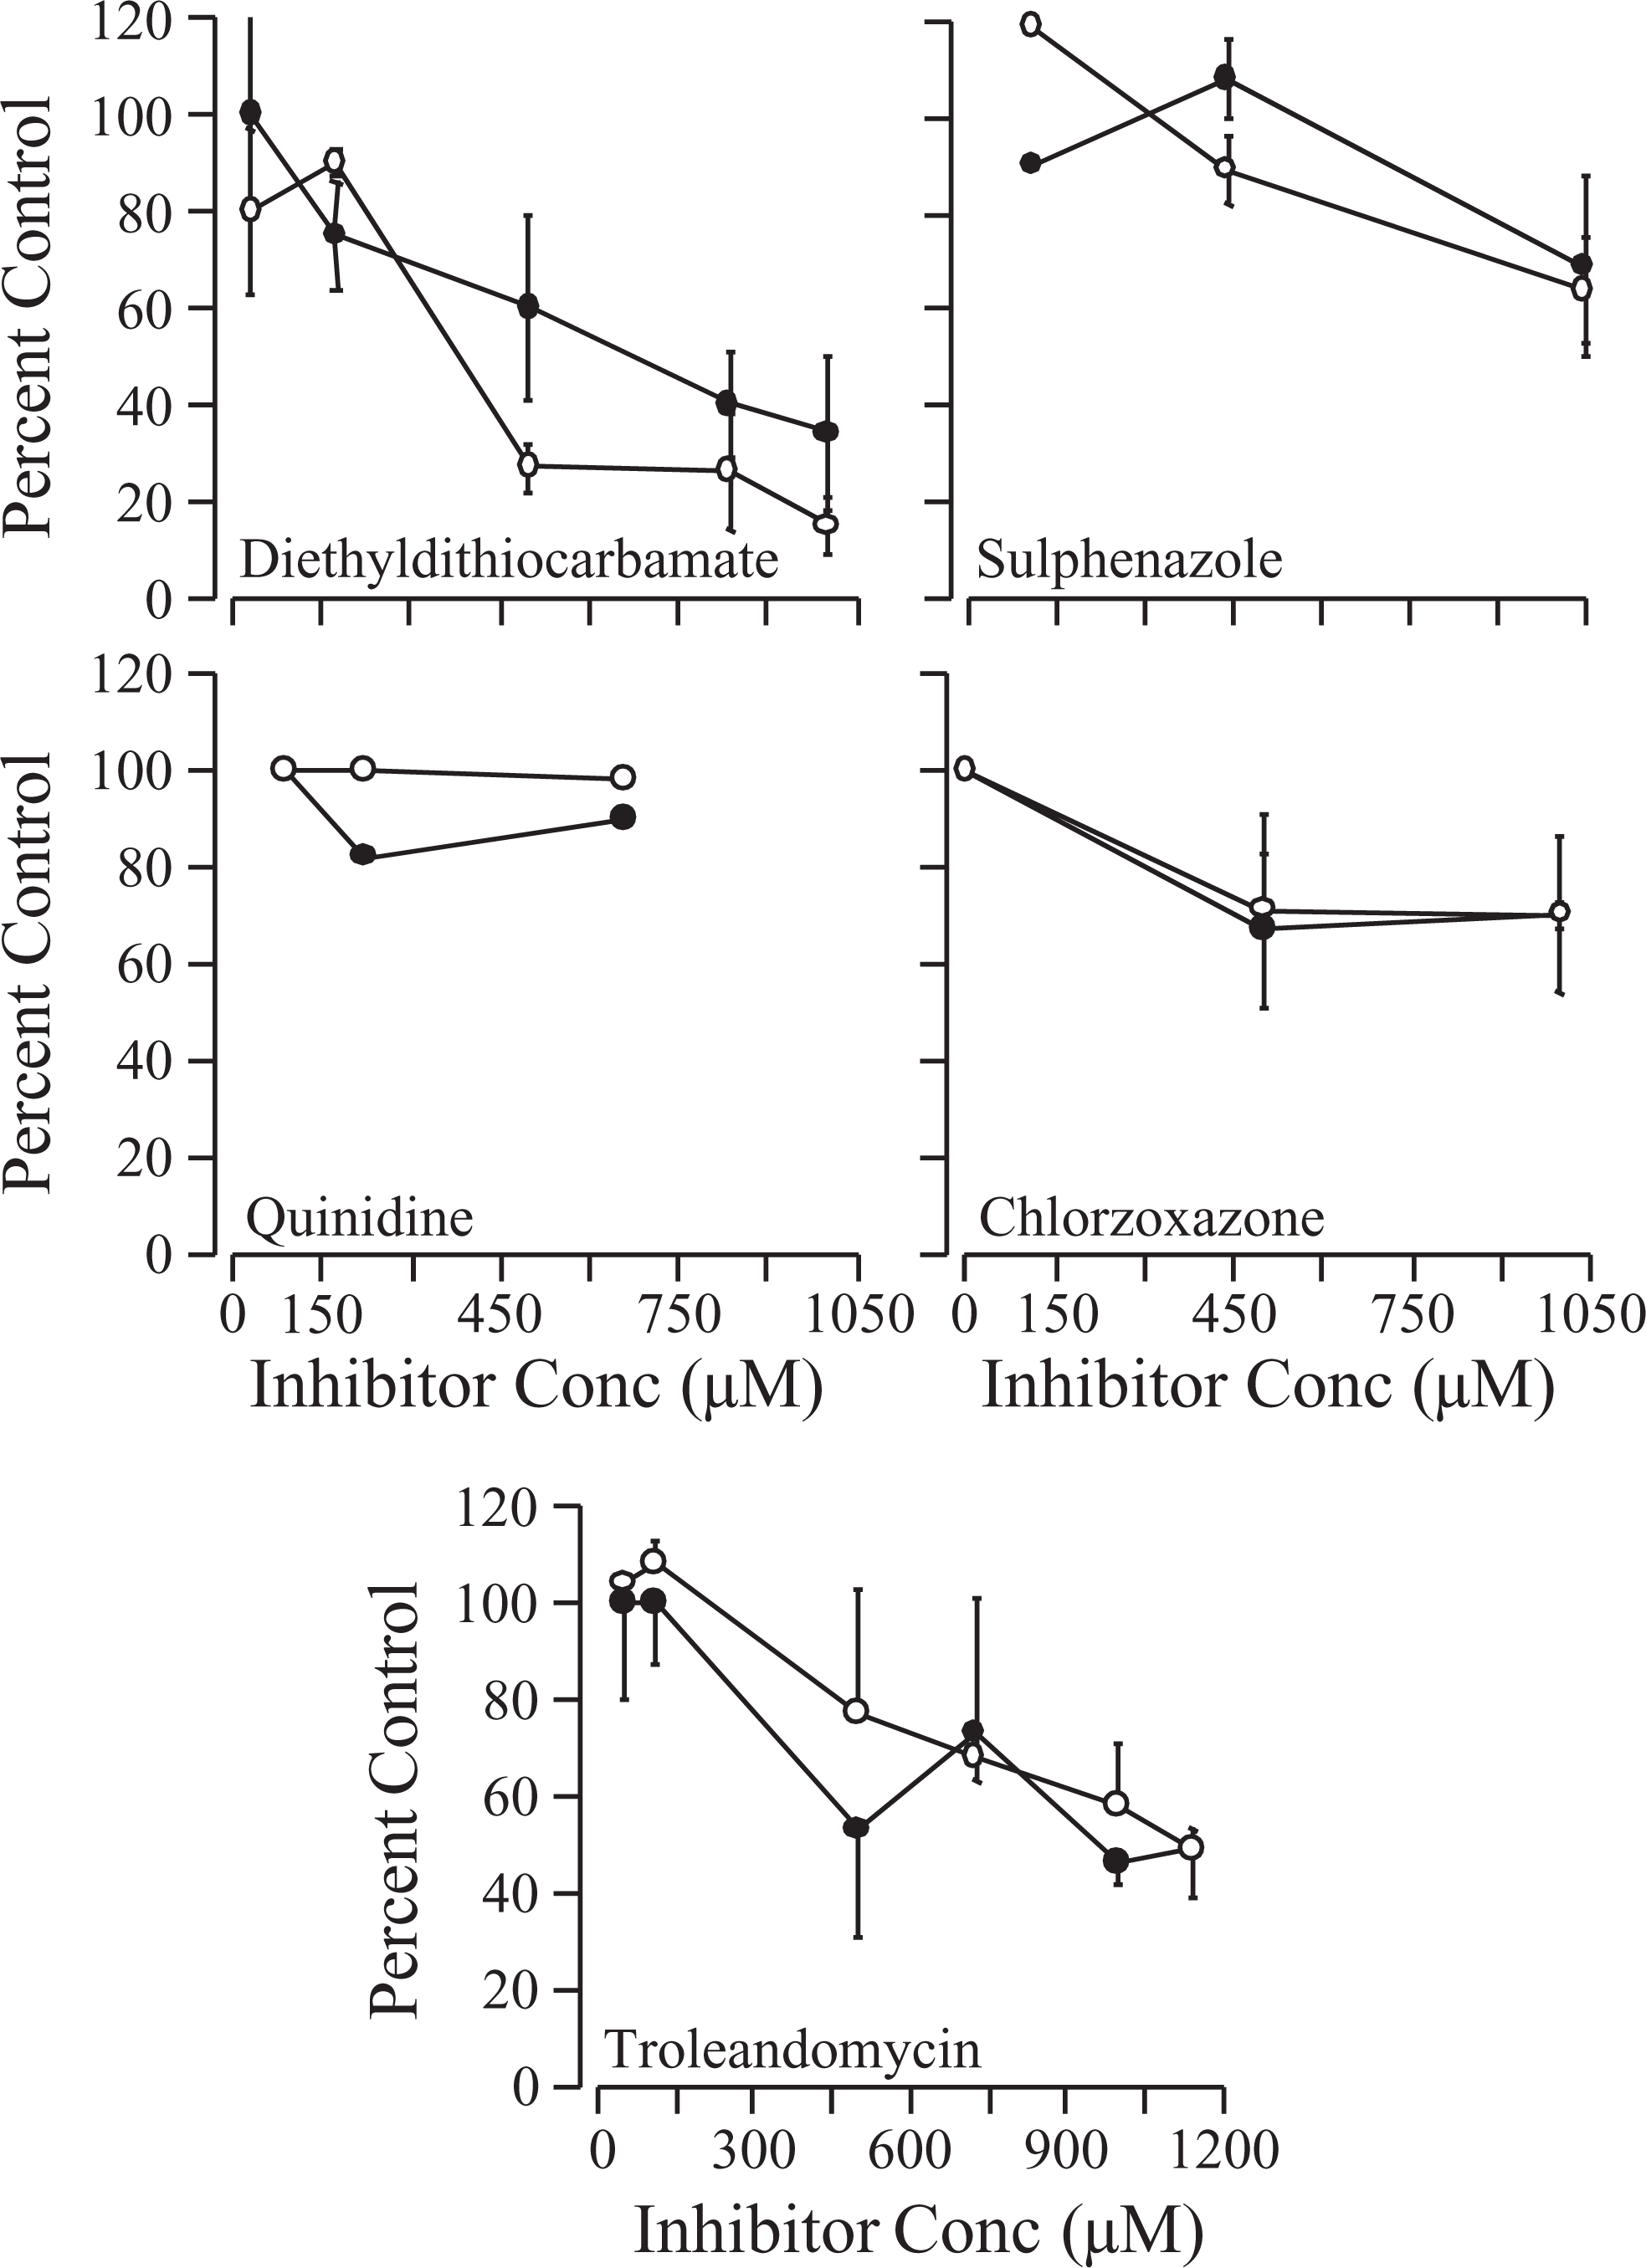
Metabolism of CDBAA in male rat microsomes in the presence of various isoform-selective CYP P450 inhibitors. Reactions were performed under N2 headspace. The initial concentration of CDBAA was 750 μmol/L. White circles are consumption of CDBAA and black circles represent BCAA formed (both as % of control values). Data are the mean ± SE of 3 to 4 experiments performed with pooled rat liver microsomes. CDBAA indicates chlorodibromoacetic acid; BCAA, bromochloroacetic acid; SD, standard deviation.
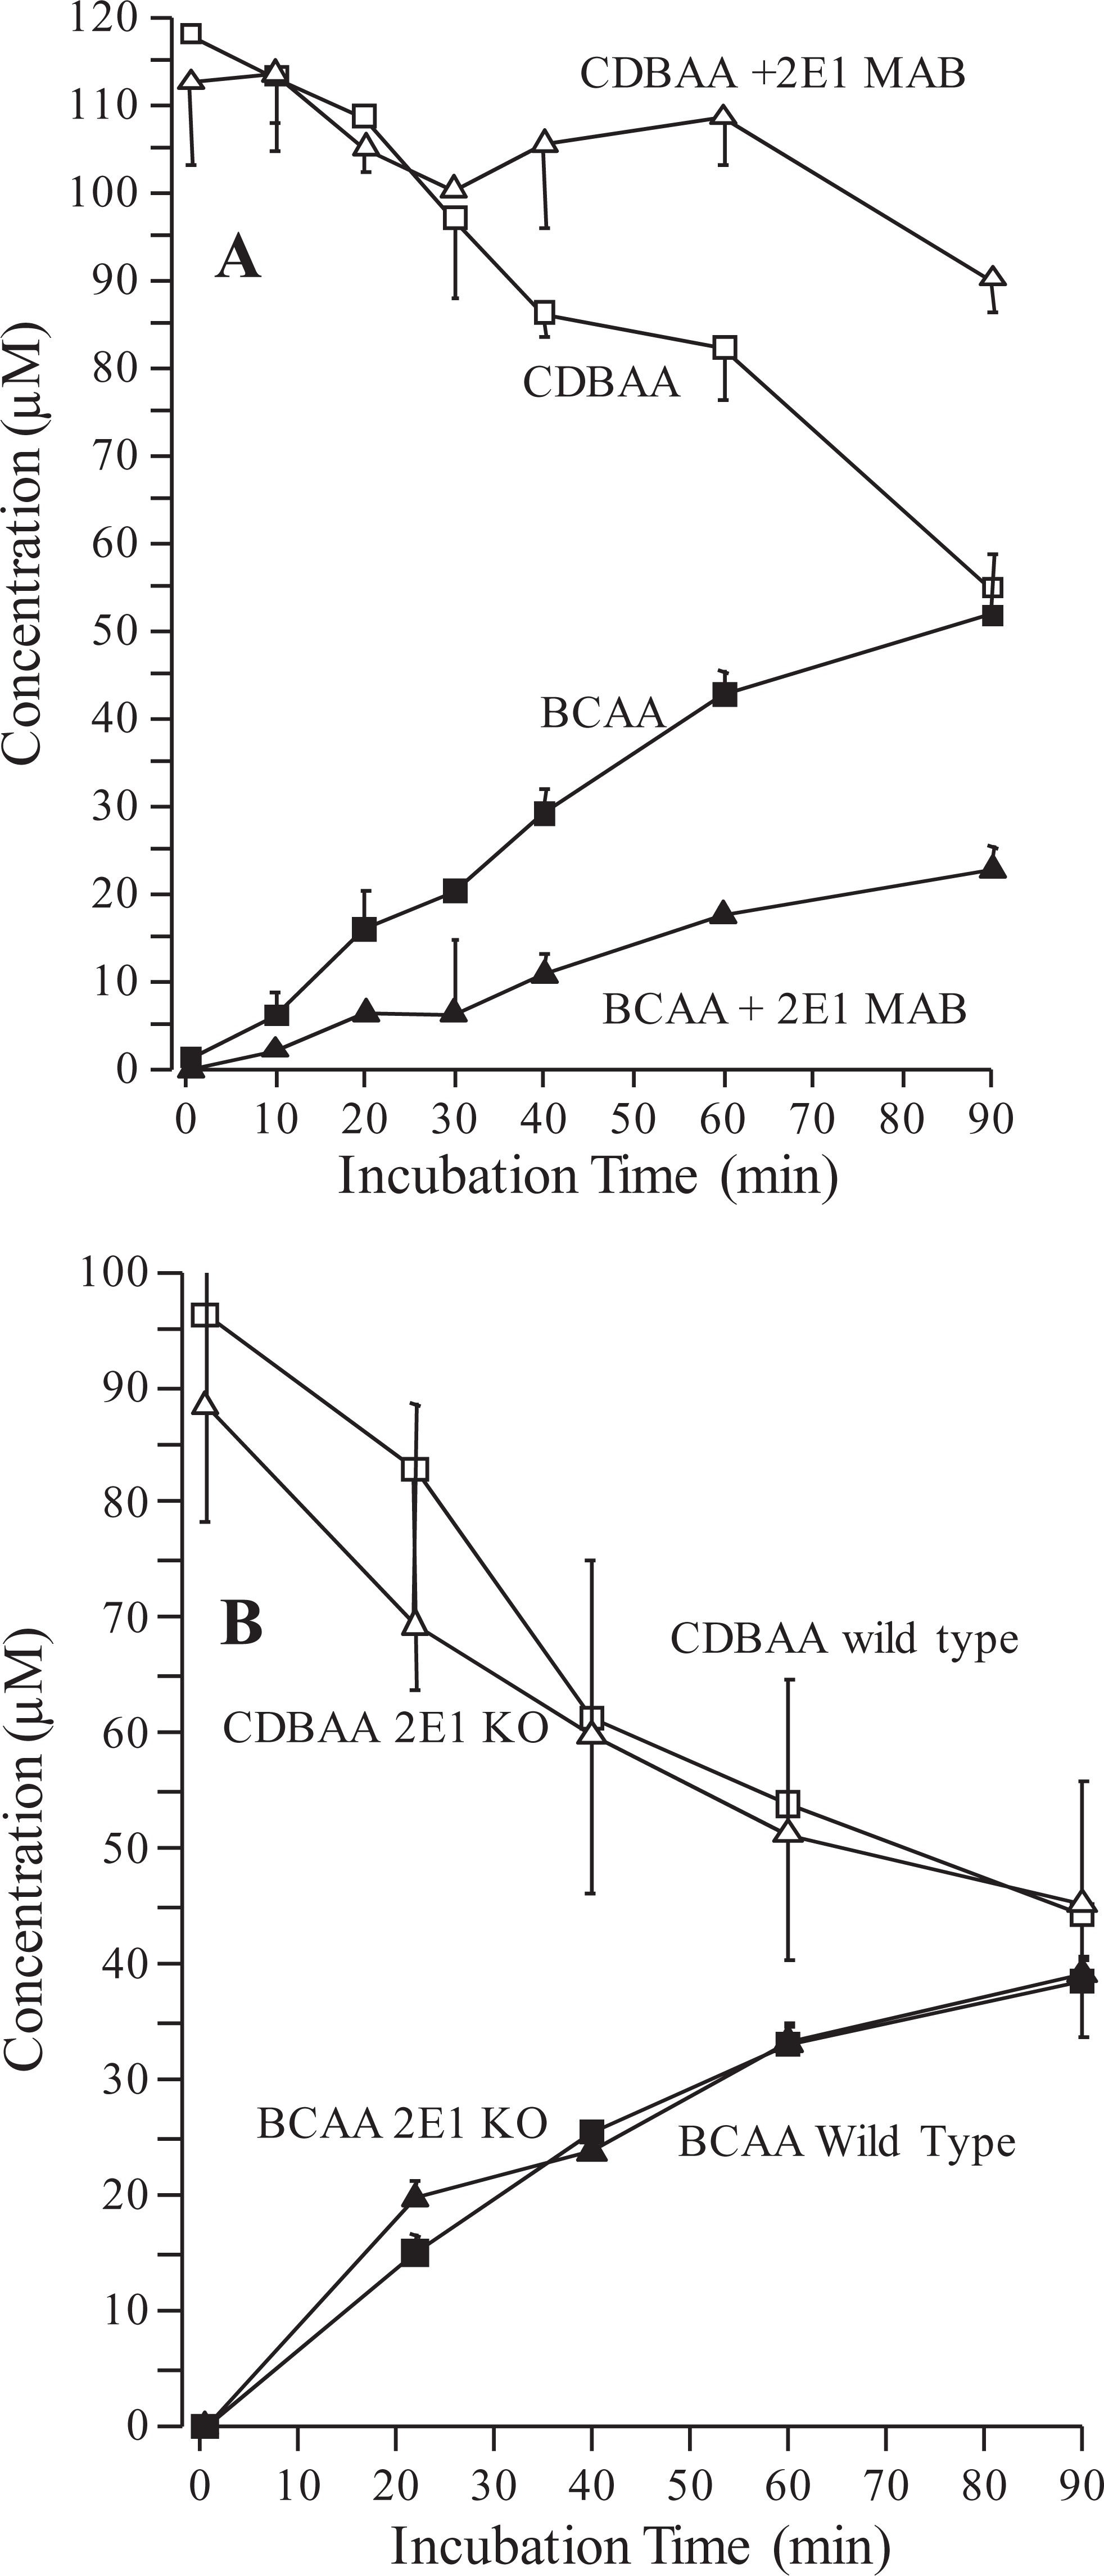
A, Immunoinhibition of CDBAA metabolism in human liver microsomes. A monoclonal antibody against human CYP 2E1 (MAB) was used to selectively inhibit CYP 2E1 activity. B, Chlorodibromoacetic acid metabolism in WT and CYP 2E1 KO mouse liver microsomes. Reactions were performed under N2 headspace. Data are the mean ± SE (n = 3 experiments). CDBAA indicates chlorodibromoacetic acid; BCAA, bromochloroacetic acid; WT, wild type; SD, standard deviation.
Discussion
The major objective of this study was to characterize the metabolism of chlorinated and brominated tri-HAAs and identify the involvement of specific cytochrome P450s. All brominated tri-HAAs (BDCAA, CDBAA, and TBAA) were metabolized to the corresponding di-HAA that represents the monodebrominated product (DCAA, BCAA, and DBAA, respectively). We did not observe the formation of monochloro or monobromo HAAs during any incubation. It is also worth noting that the 3 di-HAAs measured in this study were themselves not metabolized by rat liver microsomes with NADPH as the cofactor and is consistent with the established metabolic pathway for di-HAAs being GSH dependent and mediated by GST-ζ. 16 Thus, during tri-HAA microsomal incubations, any formed di-HAA accumulated in the incubation medium, permitting mass balance calculations relative to consumption of the added tri-HAA substrate.
The rate of metabolism of brominated tri-HAAs was directly proportional to the number of bromines in the molecule; the rate of the metabolism of CDBAA was 2.5-fold higher than BDCAA and of TBAA was 3.1-fold higher than BDCAA under N2 headspace. The rate of metabolism was also greatly stimulated under reduced oxygen atmospheres, which had the main effect of increasing V max (Table 1). These results are consistent with a previous study of BDCAA metabolism in mice 12 and a proposed metabolic scheme for tri-HAAs, which assumes the initial step is cytochrome P450 catalyzed reductive de-halogenation, which proceeds via a di-HAA-free radical intermediate. 11 Experimental evidence for the existence of this free radical was later observed for TCAA 13 and BDCAA (unpublished) in mouse liver microsomes. Once formed, the di-HAA radical was hypothesized to be either reduced to the di-HAA or bind with molecular oxygen-forming glyoxylate or oxalate, which are either converted into CO2 or excreted in urine. 11 Thus, the stimulation of brominated tri-HAA metabolism and increased di-HAA formation under reduced oxygen atmospheres would support this hypothesis as it favors reductive debromination. However, while it is clear that the overall rate of microsomal metabolism of tri-HAAs is dependent on the oxygen tension, di-HAAs were the only metabolite detected in all microsomal incubations and we could obtain no evidence for the formation of oxidative metabolites of tri-HAAs. If the aforementioned di-HAA radical could react with oxygen to form gyloxylate or oxalate, then loss of all 3 halogens would occur. However, the results shown in Figure 5 indicate that liberation of free Br− during TBAA metabolism corresponded to the amount of DBAA formed despite the additional, unaccounted for loss of TBAA. This finding would suggest the missing fraction of metabolized TBAA must retain the halogens on the C2 carbon.
The absence of oxidative metabolite formation during tri-HAA microsomal metabolism is difficult to reconcile, given the lack of mass balance observed between consumption of the tri-HAA and formation of the di-HAA metabolite. It has been previously hypothesized by Austin and Bull 12 that a second pathway may be occurring where the tri-HAA underwent decarboxylation, forming a volatile methane metabolite, which could be lost from the incubation or overlooked in the analytical measurements. However, incubations with CDBAA that were carefully designed to measure the formation of CDBM did not indicate this was occurring (Figure 4). Also, the kinetic analysis of tri-HAA metabolism indicated that the data were best described using a single Michaelis–Menten term, and Eadie–Hofstee plots (data not shown) were linear, indicating a single enzymatic reaction or process was occurring. Another possibility for the lack of mass balance may be covalent binding of a reactive intermediate to microsomal protein. We did not determine whether binding of a tri-HAA intermediate was occurring to microsomal protein, but this experiment may be worth pursuing in the future investigations to better understand the metabolism of brominated tri-HAAs.
With regard to the specific CYP isoform/isoforms involved in tri-HAA metabolism, we chose to use CDBAA as a representative substrate in a series of experiments using both microsomes and recombinantly expressed enzymes. The importance of P450 reductase was apparent from the almost complete inhibition of CDBAA metabolism with DPI, a potent inhibitor of P450 reductase, especially under atmospheric oxygen tension (Figure 6). Also, both recombinantly expressed rat and human P450 reductase were able to metabolize CDBAA (under N2 atmosphere) although a lack of mass balance was observed between CDBAA consumption and BCAA formation (Figure 7). A significant role for CYP 2E1 and CYP 3A4 in the metabolism of CDBAA was apparent from the extent of inhibition of metabolism by the selective inhibitors. In total, 2 CYP 2E1 and 1 CYP 3A4 inhibitors were used in the experiments and showed significant inhibition of metabolism. Highest (˜80%) inhibition of metabolism was observed with the more potent CYP 2E1 inhibitor DDC (Supplement Figure 1). Involvement of other CYP isozymes may be occurring based on partial inhibition observed with CYP 2C9/2C10- and CYP 1A1/1A2-specific inhibitors and the metabolism observed with the supersomes, which contain CYP 1A/1A2 and 3A4 among others.
Additional evidence for the involvement of CYP 2E1 in CDBAA metabolism comes from incubations using human liver microsomes incubated with monoclonal antibodies prepared against human CYP 2E1 (Supplement Figure 2A). The immunoinhibition experiment decreased the metabolism of CDBAA by more than 50%. Interestingly, there was no difference in CDBAA metabolism between the WT and the CYP 2E1 KO mice (Supplement Figure 2B), suggesting significant interspecies differences in CYP 2E1 activity toward CDBAA and/or the mouse P450 reductase activity is primarily converting all of the CDBAA to BCAA.
In summary, tri-HAA metabolism is stimulated by increased bromine substitution and reduced oxygen tensions, which leads to increased formation of di-HAAs. We would predict that metabolism of brominated tri-HAAs in intact rodents and humans will be closer to that observed under low-oxygen tensions in vitro as hepatic oxygen tensions tend to exist as gradients that are significantly lower than the atmospheric oxygen tension.28,29 With respect to isoform specificity, it appears that more than 1 CYP is involved although definitive statements about specific CYP isoforms are complicated due to interspecies differences and the role of P450 reductase in contributing to the reductive debromination of tri-HAAs. Finally, we could find no evidence for the microsomal formation of oxidative metabolites of tri-HAAs. Although a lack of mass balance was observed in some experiments, it was observed primarily in incubations with purified P450 reductase or with microsomes using relatively high initial substrate concentrations (>250 μmol/L). Thus, we cannot rule out the possibility of covalent binding or perhaps, nonmetabolic or degradative loss of tri-HAAs during chemical analysis.
Footnotes
Acknowledgments
The authors acknowledge Evan Adams, Qasim Abdur-Rehman, and Nichole Flintoff for their help in various parts of the study. Although the research described in this article has been funded by the United States Environmental Protection Agency through STAR grants R828044 and R82594 to I. Schultz, it has not been subjected to the Agency’s required peer and policy review and therefore, does not necessarily reflect the views of the Agency and no official endorsement should be inferred.
The authors declared no potential conflicts of interest with respect to the research, authorship, and/or publication of this article.
The authors disclosed receipt of the following financial support for the research, authorship, and/or publication of this article: U.S. Environmental Protection Agency Grants R828044, R82594.