
Abstract
To support clinical development of S-nitrosoglutathione (GSNO) as a therapeutic agent, 28-day toxicology studies in rats and dogs were conducted. Rats (21-25/sex) and dogs (3-5/sex) were exposed for 4 hours or 1 hour, respectively, to inhaled GSNO (0, 3, 9.3, 19, and 28 mg/kg per d in rats and 0, 4.6, 9.0, and 16.2 mg/kg per d in dogs) or vehicle daily via a nebulizer. Animals were monitored throughout the 28-day dosing period and during a postexposure recovery period. Complete necropsy and tissue examinations were performed. Experimental end points included clinical pathology, toxicokinetics, and immunotoxicology. No biologically significant adverse findings were noted in either species, and the no observed adverse effect levels (NOAELs) under these conditions were the highest achieved doses (28 and 16.2 mg/kg per d in rats and dogs, respectively). These data demonstrate that GSNO is well tolerated in rodents and dogs and predict a favorable toxicity profile in humans, thus supporting future clinical development of GSNO or closely related compounds.
Keywords
Introduction
S-nitrosoglutathione (GSNO) is an endogenous nitrosothiol that plays a critical role in nitric oxide (NO) metabolism. Unlike low-molecular weight signaling molecules that bind to and activate target cellular receptors, NO signaling is mediated by covalent conjugation between NO and transition metals or target cellular proteins, often via S-nitrosylation of cysteine residues.1–3 A number of recent studies suggest that NO metabolism may play a significant role in human cardiovascular and respiratory diseases as well as immune tolerance during organ transplantation.4,7 These studies also suggest that inhaled NO might have potential therapeutic applications, for example, for stabilizing premature infants and patients with heart disease. However, the short half-life of NO makes it difficult to achieve and sustain a therapeutic level in target tissues, which is needed for successful and efficient treatment of chronic human disease.
S-nitrosoglutathione is one of the primary endogenous sources of bioavailable NO. Both GSNO and NO concentrations are regulated by GSNO reductase,4,5 and these small molecules in turn regulate respiratory function by modulating airway tone and pro- and anti-inflammatory responses in the respiratory tract.6,7 Because NO is a labile gas and endogenous levels are difficult to manipulate, it has been proposed that exogenous GSNO could be used to regulate circulating levels of NO and NO-derived species, and GSNO could have value in patients with pulmonary diseases such as cystic fibrosis. Consistent with this therapeutic goal, a recent study showed that acute treatment with aerosolized GSNO was well tolerated by patients with cystic fibrosis. 6
The present study investigated the potential adverse effects of subchronic inhaled GSNO in Wistar rats and beagle dogs. S-nitrosoglutathione was administered by inhalation through the snout for 4 hours (rat) or 1 hour (dog) daily for 28 days. The highest effective dose achieved was 28 mg/kg per d and 16.2 mg/kg per d in rats and dogs, respectively. These doses were the maximum achievable based upon GSNO solubility with administration through the nebulizer and the inhalation apparatus and the exposure durations. These doses are 6- to 10-fold higher than the equivalent proposed effective dose in a human clinical setting. These doses were sufficiently high enough to generate an acceptable safety margin for human dosing. Experimental end points, including complete clinical pathology, toxicokinetics (not in recovery animals), and immunotoxicology, were monitored throughout the 28-day exposure period and during a 28-day postexposure recovery period. At the end of the postexposure period, all animals were sacrificed and subject to complete necropsy and histopathology. The no observed adverse effects level (NOAEL) for all parameters examined in this study was equivalent to the highest achieved dose in rats and dogs. Thus, the current study indicates that GSNO is well tolerated in rats and dogs and suggests that repeat administration of inhaled GSNO in humans might also be well tolerated with few or no adverse effects at doses 6- to 10-fold lower than those used in these studies.
Materials and Methods
Animals
Experiments were performed with Wistar rats (Harlan Laboratories, Switzerland) 8 to 9 weeks of age at study start. A total of 21 control animals/sex and 25 treated animals/sex were allocated as follows: 10 rats/sex for main study, 5/sex for the recovery group, 6/sex for immunotoxicology and urine/plasma nitrate assessments, and an additional 4/sex for plasma nitrate assessments (except for the control). Purebred male and female beagle dogs 6 to 7 months of age at study start (Harlan Laboratories, France) were used for the study. The number of dogs per group was 3/sex for the main study with an additional 2 dogs/sex in the recovery groups (control and high dose only).
Food
Rats were fed standard pelleted 3433 rodent chow, and dogs were fed 3353 dog maintenance diet (Provimi Kliba AG, Switzerland) throughout the study. The feeds had low nitrosamine content (<5 µg/kg). Food was not supplied the evening prior to clinical blood sampling (17- to 18-hour fast). Domestic tap water was supplied ad libitum except during dosing periods.
S-Nitrosoglutathione Preparation
Glutathione (GSH) was incubated prior to use with concentrated hydrochloric acid (HCl) at a constant temperature 20°C to 25°C. The solution was mixed thoroughly, then cooled to 0°C and further incubated in a reactor vessel with protection from light. A solution of sodium nitrite sparged with nitrogen was introduced into the reactor vessel, and the reaction proceeded while the internal temperature of the vessel was maintained at −2°C to 0°C with mixing for 2 hours. The reaction was allowed to proceed until the starting material was consumed (<1% GSH), further agitated for approximately 1 hour, and then filtered under a nitrogen stream. The purified solids were combined into a wet cake that was washed with acetone and dried at approximately 20°C under vacuum and in the dark for ≤24 hours protected by a nitrogen blanket. The dried GSNO product was stored at approximately −20°C. The purity and stability of the powder GSNO were verified using a validated high-performance liquid chromatography (HPLC) method.
Measurement of Particle Size and Mass Median Aerodynamic Diameter
S-nitrosoglutathione particle size was measured in the test atmosphere for each experimental group at least once during the study. For each stage, the test aerosol was impacted onto a filter and stored in dry ice at −80°C ± 10°C until analysis. The airflow rate through the impactor was 2.5 L/min. S-nitrosoglutathione in the atmosphere during exposure was quantified via HPLC. Cumulative particle size distribution was measured and analyzed using a modified Berner 7 stage cascade impactor (Model LP 2.5/0.15, Hauke, Gmunden, Austria). These data were used to calculate the mass median aerodynamic diameter (MMAD) and the geometric standard deviation (GSD) of GSNO particles.
Chemical Analysis of Aerosols
Aerosol samples were collected on Millipore durapore filters (Type HVLP) using a stainless steel filter sampling device (Gelman Science Inc., Ann Arbor, Michigan) at least once daily before or during dosing. Flow rate during sampling was 1.0 L/min and the duration of sampling was adjusted as needed to ensure reliable results. All samples were transferred into appropriately labeled vials. At least 1 sample per chamber per week was analyzed for GSNO using a validated HPLC method.
Estimation of GSNO Exposure
The exact concentration of the dose formulation was adjusted weekly for each group using the calculated mean minute volume, the most recent group mean body weight, and the most recent aerosol analytical data. Calculations and adjustments were based on standard curves (dosing solution vs achieved aerosol concentration) prepared during technical trials.
Measurement of Nominal Aerosol Concentration
S-nitrosoglutathione filled syringes used to supply the nebulizers during aerosol generation were weighed before and after each exposure session. The nominal GSNO aerosol concentration was calculated from the amount of liquid nebulized per minute and the nebulization flow.
S-Nitrosoglutathione Administration
S-nitrosoglutathione (98.8% purity), as calculated from aerosol concentration and dosing conditions, was prepared weekly with daily aliquots refrigerated until use and administered to rats at 0, 3, 9.3, 19, and 28 mg/kg per d and to dogs at 0, 4.6, 9.0, and 16.2 mg/kg per d. Rats were exposed for 4 hours/d and dogs were exposed for 1 hour/d for 28 days. The maximum achievable concentration for each inhalation apparatus was due to GSNO solubility, the inhalation flow dynamics, the nebulizer apparatus, and the duration of exposure. Vehicle solution (pH 7.4 phosphate-buffered saline [PBS; no potassium or magnesium]) was filter-sterilized using a 0.22-μm polyvinylidene fluoride (PVDF) and used to dilute stock GSNO to appropriate concentration. S-nitrosoglutathione was kept on ice and protected from light during the exposure periods. Weekly concentrations of formulated GSNO were verified and stability was confirmed prior to use. Before commencement of the exposure to animals, technical trials were conducted using the inhalation system without animals in place.
For rats, inhalation exposure was performed using a system similar to that described by Sachsse et al 8 and a nose-only exposure chamber described by Cannon et al. 9 Rats were confined individually in restraint tubes positioned radially around the flow past. Three Hudson RCI nebulizers (Teleflex Medical, North Carolina) were connected in parallel to an appropriate reservoir with vehicle or GSNO. Chamber design was based upon the fluid dynamic modeling of the test aerosol flow. The exposure system ensured a uniform aerosol distribution and provided a constant flow of test material to each exposure tube. The flow of air at each tube was between 0.75 to 1 L/min, which was sufficient to minimize rebreathing of the test atmosphere (ie, more than twice the respiratory minute volume of a rat).
For dogs the inhalation exposure system used an aerosol distribution set enclosed in an external chamber made of transparent polyvinylchloride. The distribution set consisted of a central tube with 4 ports, each of which was connected to a face mask. Three Hudson RCI nebulizers were connected in parallel to an appropriate reservoir with vehicle or GSNO. The aerosol was discharged constantly through the distribution set and the face mask and was exhausted through an external chamber using a tubing/filter system. This system ensured a uniform distribution and constant flow of test material (at approximately 10 L/min) to each mask. This rate of inhalation was sufficient to minimize re-breathing of the test atmosphere (ie, twice the respiratory minute volume of a dog). All animals were trained to remain comfortably restrained in a sling for the duration of dosing and were acclimated to wearing the mask during a training period. For control experiments, dogs were exposed to vehicle under similar conditions as treated animals.
In Vivo Study End Points
All animals were observed daily for viability and clinical signs during the 28 days of test article administration and for those remaining, during the 28-day recovery period. Body weight and food consumption were recorded weekly. Ophthalmoscopy was performed during pretest, at week 4 of treatment, and at week 4 of recovery. At the end of the treatment or recovery period, animals were sacrificed, a detailed necropsy was performed, and selected organs were weighed. All tissues were evaluated visually for gross adverse effects. Dog and rat tissues were processed for microscopic examination from all dose groups. Fixed hematoxylin and eosin – stained paraffin tissue sections were prepared and examined microscopically by a board-certified pathologist. If lesions were noted, they were classified and compared in treated and control animals using a 4-step grading system (minimal, mild, moderate, and severe). Histopathology of tissues was performed according to the recommendations of the Society of Toxicologic Pathology 10 but additionally included a complete evaluation of the nasal cavity and respiratory tract (~50 total tissues/animal).
In dogs, electrocardiograms were recorded during pretest and during weeks 1 and 4 of treatment and week 4 of recovery using standard electrocardiograph (ECG) methods and IOX and ECG Auto (EMKA technology, Paris, France). During the treatment period, the recordings were made for all groups before and at 15 minutes after the end of exposure. Electrocardiograms were obtained using Einthoven (I, II, and III) and Goldberger (aVR, aVL, and aVF) leads. The heart rate, P wave duration and amplitude and P-Q, QRS, and Q-T intervals were measured electronically using a representative section of the electrocardiogram from lead II. The Q-T interval was corrected for heart rate using Fridericia’s formula. 11 The results were converted into milliseconds for data analysis and presentation.
Clinical Pathology Investigations
Blood and urine samples were collected from all main study and recovery animals throughout the study (pretest and study days 3 or 5, 28, and 56). Prior to sample collection, animals were fasted overnight but allowed access to water ad libitum. The clinical pathology samples were collected early in the working day to reduce biological variation caused by circadian rhythms. Blood samples were drawn from the jugular vein into evacuated blood collection tubes. Urine from the rats was collected for urinalysis while in metabolism cages for 17 to 18 hours. For dogs, urine was collected into a specimen vial using a catheter. Markers of reactive nitrogen such as lactate dehydrogenase were included to assess target toxicity. 12
Determination of Methemoglobin
Blood samples were collected into lithium heparin blood collection tubes from main study and recovery animals during pretest, on day 1 and during week 4 of treatment and week 4 of recovery. Samples were drawn immediately after the exposure was terminated.
Immunotoxicology
Flow Cytometry
Changes in the leukocyte populations were used to assess immune status in treated and control rodents. For this purpose, rat leukocytes at the end of the 28-day treatment period were isolated from a cohort (n = 6/sex) separate from animals used in the sheep red blood cell (SRBC) assay and triplicate 70 µL aliquots were immediately analyzed by flow cytometry. The first aliquot was stained with 10 µL antibody mix containing a-CD3 (1:20) and a-CD4 (1:10). The second aliquot was stained with 10 µL antibody mix containing a-CD3 (1:20) and a-CD8 (1:10). The third aliquot was stained with 10 µL antibody mix containing a-CD45RA (1:10) and a-CD11b (1:10). All antibodies (Southern Biotechnology Association, Inc, Birmingham Alabama) were diluted in PBS. Samples were incubated for 30 minutes at room temperature (RT), after which the cells were lysed using PharMlyse, washed once using CellWash (BD Biosciences, Allschwil, Switzerland), fixed using Cellfix, and analyzed by flow cytometry (FACScalibur, BD Biosciences). Single-stained samples were prepared and analyzed in parallel to facilitate adjustment of instrument settings. The following cell types were analyzed:
T-cells: T-lymphocytes were identified by CD3 reactivity and further subclassified using CD4 as a marker for Thelper and CD8 as a marker for Tcytotoxic cells.
B-cells: B-lymphocytes were identified using the surface marker CD45RA.
Monocytes/neutrophils: monocytes and neutrophils were identified by reactivity with CD11b.
Cells were gated according to size and granularity. Gates were set for the small ungranular cell population (lymphocytes; gate 2) as well as all nucleated cells including the larger more granular cells (monocytes/granulocytes; gate 1). For each sample, approximately 10 000 gated cells were counted and scored for fluorescein isothiocyanate (FITC) or and R-phycoerythrin (PE) staining.
The following data were obtained from each blood sample:
The percentage of the CD3+/CD4+ population in gate 2.
The percentage of the CD3+/CD8+ population in gate 2.
The percentage of the CD45RA+ population in gate 2.
The percentage of the CD11b+ population in gate 1.
Analysis of the Primary Immune Response to SRBC
Sheep Red Blood Cell Preparation
The SRBC method of Temple et al 13 was used to measure antibody titer in serum samples. Sheep blood was washed twice with 0.9% NaCl, centrifuged at 750g for 20 minutes and adjusted to 4 × 10 8 erythrocytes/mL. This erythrocyte suspension (0.5 mL) was injected into rats 5 days prior to the immune response assay. A cohort (6/sex/group) of rats separate from those used in the flow cytometry assay was immunized. On day 5, serum samples were taken from immunized rats and analyzed for antibody titers.
An SRBC-specific immunoglobulin M-enzyme-linked immunosorbent assay (IgM-ELISA) was used to measure the antibody titer in the serum of injected rats. For this purpose, 96-well maxisorp plates (NUNC, Roskilde, Denmark) were coated with SRBC-antigen overnight at 4°C. The plates were then blocked for 1 hour at RT with 5% blocking buffer (Biorad, Munich, Germany) and washed 5 times with PBS/0.01% Tween. Samples were serially diluted into the coated plates and incubated for 2 hours at RT. The plates were then washed at least 5 times with PBS/0.01% Tween and treated for 1 hour at RT with anti-rat IgM biotin conjugate. The plates were washed 5 times with PBS/0.01% Tween and treated for 30 minutes at RT with horseradish peroxidase (HRP)/streptavidin. The plates were finally washed 9 times with PBS/0.01% Tween and test medium broth (TMB) to detect bound SRBC-specific IgM antibodies. The enzyme-mediated reaction was stopped using 1 N H2SO4 and HRP activity quantified by measuring OD 450 nm. A standard anti-SRBC serum was used to facilitate interassay comparability.
Antibody titer was calculated by dividing ODmax/2 (or another predetermined OD) by the serum dilution factor. The titer of the standard serum was set to 100% and experimental values were normalized to the standard.
Nitrate Analysis
Because GSNO is not stable in plasma, plasma and urine nitrate were measured as potential surrogates of GSNO exposure. The constitutive concentration of nitrate in plasma is typically 20 to 40 µmol/L, and it is considered a reliable marker for status of NO metabolism in vivo.14,15 Nitrate analysis of blood samples was performed using a nitrate/nitrite colorimetric assay kit (Cat No. 780001, Cayman Chemical, Michigan). Blood samples from 6 control and 10 treated rats/sex/group and 3-5 dogs/sex/group were collected in EDTA tubes on day 1, during week 4 of dosing and during week 4 of the recovery period. For rats, 3 samples/time point were collected before dosing (−4 hours), immediately after dosing (0 hour), and 30 minutes, 2, 4, and 8 hours after dosing. For dogs, the samples were collected before dosing (−4 hours), immediately after dosing (0 hour), and 45 minutes, 2, 4, 6 and 8 hours after dosing. Samples were placed in an ice bath and plasma isolated by centrifugation at 2°C to 8°C ca 1500g for 10 minutes, as soon as practicably possible. Following centrifugation, the plasma was ultrafiltered using a molecular weight cutoff of 10 000 Da. The ultrafiltered plasma was stored at −80°C ± 10°C in the dark until further use/analysis.
Urine nitrate levels were determined from samples collected into plastic tubes from a collection vessel over 18 hours on days 1 to 2 and 28 to 29 in rats. Urine samples were collected from dogs via a catheter, at 6 hours after GSNO administration on day 1, during week 4 of dosing. The urine was divided into 2 equal volume aliquots and frozen at −80°C ± 10°C until analysis. The analytical range for nitrate was 5 µmol/L (lower limit of quantification [LLOQ]) to 100 µmol/L (upper limit of quantification [ULOQ]).
Toxicokinetics
Toxicokinetic (TK) studies were performed by quantifying plasma nitrate in serial samples. The individual TK parameters of nitrate concentrations in plasma were assessed by noncompartmental analysis using the linear/log trapezoidal rule. Data were analyzed using WinNonlin, version 4.1 (Pharsight Corporation. Mountain View, California).
Statistical Analysis
For rats, mean and standard deviations (M ± SDs) were calculated for all measured parameters. Body weight, food consumption, clinical pathology data, and the immunotoxicology results were analyzed by analysis of variance (ANOVA) followed, where appropriate, by Dunnett test. If the data were not normally distributed, a Steel test was utilized. A Fisher exact test was applied to the ophthalmoscopic and macroscopic findings. Descriptive statistics (median, min, max, mean, and SD) were calculated for plasma concentrations and TK parameters associated with each dose group. An overall statistical assessment was conducted to determine whether a significant difference was observed in either Cmax or AUC8h for dose proportionality and for effects of gender or with single versus repeated exposure.
Due to the small sample sizes in experiments with dogs, a nonparametric distribution of the data was assumed. Therefore, the Steel test (many-one rank test) was applied for comparing TK parameters, body weight, ECG, clinical laboratory parameters, and organ weights in male and female treated and control groups. Electrocardiography was performed before and after dosing, and results were analyzed for statistically significant changes using Student t test. In some instances, M ± SDs were additionally calculated for parameters.
Results
Calculation of Achieved GSNO Dose
Achieved daily dose of GSNO was estimated from aerosol sampling data for each group of rats and dogs using the following formula and assuming 100% deposition in the respiratory tract of exposed animals:
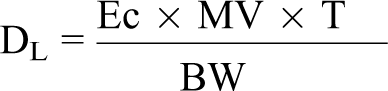
DL = achieved dose level (mg active compound/kg body weight [bw])
Ec = actual concentration in exposure atmosphere (mg active compound/L air)
MV = group mean minute volume (L/min) calculated using the following formulae from individual body weights and Harlan Laboratories’ historical minute volume data (males: MV = −1.258 + (0.657 × BW), females: MV = −1.367 + (0.710 × BW)).
T = time, duration of exposure (minutes)
BW = group mean body weight (kg for dog and g for rat × 1000).
Estimated GSNO Dose for 28-day Inhalation Studies in Wistar Rats and Beagle Dogs
Aerosol formulations of GSNO were administered every day (qd) via customized exposure systems for rats and dogs, as described in Methods. The estimated achieved GSNO dose for each experimental group of male and female Wistar rats is shown in Table 1 and for each group of male and female beagle dogs is shown in Table 2. For all groups, the mean estimated achieved dose was between 96% and 166.5% of the target dose. In rats the doses achieved were within 8% of the anticipated doses. In dogs, the excessive concentrations (up to 66% greater than expected) were not anticipated based upon preliminary trials of the inhalation apparatus. Achieving greater than anticipated doses, however, did not compromise the study and did not result in adverse events in the highest dose group. Control animals were treated identically to dosed animals, except that they were exposed to vehicle (PBS) lacking GSNO.
Achieved Dose Levels in Wistar Rats
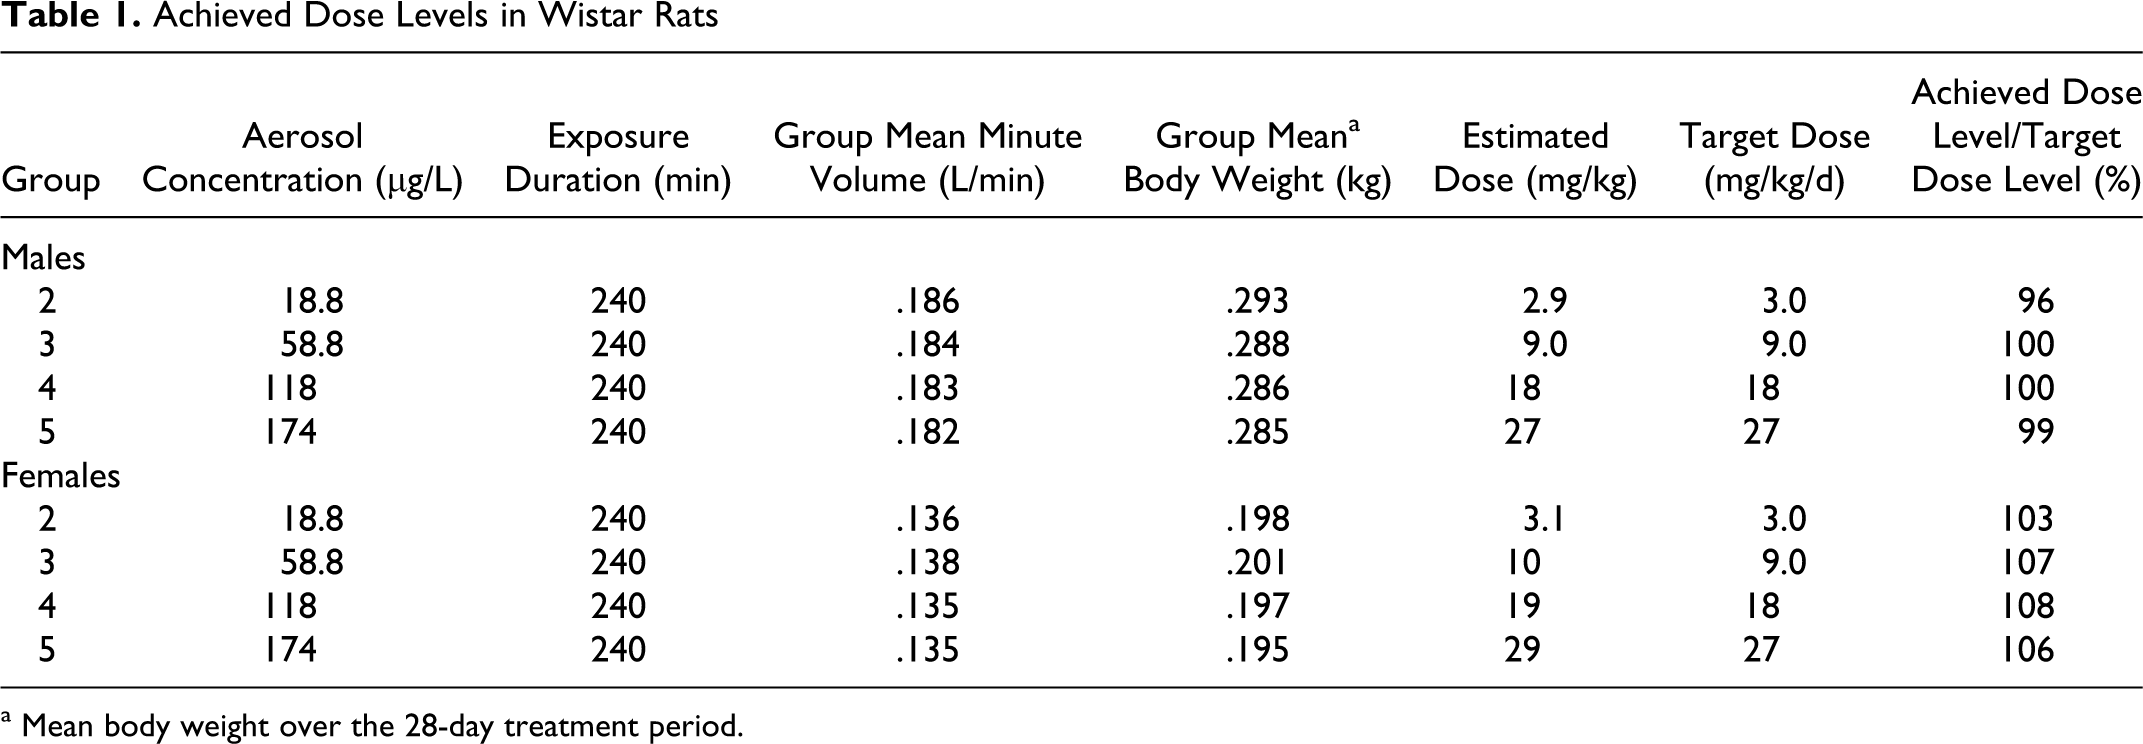
a Mean body weight over the 28-day treatment period.
Achieved Dose Levels in Beagle Dogs
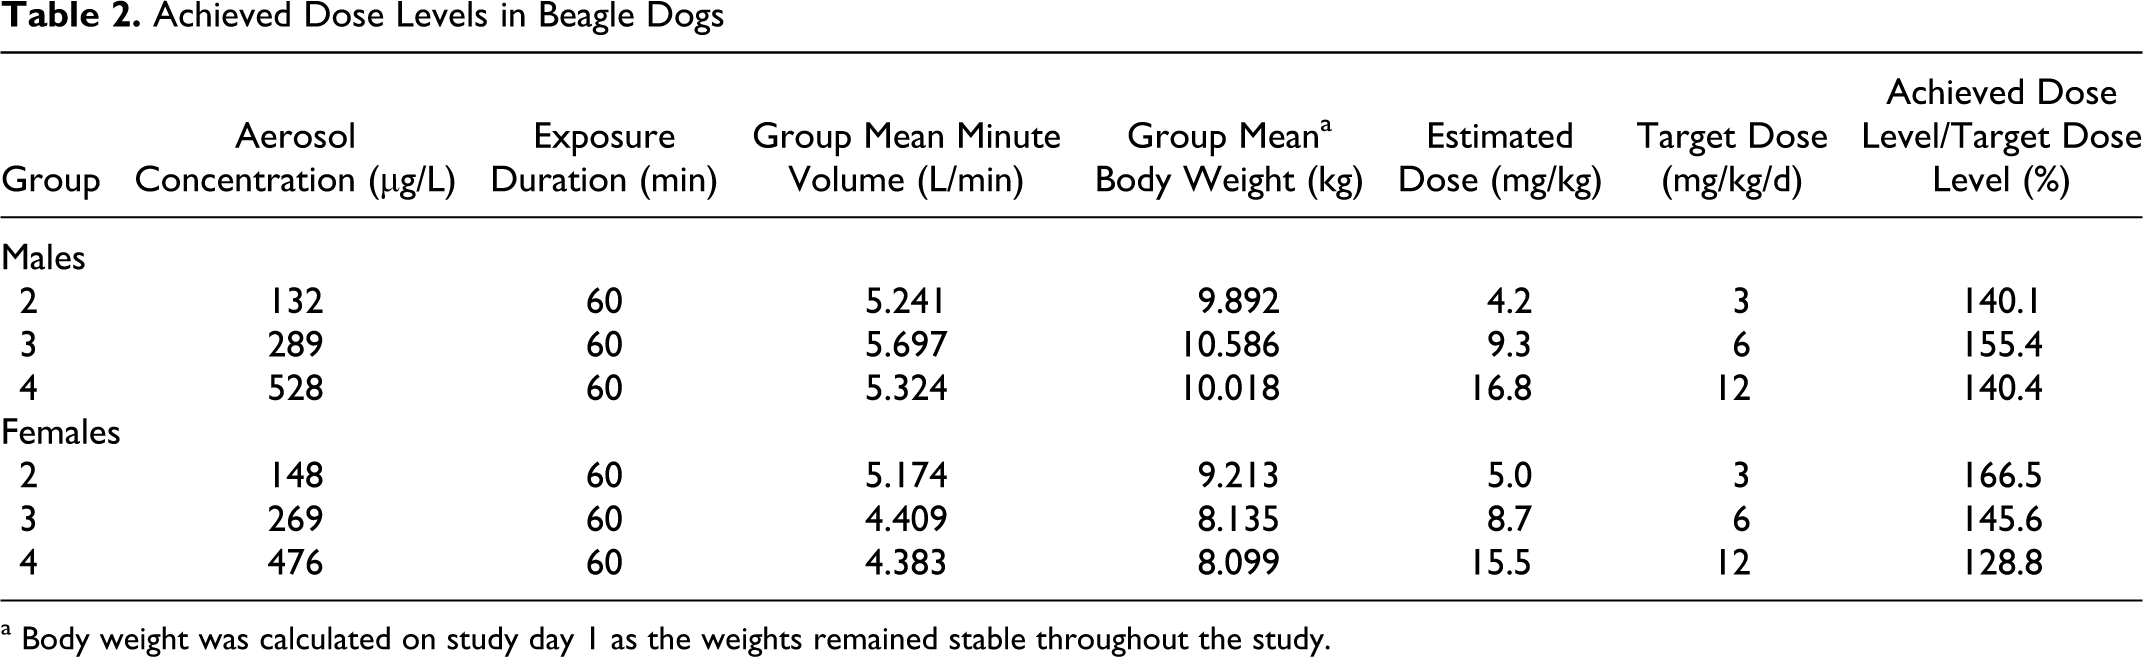
a Body weight was calculated on study day 1 as the weights remained stable throughout the study.
S-Nitrosoglutathione Particle Size Distribution
The MMAD and GSD of aerosolized GSNO particles were determined gravimetrically and are presented in Table 3 (rats) and Table 4 (dogs). These data show that ≥64% of the particles were <3 µm in size in all groups; thus, the majority of the particles were within the respirable range for rats and dogs, and particle size was suitable for access and exposure to conducting airways, peripheral lung, and upper respiratory tract.
Mean Mass Median Aerodynamic Diameter in Rats
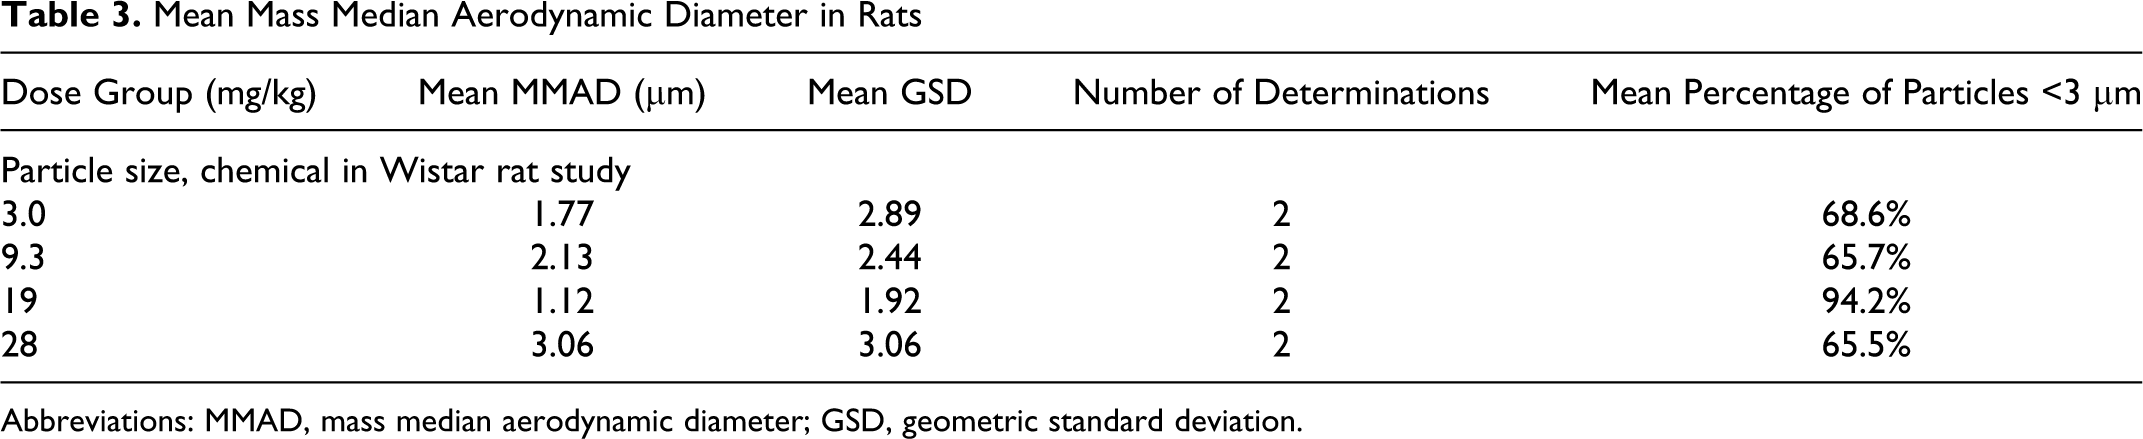
Abbreviations: MMAD, mass median aerodynamic diameter; GSD, geometric standard deviation.
Mean Mass Median Aerodynamic Diameter in Beagle Dogs
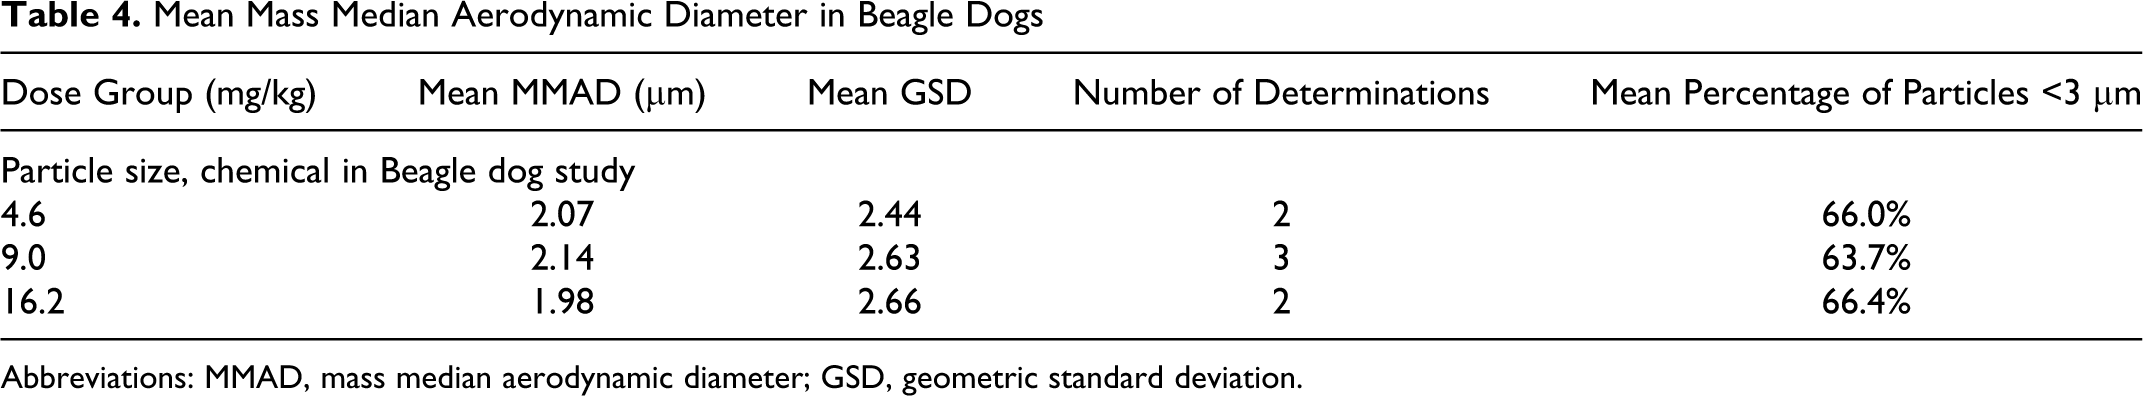
Abbreviations: MMAD, mass median aerodynamic diameter; GSD, geometric standard deviation.
Rat in-Life Data
All rats survived to the end of the 28-day treatment and recovery periods and no clinical signs related to treatment with GSNO were observed. However, mean group body weight was slightly lower for all groups of treated male rats compared to control male rats, with an apparent larger effect with higher doses (Figure 1). The change in mean body weight relative to male control rats was statistically significant for the 19 and 28 mg/kg per d rats from week 4 (absolute body weight, ~−6% and reduced body weight gain ~<2%-4%). Absolute body weight and body weight gain did not return to control levels during the recovery period. Mean group body weight was not affected in treated female rats. Overall food intake was lower in male rats in the mid- and high-dose groups, which is consistent with observed decrease in mean body weight in these groups. The change in food intake relative to male control rats was statistically significant for the 28 mg/kg per d group on days 15 to 22. Food intake did not return to control levels during the recovery period. Food intake in male rats in the 3 mg/kg per d group and in all GSNO-treated female rats was not significantly different from control male or female rats, respectively.
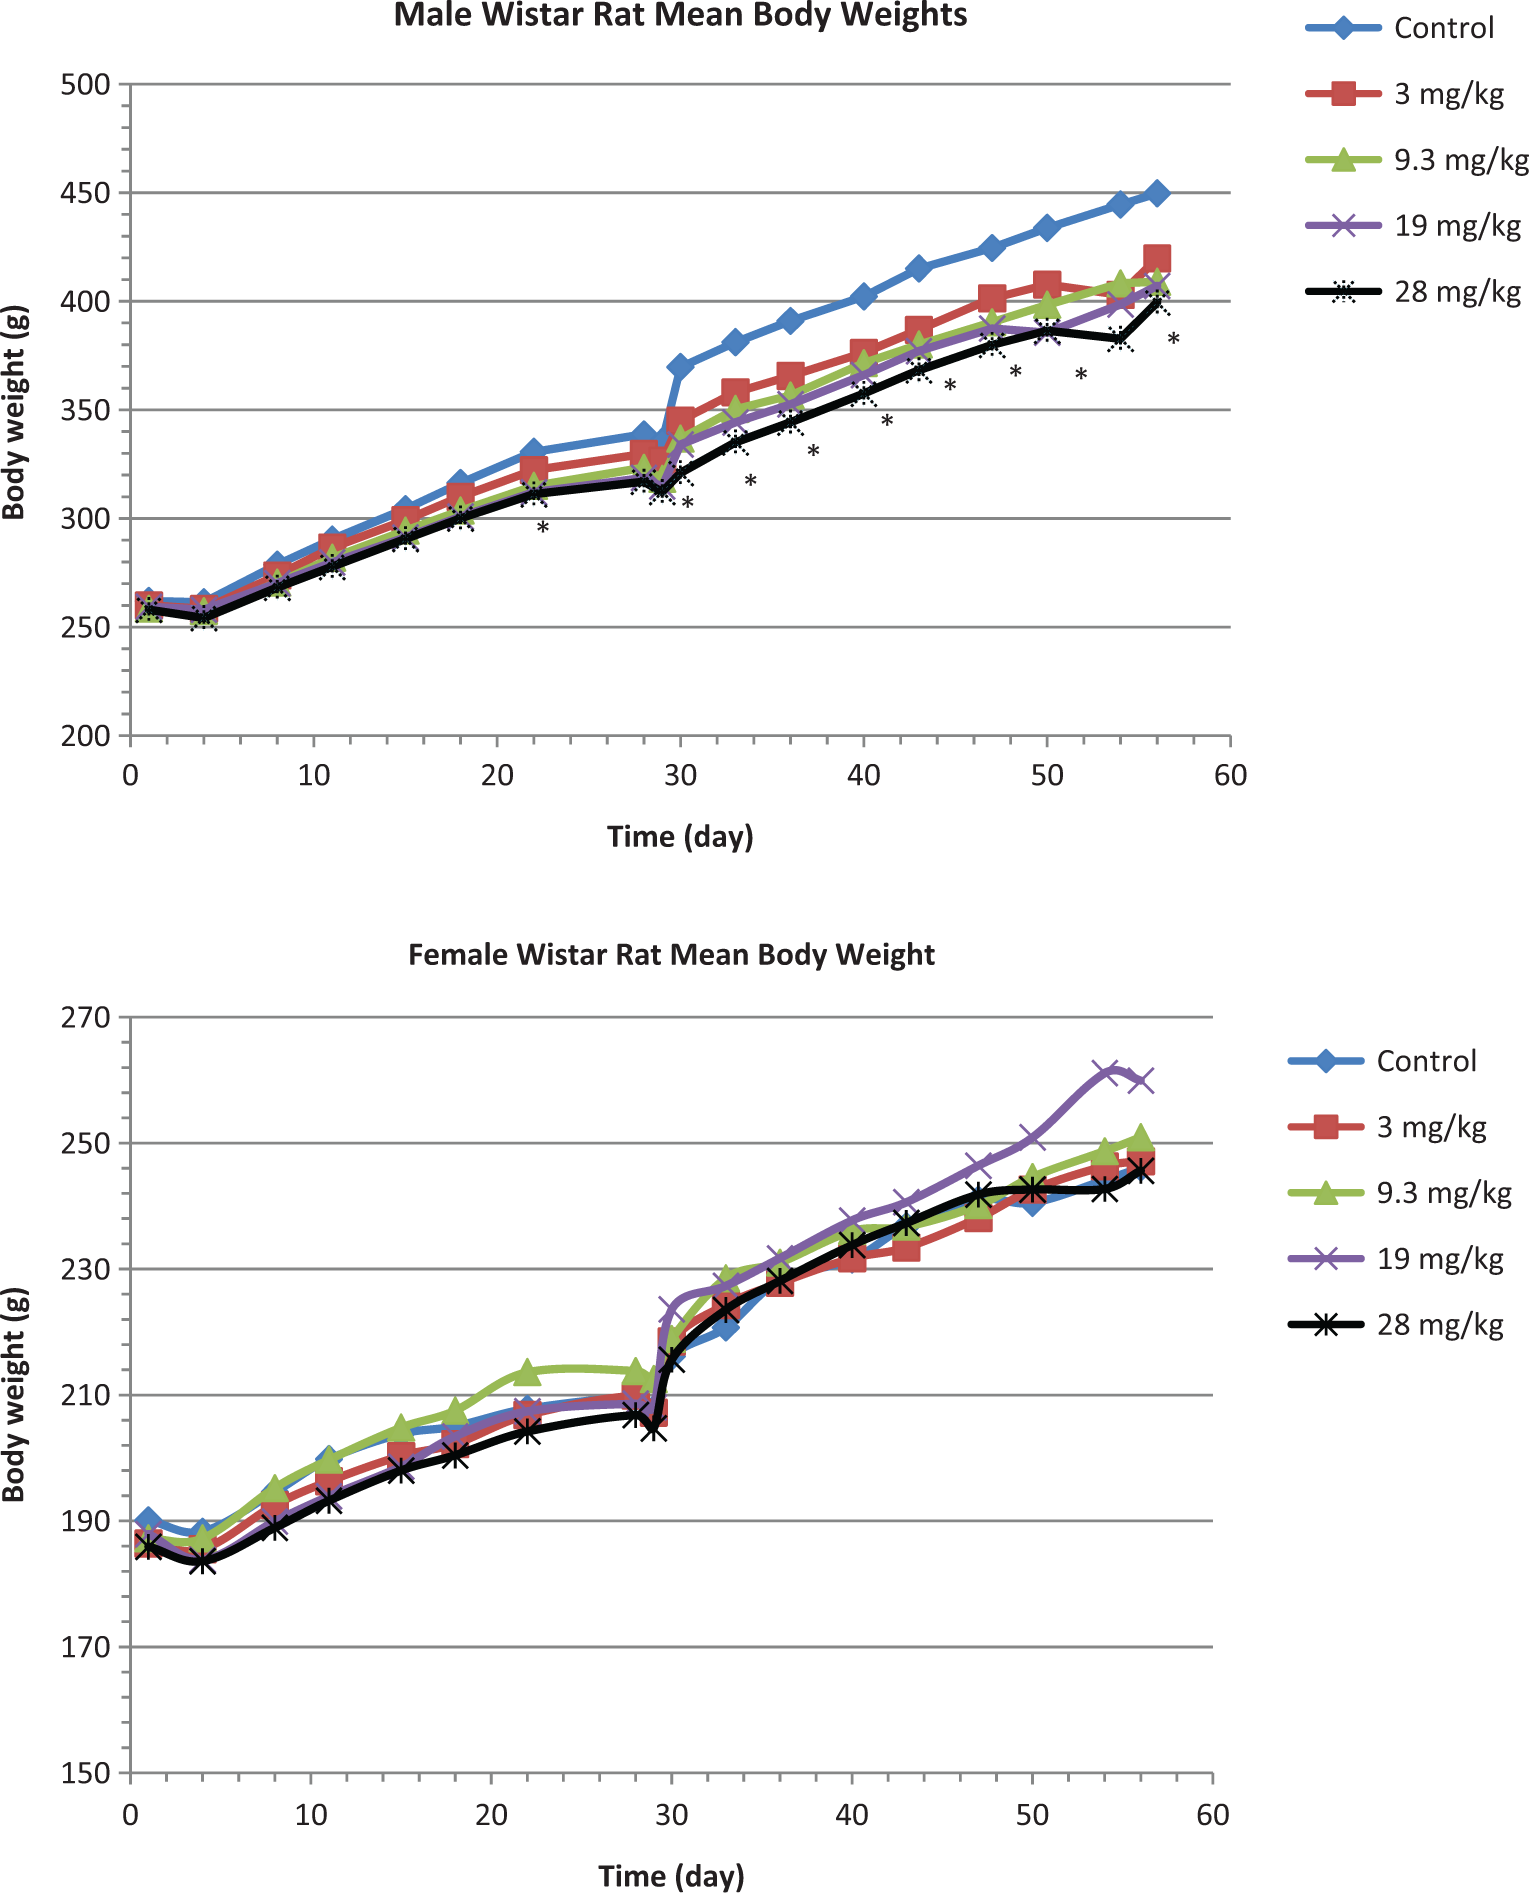
Mean body weight in male and female Wistar rats over the study duration. * = a statistically significant reduction in weight (P < .05).
S-nitrosoglutathione exposure had no treatment-related effects on clinical chemistry, ophthalmologic, hematological, or urinalysis parameters (data not shown). Methemoglobin values, a critical indicator of excessive NO generation, did not increase following GSNO administration. In addition, organ weights and macroscopic and microscopic findings were similar in all treated and control groups of male and female rats. Thus, the highest GSNO dose tested, 28 mg/kg per d, was considered to be the NOAEL for in-life effects in male and female Wistar rats.
Dog in-Life Data
All dogs survived to the end of the 28-day treatment and recovery periods and no clinical signs related to treatment with GSNO were observed. S-nitrosoglutathione exposure had no treatment-related effects on food intake, body weight, or ophthalmologic, hematological, or urine analysis parameters in male or female dogs (data not shown). Methemoglobin values were not altered by GSNO administration. Of the clinical chemistry indices, total bilirubin increased in a dose-dependent manner at week 4 in all treated males, all treated females, and control females and was approximately 2-fold higher in treated female dogs than in male dogs in the corresponding dosage group. However, bilirubin was not higher in treated male or female dogs on day 5 of treatment or during week 4 of the recovery period (Table 5). The change in bilirubin in high-dosage male and female dogs (16.2 mg/kg per d) relative to control dogs was statistically significant (P < .05). However, no other changes were observed in liver histology, blood or urine chemistry, organ weights, or macroscopic and microscopic findings in treated male or female dogs that would suggest hepatic toxicity.
Mean Total Serum Bilirubin (µmol/L) Over the Course of the 28-Day Dog Toxicology Study
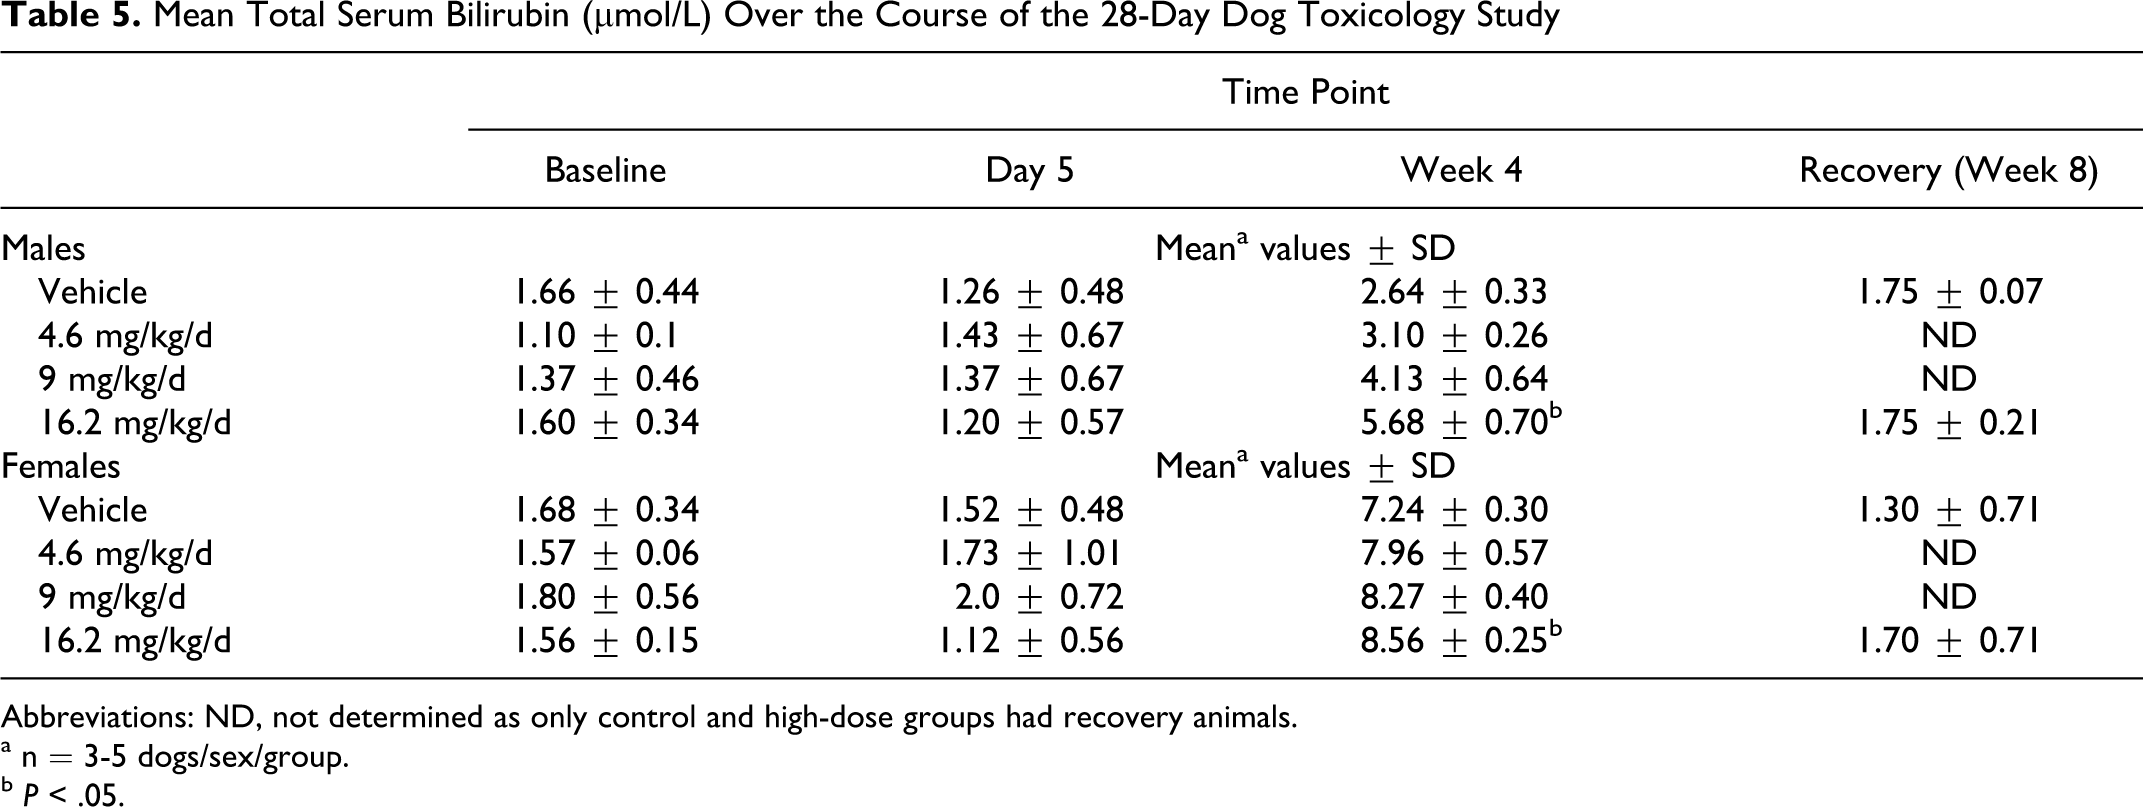
Abbreviations: ND, not determined as only control and high-dose groups had recovery animals.
a n = 3-5 dogs/sex/group.
b P < .05.
No treatment-related changes in the electrocardiograms of GSNO-treated dogs were observed. Some intergroup variations achieved statistical significance, but they did not show a dose-response relationship or were present during pretest and were not likely to be related to GSNO exposure. Electrocardiogram traces did not reveal any GSNO treatment-related arrhythmias or abnormalities. Thus, the highest dose tested, 16.2 mg/kg per d, was considered the NOAEL for in-life effects in male and female beagle dogs.
Rat Immunotoxicology
Two different tests were used to analyze the immune status of rats treated with GSNO; first, the distribution and morphology of leukocytes from treated and control rats were examined by flow cytometry, and second, the primary immune response to SRBC was evaluated. In rats, leukocytes of the following classes showed normal morphology and distribution in all animals: CD3+/CD4+, CD3+/CD8+, CD45 RA+, and CD11b+. All values were within the historical control range.
The primary immune response to SRBC was evaluated by measuring mean relative a-SRBC titer in SRBC-immunized and nonimmunized GSNO-treated and control rats. The data show similar mean relative a-SRBC titer in GSNO-treated and untreated immunized rats, with no statistically significant differences between groups. The relative a-SRBC titer of 19 and 28 mg/kg per d groups and the control group was slightly higher than the high end of the range of historical control data. However, this observation does not affect the validity of the current study and does not imply that GSNO has immunomodulatory effects in rats or other species. This result may suggest that some rats in the study were highly responsive to SRBC.
Nitrate Toxicokinetics in Wistar Rats
Wistar rats were exposed to aerosolized GSNO via inhalation for 4 hours/d at 0, 3, 9.3, 19, or 28 mg/kg per d for 4 weeks followed by a 4-week recovery period. Because GSNO is unstable in plasma, toxicokinetic analyses were performed using plasma nitrate as a surrogate compound. Plasma nitrate levels, AUC8h and Cmax were determined from blood samples from 6 control and 10 treated rats/sex/group on days 1 and 28 of the dosing period. TK profiles were generated as a composite using data from different animals at different time points (each time point had 3 replicates [3 rats/time]). Because Tmax occurred at late time points, the terminal slope of the TK profile and the terminal nitrate half-life could not be determined from the available data.
In control rats, constitutive plasma nitrate concentrations were sometimes higher than concentrations observed in treated animals (Table 6). After GSNO inhalation treatment, the level of nitrate concentrations did not rise significantly above the constitutive levels, except at 4 hours post dosing for most treatment groups. Although the GSNO doses increased 9-fold over the selected dose-response range (3, 9.3, 19, and 28 mg/kg per d), plasma nitrate did not correlate with dose across the dose range tested. For example, on day 1 the increase in mean plasma nitrate AUC8h in male rats between the lowest and highest GSNO doses was 1.5-fold and in female rats was only 1.2-fold. Data values were similar at day 1 and during week 4. No significant gender differences were observed in GSNO-treated or control rats; the male-to-female ratio for nitrate AUC8h and Cmax on day 1 and week 4 ranged between 0.8 and 1.1.
Toxicokinetic Parameters for Plasma Nitrate After S-Nitrosoglutathione (GSNO) Inhalation in Male and Female Rats
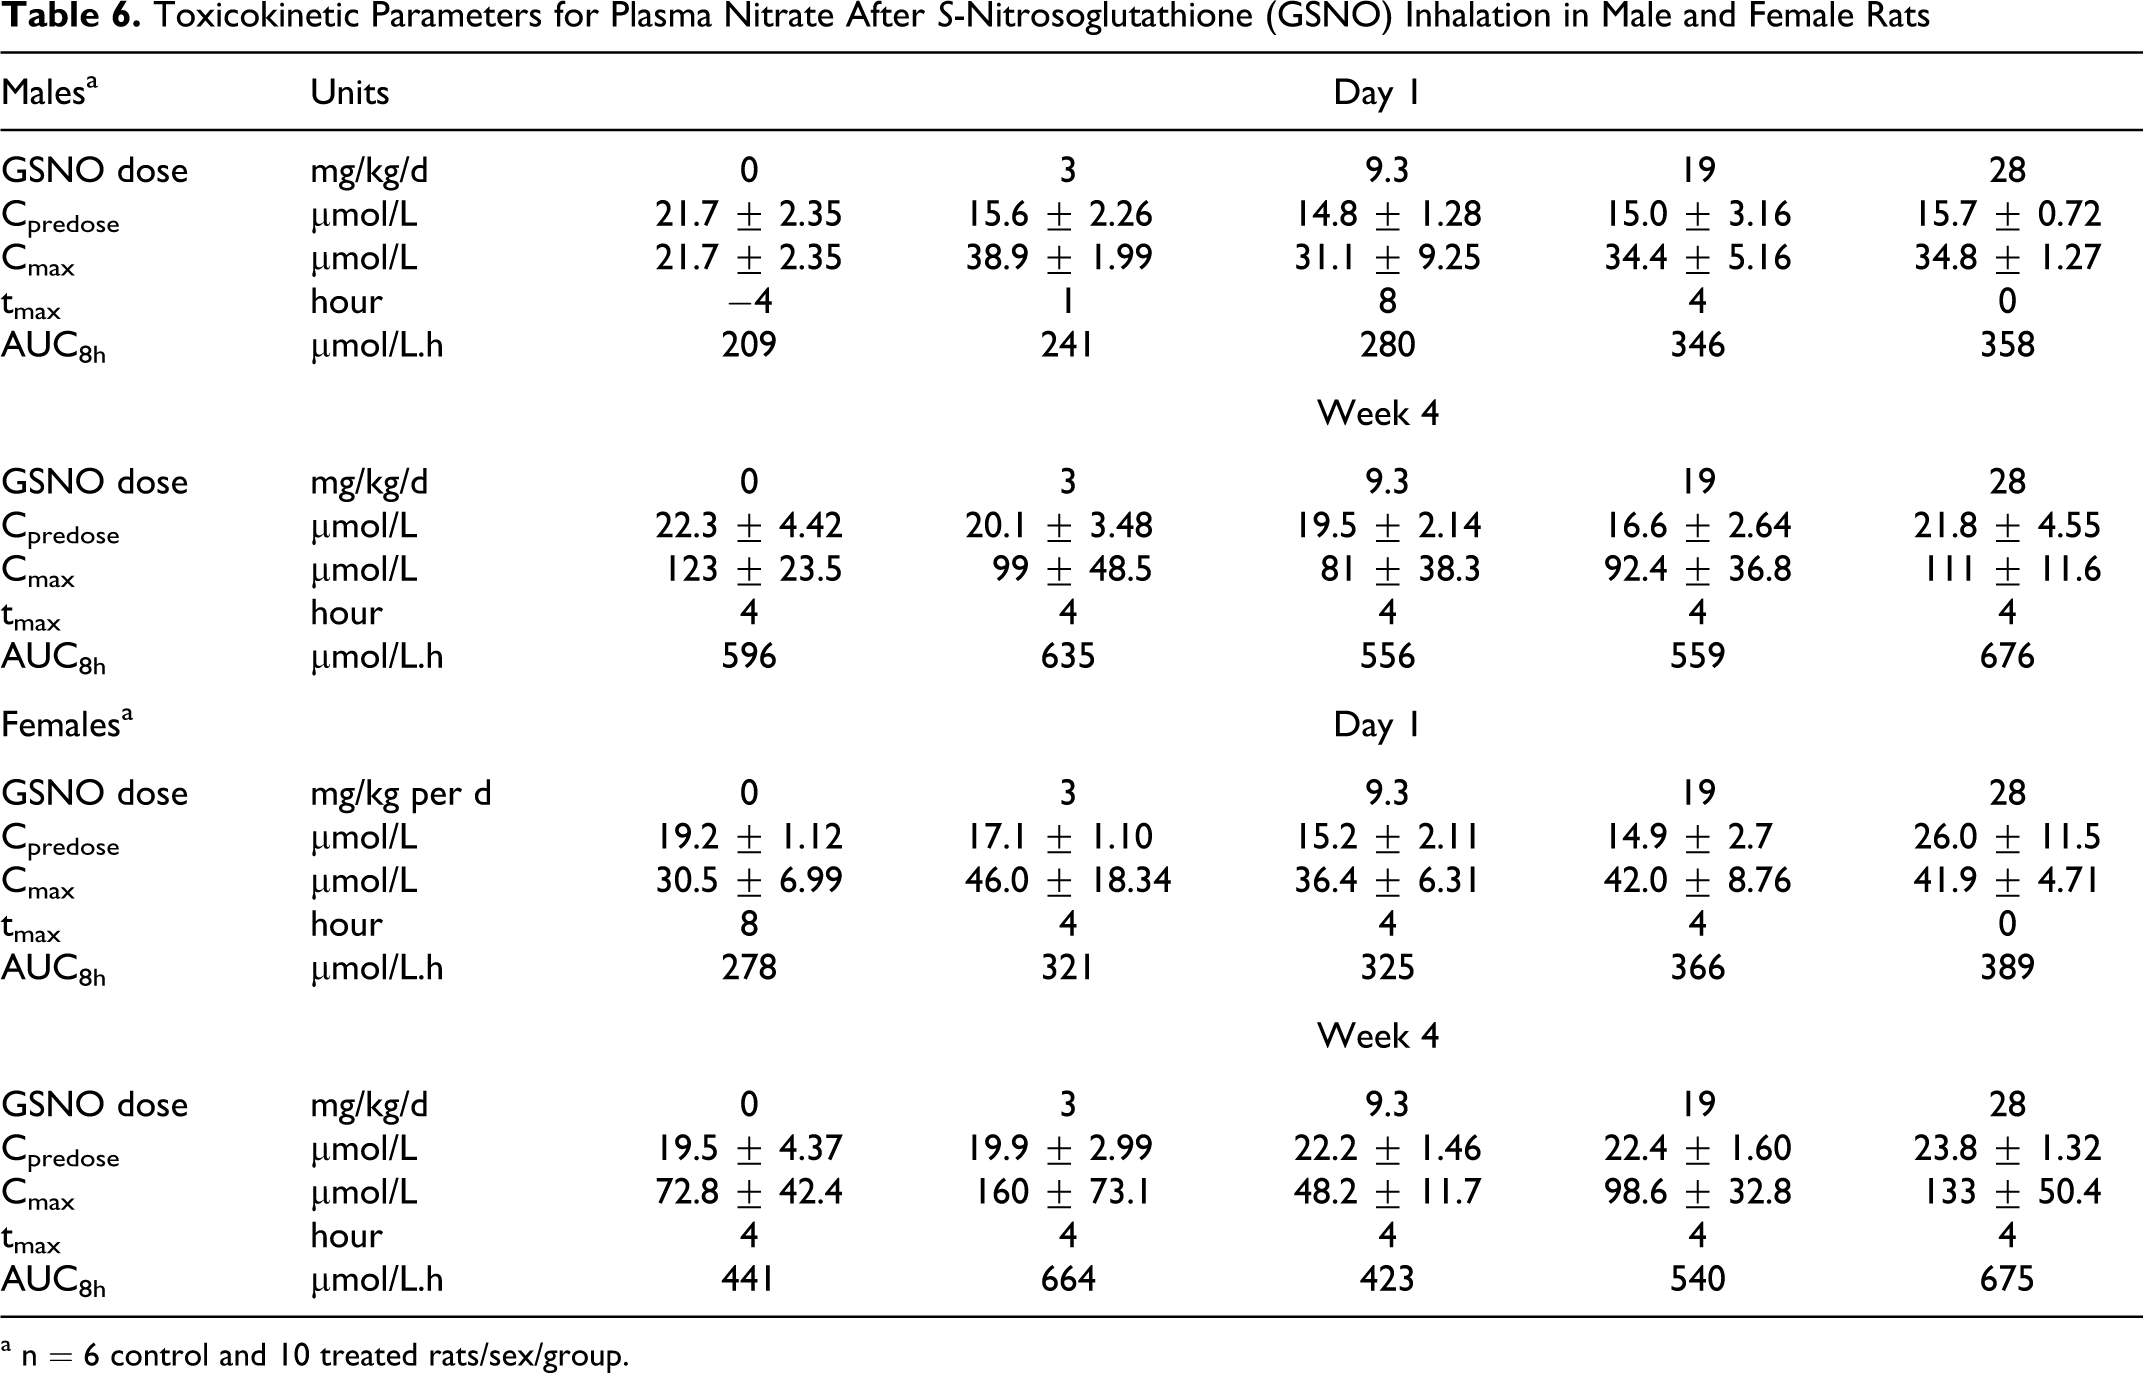
a n = 6 control and 10 treated rats/sex/group.
The amount of nitrate excreted in urine was quantified in samples collected over an 18-hour period on days 1 to 2 and 28 to 29, and mean urine nitrate data are presented in Table 7. No significant changes in urine nitrate were noted in the GSNO-treated or control group over the course of the study. There was a slight increase in urine nitrate in the high-dose group in comparison to the vehicle control group, but it was not statistically significant.
Mean Total Nitrate Content in Urine in Male and Female Rats
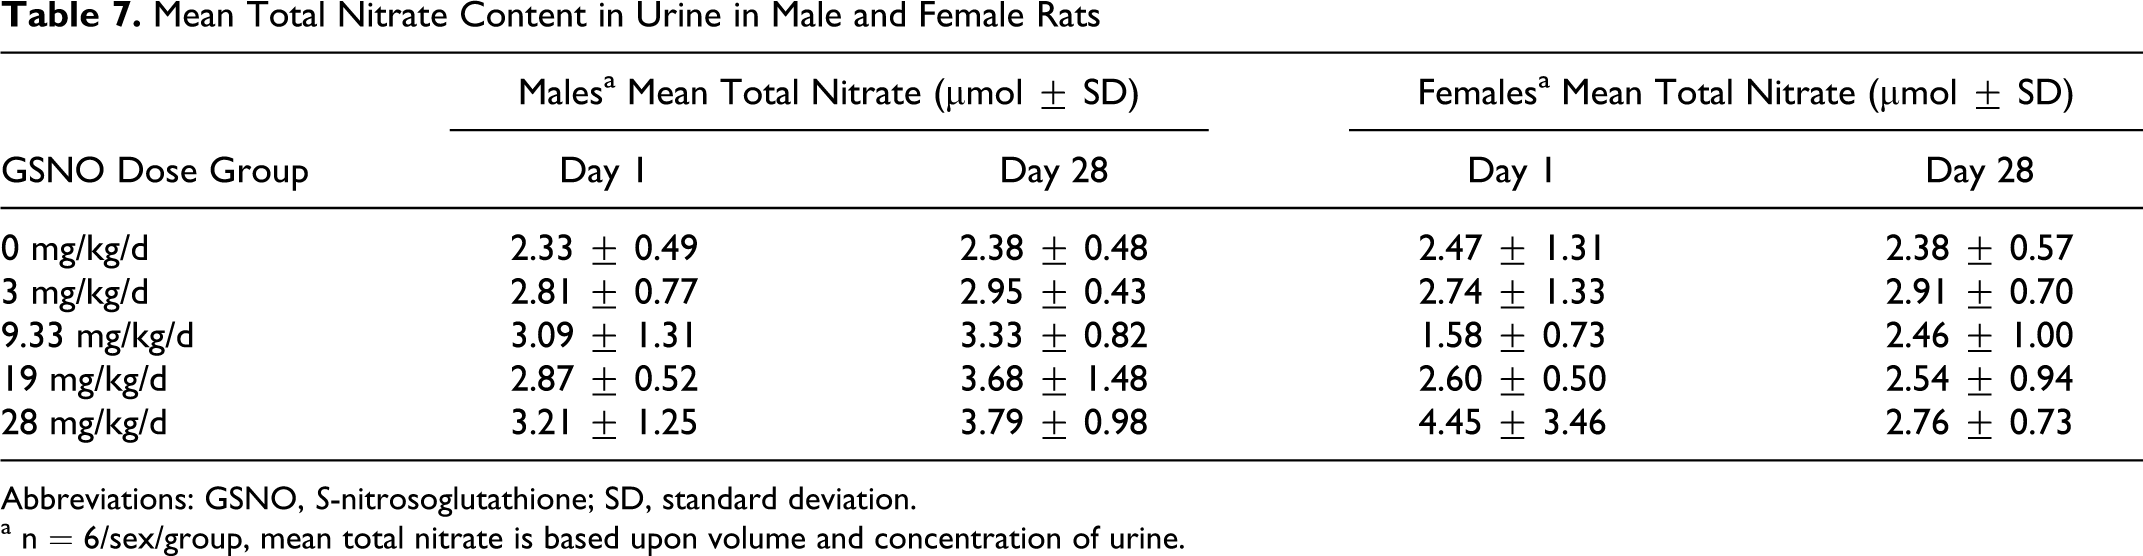
Abbreviations: GSNO, S-nitrosoglutathione; SD, standard deviation.
a n = 6/sex/group, mean total nitrate is based upon volume and concentration of urine.
Nitrate Toxicokinetics in Beagle Dogs
Thirty-two beagle dogs (16/sex) were treated once daily with nebulized vehicle or GSNO at achieved doses of 4.6, 9.0, and 16.2 mg/kg per d. Plasma nitrate was measured on day 1 and at week 4 of the treatment period. The plasma nitrate concentrations showed a wide range of interanimal variability in control animals (CV: 16%-82%) and even greater interanimal variability in GSNO-treated animals (CV: 2%-103%). In all GSNO test groups, plasma nitrate was quantified in a sufficient number of samples to allow the determination of AUC8h, Cmax, and Tmax. Peak plasma nitrate concentration was observed between 0.75 and 8 hours; therefore, the descending phase of the toxicokinetic profiles could not be determined for all animals and thus is not shown.
Mean constitutive nitrate was unchanged over the course of the study (Table 8). Plasma nitrate concentrations (AUC8h and Cmax) did not show a clear relationship with dose; concentrations tended to increase with increasing dose but less than proportionally and not consistently. Mean nitrate AUC8h was similar in all groups at day 1 and week 4, such that the week 4/day 1 ratio of mean nitrate AUC8h was 1.0 to 1.5 and 0.9 to 1.4 for male and female dogs, respectively. Mean plasma nitrate Cmax increased somewhat at week 4 (range of mean ratios: 1.2-3.4). In week 4, the predose nitrate concentrations of the GSNO-treated groups was between 9.44 and 15.5 µmol/L for male dogs and between 12.3 and 13.3 µmol/L for female dogs. These levels are comparable to levels in control animals (ie, constitutive nitrate) and within the range of predose values on day 1 for all dose groups (ie, 9.39-17.4 µmol/L). Mean nitrate AUC8h and Cmax were unaffected by gender (ratios of AUC8h: 0.8-1.6 and Cmax: 0.6-1.7). These data suggest that inhaled GSNO did not bioaccumulate in dogs using the dose regimen tested in this study (ie, daily inhalation for 28 days).
Toxicokinetic Parameters for Plasma Nitrate After GSNO Inhalation in Male and Female Dogs
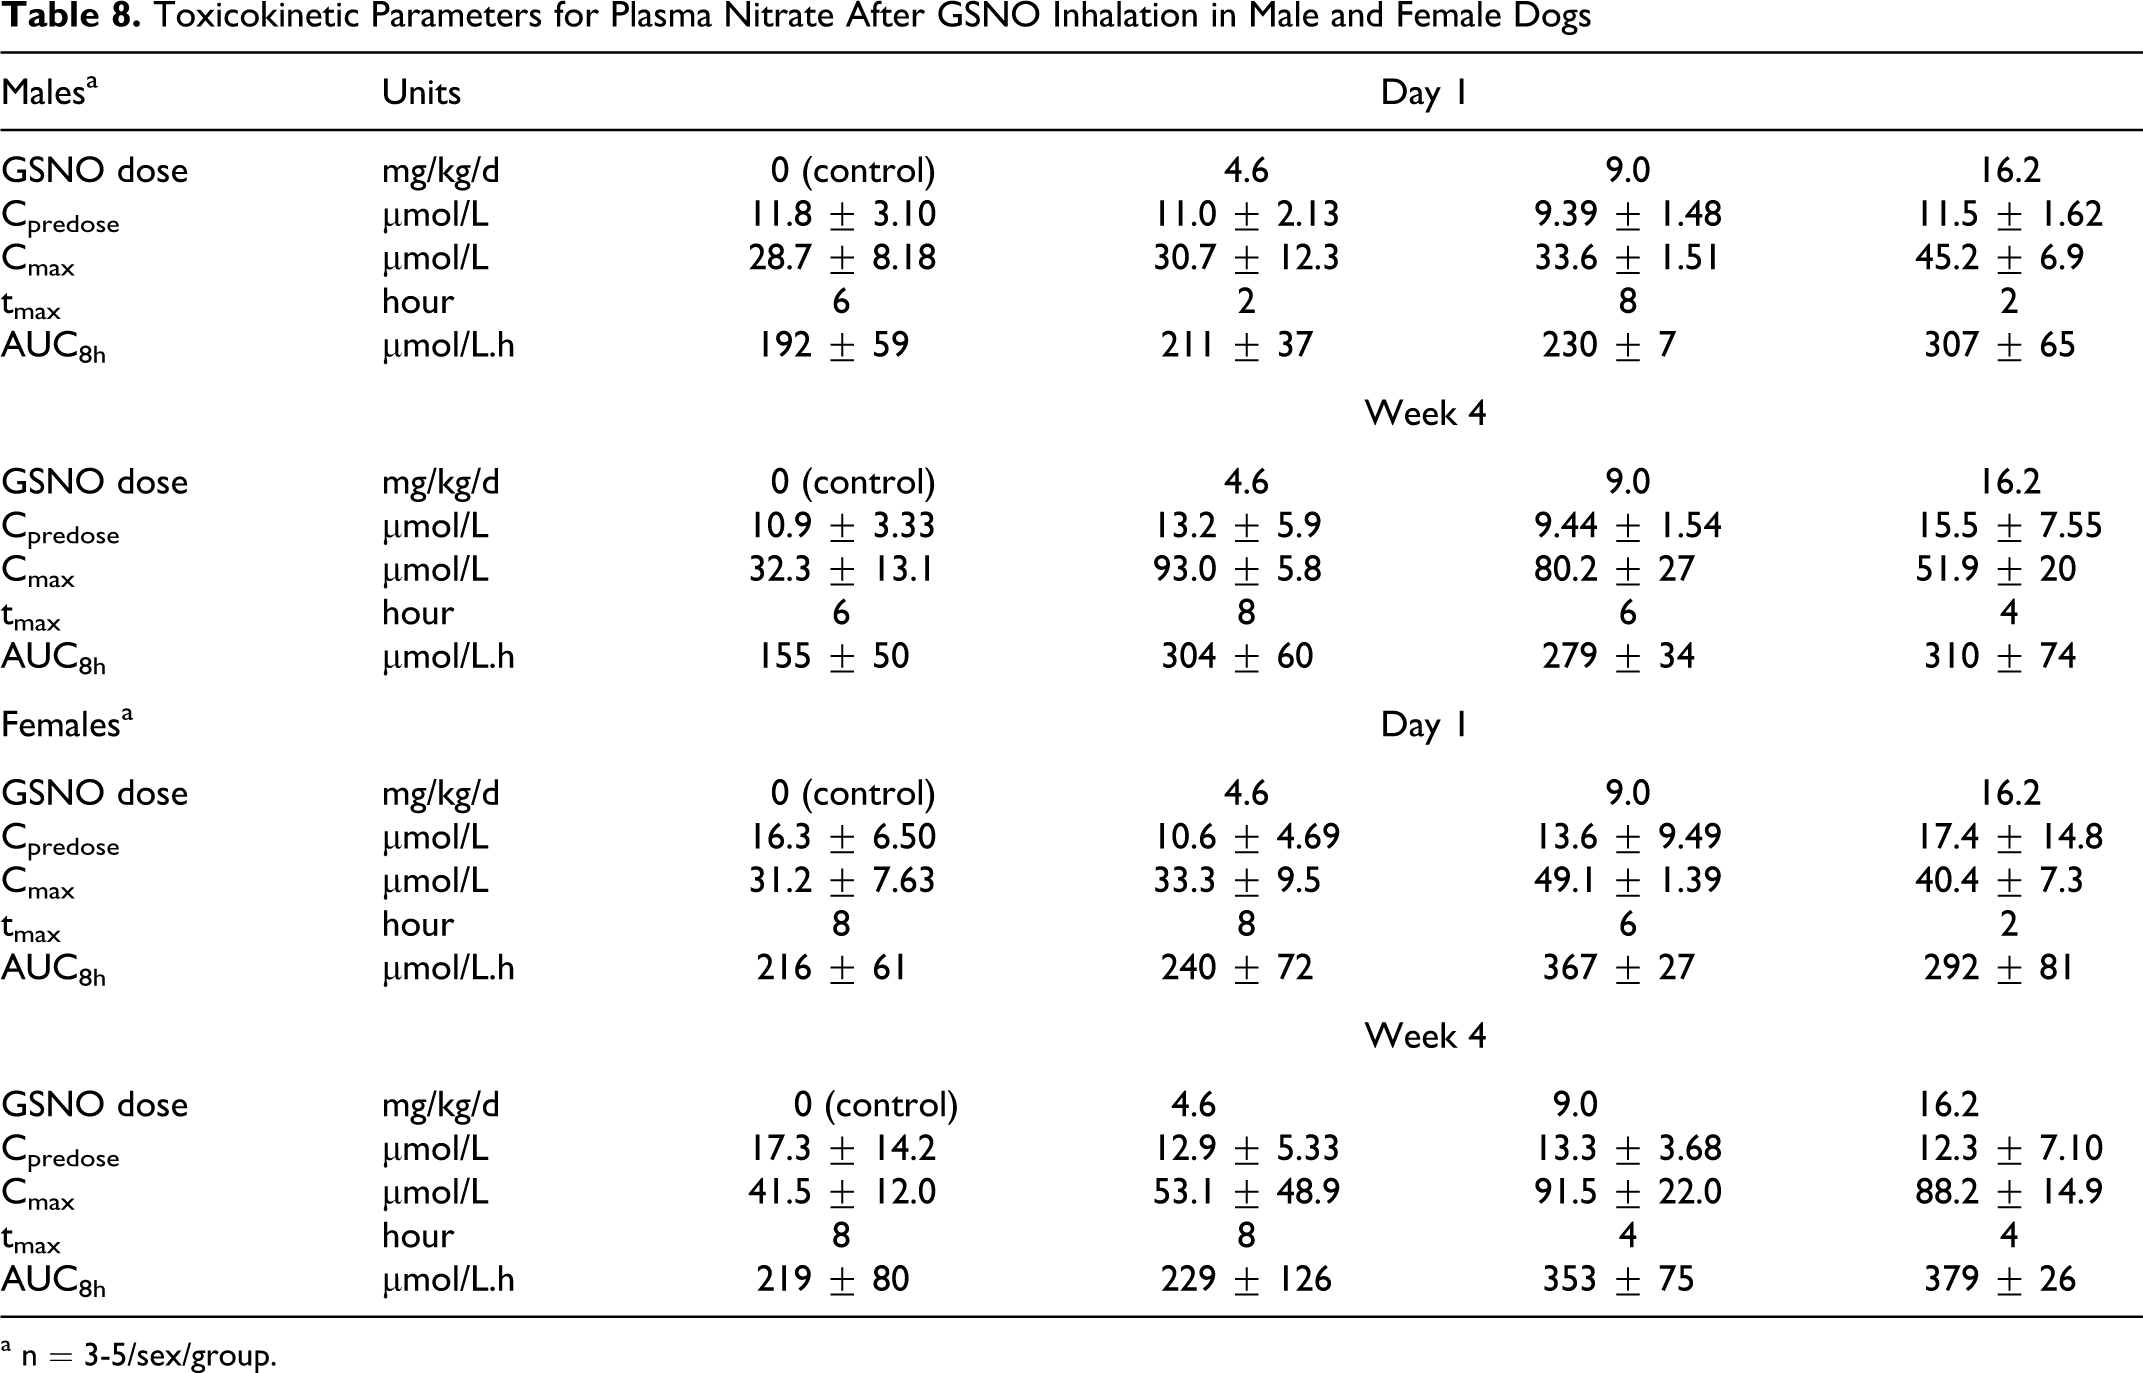
a n = 3-5/sex/group.
Mean urine nitrate concentration was measured on days 1 and 28 and is presented in Table 9. Urine was collected via catheters at a discrete time point (6 hours post dose). No significant change in urine nitrate concentration was noted in the low- and mid-dose GSNO-treated and control groups over the course of the study. There was an increase in urine nitrate concentration in the high-dose group (16.2 mg/kg per d) in comparison to the vehicle control group on both days 1 and 28, but due to large variability it was not statistically significant. This finding may suggest, however, that urine nitrate is a more useful surrogate for GSNO administration in dogs than plasma nitrate, which did not demonstrate any changes following GSNO exposure.
Mean Nitrate Concentration in Urine in Male and Female Dogs
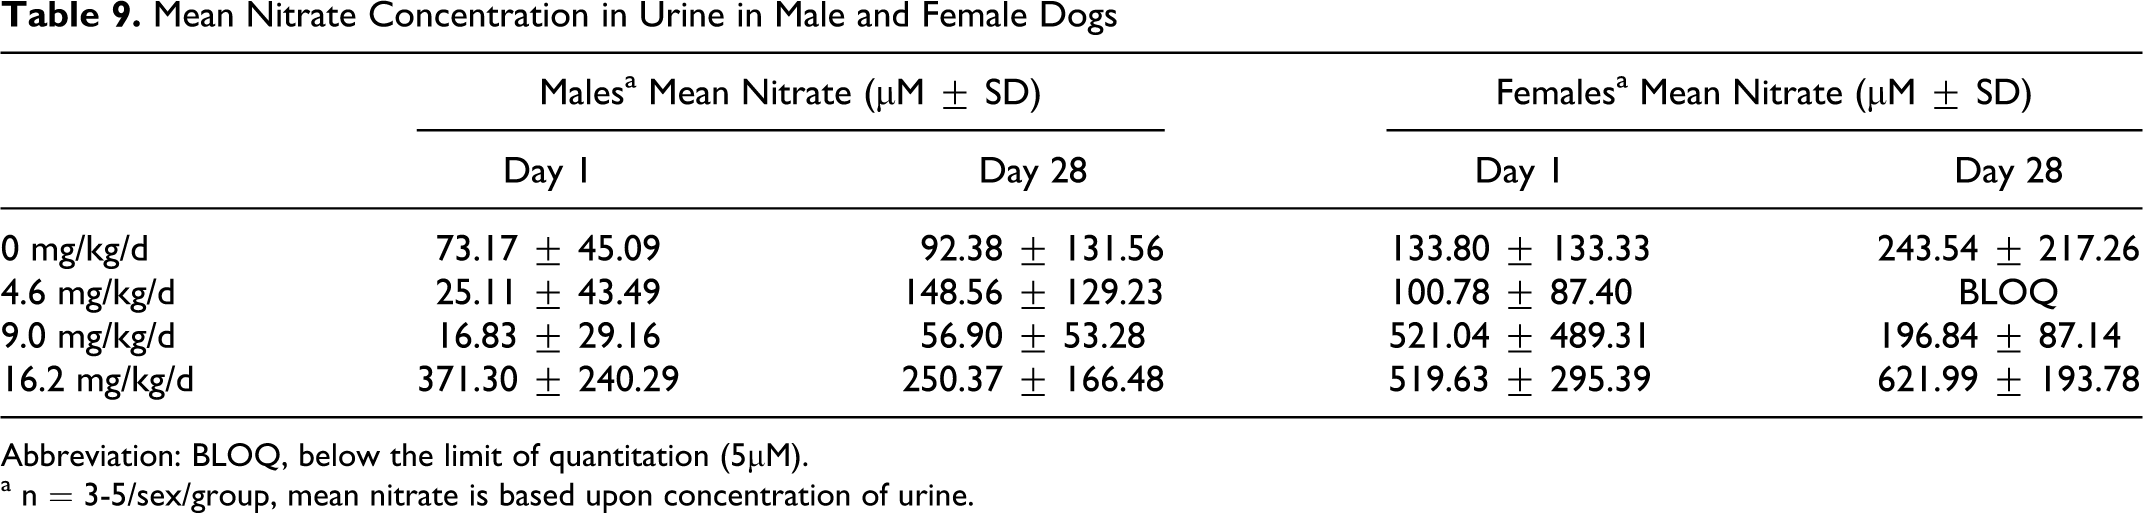
Abbreviation: BLOQ, below the limit of quantitation (5μM).
a n = 3-5/sex/group, mean nitrate is based upon concentration of urine.
Discussion and Conclusions
S-nitrosoglutathione is an endogenous bioavailable source of NO that is a key regulator of NO signaling. Since the discovery of NO as the primary cardiovascular endothelial cell relaxation factor, a substantial body of evidence demonstrates that both NO and GSNO play critical biological roles in normal metabolism. Recent evidence also demonstrates convincingly that NO and GSNO play significant roles in modulating a wide variety of human disease states.5,15–19 Therefore, it has been proposed that GSNO could be effective to treat diseases characterized by reduced levels of NO or GSNO. Given the depletion of GSNO in airways of asthmatic patients, 20 it seems possible that inhaled GSNO might increase local concentrations of low-molecular-weight S-nitrosothiols, and this might have therapeutic benefit. However, from a toxicologic perspective, possible sequelae of increasing available NO include vasodilation, methemoglobinemia, apoptosis, and/or platelet aggregation.16,21,22 In the present study, nebulized GSNO was administered subchronically to Wistar rats and beagle dogs, and potential toxicities and TK properties were evaluated over the 28-day exposure and 28-day recovery periods. The adverse effects that were observed were mild and not considered biologically significant.
There were no effects in rats or dogs on ophthalmologic, hematology, urinalysis, methemoglobin levels, organ weights, or microscopic assessments. Male rats showed a mild reduction in overall body weight and reduced weight gain throughout the study. In dogs, GSNO treatment increased total bilirubin levels. The etiology of this finding is unknown and may in fact be an artifact as these findings were limited to a few GSNO-treated and control animals and was not observed during the recovery period. All ECG findings were considered normal background alterations in laboratory beagle dogs of this age subject to inhalation studies with vehicle or test agents and were not indicative of treatment-related adverse effects.
Previous reports indicated that plasma nitrate is a reliable surrogate marker for in vivo NO metabolism. 15 However, in the present study plasma nitrate exposure increased only slightly but not proportionately with increasing dose. In rats, plasma nitrate was not affected by gender or by 4 weeks of repeat daily dosing at the highest GSNO dose tested in this study. Mean plasma nitrate AUC8h was somewhat higher at week 4 than on day 1 in rats, but, this increase was observed in control and GSNO-exposed rats, and therefore could not be attributed to GSNO treatment under the tested experimental conditions. In dogs, the variability in endogenous plasma nitrate was very high; thus, this surrogate marker could not be used to assess the effect of GSNO dosing in dogs.
Urine nitrate was unaffected by GSNO administration in rats. In the dog, however, high doses of GSNO did lead to an increase in mean urine nitrate concentration (due to substantial variability in the concentrations, they were not statistically significant). The finding may suggest that urine nitrate in dogs may be a more useful surrogate marker of high-dose GSNO exposure than plasma nitrate, which was not a reliable marker.
The immunotoxic potential of GSNO was examined by evaluating the primary humoral response against a known immunogen, SRBC, in GSNO-treated and control animals. In this assay, SRBCs act as a strong immunogen and thus are recognized by antigen-presenting cells and specific Thelper cells, which activate SRBC-specific B-lymphocytes and subsequent secretion of anti-SRBC IgM antibodies. The immunotoxicological investigation performed here demonstrated that GSNO had no adverse immunological impact in rats. In addition, exposure to GSNO was not associated with any biologically relevant variation in the morphology or distribution of leukocytes.
In summary, this study demonstrates that GSNO is well tolerated by and nontoxic in rats and dogs when administered daily for 28 days by inhalation. We note that the current study was not performed at the maximally tolerated GSNO dose in dogs or rats; however, within a 28-day treatment period, the maximally achievable GSNO concentration was utilized. Finally, the results of this study show that the NOAEL for GSNO via daily inhalation for 28 days is 28 mg/kg per d in rats and 16.2 mg/kg per d in dogs.
Footnotes
Acknowledgments
The authors would like to thank Dr David Alexander for his preliminary work and thoughtful advice that provided the basis for these inhalation toxicology studies. The authors would also like to thank Dr Daniel Drolet for his editorial review of this manuscript.
The author(s) declared no conflicts of interest with respect to the research, authorship, and/or publication of this article.
The authors declared the following source of funding: The employees of N30 Pharmaceuticals and all contracted work is not funded by government assistance. All work is solely supported by N30 Pharmaceuticals.