
Abstract
With the increasing use of herbal medicines and dietary supplements, intensive concerns about their potential toxicities have been raised. Screening and identifying the toxic compounds from these botanical products composed by hundreds of components have become a critical but challenging problem. In this study, 3 methods, including fraction separation, an in-house-developed fluorescein diacetate-based automatic microscopy screening (FAMS) platform, and liquid chromatography-mass spectrometry-based compounds identification were integrated within the Three-Stage-Integrative (TSI) approach for the identification of potential hepatotoxicants from botanical products. The sensitivity and linear range of FAMS assay was validated and compared with 3-(4,5-dimethylthiazol-2-yl)-2,5-diphenyl tetrazolium bromide (MTT) assay by previously reported hepatotoxic compounds. The success of TSI approach was further demonstrated by its application to Fructus aristolochiae. Aristolochic acid IVa and aristolodione were tentatively identified to be potential hepatotoxicants in this plant. These applications suggested that our TSI approach provides an effective tool for identifying potential toxic compounds from botanical products.
Introduction
In recent years, botanical products including herbal medicines and dietary supplements are gaining increasing popularity worldwide for health care system and raising application for treating various diseases or promoting health. Although most of botanical products are claimed to be nontoxic and thought to be safe in comparison with synthetic drugs, their potential toxicity is unknown. Problems and concerns about their safety arise due mainly to intrinsic toxicity, improper storage, herb-drug interactions and etc. 1 For instance, herbal medicines are often used without any problem, but serious toxicities and unwanted adverse effects do occur, such as hepatotoxicity, 2 –4 nephrotoxicity, 5 cardiotoxicity, 6 carcinogensis, 7 etc. Meanwhile, there are raising adverse event reports, such as liver injury associated with consumption of dietary supplements, especially those used for weight loss. 8 This is not surprising because botanical products are usually complex mixtures, containing hundreds of different compounds, some of which have beneficial and/or hazardous effects. 9 Therefore, it is necessary and important to identify and remove toxic compounds from botanical products to reduce the risk of the related harm.
Unfortunately, there are few reports on large-scale screening of toxic compounds from the botanical products, especially via in vitro methods, although many approaches were employed to evaluate the cytotoxicity of the pure chemicals. For instance, 3-(4,5-dimethylthiazol-2-yl)-2,5-diphenyl tetrazolium bromide (MTT)-based cytotoxicity testing in cell lines has become one of the mostly-used tools for screening toxic chemicals 10 ; Protein-binding dyes assay, such as Sulforhodamine-B colorimetric assay, is widely applied for evaluating the toxicity of the compounds; 11 Radioactive isotopes assays, such as 3 H-uridine assay, are used for quantifying the cell numbers. 12 In addition, as summarized by Keshelava et al. 13 dye exclusion assay (Trypan blue), fluorometric microculture cytotoxicity assay (FMCA), and adenosine triphosphate cell viability assay are another common cytotoxicity assays. 12 However, the common drawback of these methods, that is time-consuming, impedes the progress of their application of large-scale screening. Therefore, it is necessary to develop rapid in vitro approaches, such as automatic cytotoxicity assay, to enhance the throughput of the screening process. Moreover, it is almost impossible to identify toxic compounds from botanical products by simply applying the in vitro assays to them. In fact, it is not a trivial work to screen and identify toxic compounds from an extremely complex mixture composed by hundreds of compounds, the structures of some of which are unknown. Conceptually, there are at least 3 stages for the identification of toxic compounds from botanical products. Firstly, the botanical products need to be separated into several parts with relatively simple constitutes, for example fractions, before any in vitro toxicity screening method is performed. And then, the chemical compositions of the screened toxic fractions usually are unknown, which need to be further identified by sophisticated instrumental analysis approach.
As proof-of-concept, we proposed a Three-Stage-Integrative (TSI) approach by integrating fraction separation, rapid toxic fractions screening, and liquid chromatography-mass spectrometry-based compounds identification, for identifying potential hepatotoxic compounds from botanical products in this study. In particular, we specifically developed a fluorescein diacetate-based automatic microscopy screening (FAMS) platform for large-scale toxic fractions screening. Fluorescein diacetate is a fluorescent dye, which can easily permeate the cell membrane and be subsequently hydrolyzed by intracellular esterases in viable cells into fluorescein that cannot permeate the cell membrane (being trapped within the viable cell). Hence, only viable cells are detected using this method. The performance of FAMS assay, including sensitivity and linear range, were validated by previously reported hepatotoxic compounds, including acetaminophen, chlorpromazine hydrochloride, valproic acid, and amiodarone hydrochloride, and compared with those of MTT assay.
More importantly, the utility of our TSI approach is further demonstrated by its application to Fructus aristolochiae, a widely used herbal medicine in China for relieving cough and asthma. The herb was isolated into 30 fractions, which were screened on human hepatoma cell line HepG2 and human normal hepatocyte cell line HL-7702 using FAMS assay, respectively. Finally, the potential hepatotoxic compounds were identified by using liquid chromatography-mass spectrometry (LC-MS). A total of 13 fractions and 2 compounds (aristolochic acid IVa and aristolodione) were tentatively identified to be potential hepatotoxicants in this plant, which suggested that the TSI approach is an effective tool for identifying potential toxic compounds from botanical products.
Methods and Material
As illustrated in Figure 1 , the proposed TSI approach for identifying potential toxic compounds from botanical products essentially includes 3 steps: fractions of botanical products were firstly obtained through extraction, isolation, and preparation processes. Next, these fractions were automatically screened by FAMS assay in cell line HepG2 and HL-7702. Lastly, the compositions of the screened potential hepatotoxic fractions were identified by the LC-MS, an analytical chemistry technique for elucidating the possible chemical structures of compounds by determination of their molecular weight.
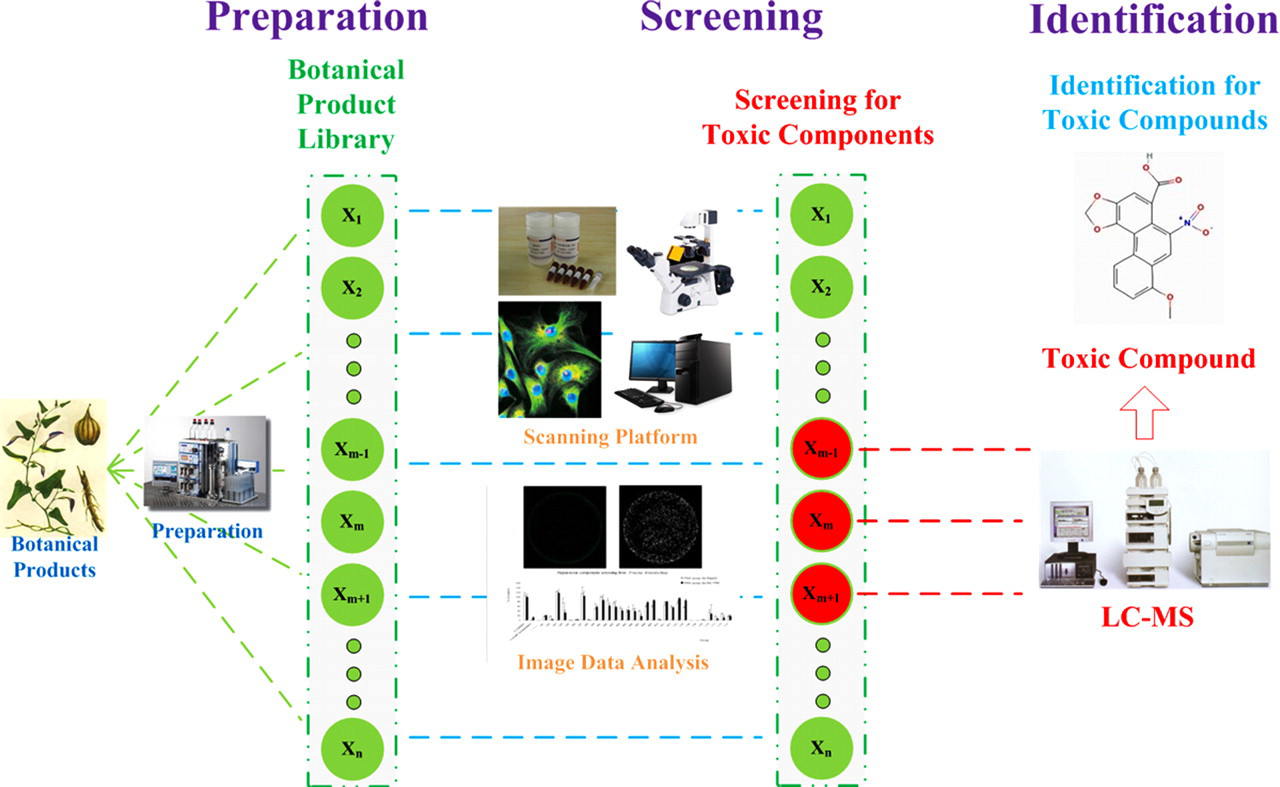
The Three-Stage-Integrative (TSI) approach for identifying toxic compounds from botanical products. The left panel showed the preparation process of the fractions of botanical products. The middle panel showed the screening process for the toxic fractions. The right panel showed the process of identification of the toxic compounds.
Materials
In order to validate the FAMS platform, the following known hepatotoxicants were used: acetaminophen, chlorpromazine hydrochloride, amiodarone hydrochloride, valproic acid (Alfa Aesar, Heysham, Lancs). Rosiglitazone, diphenhydramine, ketotifen, and propranolol (National Institute for the Control of Pharmaceutical and Biological Products, Beijing, China) were used as nonhepatotoxic compounds. Crude herbal material of Fructus aristolochiae was purchased from Hangzhou traditional Chinese medicine market (Hangzhou, China). Fluorescein diacetate and MTT was used to carry out cell viability assay. Unless otherwise indicated, chemicals and reagents were purchased directly from Sigma Inc. (St. Louis, Missouri). The water used in all experiments was prepared through Milli-Q Synthesis (Millipore, Milford, Massachusetts). The human hepatoma cell line HepG2 and human normal hepatocyte cell line HL-7702 were obtained from Shanghai Cell Bank, the Institute of Cell Biology, China Academy of Sciences (Shanghai, China). All cell culture reagents were from Gibco (Grand Island, New York). The investigation conforms to the principles outlined in the Declaration of Helsinki. The Ethics Committee of the Medical College of Zhejiang University approved all procedures.
Preparation of Botanical Products Fractions
Crude herbal material of Fructus aristolochiae was crushed through 20 mesh sieve, and dried at 50°C for 5 hours. Herbal material (200 g) was subsequently extracted in 3 kinds of solvents. Firstly, the material was extracted for 1 hour in 90°C water bath with 8 volumes solvent (1600 mL, anhydrous ethanol: ethyl acetate = 1:1, v/v), and extracted for twice, the filtrate of which was labeled as part 1. Secondly, the remaining dregs were extracted with 8 volumes of 70% ethanol in 95°C water bath for twice, and the filtrate was labeled as part 2. Thirdly, the residue was extracted with 8 volumes of purified water for 1 hour with electric heating for twice, and the filtrate marked as part 3. The filtrates were concentrated with a rotary evaporator and lyophilized (SpeedVac Concentrator, Thermo, Electron Corporation, USA) to get crude fractions as A01, A02, and A03, respectively.
Furthermore, A01 (the supernatant of 10 g A01 dissolved in 15 mL anhydrous ethanol) was further separated through Büchi medium-pressure ODS column (Borosilicat 3.3, Switzerland) with elution procedure as follows: 5 column volumes (CV) 30% ethanol, 5 CVs 95% ethanol, and 5 CVs of anhydrous ethanol. Then each eluant was concentrated in a rotary evaporator (60°C) and lyophilized to get crude fractions as A04, A05, and A06, respectively. Similarly, A02 (the supernatant of 15 g A02 dissolved in 20 mL 50% methanol) was isolated as follow: 5 CVs 5% ethanol, 5 CVs 50% ethanol, and 5 CVs 95% ethanol, getting the crude fractions A07, A08, and A09, respectively.
Consequently, the fractions A05 and A08 were further separated through Agilent 1100 series preparative liquid chromatography (Agilent Company, USA). Briefly, 2 g A05 was dissolved in 20 mL 95% ethanol, 2 g A08 in 20 mL 50% ethanol, and both filter with 0.45 μm filter membrane twice. The mobile phase consists of water and acetonitrile. The elution gradient is as follows: for A05: 0 minute, water: acetonitrile = 95:5; 4 minutes, water: acetonitrile = 95:5; 54 minutes, water: acetonitrile = 50:50; 64 minutes, water: acetonitrile = 5:95; for A08: 0 minutes, water: acetonitrile = 80:20; 4 minutes, water: acetonitrile = 80:20; 19 minutes, water: acetonitrile = 50:50; 54 minutes, water: acetonitrile = 5:95; 64 minutes, water: acetonitrile = 5:95. Column temperature was kept at 30°C, the flow rate was 10 mL min-1 and the detection wavelengths were at 203, 230, 254, 280, and 320 nm. The collection began at 4 minutes, and the fraction for 4-minute interval was collected as 1 fraction. After lyophilizing, we got fractions C01-C15 from A05 and B01-B15 from A08.
Hardware and Set-Up of the FAMS System
Patrick Reynolds et al developed a fluorescence digital image microscopy system (DIMSCAN) for quantifying relative cell numbers in multiwell culture plates. 14 The DIMSCAN has been used to study the drug resistance patterns of neuroblastoma cell lines etc. 15 Inspired by the framework of DIMSCAN, we hereby developed a fluorescence-image-based automatic microscopy screening platform, that is FAMS, for large-scale screening of toxic fractions.
The FAMS system consisted of an inverted fluorescence microscope Leica DMI 6000 B (Leica Microsystems, Wetzlar, Germany), which was equipped with a pinpoint accuracy scanning stage using 2-PHASE VEXTA Stepping Motor (Oriental Motor CO, Ltd. Tokyo, Japan), a stage controller, and a digital color ultra high sensitive cooled progressive scan matrix (Charge-coupled device, CCD) camera (1392×1040 pixels, Leica DFC 310 FX, Leica Microsystems CMS GmbH, Germany). A Pentium(R) Dual-Core microcomputer ran the main application software Cell Detection 1.0, which was developed in our laboratory, and controlled all the movable parts of the system. The linkage of CCD camera to Leica DMI 6000 B microscope and the microcomputer was through a Leica C-mount adapter (1 × HC f. 1”, Magnification 1) and an IEEE1394b FireWire interface, respectively, which enabled a fast and reliable data transfer from the camera to the computer memory.
Automated Fluorescent Image Acquisition
With Cell Detection 1.0 software, 6 images per well were taken underneath the 96-well microplates through a Leica 2.5×/0.07 N PLAN objective lens, and 6 images per well were autospliced together to form a whole well image. The filter used to detect fluorescein diacetate staining fluorescence was L5 (Leica, ex. BP 480/40 nm, Dichromatic Mirror 505 nm, SupressionFilter BP 527/30), and green fluorescence was taken through CCD camera. Besides, the algorithm for auto-focus movements of the stepper motor scanning stage was developed, which accelerated the scanning procedure and guaranteed the acquisition of high resolution images. With the system, it took up within 18 minutes to finish image acquisition of the inner 60 wells of a 96-well microplate (exposure time: 500 ms). Through Cell Detection 1.0, random combinations of wells can be assigned as you like, and the man-machine interaction was rather friendly.
Image Data Analysis and Output
After the auto-splice of the 6 images of each well was finished, each whole-well image was treated by a in-house-developed software with a series of processes, including image preconditioning, background noise elimination (digital thresholding), image binaryzation, and multiparameter generation (cell numbers, cell areas and fluorescent intensity). Detailed process was as follows: (1) The whole-well image was converted to grayscale images, and the fluorescence background was eliminated for homogenizing the brightness of the full image, according to the characteristics of the images; (2) After elimination of nonuniform fluorescence background, image segmentation method was applied to separate cells from background, as there was apparent contrast degree between the background and the cells in visual fields; (3) Corresponding area and intensity of cells labeled with fluorescein diacetate were calculated according to the separation of cells from background, and the cell number was estimated by the total area. The parameters were then imported into the Microsoft Excel (2000 version), in which the dose-response relationship curves were drawn, and the IC50 values (the concentration that produced 50% inhibition) of the studied chemicals were calculated by Microsoft GW-BASIC (Version3.22), an IC50 calculator.
Cell Treatment With Hepatotoxic Compounds, Nonhepatotoxic Compounds, and the Fractions From Fructus aristolochiae
HepG2 cells were grown in 80-cm 2 plastic flasks (Corning, NY) in Dulbecco’s modified eagle medium supplemented with 10% (v/v) fetal calf serum, and 1% nonessential amino acids, and kept in a humidified atmosphere of 95% air/5% CO2. HL-7702 cells were grown in 80-cm 2 plastic flasks (Corning, NY) in RPMI medium 1640 supplemented with 10% (v/v) fetal bovine serum and kept in a humidified atmosphere of 95% air/5% CO2. All measurements were carried out on confluent cells at 4 to 8 passages.
The cells in tissue culture flask were digested with 0.25% trypsin-0.02% EDTA solution when they achieved an 80% confluence. Then, cells were seeded at a density of 3000 cells per well in 96-well microplates (Corning, New York) and cultured overnight. The next day, the culture medium in wells was discarded and 200 μL fresh medium was added in each well. To carry out a dose-response assay with the hepatotoxicants, acetaminophen, chlorpromazine hydrochloride, valproic acid, amiodarone hydrochloride stock solutions were diluted to final concentration as 13.65 mmol/L, 163.5 μmol/L, 15.275 mmol/L, and 11.68 μmol/L, respectively, which were further diluted to 8 series concentrations in 2-fold dilution gradients using cell culture medium, respectively. To carry out a dose-response assay with the nonhepatotoxic compounds, rosiglitazone, diphenhydramine, ketotifen, and propranolol stock solutions were diluted to final concentration as 100 μmol/L, which were further diluted to 7 series concentrations in 2-fold dilution gradients using cell culture medium, respectively. The final coculture concentration of the fractions from Fructus aristolochiae was 50 μg/mL. To carry out a dose-response assay with the potential hepatotoxic fractions, C06, C08, and C09 stock solutions were diluted to final concentration as 50 μg/mL, which were further diluted to 5 series concentrations in 2-fold dilution gradients using cell culture medium, respectively. Subsequently, the microplates were returned to cell culture conditions for 48 hours.
Considering the evaporation-related edge effects in the outer wells, only the inner 60 wells of 96-well microplate were used, and each concentration had 3-well replicates. In both the dose-response and potential hepatotoxic compounds screening assays, untreated wells and Dimethyl sulfoxide (DMSO)-treated wells were set as control group and vehicle control group, respectively.
Cell Viability Labeling With Fluorescein Diacetate
Cells (HepG2 and HL-7702) were seeded at a density of 3000 cells per well in 96-well microplates and allowed to adhere overnight, in which only the inner 60 wells of 96-well microplates were used. The excitation and emission wavelengths of fluorescein diacetate are 488 nm and 530 nm, respectively. In this study, media was removed from each well the next day, and 100 μL phosphate buffer saline (PBS) containing 2.5 μg/mL fluorescein diacetate was added. Subsequently, the plates were maintained in the dark at room temperature for 15 minutes, followed by washing with PBS. There was no liquid left in the wells when the acquisition of fluorescent images was carried out on our FAMS platform. The fluorescence of fluorescein diacetate was detected with Filter L5 by setting exposure time at 500 ms. About 18 minutes was required to complete a 60-well scan if using a Leica 2.5×/0.07 N PLAN objective lens. Herein, we called the method mentioned above as FAMS assay.
In brief, the viability of the cells, which were coincubated with fractions from Fructus aristolochiae for 48 hours, was evaluated with FAMS assay in the similar way.
MTT Cell Viability Assay
A comparative study was performed using FAMS assay and the conventional MTT assay. After 48 hours coincubation with compounds or the fractions from Fructus aristolochiae, MTT assay was carried out. Cells were incubated with the MTT reagent for 4 hours. The absorbance was recorded by an ELx 800 automated microplate reader (550 nm, Winooski, Vermont) except the experiments of linear dynamic range and cell treatment with hepatotoxic compounds which were recorded by a TECAN Infinite F200 multimode microplate reader (595 nm, TECAN, Salzburg, Austria). Cell viability was calculated according to the optical density (OD) value.
Z′ Factor Calculation for the Comparison of FAMS Assay and MTT Assay
The Z′ factor was calculated according to the report by Zhang et al.
16
Equation was as shown below,

The Identification of Potential Hepatotoxic Compounds
LC analyses were performed on an Agilent 1100 high-performance liquid chromatography (HPLC) instrument (Agilent, Waldbronn, Germany) coupled to a binary pump, a diode-array detector, an autosampler, and a column compartment. The samples (screened potential hepatotoxic fractions) were separated on a Zorbax SB-C18 column (5 m, 4.6 × 250 mm, Japan). The mobile phase consisted of water containing 0.1% formic acid (A) and acetonitrile (B), with a gradient from 30% (v/v) B to 95% B in the first 60 minutes, then hold for 10 minutes. The mobile phase flow rate was 0.7 mL/min. Low resolution mass spectra were acquired using a Finnigan LCQ Deca XPplus ion trap mass spectrometer (Thermo Finnigan, San Jose, California) connected to the Agilent 1100 HPLC instrument via an electrospray ionization (ESI) interface. The acquisition parameters were as follows: collision gas, ultrahigh-purity helium (He); nebulizing gas, high purity nitrogen (N2); ion spray voltage 4.5 kV; sheath gas (N2) 30 arbitrary units; auxiliary gas (N2) 10 arbitrary units; capillary temperature 350°C; capillary voltage 19 V; tube lens offset voltage 25 V; mass range recorded m/z 140 to 1000. A thermo LTQ-Orbitrap XL instrument (Thermo Electron, Bremen, Germany) was utilized to obtain the high resolution mass spectra. The resolution at m/z 400 was 60000. An external calibration for mass accuracy was performed the day before the test. The mass spectrometric data was collected from m/z 210 to 1000 in positive ion mode.
Results
Optimization of Fluorescein Diacetate Concentration for FAMS Assay
FDA, a fluorochrome that accumulates only in viable cells, was used in our study for cell viability evaluation. 17 The concentration effect of fluorescein diacetate on labeling of HepG2 and HL-7702 cell lines was investigated. Both cell lines were seeded at the density of 3000 cells per well in the inner 60 wells of 96-well microplates, followed by fluorescence intensity measurement the next day. The series concentrations of fluorescein diacetate, 0.078, 0.156, 0.313, 0.625, 1.25, 2.5, 5, 10, 20, and 40 μg/mL, were examined. The fluorescence intensity of both cell lines was enhanced with the increasing fluorescein diacetate concentration (Figure 2 ). Finally, a relatively low concentration (2.5 μg/mL) of fluorescein diacetate was chosen to minimize the interference of background fluorescence.
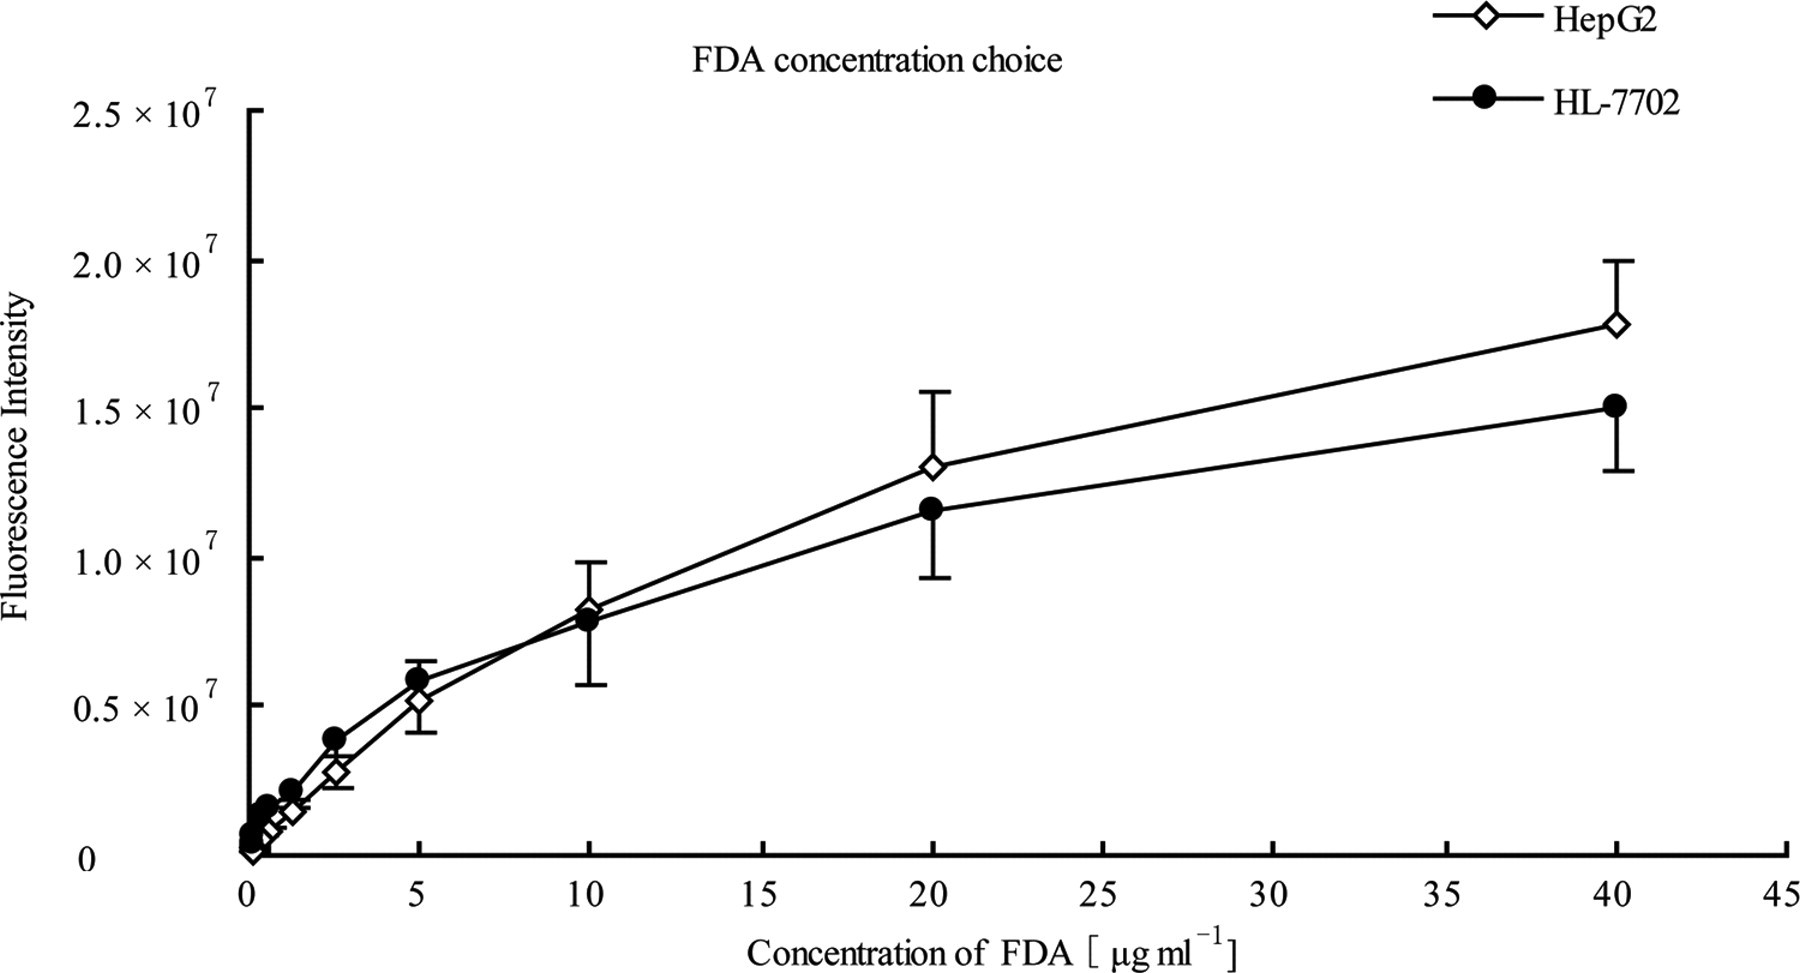
Fluorescein diacetate labeling concentration optimization. Both HepG2 (⋄) and HL-7702 cells (•) were seeded 3000 per well. The fluorescein diacetate incubation was carried out at dark room for 15 minutes with series fluorescein diacetate concentration: 0.078, 0.156, 0.313, 0.625, 1.25, 2.5, 5, 10, 20, and 40 μg/mL. The fluorescein diacetate-based automatic microscopy screening (FAMS) system was used to measure fluorescence intensity. Here, FDA stood for fluorescein diacetate.
The Specificity of Fluorescein Diacetate Labeling in FAMS Assay
In this study, 3 parameters (ie, cell number, cell area, and fluorescence intensity) were used to characterize the cell viability, while Reynolds et al 17 used the sum of pixel intensities per each well to represent the intensity of the fluorescein diacetate labeling fluorescence (ie, fluorescence intensity mentioned here). HepG2 cell line, an in vitro model often used to evaluate cytotoxicity, 18 –21 was used to predict hepatotoxicity of compounds and fractions from botanical products in this study. Meanwhile, human normal hepatocyte cell line HL-7702 was also used in the study. HepG2 and HL-7702 were seeded into 96-well microplates and allowed to grow overnight. The next day, microplates were gently loaded by multichannel pipettor with 100 μL per well of PBS containing 2.5 μg/mL fluorescein diacetate and incubated at dark room for 15 minutes. After incubation, plates were washed with 100 μL per well of PBS and then the PBS was discarded, after which fluorescence and recognized cell numbers of each well were determined with the FAMS system. The result was shown in Figure 3 , in which a consistency between recognized cell numbers and fluorescence intensity of each well could be found, which showed the FAMS assay was specific and stable during the scanning process. The total scanning time was within 18 minutes.
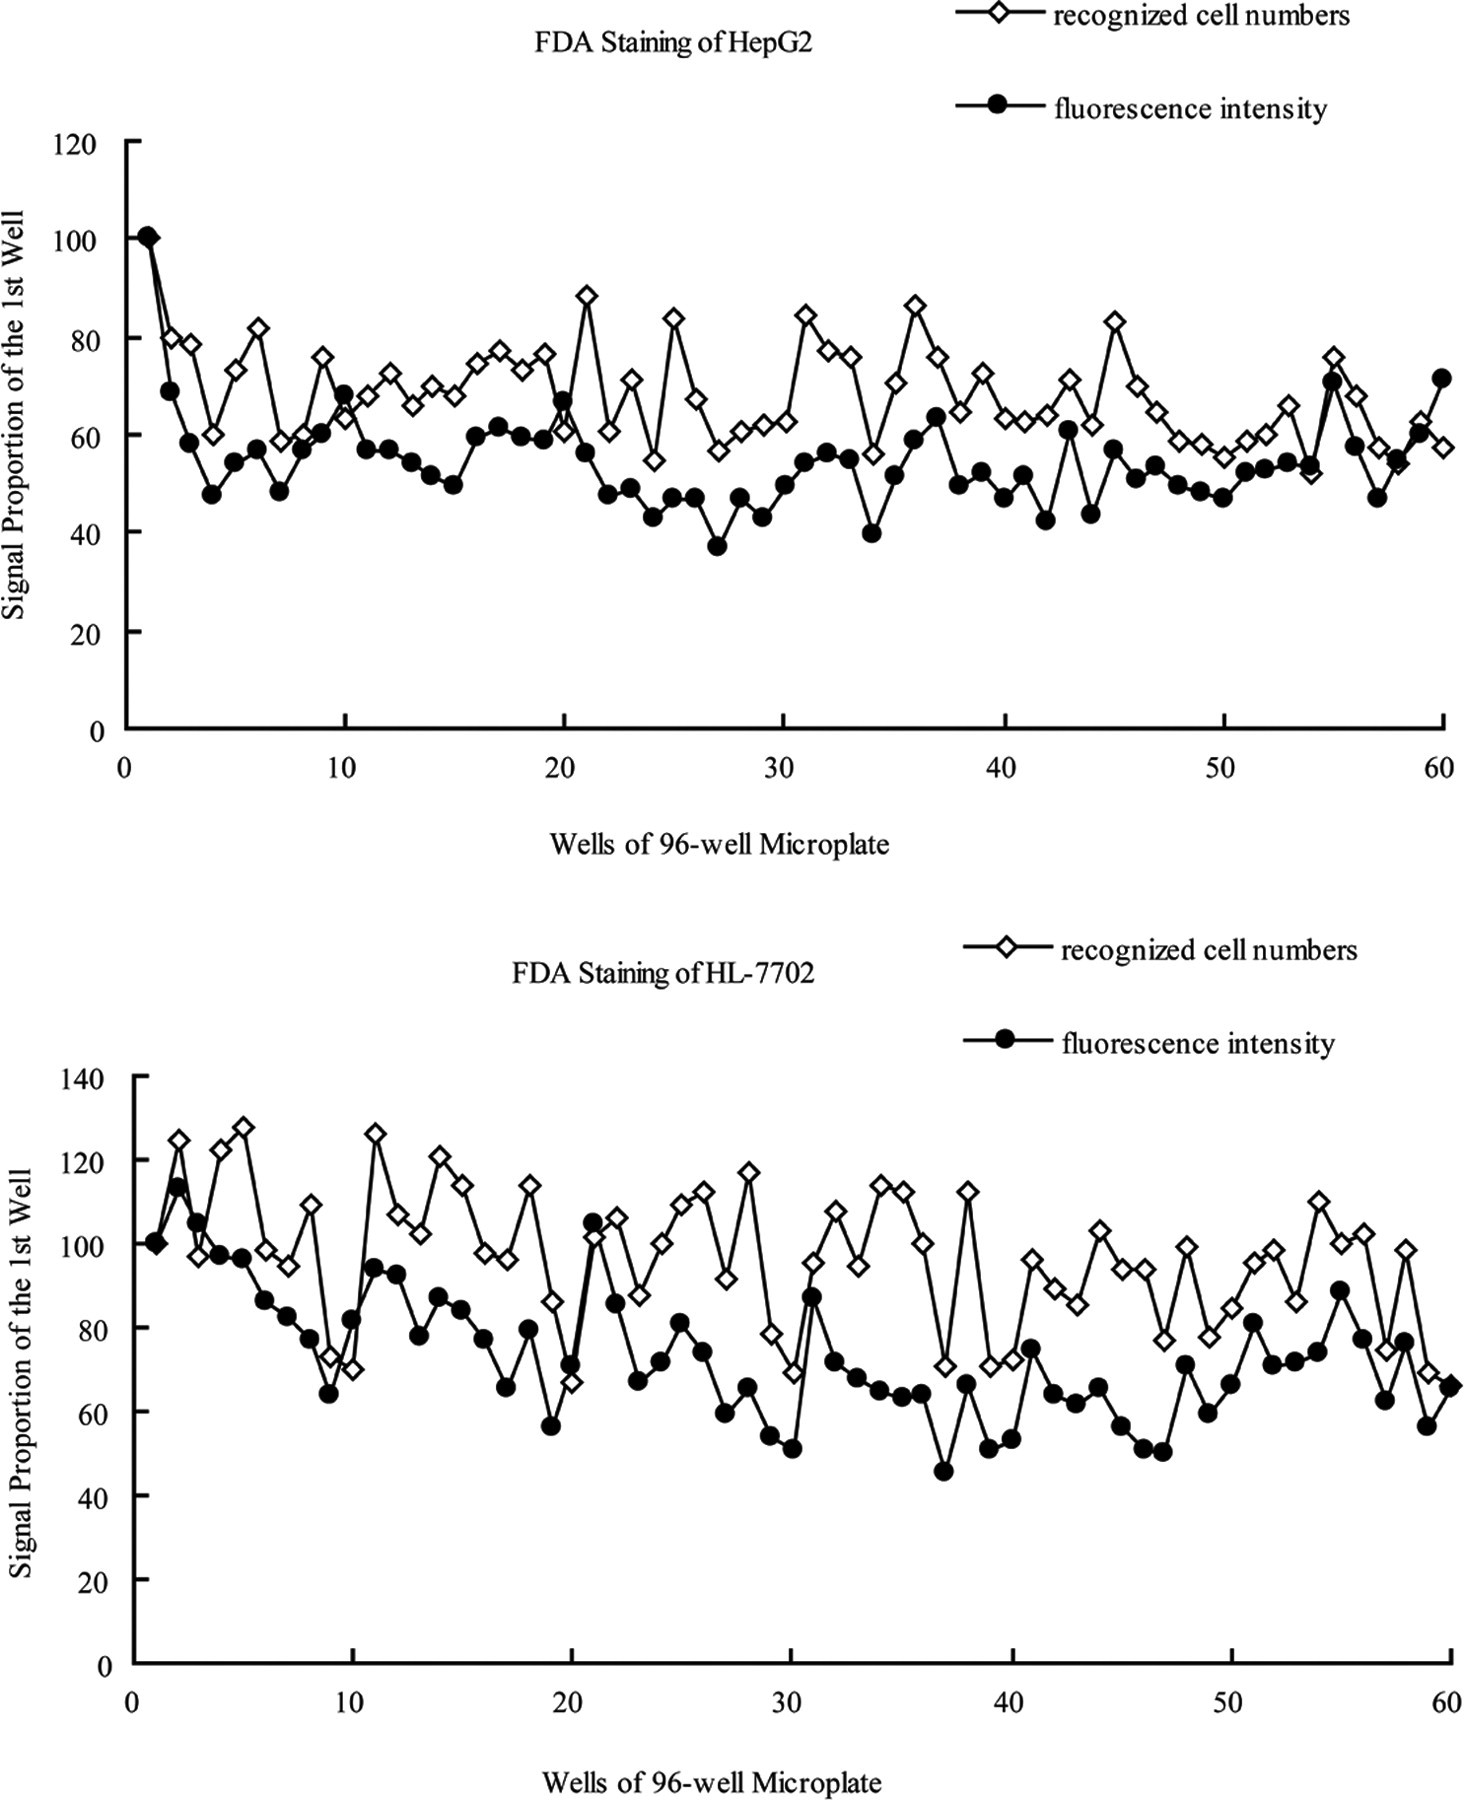
The 2 parameters, recognized cell numbers (⋄) and fluorescence intensity (•), were recognized by the fluorescein diacetate-based automatic microscopy screening (FAMS) system, exposing fields for 500 ms for L5 filter (Leica). Each value of the well was represented as a proportion of the signal of the first well. For HepG2 (A) and HL-7702 (B) cells, it showed a good consistency between the 2 parameters, and fluorescence intensity was stable and specific to represent viable cells. Here, FDA stood for fluorescein diacetate.
Comparison of Sensitivity and Linear Dynamic Range of FAMS Assay and MTT Assays
To make comparisons of FAMS assay with conventional MTT assay, the sensitivity and linear dynamic range of both assays were taken into consideration. HepG2 and HL-7702 were seeded in 96-well microplates with cell number from 25 to 500 00 in the manner of 2-folder increase. Each cell line was seeded parallelly in 2 plates. One was for FAMS assay and the other for conventional MTT assay. For FAMS assay, both HepG2 and HL-7702 cell lines (from 782 cells per well to 50000 cells per well) had a good linearity between cell numbers and fluorescence intensities, with Pearson linear correlation coefficient r = .9747, .9546, respectively, that was 1.8-log linear dynamic range. In comparison, for MTT assays, a good linearity between cell numbers and OD values obtained with HL-7702 cells ranging from 12 500 to 50 000, r = .9787 and a 0.6-log linear dynamic range; while HepG2 cells from 6250 to 25 000 showed a good linearity between cell numbers and OD values, with r = .9824 and linear dynamic range was 0.6-log (Figure 4 ). Herein, OD value for 50 000 cells per well could not be read from the TECAN Infinite F200 multimode microplate reader, as the absorbance overflowed with this cell number. Thus, FAMS assay had a more wide linear dynamic range for HepG2 and HL-7702 cells than the conventional MTT assay. Moreover, the FAMS assay was much more sensitive than MTT assay. FAMS assay was able to detect small numbers of cells, such as 25, 49, 98, and 196 cells per well. The fluorescence intensity of the four dilutions was increased when cells doubled. Nevertheless, the absorbance of the four dilutions (25, 49, 98, and 196 cells per well, respectively) acquired through MTT assay showed no difference among each other. As shown in the insets of Figure 4, the line of the first 6 data points of FAMS assay got a slope while that line of MTT assay was not evident enough.
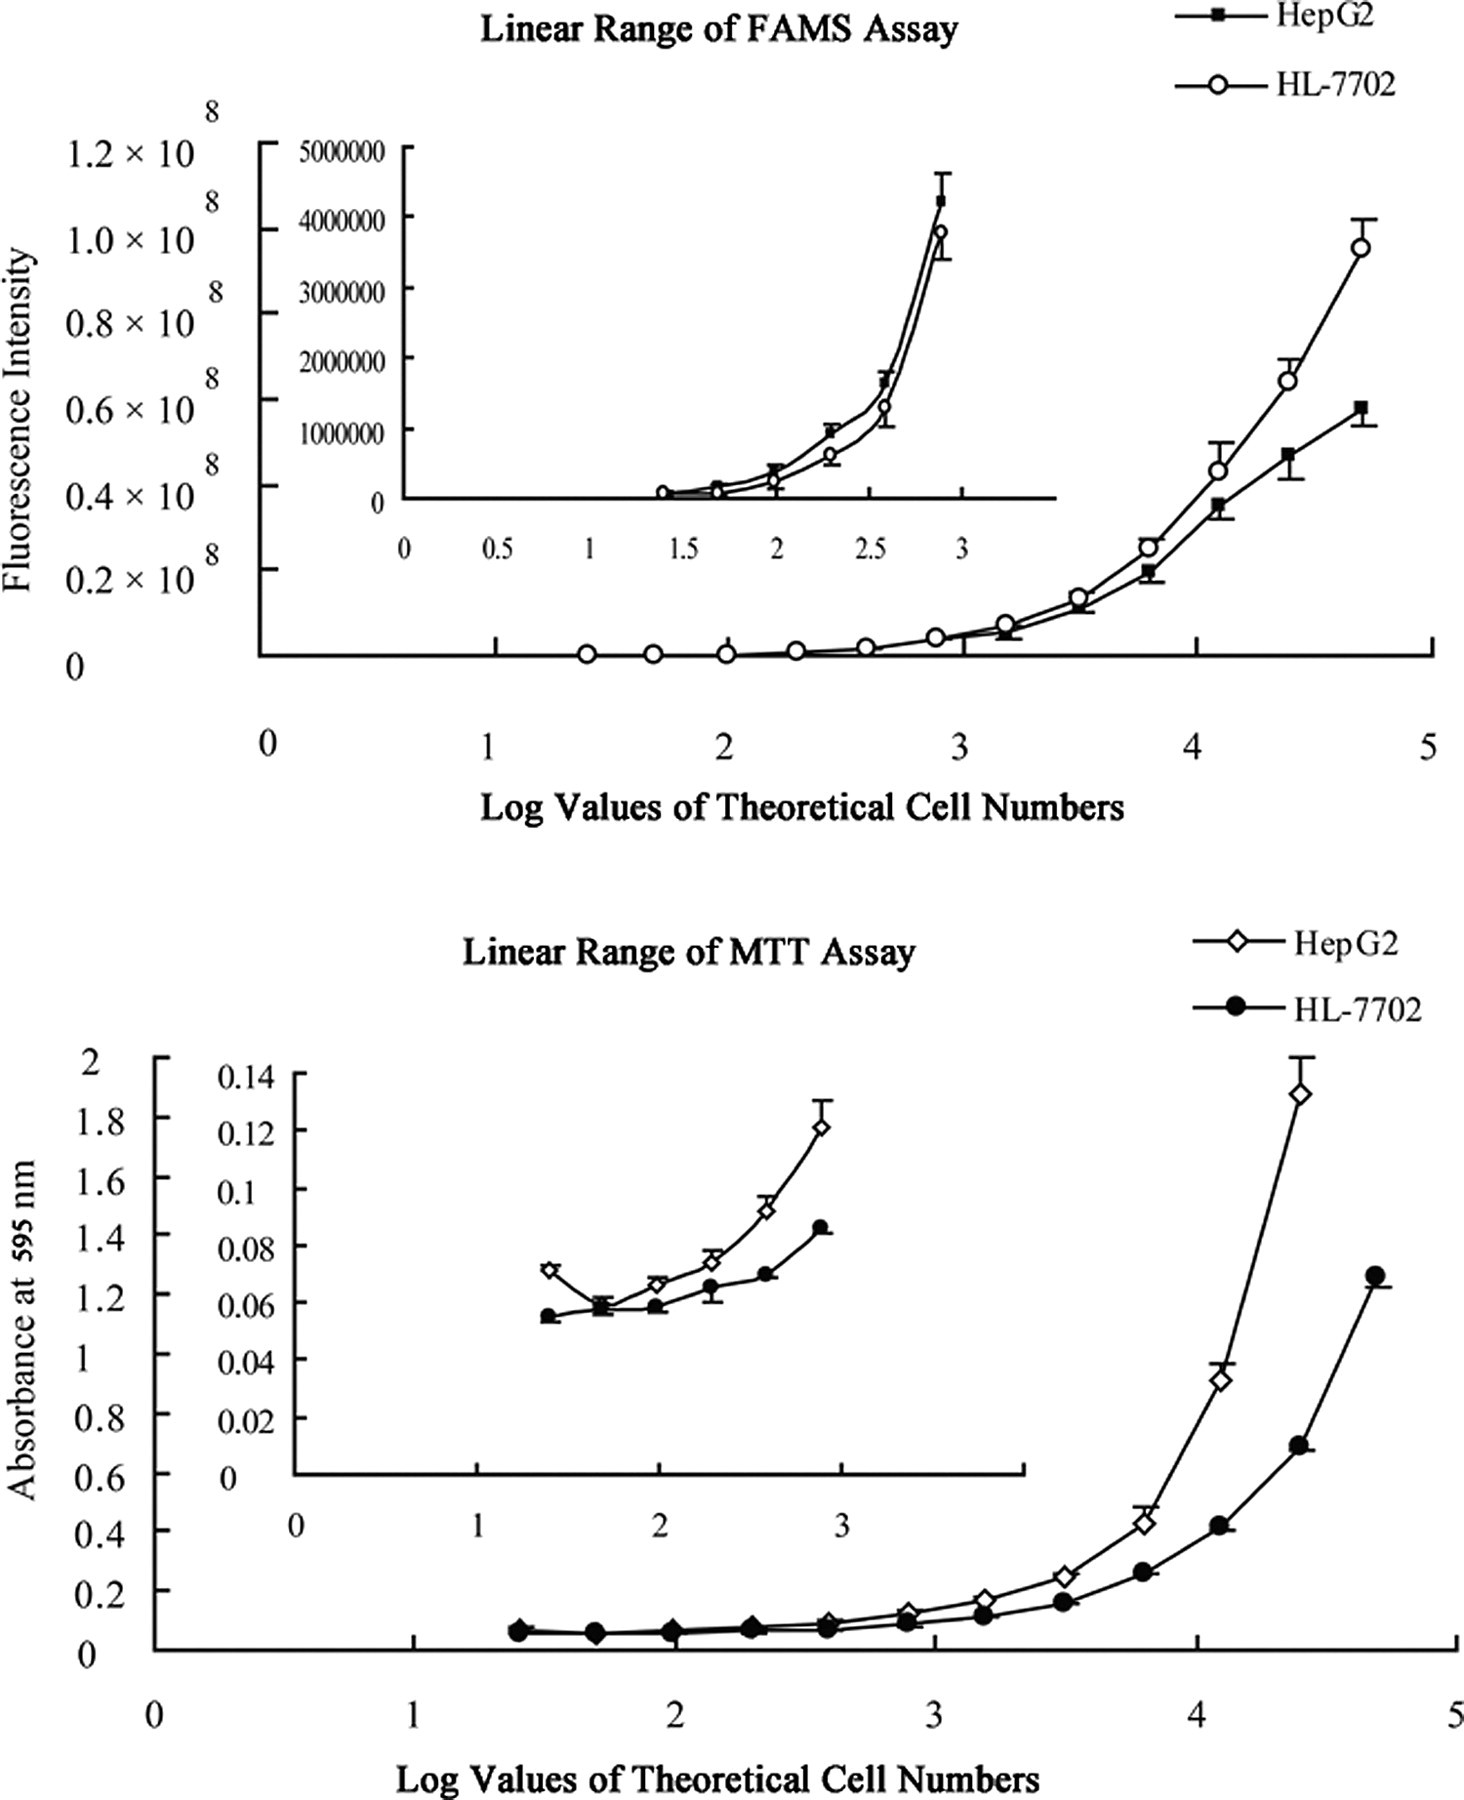
Linear dynamic range of fluorescein diacetate-based automatic microscopy screening (FAMS) assay and 3-(4,5-dimethylthiazol-2-yl)-2, 5-diphenyl tetrazolium bromide (MTT) assay, which showed the sensitivity and detection range of the 2 assays (the insets shows the sensitivity of two assays). HepG2 and HL-7702 cells were seeded by a 2-fold serial dilution (25-50000 per well) in 100 μL of culture medium. Data were mean ± SD values of 3 replicates. In order to illustrate more clearly, figures were charted using the signals of FAMS assay and MTT assay as Y axis and the log values of series double diluted cell numbers as X axis.
Cell Treatment With Hepatotoxic and Nonhepatotoxic Compounds
Acetaminophen, chlorpromazine hydrochloride, valproic acid, and amiodarone hydrochloride were tested on HepG2 and HL-7702 cell lines. FAMS assay and MTT assay were carried out to measure the dose-response relationship. The IC50 values obtained by FAMS assay for HepG2 cells on acetaminophen, chlorpromazine hydrochloride, valproic acid, and amiodarone hydrochloride were 2.559 mmol/L, 8.097 μmol/L, 7.488 mmol/L, and 13.137 μmol/L, while that of HL-7702 were 7.221 mmol/L, 14.284 μmol/L, 7.485 mmol/L, and 21.407 μmol/L, respectively.
As shown in Figure 5 , the dose-response curves obtained from MTT assay were similar to those produced by FAMS assay, but the latter provided a markedly wider dynamic range. Using the FAMS assay, acetaminophen (Figure 5A) and chlorpromazine hydrochloride (Figure 5B) showed more obvious dose-cytotoxicity response than valproic acid (Figure 5C) and amiodarone hydrochloride (Figure 5D). In addition, the FAMS assay was more sensitive and was then able to detect the small amounts of cells survived after the treatment of hepatotoxic compounds (Figure 5A and Figure 5B), comparing to MTT assay.
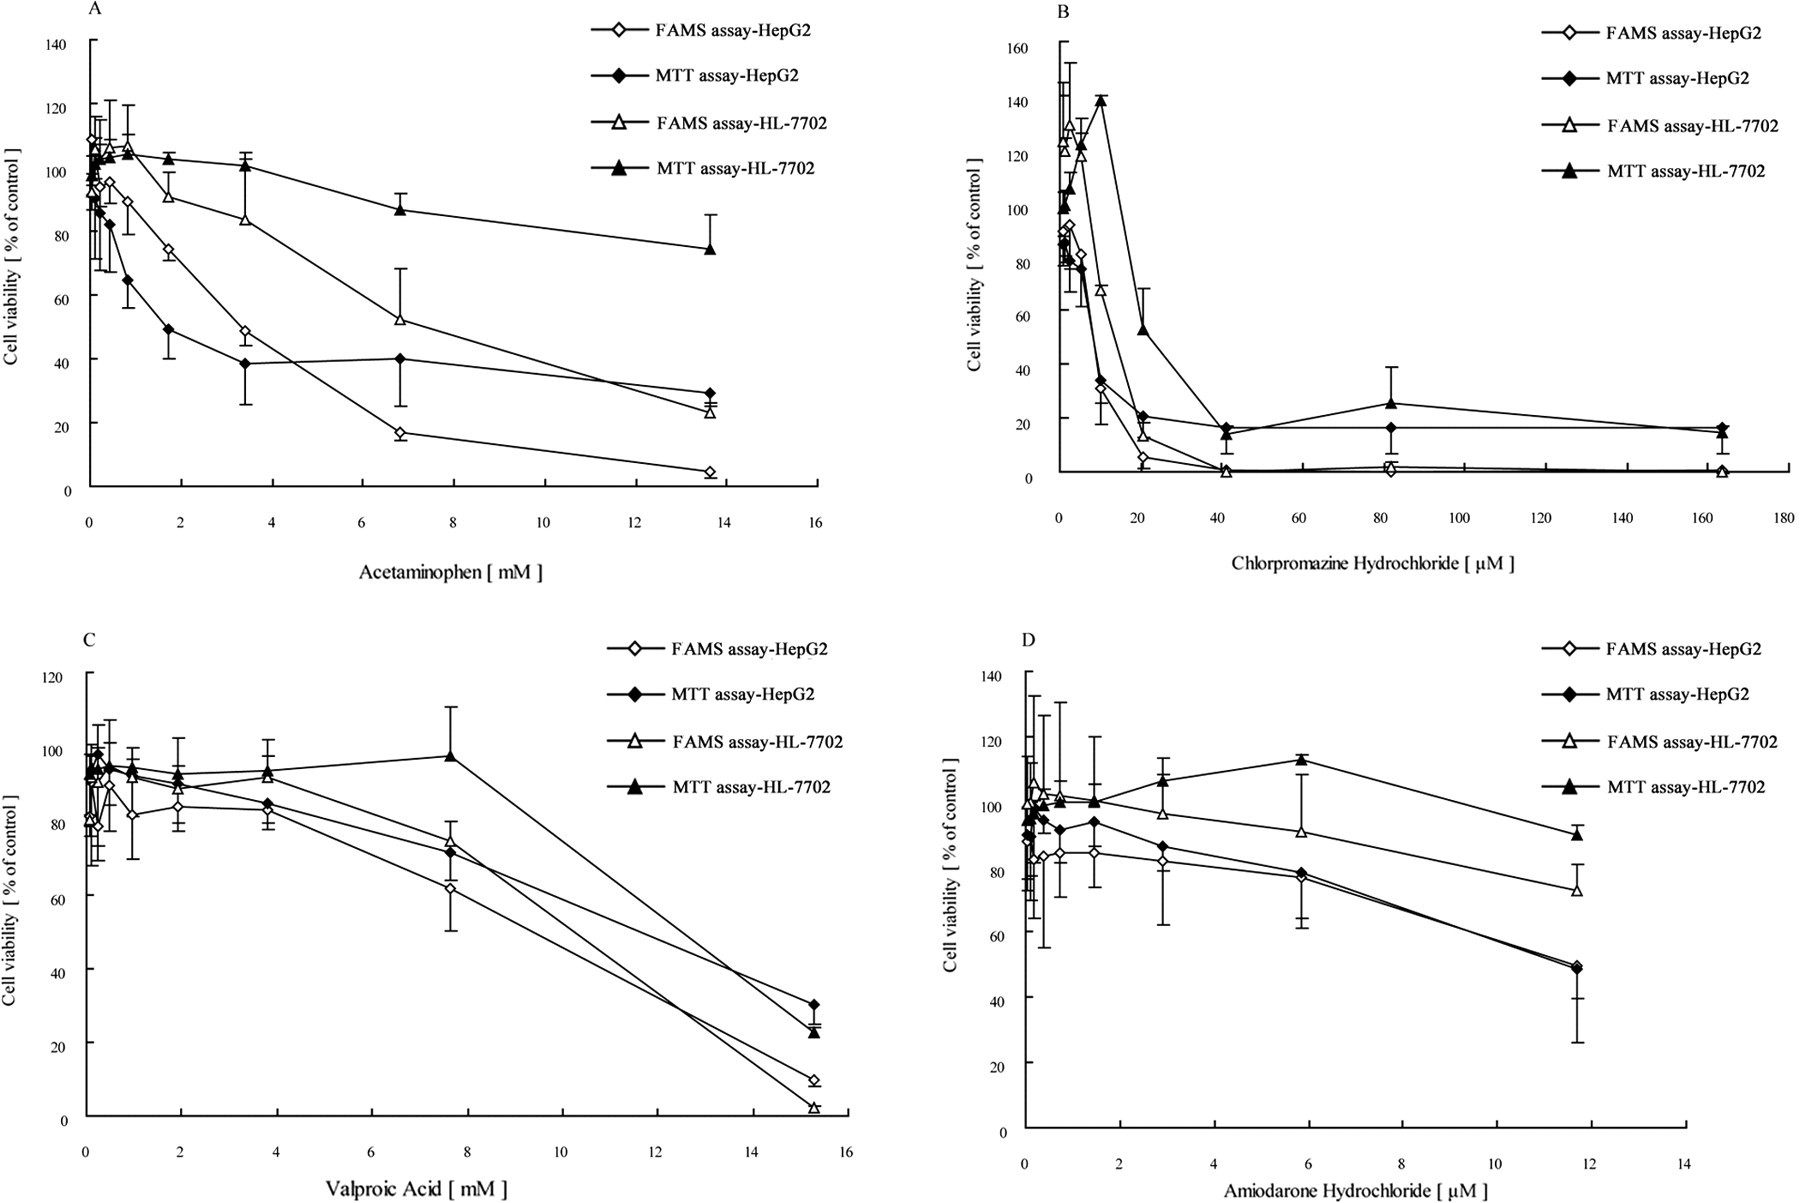
Dose-response effects of hepatotoxic compounds (acetaminophen, chlorpromazine hydrochloride, valproic acid, and amiodarone hydrochloride) on both HepG2 cells (⋄, ♦) and HL-7702 cells (Δ, ▴) (A-D). Those showed the quantification ability of fluorescein diacetate-based automatic microscopy screening (FAMS) assay, as different compound had different hepatotoxic behavior. Each compound had 9 serial 2-fold dilutions and cells were treated with compounds at the cell culture condition for 48 hours. Then, cell viability was determined using the FAMS assay (⋄, Δ) and 3-(4,5-dimethylthiazol-2-yl)-2,5-diphenyl tetrazolium bromide (MTT) assay (♦, ▴). Each concentration was normalized to the control group to determine the IC50. Data represented the average of triplicate wells and 3 independent experiments with the SD.
Moreover, dose-response relationship of nonhepatotoxic compounds, that is rosiglitazone, diphenhydramine, ketotifen, and propranolol, were measured on HepG2 by FAMS assay to validate the reliability of FAMS assay. The result is shown in Figure 6 . The survival rates of all these groups (8 series concentrations of each compound) were larger than 80%. The result showed that these compounds display very low toxicity or even no toxicity. Therefore, FAMS assay has high reliability.
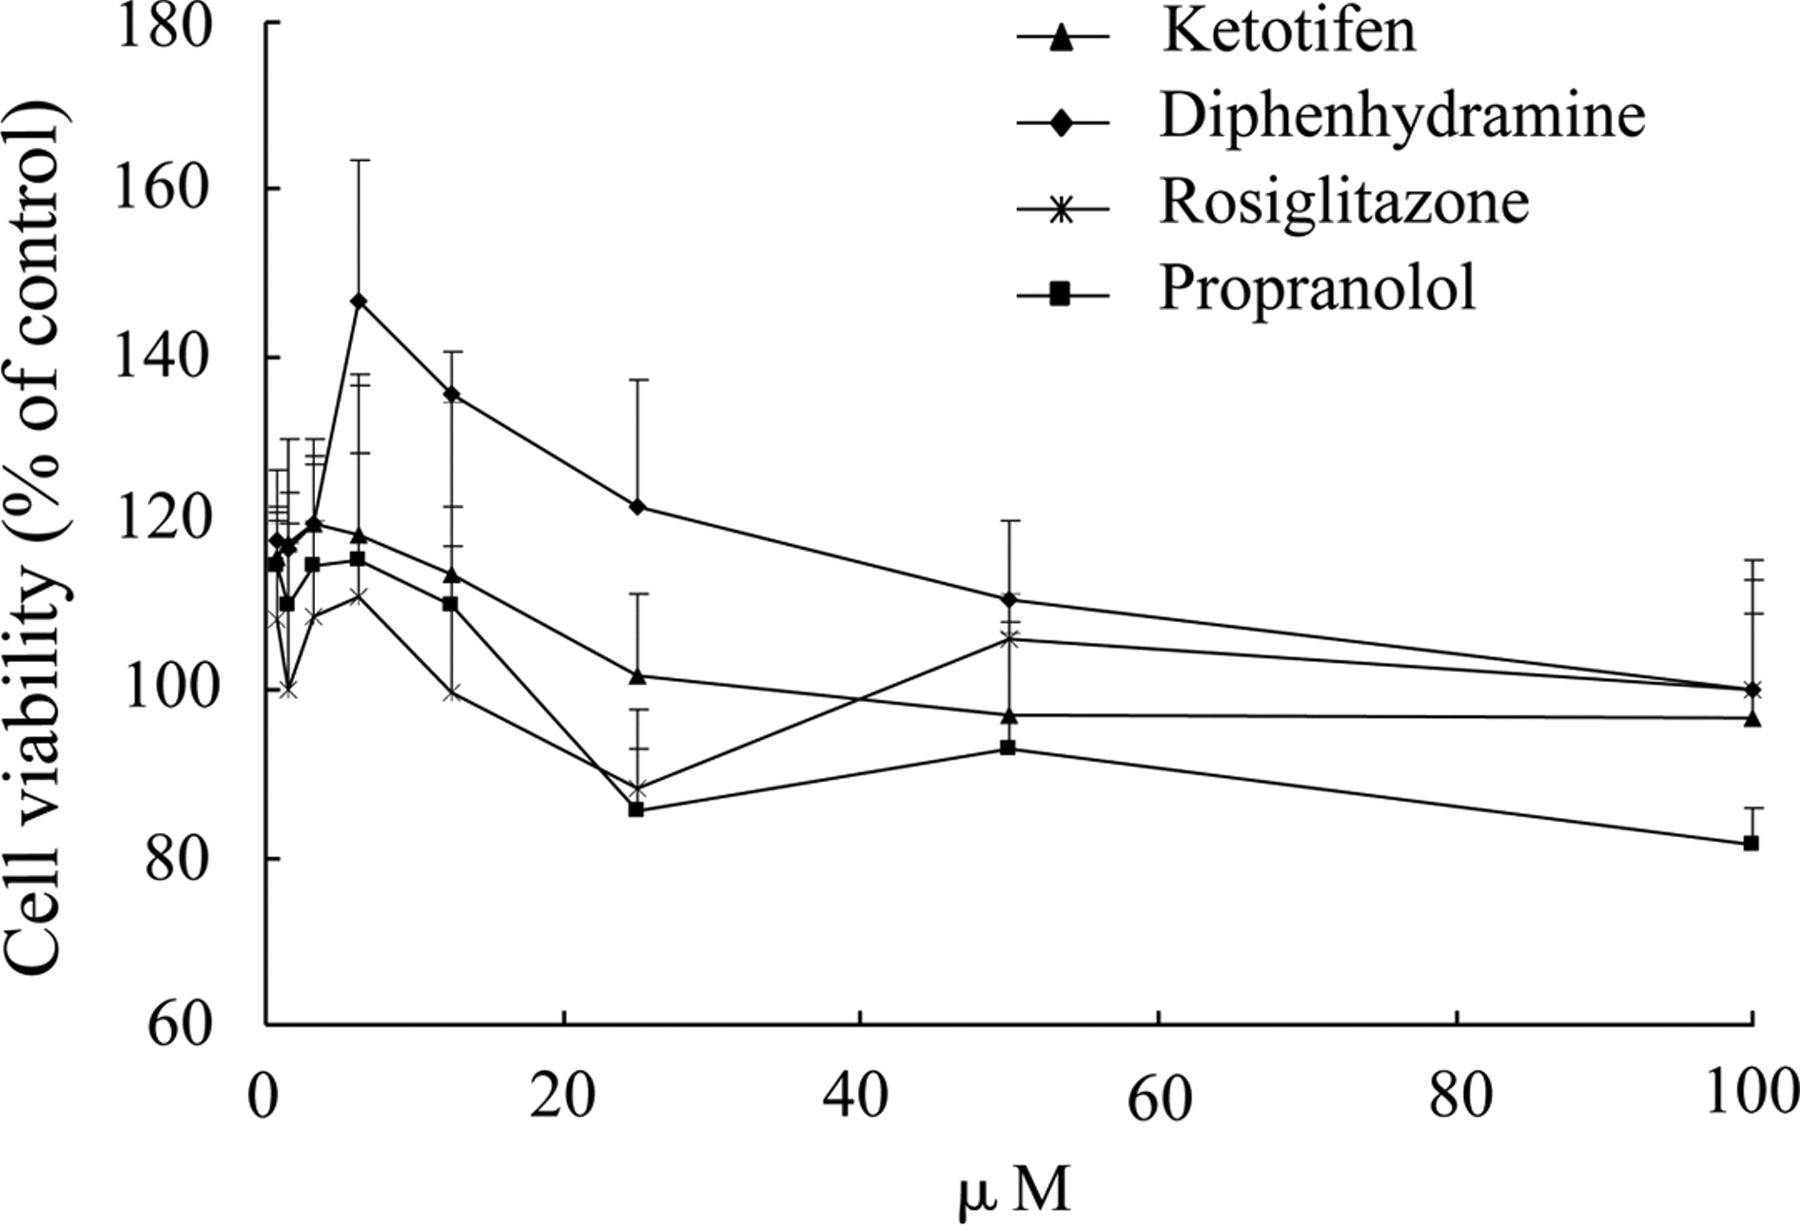
Dose-response effect of nonhepatotoxic compounds (rosiglitazone, diphenhydramine, ketotifen, and propranolol) on HepG2 cells. Each compound had 8 serial 2-fold dilutions and cells were treated with compounds at the cell culture condition for 48 hours. Then, cell viability was determined by FAMS assay; 0.1% DMSO (v/v) was set as vehicle control. Cell viability was normalized to the vehicle control.
Z′ Factor Determination for Both FAMS Assay and MTT Assay
Using the method reported by Zhang et al, 16 we calculated the Z′ factors of FAMS assay and MTT assay (Table 1 ). The Z′ factors for FAMS assay of HepG2 cells treated with acetaminophen and chlorpromazine hydrochloride were 0.534 and 0.561, respectively, while it was 0.822 and 0.882 for MTT assay, respectively; and for valproic acid and amiodarone hydrochloride, Z′ factors were 0.474 and 0.16 for FAMS assay and 0.788 and 0.485 for MTT assay. However, the Z′ factors for HL-7702 cells of both assays were relatively low. Consequently, the Z′ factor value suggested that HepG2 cell-based FAMS assay is a good assay for screening hepatotoxic compounds.
Z′ Factors of MTT Assay and FAMS Assay Using HepG2 cells and HL-7702 Cells Treated With Different Compounds a
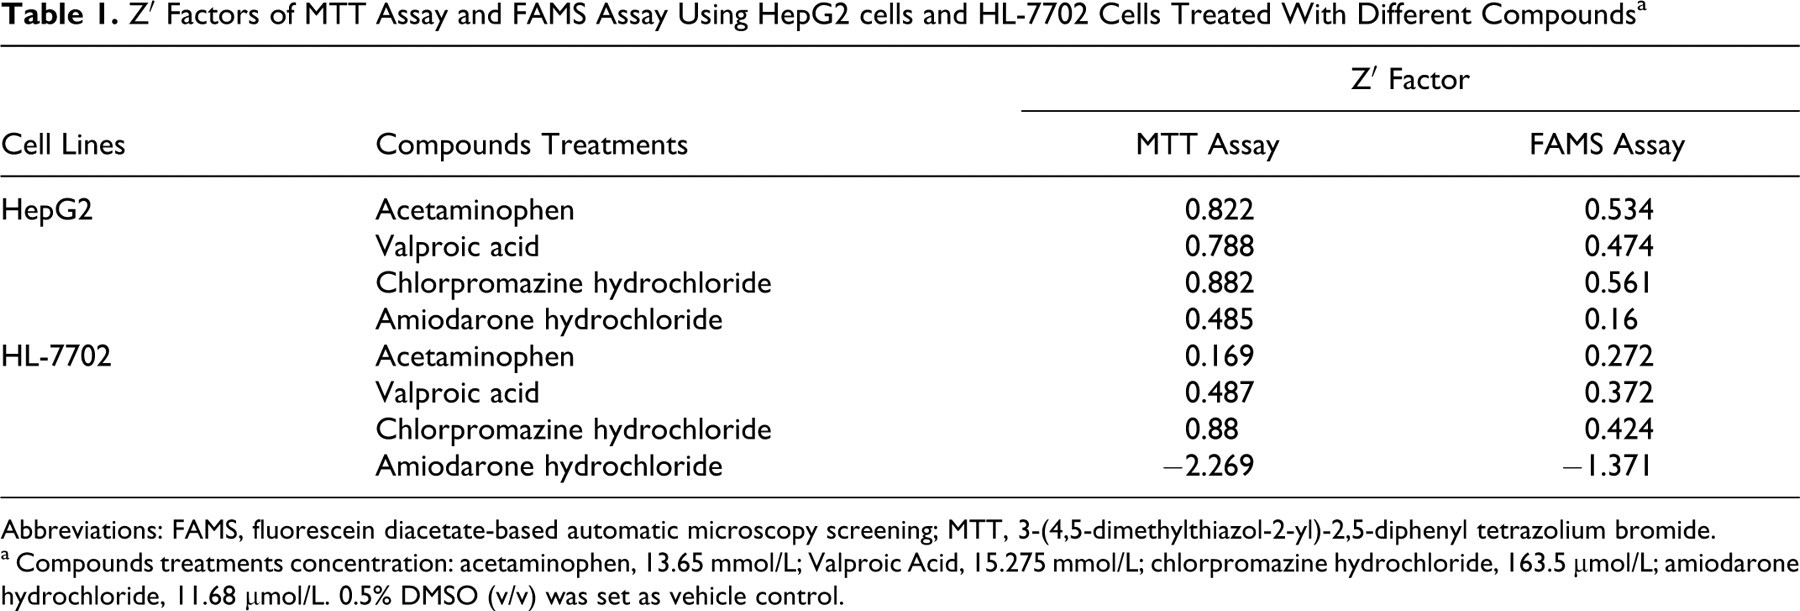
Abbreviations: FAMS, fluorescein diacetate-based automatic microscopy screening; MTT, 3-(4,5-dimethylthiazol-2-yl)-2,5-diphenyl tetrazolium bromide.
a Compounds treatments concentration: acetaminophen, 13.65 mmol/L; Valproic Acid, 15.275 mmol/L; chlorpromazine hydrochloride, 163.5 μmol/L; amiodarone hydrochloride, 11.68 μmol/L. 0.5% DMSO (v/v) was set as vehicle control.
Screening for Potential Hepatotoxic Fractions From Fructus aristolochiae
Finally, we used this FAMS assay to screen the potential hepatotoxic fractions from botanical products, and the extracted fractions from Fructus aristolochiae were chosen for testing on both HepG2 and HL-7702 cell lines. The screening results of FAMS assay were compared with those of the MTT assay. As shown in Figure 7 , fractions from Fructus aristolochiae that showed toxicity to HepG2 and HL-7702 cell lines through MTT assay could also be found with the FAMS assay. However, FAMS assay was more sensitive than the conventional MTT assay. Furthermore, some fractions might react with MTT, and the formed deep black substances covered the bottom of wells and made the OD value by MTT assay much bigger than it actually be, which is the possible reason for the overflow of OD value of fractions A04, A08, and B02 -B09 by MTT assay (Figure 7). Due to the same reason, HepG2 incubated with fraction B08 and HL-7702 with B10, B11, B12, and C02 from Fructus aristolochiae got viability of more than 150% (Figure 7). Consequently, the fractions A01, A02, A05, A06, A08, B07, B10, C06, C08, C09, C13, C14, and C15 from Fructus aristolochiae were identified to be potentially hepatotoxic. The data of FAMS assay for different fractions form Fructus aristolochiae are shown in Table 2 .
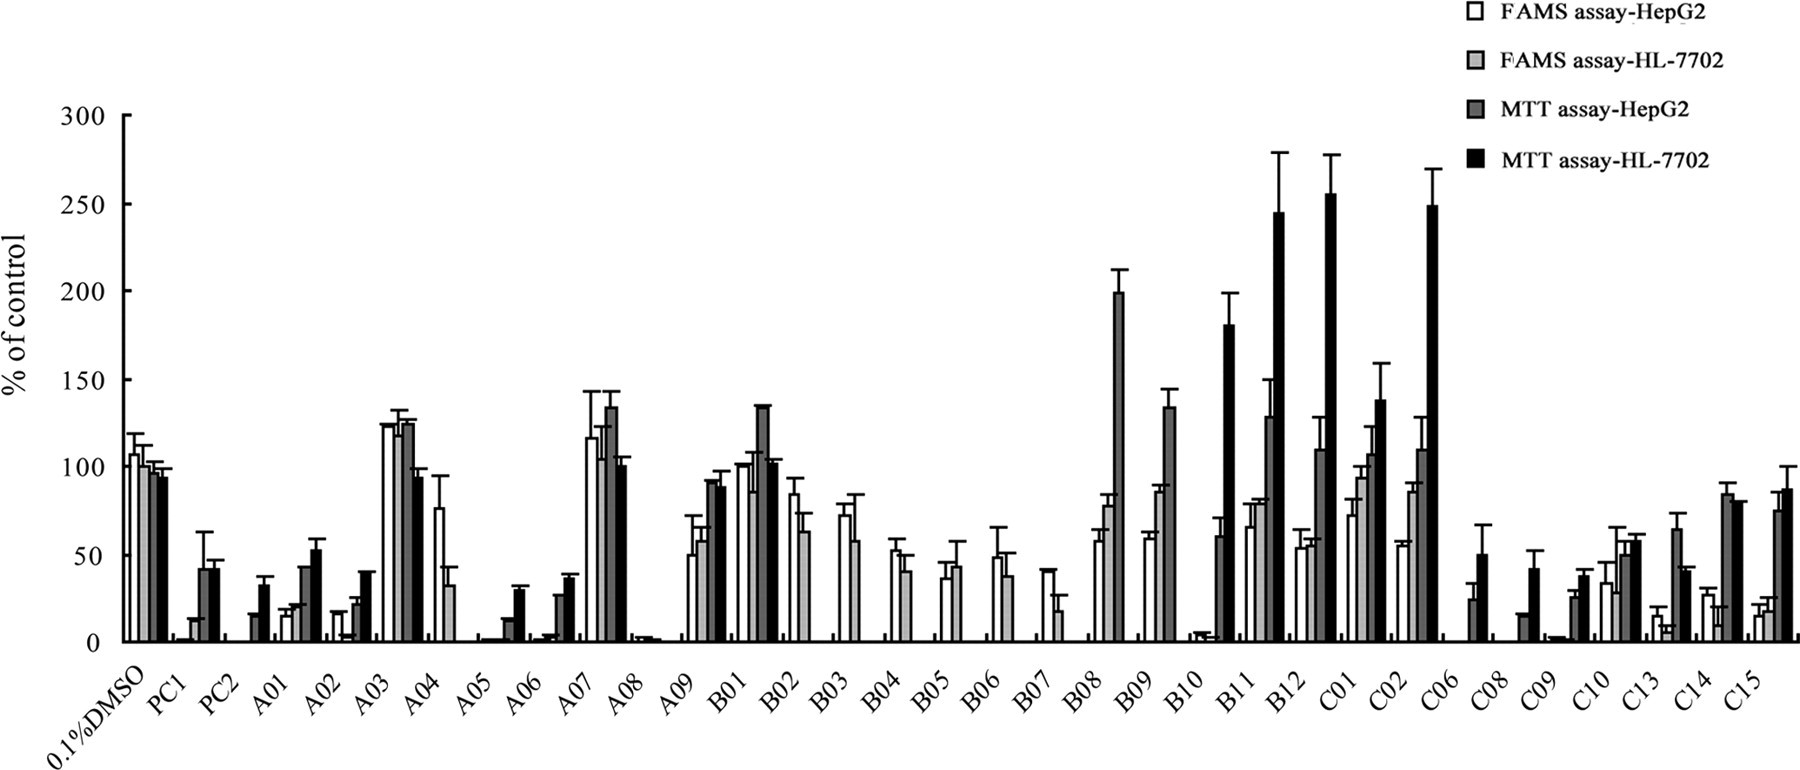
Potential hepatotoxic fractions screening from Fructus aristolochiae. Different fractions were coincubated with human hepatoma cell line HepG2 and normal human liver cell line HL-7702 at cell culture conditions for 48 hours. Then the viability of cells was tested by fluorescein diacetate-based automatic microscopy screening (FAMS) assay and 3-(4,5-dimethylthiazol-2-yl)-2,5-diphenyl tetrazolium bromide (MTT) assay. PC1 and PC2 represented 13.65 mmol/L acetaminophen and 163.5 μmol/L chlorpromazine hydrochloride, respectively, which were set as positive controls; 0.1% DMSO (v/v) was set as vehicle control. Cell viability was normalized to the control group.
FAMS Assay Using HepG2 Cells and HL-7702 Cells Treated With Different Fractions Form Fructus aristolochiae a
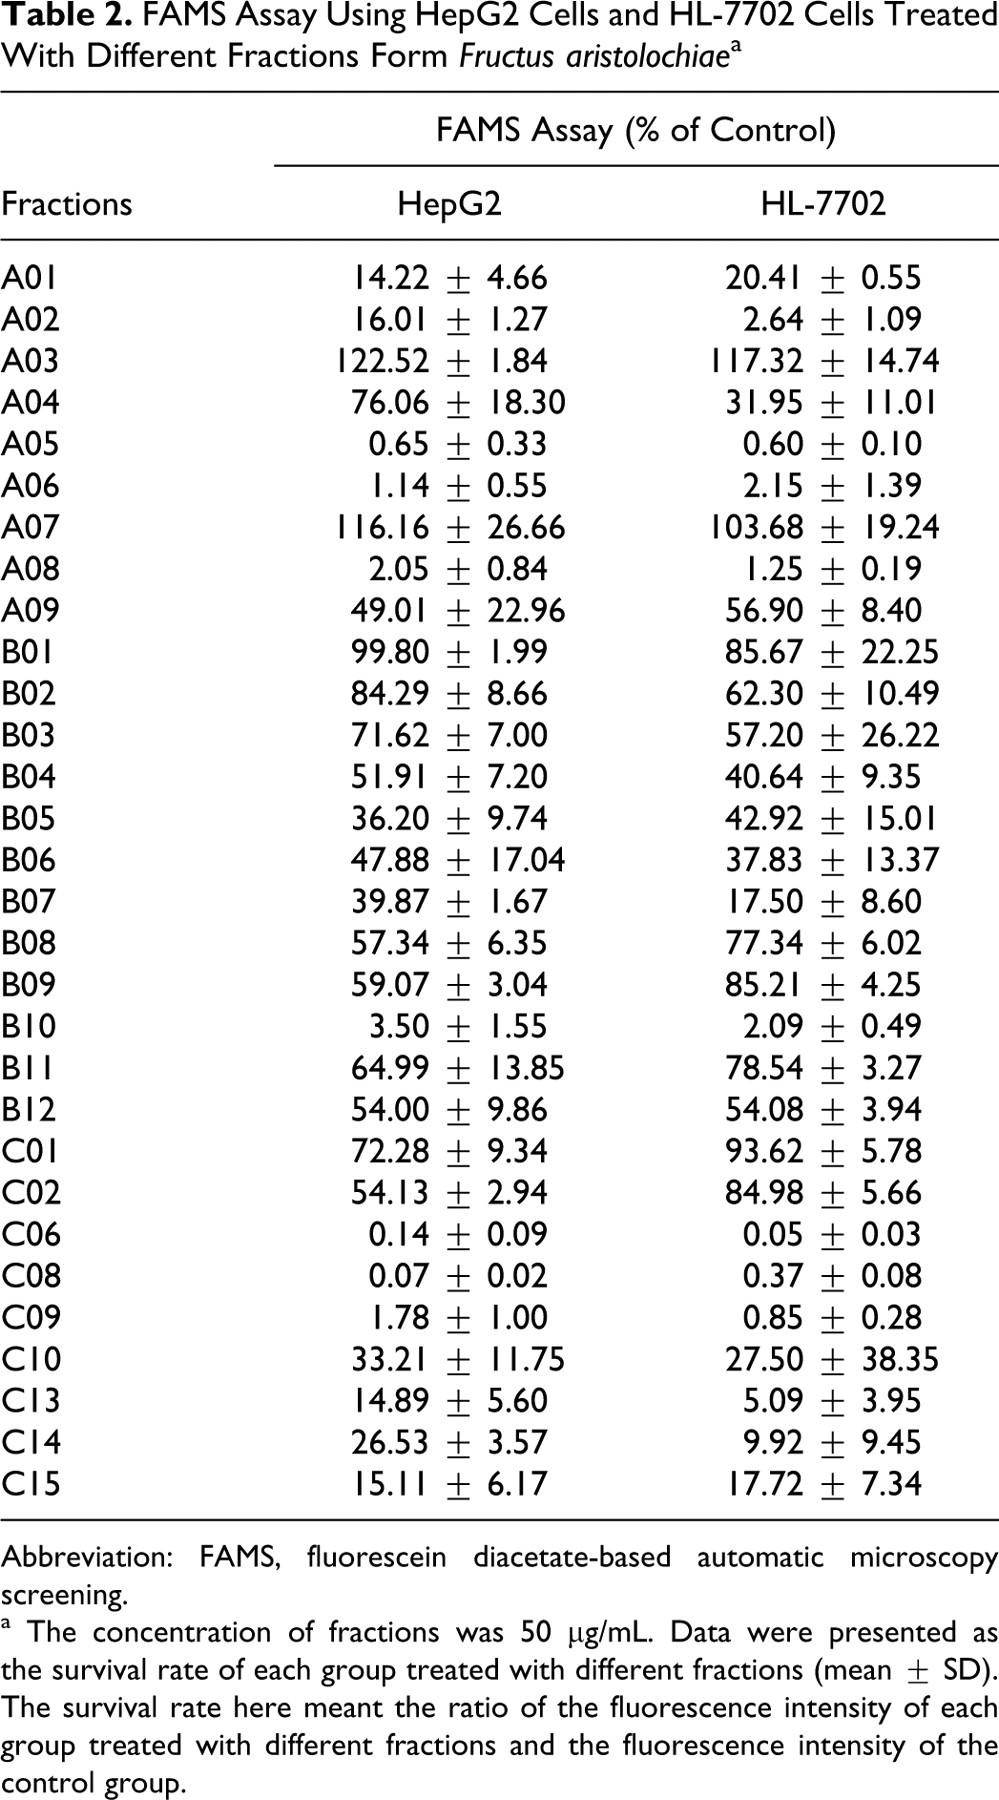
Abbreviation: FAMS, fluorescein diacetate-based automatic microscopy screening.
a The concentration of fractions was 50 μg/mL. Data were presented as the survival rate of each group treated with different fractions (mean ± SD). The survival rate here meant the ratio of the fluorescence intensity of each group treated with different fractions and the fluorescence intensity of the control group.
Cell Viability Assay After Exposure to Potential Hepatotoxic Fractions C06, C08, and C09 With FAMS Assay
FAMS assay was carried out to measure the dose-response relationship of the potential hepatotoxic fraction C06, C08, and C09 from Fructus aristolochiae, because the FAMS assay results of these 3 fractions (C06, C08, and C09) were very similar. The data of FAMS assay for these 3 fractions are shown in Table 3 . According to Table 2 and Table 3, fraction C06 represented the highest toxicity among all these fractions screened on HepG2.
FAMS Assay Using HepG2 Cells Treated With Different Concentration of C06, C08, and C09 From Fructus aristolochiae a
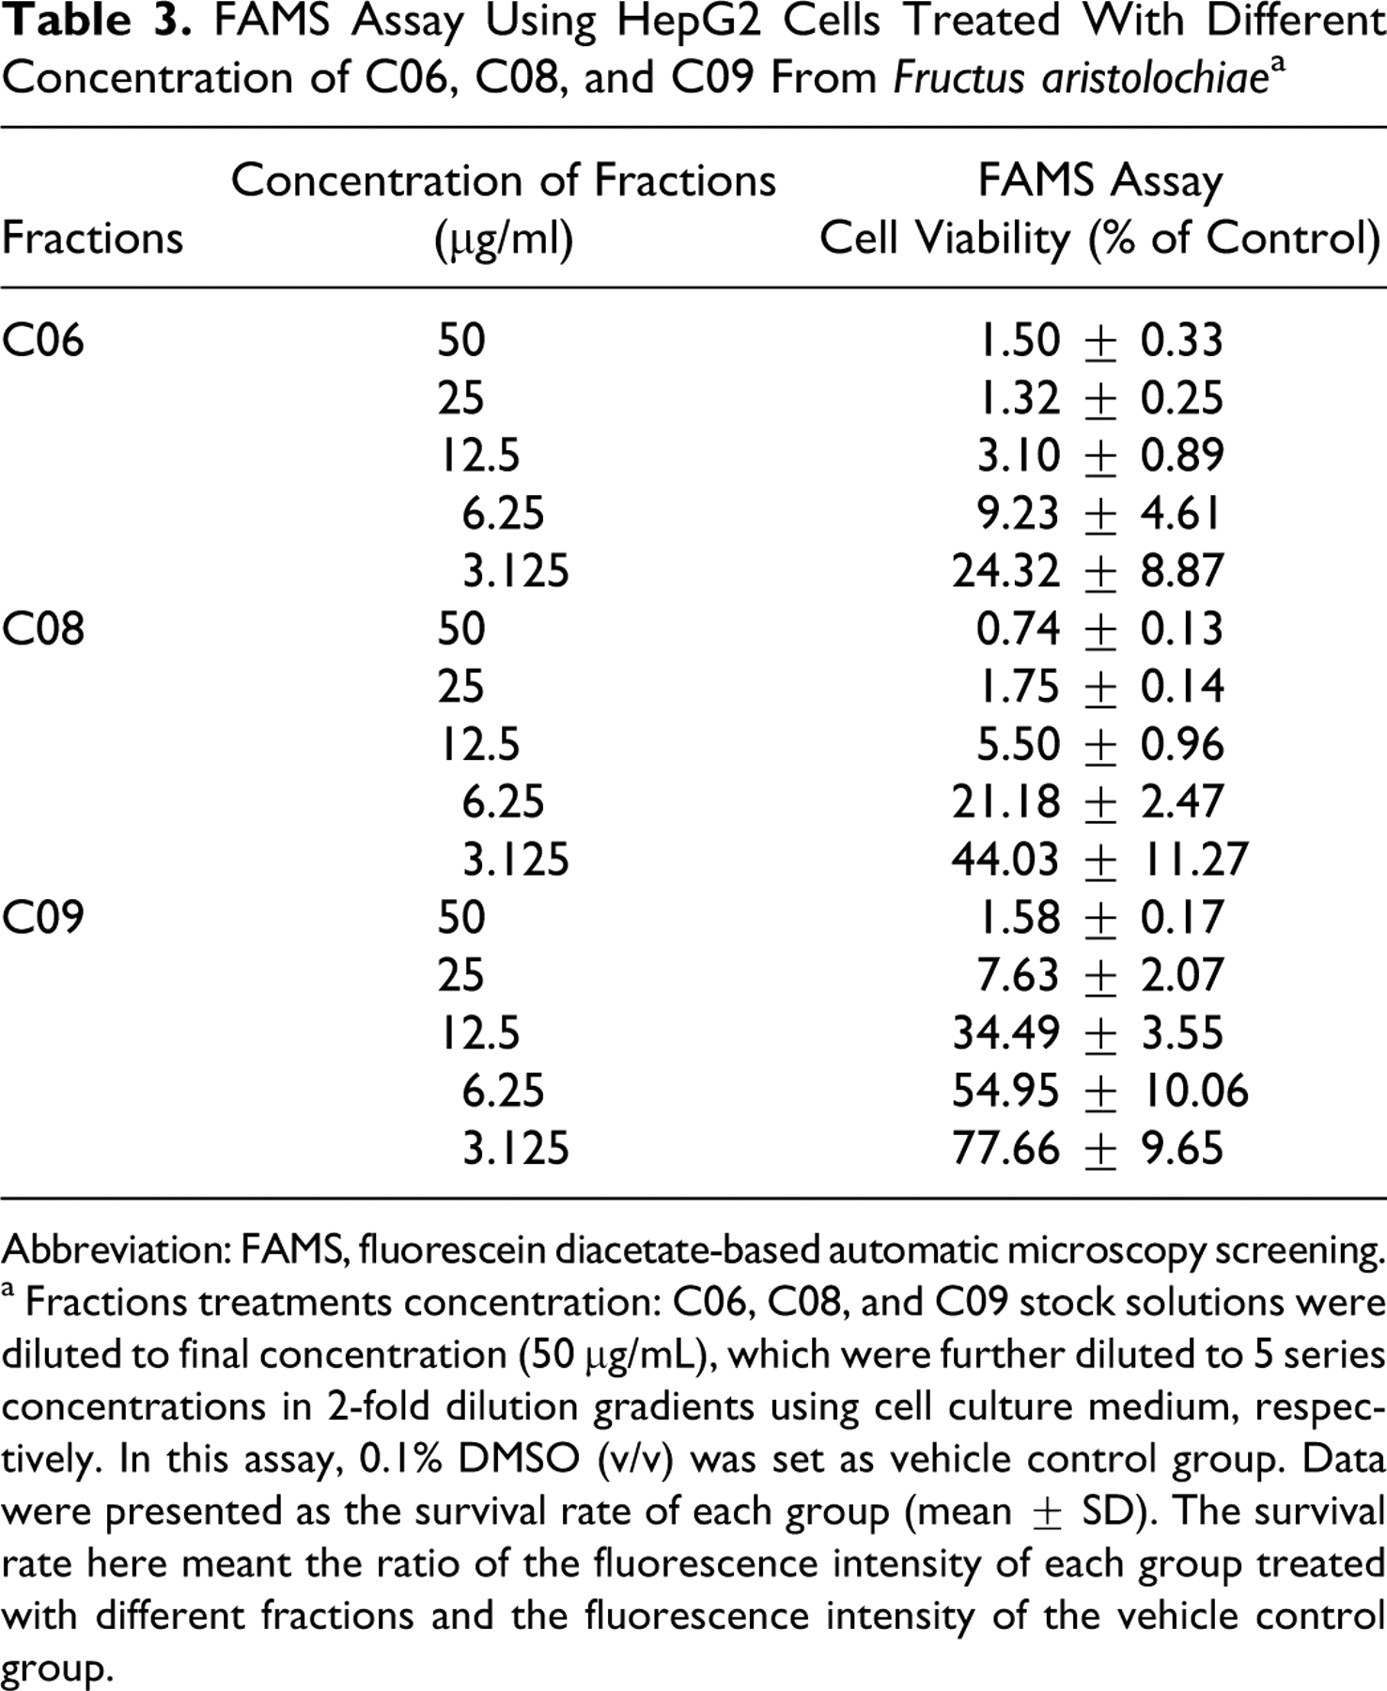
Abbreviation: FAMS, fluorescein diacetate-based automatic microscopy screening.
a Fractions treatments concentration: C06, C08, and C09 stock solutions were diluted to final concentration (50 μg/mL), which were further diluted to 5 series concentrations in 2-fold dilution gradients using cell culture medium, respectively. In this assay, 0.1% DMSO (v/v) was set as vehicle control group. Data were presented as the survival rate of each group (mean ± SD). The survival rate here meant the ratio of the fluorescence intensity of each group treated with different fractions and the fluorescence intensity of the vehicle control group.
Identification of the Potential Hepatotoxic Compounds From Fructus aristolochiae
Among 9 secondary fractions (ie, C01, C02, C06, C08, C09, C10, C13, C14, and C15) from A05, 6 fractions (ie, C06, C08, C09, C13, C14, and C15) were considered to be potential hepatotoxic, while fraction C06 was regarded as the most toxic one (data are shown in Tables 2 and 3). Then, the fraction C06 was selected for further identification by LC-MS. The representative total ion chromatograms (TIC) of the Fructus aristolochiae and the fraction C06 are shown in Figure 8 . Compound 3 in Figure 8B displayed a maximum absorption peak at about 260 nm, which is in accordance with previous reported UV characteristic of aristolochic acid derivatives. 22 Through high-resolution mass spectrometric data (HRMS), the accurate molecular weight of compound 3 was 356.03952 kDa. The proposed formula of compound 3 was tentatively deduced as C17H10NO8 through the tool provided by work station Xcalibur, according to the accurate molecular weight and the fact that all reported compounds in Fructus aristolochiae contain only 4 elements (C, H, O, and N). This deduced atomic composition was in accordance with the theoretical atomic composition. Thus, compound 3 was plausibly identified as aristolochic acid IVa / aristolochic acid Va / aristolochic acid VIa / aristolochic acid VIIa / aristolochic acid VIIIa, which are isomers. Through the same approach, compound 4 in Figure 8D was tentatively characterized as aristolodione, according to the HPLC/MS data.
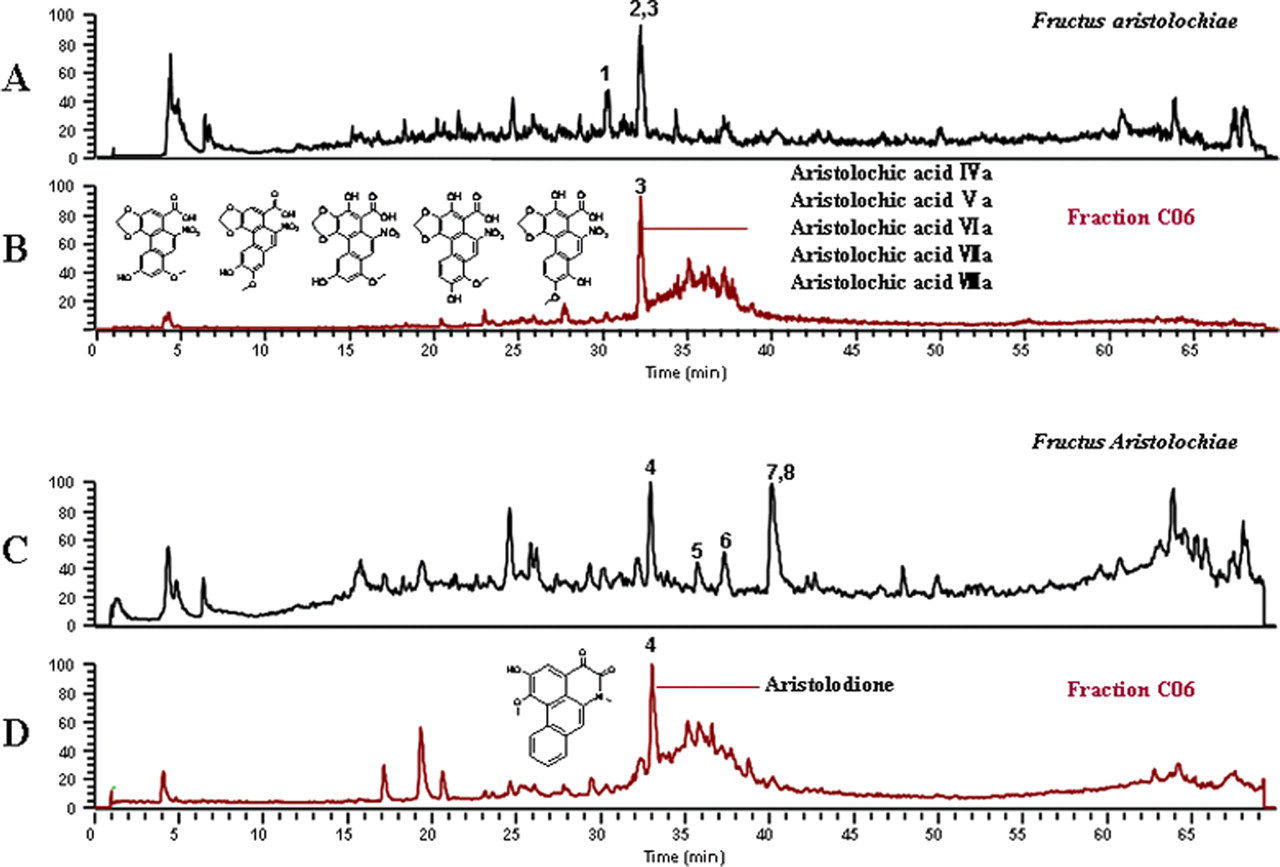
Total ion chromatogram of the Fructus aristolochiae and the fraction C06. (A) The total ion chromatogram of the Fructus aristolochiae in negative ion mode; (B) The total ion chromatogram of the fraction C06 in negative ion mode; (C) The total ion chromatogram of the Fructus aristolochiae in positive ion mode; (D) The total ion chromatogram of the fraction C06 in positive ion mode.
Discussion
An FAMS assay- and LC-MS-based approach was proposed to screen and identify potential hepatotoxic fractions from botanical products in this study. As a cell-based screening assay, HepG2 cell line and HL-7702 cell line were used together to screen potential hepatotoxic compounds or fractions from botanical products. Fluorescein diacetate was chosen to label viable cells, as it is a nonpolar ester, can pass through viable cell membranes, followed by hydrolyzing by intracellular esterases to produce a polar fluorescein that accumulates itself inside the cell. Thus, with fluorescein diacetate, viable cells have bright fluorescence (green), whereas nonviable cells are nonfluorescent. 23,24 Compared with FAMS assay, the conventional MTT assay had a narrower linear dynamic range due to its low sensitivity. Although it has been demonstrated that fluorescein diacetate staining is nontoxic, 25 we chose a relatively low concentration of fluorescein diacetate (2.5 μg/mL), as high concentration would bring about enhancement of the background fluorescence (Figure 2). Using the selected concentration, it was strong enough to satisfy the screening dynamic.
The FAMS system can provide 3 parameters, including recognized cell number, cell area, and fluorescence intensity. Usually, the fluorescence intensity, which was represented as total grey scale values per well, was used as the quantitative parameter. There was a good consistency among the parameters (Figure 3), but a combination of all the 3 parameters are expected to provide stronger confidence than any 1 of them. The linear dynamic range of FAMS assay was 3 times of that of MTT assay (Figure 4), and the Z′ factor of FAMS assay also support the advantages (Table 1). The whole results in our study suggested that FAMS assay could be applied to drug combination studies to detect synergistic or antagonistic interactions. Although MTT assay, as a conventional cytotoxicity assay, was stable, it could produce false positive results due to direct chemical interaction with some drugs or chemicals, which would then mask the real results. Besides, the principle of MTT assay is through the conversion of MTT to colored DMSO-soluble formazan products by mitochondrial reductases. These could be the reasons for the inconsistent results between the FAMS assay and the MTT assay for the fractions A04, A08, B02, B03, B04, B05, B06, B07, B08, B09, B10, B11, B12, C01, and C02 from Fructus aristolochiae (Figure 6).
Fructus aristolochiae is a widely-used herbal medicine in China for relieving cough and asthma. However, it was recently shown to be nephrotoxic, genotoxic, and carcinogenic in humans. 26 The major toxicant was identified to be aristolochic acid. 27 The possible hepatotoxicity of this species of plant has also been reported, 28 but the mechanisms remain unknown. In this study, HepG2 and HL-7702 cell lines were chosen for screening the potential hepatotoxic compounds from Fructus aristolochiae. In the potential hepatotoxic fraction C06, which was found to be most toxic among all fractions from Fructus aristolochiae, one of the main compounds was plausibly identified as a group of isomers, including aristolochic acid IVa, aristolochic acid Va, aristolochic acid VIa, aristolochic acid VIIa, and aristolochic acid VIIIa. Among these isomers, the content of aristolochic acid IVa is the highest according to the report. 22 Thus, we deduced that the potential hepatotoxic compound in fraction C06 was aristolochic acid IVa. Another main compound was tentatively characterized as aristolodione based on the LC-MS data. The Fructus aristolochiae application case is a vivid demonstration of the potential of the usage of our proposed TSI approach.
The validation results obtained on those previously reported hepatotoxic compounds further confirmed the utility of FAMS assay. For instance, the IC50 values obtained by FAMS assay of HepG2 cells are close to the clinical toxic dose. 29 –31 Meanwhile, the validation results also suggested that different cell lines might have different dynamic range and sensitivity. As shown in Figure 5, for FAMS assay, the cell viability measured on HepG2 was lower than the corresponding value measured on HL-7702. The cell viability obtained by MTT assay further confirmed this observation, which means HepG2 cell line can detect lower toxicity than HL-7702 cell line. That is, HepG2 cell line is more sensitive than the HL-7702 cell line regarding screening potential hepatotoxic compounds from botanical products.
In our study, HepG2 and HL-7702 cell lines, which were derived from the liver, have some unique characteristics, such as higher expression of P450s than other cell types. These characteristics make them perform better than other cells in extrapolating the cytotoxicity to hepatotoxicity. However, our current method, as any cell-based models, could not truly differentiate hepatotoxiciants from cytotoxicants. Therefore, further in vivo assays should be carried out to validate whether the screened compounds are hepatoxic rather than just cytotoxic.
In summary, the successful application to the well-established hepatotoxicants and the investigational herbal drug Fructus aristolochiae clearly suggested that our FAMS assay-based TSI approach is an effective tool to screen and identify potential hepatotoxicants from botanical products. Further investigations on FAMS assay using multiple fluorescence staining are still undergoing, which may provide more useful information and contribute to the establishment of more powerful screening methods. Moreover, the proposed TSI approach is generally applicable for rapidly screening and identifying other kinds of toxic compounds from botanical products as long as appropriate fluorescence and cell line are employed.
Footnotes
Acknowledgment
We would like to thank Dr Qiang Shi (FDA/NCTR) and Dr Xiaoyan Lu (Zhejiang University) for their helpful discussions.
The author(s) declared no conflicts of interest with respect to the authorship and/or publication of this article.
The author(s) disclosed receipt of the following financial support for the research and/or authorship of this article: Supported by Zhejiang Province Science and Technology Plan Project (No.2008C23065), grant from National S&T Major Project (No.2009ZX09502-012) and Research Fund for the Doctoral Program of Higher Education of China (No. 20090101110126).