
Abstract
Perfluorooctane sulfonate (PFOS) is an environmental persistent acid found at low levels in human, wildlife, and environmental media samples. To study the apoptosis effects of PFOS on microglia, murine N9 cell line was used as a model in current research. The results showed that PFOS could reduce the cell viability significantly, and the cellular apoptosis induced by PFOS was closely accompanied with dissipation of mitochondria membrane potential, upregulation messenger RNAs (mRNAs) of p53, Bax, caspase 9, and caspase 3, and decreased expression of Bcl-2 mRNA. These results suggested that PFOS could disturb homeostasis of N9 cells, impact mitochondria, and affect gene expression of apoptotic regulators, all of which resulted in a start-up of apoptosis.
Introduction
Perfluorooctane sulfonate (PFOS) and perfluorooctanoic acid (PFOA) belong to the family of perfluorinated compounds (PFCs), and both are globally present in the environment, wildlife, and humans. 1 The 8-carbon chain compounds, PFOS and PFOA, have chemical properties that make them excellent surfactants used in industrial and consumer applications, including uses for clothing fabrics, carpets, paper coatings, food packaging, hydraulic fluids, and fire extinguishers. 2,3 Although PFOS is lipophilic but fairly inert, research has found that PFOS is well-absorbed after ingestion. 4 Since then, PFOS and PFOA have been detected in several human tissues, including blood, plasma, liver, breast milk, and umbilical cord blood.
The occurrences of PFOS and PFOA in human tissues led to the rising concerns about the possible adverse effects on human health. Perfluorooctane sulfonate has been found to accumulate in various tissues and lead to developmental toxicity in male Sprague-Dawley rats. Notably, in utero exposure to PFOS has been reported to cause maternal toxicity and neonatal mortality, alter metabolic status of neonates by influencing perinatal Peroxisome proliferator-activated receptor alpha (PPARα) regulatory pathway, and affect late-stage fetal development in rats and mice, in a dose-dependent manner. 5 –8 Recent reports indicate that neonatal exposure to PFOS during a period of brain development can cause neurotoxic effects by regulating the levels of several proteins in neonatal mouse and affecting the cholinergic system in adult mice. 9 –11 In addition, it was reported that PFOS uptake in brain may occur prior to formation of the blood-brain barrier in rats based on comparison of serum and perfused brain tissue PFOS concentrations. 12 –16
Some in vitro studies have shown that PFOS and PFOA induced apoptosis, genetoxic risk, and oxidative DNA damage by impacting mitochondria and affected gene expression of apoptotic regulators in HepG2 cells. 17 –19 In addition, some approaches to identify direct developmental neurotoxicity of PFOS are to use in vitro models, for example, PFOS was confirmed to induce PC-12 cells to differentiate into the acetylcholine phenotype at the expense of the dopamine phenotype and impair the function of cerebellar Purkinje cells. 20-21
Microglial cells are resident immune cells of the central nervous system (CNS) and play a key role in the development and regeneration of the CNS although the mechanisms regulating their presence and activity are not fully understood. These cells constantly surveyed the parenchyma of CNS under both healthy and pathological conditions. 22,23 A recent study reports that methylmercury could cause oxidative stress and cytotoxicity in N9 microglial cell line. 24 Zhang et al suggests that nerve growth factor (NGF) and brain-derived neurotrophic factor (BDNF) may regulate microglial dynamics on 2 murine microglial lines (BV-2 and N9 lines), thereby influencing the surrounding milieu during neuronal regeneration. 25 However, BV-2 cells did not give reliable results in chemotaxis assays, not only with chemokines but also with other well-known attractors of microglial cells such as ATP. 26 Given the increasing levels of PFOS in the environment, and the necessity to further investigate PFOS-induced neurotoxicity on nonneuronal cells, fetal murine microglial N9 cells were selected as a model system to elucidate the cytotoxic effects and molecular mechanisms after exposure to PFOS in the present study.
Materials and Methods
Materials
Thiazolyl blue tetrazolium bromide (MTT), Rhodamine 123 (Rho 123), Hoechst 33258, and propidium iodide (PI) were provided by Sigma-Aldrich (St. Louis, USA). RPMI 1640 culture medium with glutamine and phenol red, Dulbecco phosphate buffered saline (DPBS), 0.05% trypsin-ethylenediaminetetra-acetic acid (EDTA) solution, penicillin-streptomycin, and fetal bovine serum (FBS) were purchased from Invitrogen Life Science (California, USA). Other chemicals were all from Sigma-Aldrich if not indicated otherwise.
Perfluorooctane sulfonate (>99.0% purity) was supplied by Sigma-Aldrich. A total of 215.2 mg PFOS was dissolved in 10 mL dimethyl sulfoxide (DMSO) as a stock solution of 40.0 mmol/L. The final culture concentration of DMSO in all experiments was 0.5 % (v/v) or less. The final concentrations of PFOS in experimental groups were 5, 10, 50, 100, and 200 μmol/L, respectively. In the control group, PFOS was replaced by DMSO with 0.5% final concentration.
Cell Culture and Viability Assay
The murine N9 microglial cell line was kindly provided by Prof Schluesener from the Institute of Brain Research, University of Tuebingen, Germany. N9 cells were cultured in RPMI 1640 with 10% heat-inactivated fetal calf serum (FCS) with 100 U/mL penicillin and 100 μg/mL streptomycin (Gibco, Grand Island, New York) at 37°C and 5% CO2.
To study the effects of PFOS on N9 cells, N9 cells were seeded in 96-well culturing plates at a density of 5 × 10³ cells/well in 200 μL of culture medium. The cells were treated with PFOS in an indicated range of concentrations for 24 or 48 hours. Viability of cells was evaluated by the MTT method. The extent of MTT reduction was measured spectrophotometrically at 570 nm. Cell viability was expressed as a percentage (%) of the optical density (OD) out of that control cells.
Apoptosis Assay
Hoechst 33258 staining
In this study, several assays were used to determine PFOS-induced cellular apoptosis. Apoptotic morphological changes in the nuclear chromatin of cells were detected by staining with the DNA-binding fluorochrome Hoechst 33258. In brief, N9 cells were seeded in 4-well chambers at a density of 1 × 10⁴ cells/well in 500 μL of culture medium. Treated cells were washed with DPBS and then fixed with 4% paraformaldehyde for 10 minutes at room temperature after 24 hours exposure. Following fixation, cells were rinsed 3 × 5 minutes with DPBS/0.1% Triton X-100 and then stained with Hoechst 33258 staining solution for 5 minutes, in which final concentration of Hoechst 33258 was 2.5 µg/µL. Upper structures of chambers were removed followed by using a coverslip onto the chamber, then the fluorescent images of cells were acquired by an inverted fluorescence microscope (Olympus BX60, Japan) at 200×. The cells with condensed chromatin and shrunken nuclei were counted as apoptotic cells.
Propidium iodine staining and flow cytometry
To confirm the result of morphologic analysis, apoptosis was also detected by flow cytometry. A total of 2 × 10⁵ N9 cells in 2 mL of RPMI 1640 with 10% FCS were seeded into a 6-well plate and cultured for 24 hours. After that, the medium was removed and cells were washed twice with DPBS and exposed to PFOS in an indicated range of concentrations. After exposure, the cells were collected and fixed with ice-cold 70% ethanol at 4°C for 30 minutes and washed once with DPBS. Cells were then treated with 500 μL PI solution containing 50 μg/mL PI, 0.1 mg/mL RNase A and 0.05% triton X-100 for 30 minutes at 37°C in the dark. After washing twice with DPBS, the cells were suspended with 300 μL DPBS, and flow cytometry was performed with a FACSCan flow cytometry (BD PharMingen, San Diego, California) by counting of 10 000 events. The apoptotic rate was determined on the basis of the “sub-G1” peak in the histogram of FL3-A.
Measurement of Mitochondrial Membrane Potential
Changes in mitochondrial membrane potential (MMP) were monitored using Rh-123. N9 cells were seeded in 4-well chambers at a density of 104/well in 500 μL of culture medium. After the treatment of PFOS in the indicated range of concentrations, the cultures in 4-well chambers were washed slightly twice with DPBS, and the cells were incubated with 10 μmol/L Rh-123 solutions for 30 minutes at room temperature. The Rh-123 solutions were discarded before cellular morphology was observed under inverted fluorescence microscopy. Cells were excited at 535 nm, and emission was monitored at 590 nm.
Real-time quantitative PCR (QPCR) Analysis
After exposure to PFOS for either 24 or 48 hours, N9 cells in 6-well plates were collected. QPCR was performed to determine differential expressions of p53, Bax, Bcl-2, caspase-3, and caspase-9 genes. Total RNA from the cells was extracted and reverse transcription was performed using SV Total RNA Isolation Kit (code no. #Z3100; Promega Corporation, Madison, Wisconsin) and RevertAid First Strand complementary DNA (cDNA) Synthesis Kit (code no. #K1622, Fermentas), respectively. Real-time quantitative PCR (RT-PCR) was performed on the 7900HT qPCR system using SYBR Green PCR Master Mix (code no. 4309155, Applied Biosystems, Foster city, CA, USA). The sequences of the primers used were designed with Primer 5.0 software and are shown in Table 1 .
Sequences of the Primers
Statistical Analysis
Unless otherwise stated, results of each treatment were pooled from 3 replicate samples derived from 3 independent experiments and expressed as means ± SD. Statistical analysis was performed by analysis of variance (one-way ANOVA) followed by Fisher test to determine the significance of difference.
Results
Effect of PFOS on N9 Cells Viability
The effect of PFOS on the N9 cells viability was measured by the MTT assay, which reflects the decreased cellular activity. The cell growth inhibition after PFOS exposure for 24 and 48 hours are presented in Figure 1 .
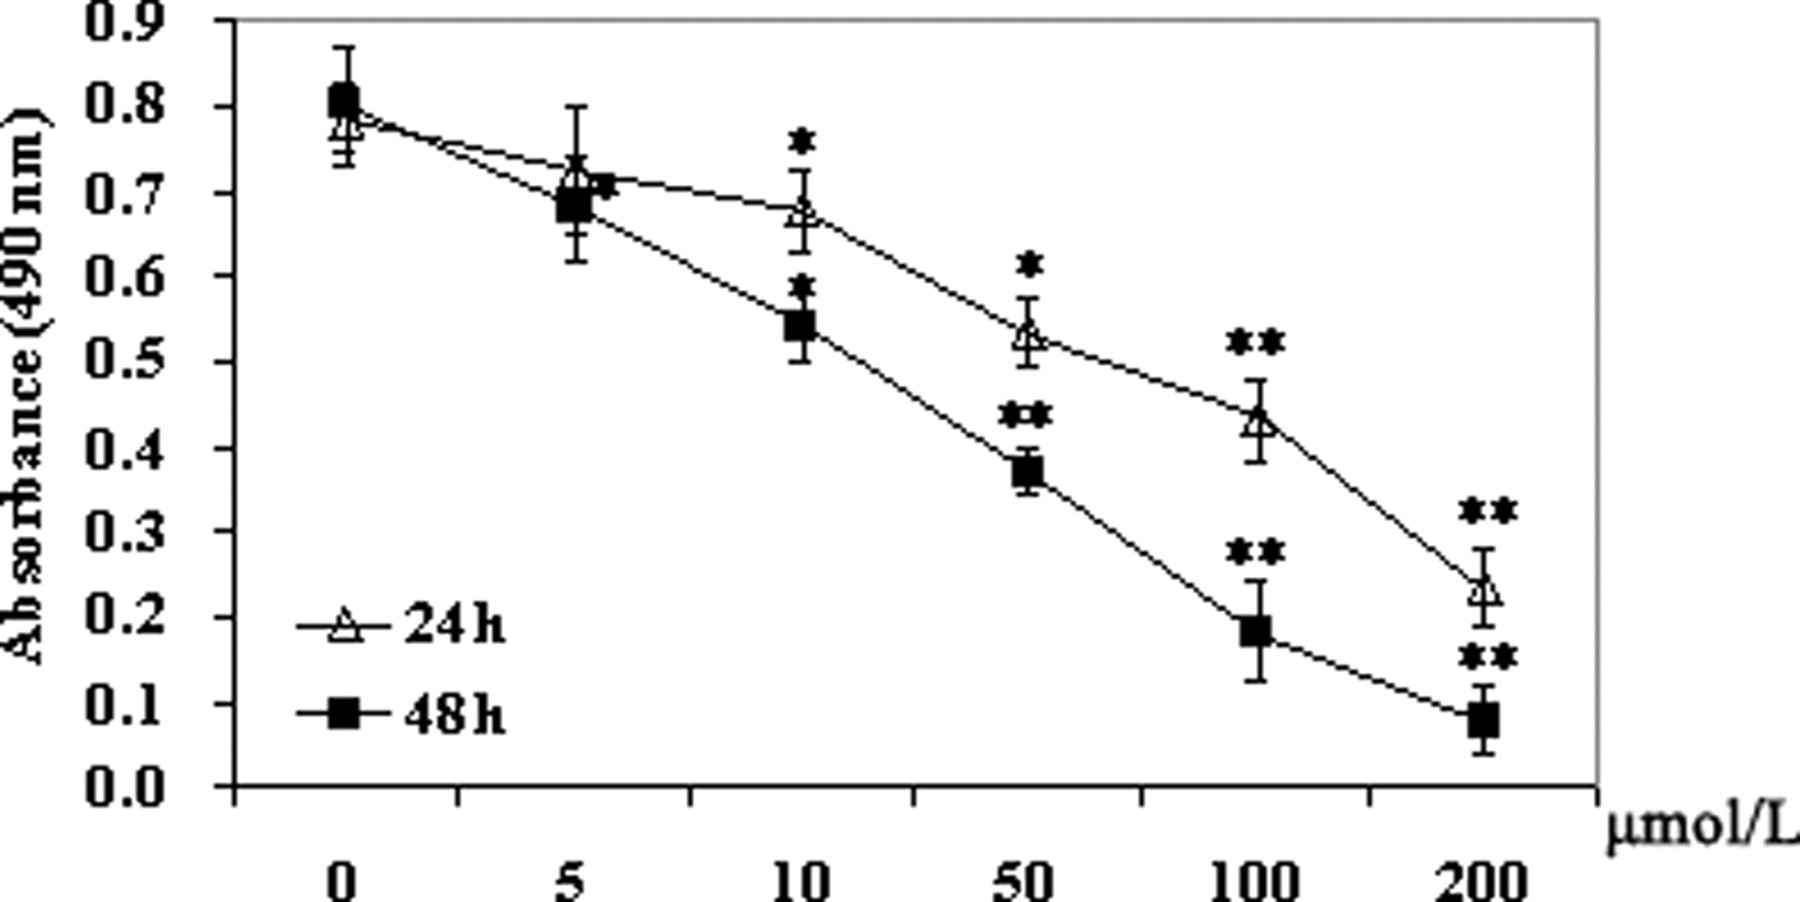
Concentration-dependent effect of perfluorooctane sulfonate (PFOS) on viability of N9 cells. Viable N9 cells were determined using the thiazolyl blue tetrazolium bromide (MTT) method as described in Materials and Methods. The cells were incubated with PFOS (5-200 μmol/L) for 24 or 48 hours. Control cells were treated with dimethyl sulfoxide (DMSO). The results are presented as mean ± SD of data from at least 3 independent experiments. Statistical significance * P < .05 or ** P < .01 as compared with the control.
As expected, PFOS showed cytotoxic activity. In comparison with the control cells, N9 cells exposed to PFOS for 24 and 48 hours showed a significant dose-dependent inhibition of cell growth at a concentration of 10 μmol/L or higher (P < .05 vs control).
Perfluorooctane Sulfonate Induced Apoptosis in N9 Cells
In order to evaluate the effect of PFOS on the induction of apoptosis, N9 cells treated with PFOS for 24 hours were subjected to Hoechst 33258 staining. The typical apoptotic morphological changes were shown in Figure 2 . For example, condensed chromatin and cellular swelling in Figure 2b (50 μmol/L), as well as chromatin margination and loss of cell volume in Figure 2c (100 μmol/L), and punctate distorted cell membrane in Figure 2d (200 μmol/L).
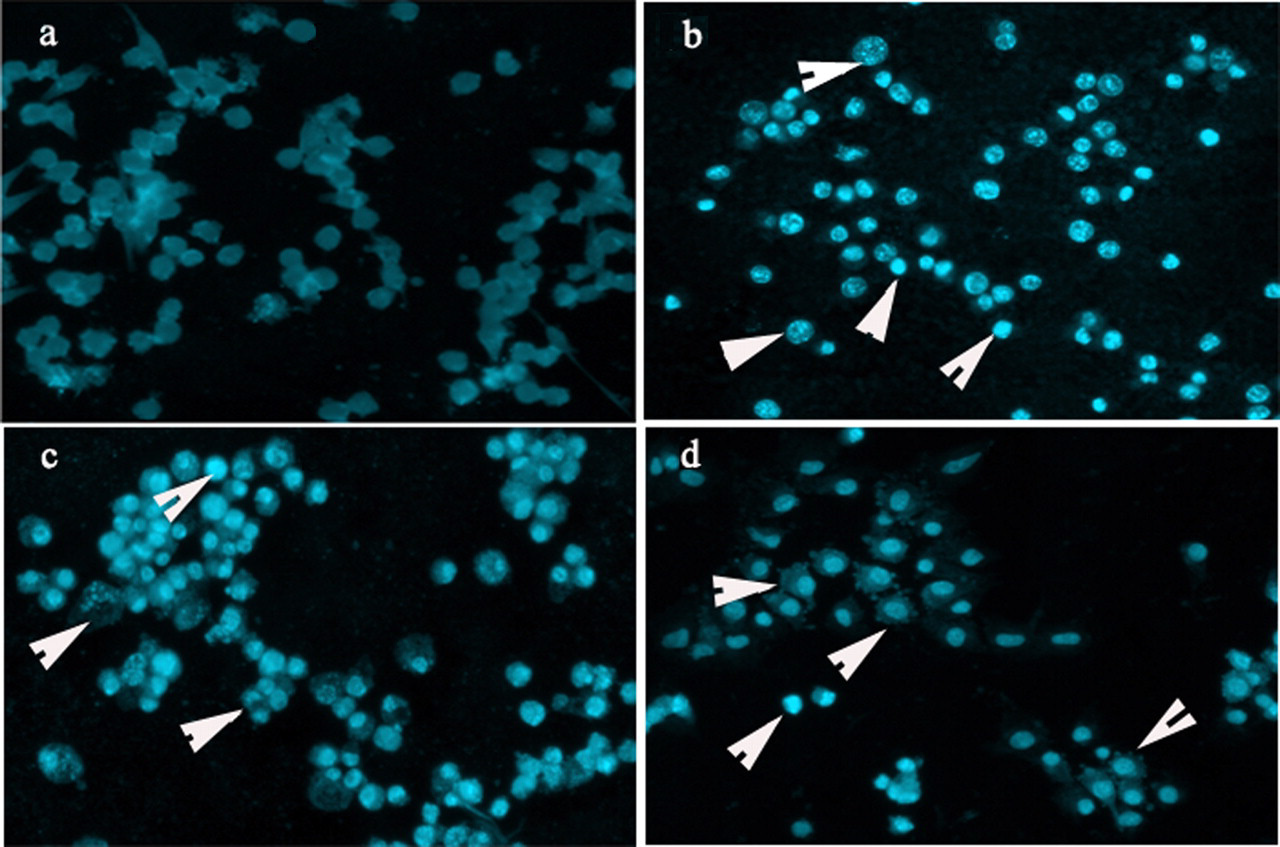
Morphological changes of N9 cells after PFOS exposure. N9 cells were treated with PFOS at the concentration of 50, 100, and 200 μmol/L for 24 hours, respectively (b-d), (a) was control (magnification ×200). These arrows represented condensed chromatin and cellular swelling (b), chromatin margination and loss of cell volume (c), and punctate distorted cell membrane (d), respectively.
In addition to morphological evaluation, apoptosis induced by PFOS was ascertained with flow cytometry visible as a sub-G1 peak. As illustrated in Figure 3 , apoptotic peaks and increased percentage of apoptotic cells were observed in a dose-dependent manner after 24 hours treatment with 50 μmol/L PFOS or higher. For example, after the cells treated with PFOS at the concentration of 200 μmol/L, the apoptotic fraction increased to 48.72%.
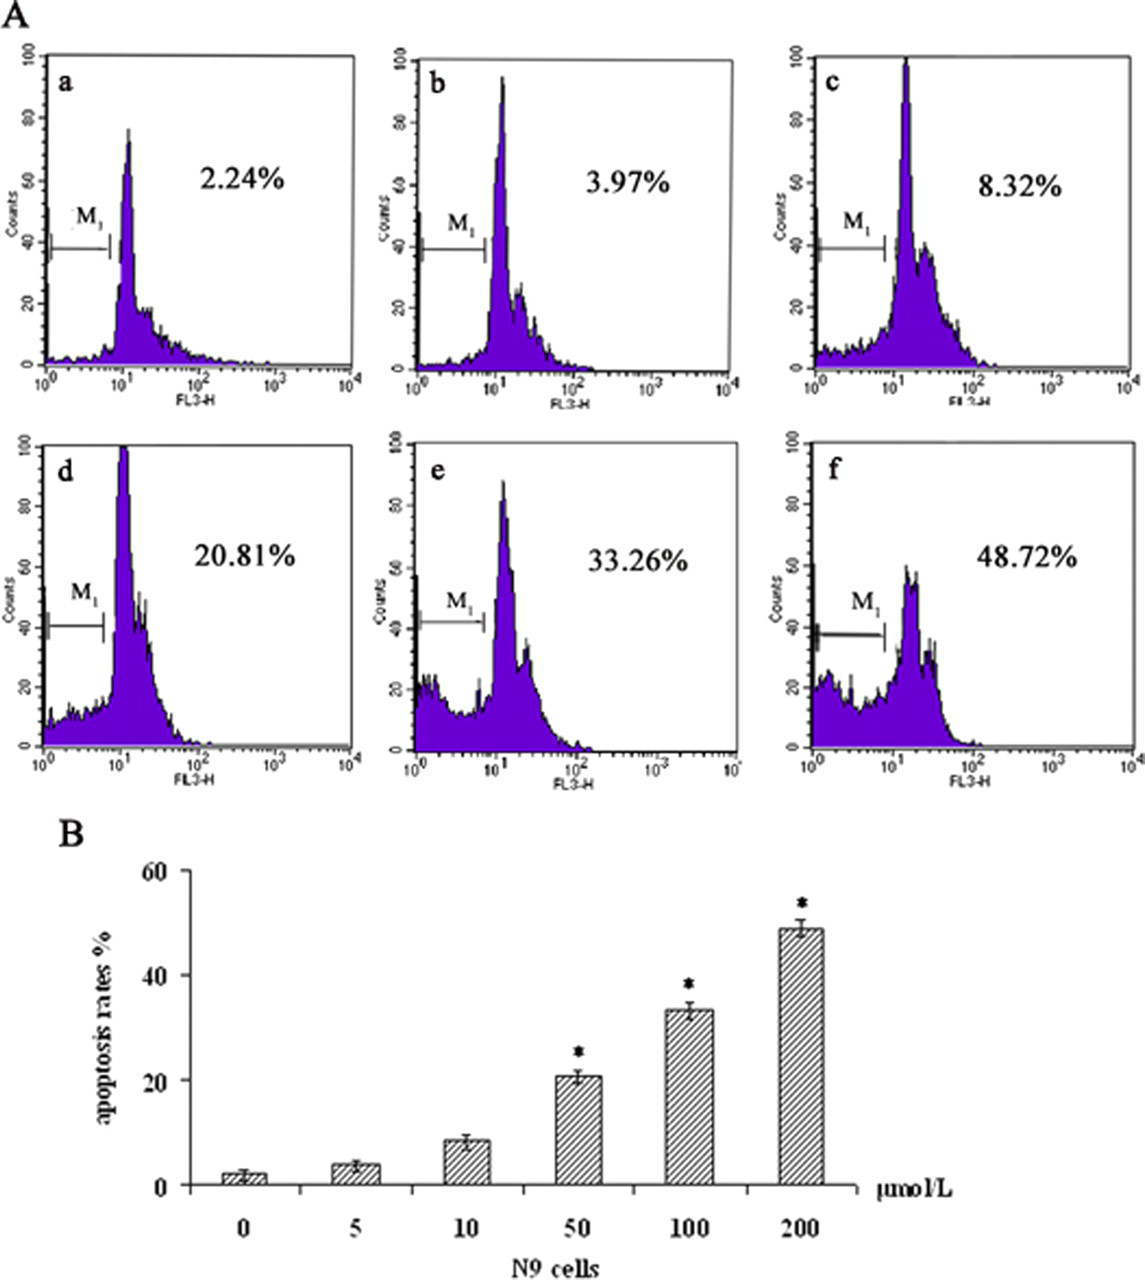
Apoptosis effects of PFOS in N9 cells assayed by flow cytometry. The cells were incubated for 24 hours with A(a) dimethyl sulfoxide (DMSO) control, A(b) 5 μmol/L, A(c) 10 μmol/L, A(d) 50 μmol/L, A(e) 100 μmol/L, A(f) 200 μmol/L. B, a graphic representation of the concentration-dependent increase in the percentage of apoptotic cells following PFOS treatment. All data were expressed as a percentage of the sub-G1 population obtained from the cells of flow cytometry data of propidium iodide fluorescence as described in Materials and Methods, mean ± SD (n = 3). Statistical significance * P < .05 as compared with the control group.
Effect of PFOS in MMP of N9 Cells
Mitochondria are the major source to produce ROS. When the mitochondria are damaged, excessive ROS may be released from mitochondria. The excessive ROS may cause further mitochondrial damage and result in the loss of the membrane potential, thus inducing the execution of apoptosis. 27 To identify whether cell apoptosis induced by PFOS was involved in mitochondrial pathways, the effect of PFOS on MMP was measured by using the Rh-123, a fluorescent dye that accumulates rapidly and selectively within mitochondria depending on the membrane potential. As shown in Figure 4c , PFOS caused disruption of mitochondrial membrane potential as evidenced by a decrease in the proportion of cells with higher fluorescence intensity at the concentration of 50 μmol/L or higher for 24 hours, for example, punctate perinuclear fluorescence after 200 μmol/L PFOS exposure (Figure 4b).
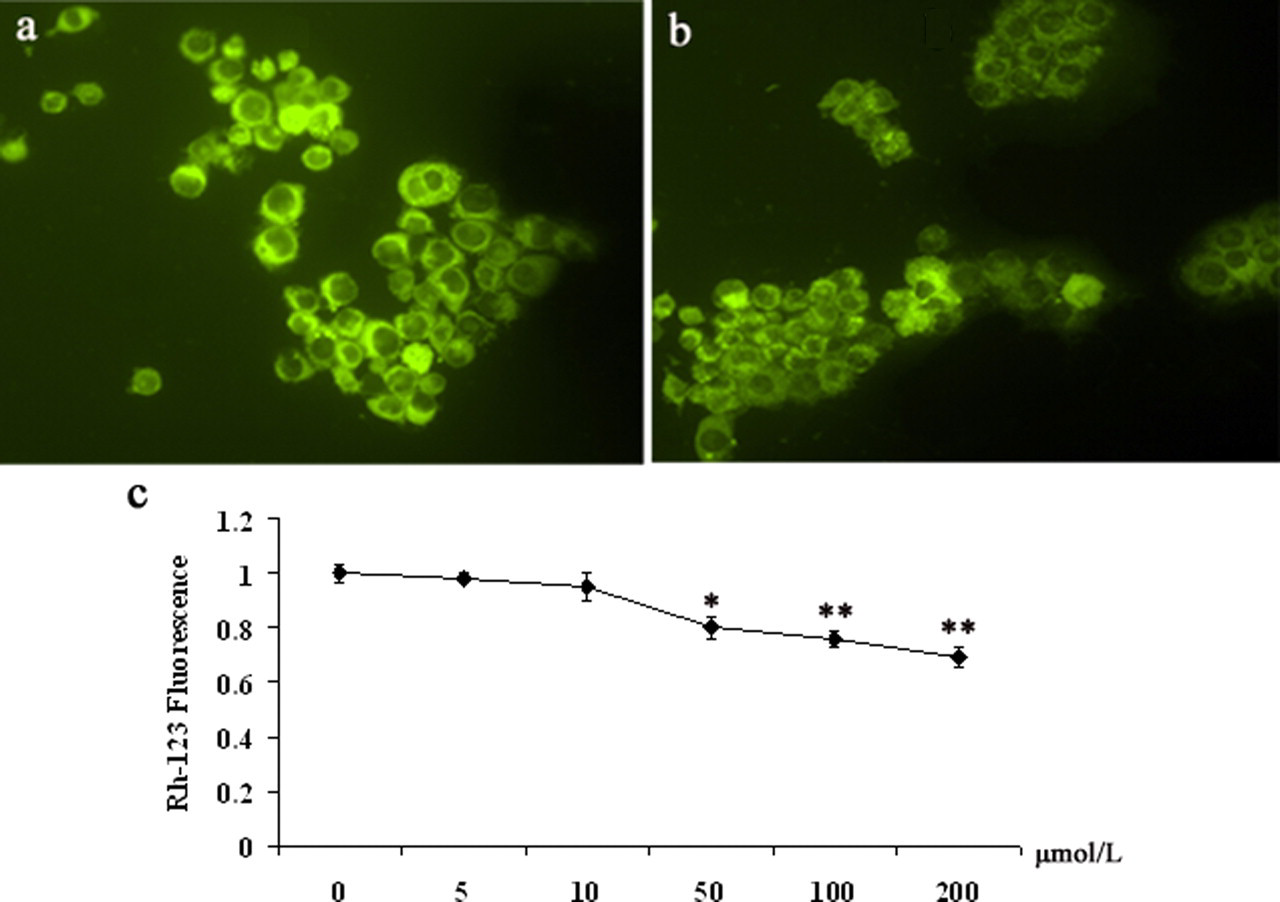
Effect of perfluorooctane sulfonate (PFOS) on mitochondrial membrane potential in N9 cells loaded with Rh-123. a, Photomicrograph of an Rh-123 image at the control group. b, Photomicrograph of an Rh-123 image demonstrating decreased and punctate perinuclear fluorescence. c, The changes of Rh-123 mitochondria fluorescence in the cells. All traces represent the mean ± SD of at least 50 N9 cells per condition. Statistical significance * P < .05 as compared with the control group.
Effect of PFOS on p53, Bax, Bcl-2, Caspase-9, and Caspase-3 mRNA Expression
N9 cells were cultured with PFOS at the doses of 5 to 100 μmol/L for 24 or 48 hours incubation. Effects of PFOS on p53, Bax, Bcl-2, caspase-9, and caspase-3 mRNA expression were investigated, and β-actin was used as internal reference gene. Figure 5 showed the effects of PFOS on the 5 genes' mRNA expression, respectively.
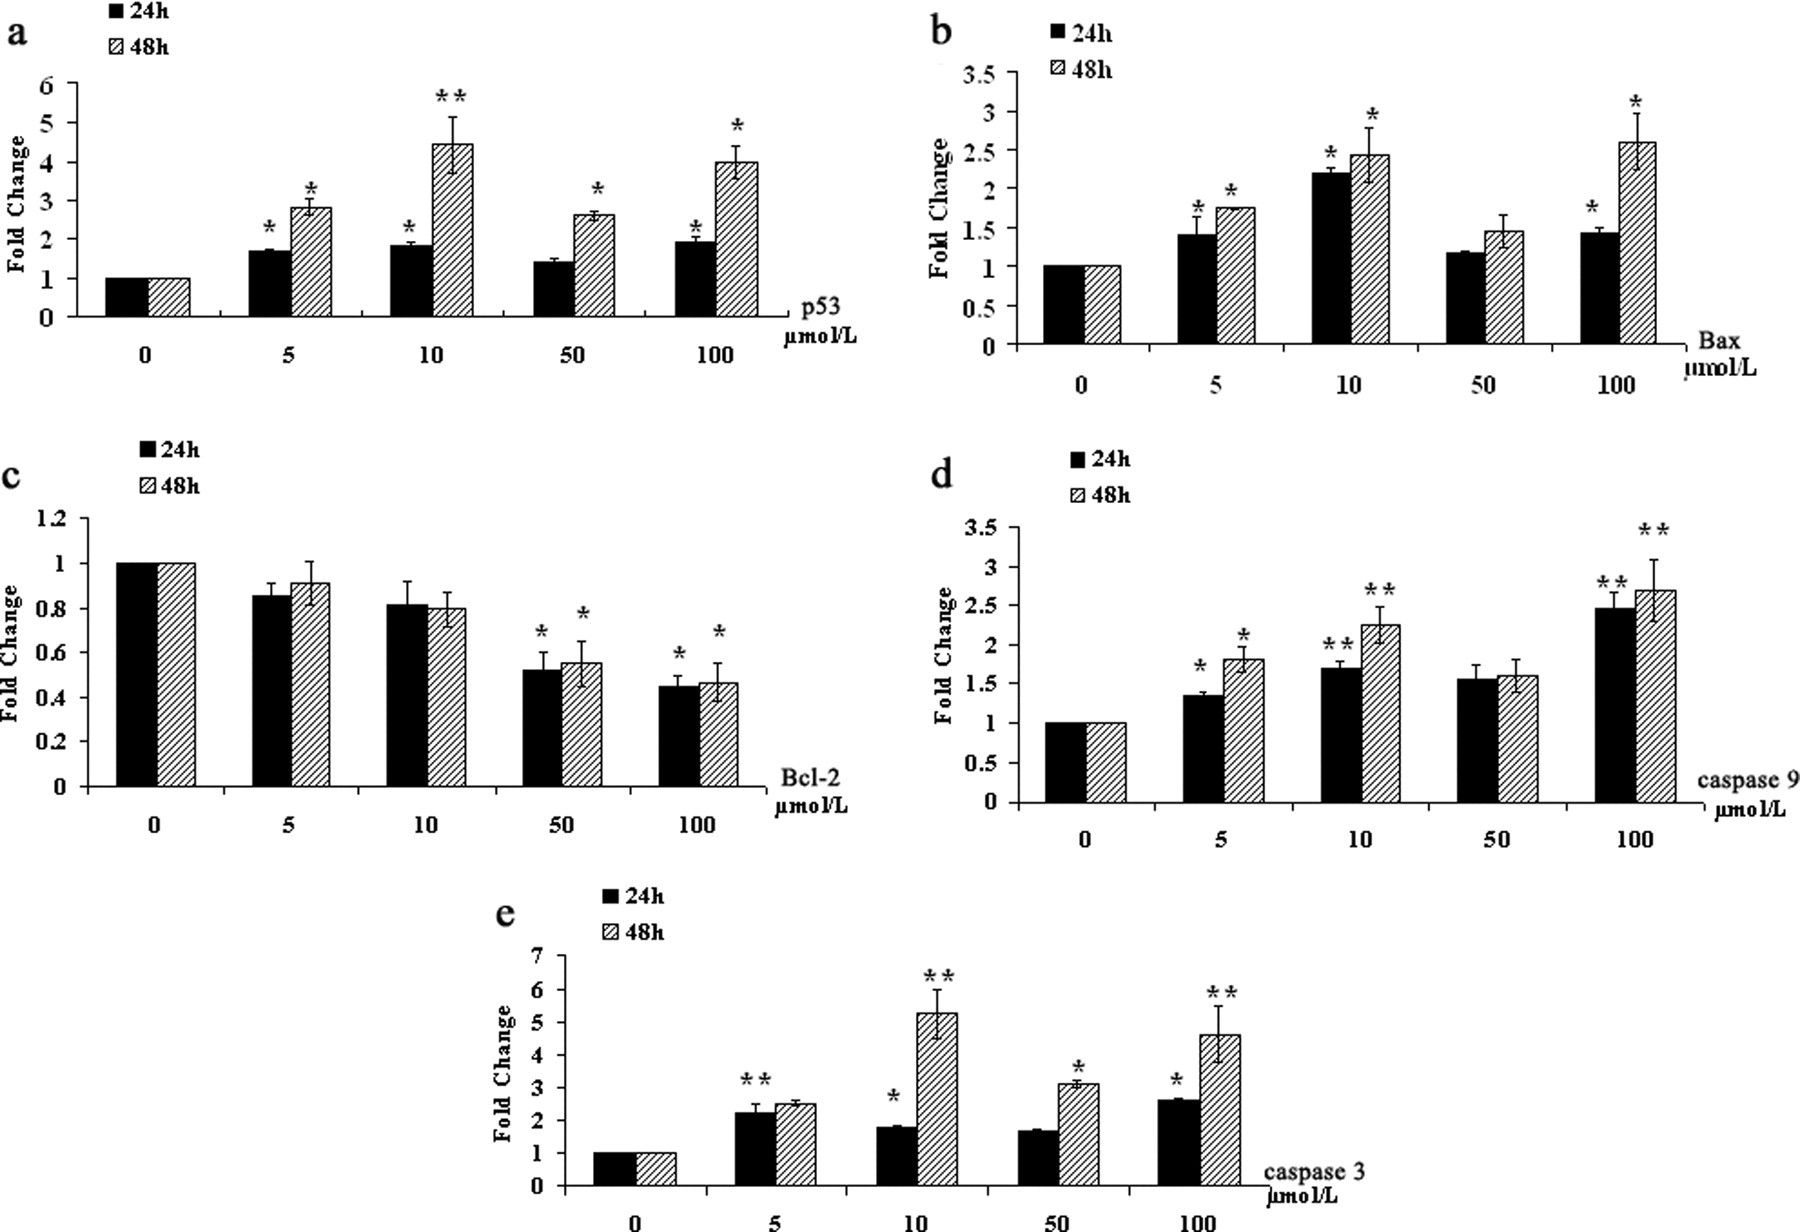
Relative quantitative evaluation messenger RNA (mRNA) levels of 5 genes in N9 cells after perfluorooctane sulfonate (PFOS) exposure. The cells were treated with 5 to 100 μmol/L PFOS for 24 and 48 hours. Total RNA was extracted and subjected to qPCR. Relative expression levels of (a) p53, (b) Bax, (c) Bcl-2, (d) caspase-3, and (e) caspase-9 mRNA levels were expressed as 2-ΔΔCt value (see Materials and Methods), in which β-actin was used as the internal control. Statistical significance * P < .05 or ** P < .01 as compared with the control.
The study results indicated that p53, Bax, caspase-3, and caspase-9 expression in the cells treated with 5 μmol/L or higher PFOS were obviously enhanced at 24 and 48 hours (Figure 5). In which, compared with gene mRNA levels at 24 h, p53 mRNA levels were obviously enhanced at 48 hours, whereas Bax mRNA level showed a higher increase only after 100 μmol/L PFOS exposure, and caspase-3 mRNA levels showed obviously higher upregulation with 10, 50, and 100 μmol/L PFOS (Figure 5a, b, and e). Moreover, the expression of Bcl-2 was downregulated after PFOS 50 and 100 μmol/L exposure (Figure 5c).
Discussion
Perfluorooctane sulfonate is the ultimate degradation product of a number of commercially produced PFCs, and the concentrations of PFOS in wildlife are greater than other perfluorinated compounds. 5 –28 Recent studies reported that PFOS may exhibit both acute excitotoxic effects on synaptic function and chronically inhibit synaptogenesis in the brain through enhancement of Ca2+ channels in cultured rat hippocampal neurons, which revealed the damage of this pollutant to nerve system. 29
Microglia are now firmly established as key cellular elements in the CNS, and they are recognized to serve as the brain’s innate immune system. Furthermore, microglia are considered to be a sensitive monitor and can diagnose the integrity of CNS circuity by sensing defunct synapses. 30,31 It has been shown to possess strong secretory activity and produce reactive nitrogen intermediates and cytokines such as tumor necrosis factor α (TNF-α), monocyte chemotactic protein-1 (MCP-1), and interleukin 8 (IL-8). 25 However, overactivation of microglia could be induced by environmental toxins and products released from neuronal death or damage as occurs in many neurodegenerative diseases, which may damage microglial-neuronal crosstalk further. 23 N9 cells were a useful in vitro model as a murine microglia cell line to understand the possible mechanism of toxicity to microglia after PFOS exposure.
In this study, a range of 5 to 200 μmol/L PFOS concentrations was chosen to treat microglial N9 cells because a range of 10 to 200 μmol/L was also used in other previous reports for toxicity studies. For example, PFOS (50-200 μmol/L) induced apoptosis of Hep G2 cells, whereas PFOS evoked a degree of lipid peroxidation in PC12 cells even at the lowest concentration (10 μmol/L). 17 –20 The lowest concentration (5 μmol/L, as well as 2.69 μg/mL) in the present study was higher than the upper limit of the mean levels (0.5-2 μg/mL) in production workers, but significantly lower than the highest serum level in production workers' reported values of 13 μg/mL (26 μmol/L). 32
To elucidate the molecular mechanism of PFOS-induced cytotoxicity on N9 cells, we compared cell viability change by performing the MTT assay and found that under the experimental conditions, PFOS induced inhibition of cell growth at a concentration of 5 μmol/L or higher. Moreover, the morphological changes in the N9 cells treated with PFOS indicated apoptosis, which was further confirmed by flow cytometry; the flow cytometry data indicated that PFOS caused the increase of sub-G1 population (apoptotic) in a concentration-dependent manner. These results suggested that viability inhibition of the cells by PFOS was possibly caused via apoptosis.
Mitochondrion has been reported to play a key role in the regulation of apoptosis in mammals. 33 A variety of apoptotic stimuli can alter mitochondria permeability, mitochondrial dysfunctions including the loss of mitochondrial membrane potential (MMP), permeability transition, and release of cytochrome c from the mitochondrion into the cytosol are associated with apoptosis. 34,35 In this study, we detected the influence of PFOS on MMP. There was a reduction of MMP as indicated by the observation that PFOS-treated cells had less ability to aggregate the fluorescence probed into mitochondrial membrane. Reduction and collapse of MMP that resulted in mitochondrial permeability transition (MPT) was among the very first intracellular events preceding the execution phase of apoptosis via the mitochondria-mediated death pathway. 36,37 This result suggested that apoptosis induced by PFOS was related to mitochondria. In mammals, mitochondria function as central checkpoints for many forms of apoptosis. The present study confirmed mitochondria, thus, were an important target for PFOS cytotoxicity, then the caspase cascade triggered by the mitochondrial pathway needs further investigation.
Apoptosis is a tightly regulated process, which involves changes of a distinct gene expression. Among the numerous factors known to modulate cancer-related apoptosis, p53 and Bcl-2 are the most extensively characterized mechanistically. p53, a tumor-suppressor gene, can induce expression of proteins that target both mitochondrial and cell-receptor-induced apoptotic pathways, p53 induced proteins that localize to the mitochondria such as Bax, a member of the Bcl-2 family. 38,39 Bcl-2 gene family is a complex network-regulating apoptosis, in which Bax is a protein that mediates cell death whereas Bcl-2 promotes viability, and the ratio of Bax to Bcl-2 appears to be a critical determinant of cellular threshold for undergoing apoptosis. It has been suggested that Bax can form a transmembrane pore across the outer mitochondrial membrane, leading to loss of membrane potential. Decrease in MMP is attributed to open an inner mitochondrial membrane channel, that is, permeability transition pore, and then cause MPT. 40 –44 After PFOS exposure at a range from 5 to 100 μmol/L concentration, the expression of Bcl-2 was downregulated, and p53 and Bax mRNA increased without significant dose-dependent manner, compared with the control. Therefore, we postulated that the increase of p53 and the high ratio of Bax to Bcl-2 modulated by PFOS promoted N9 cells to undergo apoptosis. This conclusion was supported by the cell morphological changes, including cellular shrinkage, chromatin condensation and margination, cellular swelling, and nuclear fragmentation.
Caspases are key regulating enzymes in apoptosis in a variety of cells. It is well-known that an increase in the ratio of Bax to Bcl-2 stimulates the release of cytochrome c from the mitochondria into the cytosol, promotes activation of caspase-9, and then binds to Apaf-1, leading to the activation of caspase-3 and poly(ADP-ribose) polymerase (PARP). Caspase activation is thought to be involved toward the middle to the end of apoptotic events. 45,46 In this study, we found that N9 cells treated with PFOS activated caspase-9 and caspase-3 at 24 and 48 hours, in which the increase trend was more significant at 48 hours compared with levels at 24 hours. These results supported the role of caspase-9 and caspase-3 in PFOS-induced apoptosis. However, the mRNA levels of these apoptosis-related genes, except for Bcl-2, did not show a concentration response. We postulated that partial N9 cells showed late stage of apoptosis or even necrosis instead of programmed cell death exposed to PFOS with 50 μmol/L or higher concentrations, and changed expression of these genes were more sensitive markers than morphologic change.
In summary, the present study showed that PFOS induced cytotoxic effects various concentrations of PFOS on N9 cells, including the inhibition of cell growth, in the changes in the morphology and cell cycle, reduction of MMP, and the change of mRNA levels of several genes related to apoptosis. Slotkin et al had reported the developmental neurotoxicity of PFOS in vitro model by promoting differentiation into the Ach phenotype in PC-12 cells. 20 However, microglia as a sensor monitor and diagnose the integrity of CNS circuity by sensing defunct synapses, and microglial malleability is likely to represent a key mechanism underlying beneficial functional plasticity of the CNS, thus the pathological apoptosis in microglial cells induced by PFOS may play a pivotal role in neurotoxicity. To our knowledge, this is the first demonstration that PFOS do indeed have cytotoxic effects on microglial N9 cells associated with the mitochondrial apoptotic pathway. Moreover, the activation and proliferation of microglia were recognized as significant markers for CNS response to injury. However, the identity of signaling molecules that triggered this response remains obscure and requires further investigation.
Footnotes
Authors Ling Zhang and Yuan-yuan Li contributed equally to this work.
The author(s) declared no conflicts of interest with respect to the authorship and/or publication of this article.
The author(s) disclosed receipt of the following financial support for the research and/or authorship of this article: National Natural Science Foundation of China (81030051, 20807017), the Key Projects in the National Science and Technology Pillar Program (grant number 2007BAC16B07), and the R&D Special Fund for Public Welfare Industry (Environment; grant number 200909102).