
Abstract
Lindane, malathion, and piperonyl butoxide were cultured singly or as mixtures with murine splenocytes to evaluate changes in cell death and caused cytotoxicity in a concentration- and time-dependent manner. Pesticide mixture studies were then performed based on minimum cytotoxicity concentrations (<LC25). Cytologic analysis and the alamarBlue assay revealed that individual pesticides and mixtures of malathion/lindane and malathion/piperonyl butoxide prompted cytotoxicity, which was supported by DNA ladder analysis. Using 7-aminoactinomycin D, apoptosis was quantified at 6.5%, 12.0%, 13.2%, 19.3%, and 23.4% for malathion, lindane, piperonyl butoxide, malathion-lindane, and malathion-piperonyl butoxide, respectively. Staining with 7-aminoactinomycin D and B- or T-cell–specific fluorescent-labeled monoclonal antibodies showed B cells to be more susceptible to malathion and piperonyl butoxide treatments than T cells. Treatment of murine splenocytes in vitro with minimum cytotoxic concentrations of lindane, malathion, and piperonyl butoxide and their mixtures induced apoptosis, the effect elicited by the mixtures being additive compared with the individual pesticide effect.
In the United States alone, 20 000 pesticide products are on the market, and 1 billion pounds of active ingredient are applied annually for agricultural, industrial, and residential pest control. 1 Pesticides offer increased crop protection and are an important tool in reducing the level of vector-borne diseases. However, this increased use of pesticides has created an awareness of their potential health hazards, particularly when an estimated 85% to 90% of all pesticides applied never reach their target organisms. 2 In view of this widespread use and stability of a variety of pesticides in the environment, the potential for multiple chemical exposures to human and animal populations, either simultaneously or sequentially, is unavoidable.
Until recently, approximately 95% of chemical toxicity studies were performed with individual chemicals and at high exposure levels. 3,4 Research on chemical mixture toxicity has increased because of an initiative set forth by the US Environmental Protection Agency to promote a broader understanding of chemicals in mixtures and the mechanisms associated with toxicity. 1,5 Pesticide mixtures have the potential to produce toxicities not associated with individual pesticides, given that the presence of one could influence the health effects of the other.
Three pesticides are of particular interest. Lindane (Lind) is an organochlorine that functions as a mixed function oxidase (MFO) inducer. 6 Malathion (Mal) is an organophosphate and acetylcholinesterase inhibitor, 7 and piperonyl butoxide (PBO) is a synergist and MFO inhibitor. 8 Although the individual toxicities of these pesticides are well documented, there is little evidence of what health effects may result when these pesticides are encountered as mixtures. A common mode for measuring cell toxicity is to evaluate markers of cell death. Thus, the goal of this study was to examine whether in vitro exposure of murine (C57BL/6) splenocytes to these pesticides, individually or in binary mixtures, induced cytotoxicity via apoptosis, necrosis, or both.
The pesticides examined in this study have been previously shown individually to dysregulate or suppress immune function. 9-14 The effect of these xenobiotics on immune cells is of particular interest, because it is known that immune response is governed by a series of delicately balanced, complex, multicellular physiological mechanisms that at times are vulnerable to very low levels of chemical insult. 4,15 One possible outcome of immunotoxic effects is cell death resulting from either apoptosis or necrosis. Necrotic cell death is an unregulated, passive process resulting from severe damage to the cell via the loss of membrane integrity with swelling of the cytoplasm and mitochondria, resulting in cell rupture and inflammation of surrounding tissues. 16 In contrast, apoptotic cell death is a highly regulated, energy-dependent process with observed plasma membrane blebbing, aggregation of nuclear chromatin, and shrinkage of cytoplasm forming membrane bound vesicles. 17 Biochemically, nonrandom mononucleosomal and oligonucleosomal fragmentation of DNA, release of cytochrome c from mitochondria into the cytoplasm, and alteration of membrane symmetry can result. Physiologically, individual cells undergo apoptosis without disrupting surrounding tissue. 16,18 Because maintaining a healthy immune system is fundamental to an organism’s ability to resist disease, the interaction of xenobiotics with various components of the immune system has become an area of profound interest. Lymphocytes encounter antigen, initiate clonal expansion, and regulate immune responses in the spleen, the largest secondary lymphoid organ in mammals. 19 An increased occurrence of apoptotic cell death in lymphocytes could compromise immune regulation, because it could alter neural responses, endocrine hormone regulation, or autoimmune response. 20-22
The 3 pesticides evaluated in this study are commonly used as topical insecticides and less for agriculture. Lindane (10%) was banned for agricultural uses in the United States; however, it is registered for use as a treatment of lice and scabies. 23 In 1995, the US Food and Drug Administration recommended that lindane only be used as a second line of defense for these treatments. 24 Pharmaceutical uses of lindane were banned in California in 2002. 25 As a result of these events, alternative formulations were sought for treatment of lice, scabies, and mites, including permethrin (1% or 9%) with PBO (10%) or malathion (51%). 25 Thus, the modality in which these pesticides are currently being used would suggest a likelihood of mixture exposure either directly (treatment) or indirectly (via contaminated water, soil).
The present study examined the characteristics of pesticide-induced cell death, assessing a variety of criteria for apoptosis versus necrosis in cells. We present evidence indicating that cultured murine splenocytes are susceptible to low doses of pesticides (Mal, Lind, and PBO) and that pesticide mixtures additively increase both apoptosis and necrosis compared with individual pesticide treatments.
Methods
Materials
C57BL/6 mice were obtained from Charles River Laboratories (Wilmington, Mass). Mal, Lind, and PBO were purchased from Chem Services (West Chester, Pa). RPMI-1640, l-glutamine, penicillin/streptomycin, nonessential amino acids, HEPES buffer, and phosphate-buffered saline (PBS) were obtained from Gibco BRL (Rockville, Md). Fetal bovine serum was obtained from Atlanta Biologics (Norcross, Ga). Ethanol, wire mesh screens, ammonium chloride, potassium bicarbonate, EDTA, TRIS, boric acid, bovine serum albumin (BSA), agarose, concanavalin A (ConA), dexamethasone (DEX), hydrogen peroxide (H2O2), and modified Wright’s stain were obtained from Sigma (St. Louis, Mo). The alamarBlue dye was obtained from Accumed International (Westlake, Ohio). Ninety-six-well U-bottom plates were obtained from Corning (Corning, NY). Permount was obtained from Fisher Scientific (Pittsburg, Pa). The apoptotic ladder kit was obtained from Boehringer Mannheim (Mannheim, Germany). The 7-amino-actinomycin D (7-AAD) was obtained from Molecular Probes (Carlesbad, Calif). Fluorescein-isothiocyanate (FITC)–rat anti-mouse CD 90.2 (Thy-1.2) (T-cell specific), R-phycoerythourin (R-PE) rat anti-mouse CD45R/B220 (B-cell specific), isotype FITC rat IgG2aκ, and isotype R-PE rat IgG2aκ were obtained from BD Pharmingen (San Diego, CA).
Animals
Eight- to 12-week-old male C57BL/6 mice (n = 40) from Charles River Laboratories (Wilmington, Mass) were used for all experiments. The animals were maintained in accordance with US Department of Health and Human Services Guide for the Care and Use of Laboratory Animals. 26 All studies and protocols were approved by the IACUC prior to initiation. The animals were housed in polycarbonate cages with hard wood chip bedding in temperature-controlled (21°C ± 2°C), humidity-controlled (50% ± 10%), and light cycle–controlled (12 hour/12 hour) rooms. Water and food were supplied continuously throughout the study.
Chemicals
Mal (purity 99%), Lind (purity 99.5%), and PBO (purity 98%) were purchased from Chem Services (West Chester, Pa), and stock solutions (37.5 mM) were prepared using 100% denatured ethanol using aseptic conditions. A working solution was made from each stock solution using complete phenol red-depleted RPMI-1640 media (Gibco BRL, Rockville, Md; 10% FBS [Atlanta Biologics, Norcross, Ga], 2 mM L-glutamine, 0.1 mM modified essential medium non-essential amino acid solution, 50 U/mL penicillin + 50 µg/mL streptomycin, and 10 mM HEPES buffer [Gibco BRL]) to obtain a final ethanol concentration not exceeding 0.3% in the treatment mixture. Pesticide solutions, labeled as ×4 treatment solutions, were prepared by diluting the working solution with complete, phenol-red–depleted RPMI-1640 media. Appropriate controls were included in all experiments. These included 10 µg/mL ConA, a T-cell mitogen proliferative agent (Sigma Chemical, St. Louis, Mo); 10 µg/mL DEX, an apoptotic agent (Sigma); 10 mM hydrogen peroxide (H2O2), a necrotic agent at high doses; or 0.3% ethanol (EtOH), the pesticide solvent.
Splenocyte Collection and Isolation
Isolation of spleen cells was performed as described 27 with slight modification. Briefly, immediately after the mice were sacrificed via cervical dislocation, their body weight (24.75 ± 2.28 g) was measured and the spleen was removed aseptically. Splenic weight (0.0754 ± 0.025 g) was obtained, and 10 mL of cold, incomplete, phenol-red–depleted RPMI-1640 media was added. All media used in the study were devoid of phenol-red. The spleen was dissociated by gently teasing across a metallic 60-mesh wire sieve (Sigma). Cells were pelleted (250g, 8 minutes, 4°C; IEC Centra GP8R, International Equipment, Needham Heights, Mass) and resuspended in erythrocyte lysis buffer containing 1mL of cold, complete RPMI-1640 media and 3 mL of cold ACK lysis buffer (0.15 M ammonium chloride, 1 mM potassium bicarbonate, and 0.1 mM EDTA, pH 7.4; Sigma). The cell suspension was incubated for 3 minutes on ice and diluted to 15 mL total volume with cold, complete RPMI-1640 media. Cells were pelleted and washed once each with complete and incomplete media, respectively. Cells were resuspended in incomplete media and counted on a CASY I Cell Counter and Analyzer System (Scharfe Systems Gmblt, Reutlinger Germany). Cells were diluted to 5 × 10⁶ cells/mL and kept on ice until use. Final preparations routinely contained ~90% lymphocytes on examination of Wright’s stained cytospins.
AlamarBlue Cytotoxicity Assay
Splenocyte cytotoxicity was monitored using the colorimetric and fluorimetric indicator dye alamarBlue (Accumed International, Westlake, Ohio). The dye detects cellular metabolic activity (or corresponding cell viability), which directly influences its reduction. Dose response (4 experiments with 4 replicates per treatment, n = 16), time response (4 replicates per treatment per time point, n = 4), and mixture studies (5 experiments with 4 replicates per treatment, n = 20) were performed using this assay.
Enriched splenocytes were seeded at 5 × 10⁵ cells/well (100 µL volume) in a 96-well, U-bottomed tissue culture plate (Corning, Corning, NY). Cells were treated (37°C, 5% CO2, 95% humidity) for a period of time (≤16 hours for the dose response, time response, and mixture study), rinsed with PBS (37°C; Gibco BRL), and pelleted (250g, 10 minutes, 25°C). The alamarBlue dye (1/10 of total well volume) and complete RPMI-1640 media were prewarmed to 37°C and added to each well. Cells were incubated for 24 hours (37°C, 5% CO2, 95% humidity), and fluorescence was measured on the Cytofluor TM II Multiwell Plate Reader (530 nm excitation, 590 nm emission and gain 35; Perspective Biosystems, Farmington, Mass). Output was in fluorescence units and any loss of viability (or decrease in fluorescence) for a treatment (T) was calculated as a percentage of the 16 hours untreated (Unt) [(mean fluorescent units Unt-mean fluorescent units T)/mean fluorescent units of the Unt ) × 100; expressed in % fluorescence]. This value represents the percentage cytotoxicity of each treatment. 28,29
Cytologic Identification of Apoptotic Cells
Splenocytes were treated with pesticides (Lind 70 µM, Mal 50 µM, PBO 55 µM, and mixtures of Mal-Lind or Mal-PBO) for 16 hours under the conditions described above (refer to the section titled AlamarBlue Cytotoxicity Assay). Additional treatments included Unt 0 hours, Unt 16 hours, EtOH 0.3%, and 10 µg/mL DEX. Following treatment, cells were pelleted (250g, 10 minutes, 4°C), rinsed with cold PBS, and repelleted. Cells were resuspended in 4 parts incomplete RPMI-1640 media and 2 parts 0.5% BSA/PBS solution, and 2 wells were combined per treatment (approximately 1 × 10⁶ cells). The cell suspension was added to a cytocentrifugation chamber (Sakura, Tokyo Japan) and centrifuged (17 × g, 5 minutes, 23°C; Cyto-TEK, Mile Scientific, Elkhart, Ind). Slides were allowed to dry and were stained with modified Wright stain (Sigma). 30,31 Cover slips were adhered to the slides using Permount (Fisher Scientific, Pittsburgh, Pa). After 24 hours, slides were examined under oil immersion light microscopy (×250) on the Olympus AH-2 Vanox-T Light Microscope. Ektachrome 64 slides (Kodak) were taken of representative cells and evaluated by a board-certified clinical pathologist (K. Z.).
DNA Ladder Assay
Splenocytes were treated for 4, 8, and 16 hours as previously described (refer to the section titled Cytologic Identification of Apoptotic Cells). Following treatment, 4 wells per treatment group were combined in 1 sterile, DNase-free microcentrifuge tube. Each well was rinsed with 37°C PBS, and the contents of each well were placed into a microcentrifuge tube. Cells were pelleted and resuspended in 200 µL of cold PBS. The apoptotic ladder kit was used according to the manufacturer’s protocol (Boehringer Mannheim, Mannheim, Germany). Briefly, cells were lysed and isopropanol was added. The samples were filtered through a glass-fibered fleece on which the nucleic acids bind to the surface. Impurities were removed via 2 rinses, and the purified DNA was eluted. The samples were stored for up to 2 weeks at –20°C. For analysis, a 1% agarose gel (with ethidium bromide) was prepared with Tris-borate-EDTA buffer (pH 8.0), samples were loaded, and the gel was run at 75 V for 45 minutes. The gel was viewed under ultraviolet light to visualize ethidium bromide/DNA complexes. Ladder patterns were suggestive of an apoptotic cell population, whereas a smear patterns suggested a necrotic population.
Flow Cytometric (7-AAD) Staining Assay
Splenocytes were treated with pesticides (refer to the section titled Cytologic Identification of Apoptotic Cells) for 16 hours. Following treatment, cells were rinsed with 37°C PBS and pelleted (250g, 10 minutes, 4°C). The media were removed, and 100 µL of 10 µg/mL 7-AAD DNA binding agent (Molecular Probes, Carlsbad, Calif) in a supplemented buffer (0.15% sodium azide and 2% BSA in PBS) was added to all wells except the unstained treatment, to which only supplemented buffer was added. The plate was placed on ice in the dark and incubated no more than 30 minutes. 30 Cells were processed on a Beckman-Coulter Epics XL/MCL flow cytometer (488 nm excitation, 670 nm emission; Hialeah, Fla). At 0 hours, cells were measured by size (forward scatter; y axis) and granularity (side scatter; x axis). A gate (V gate) was drawn at 0 hours around the densest cell population (which included ~80% of the total cells). Dispersal of cells from this gate was monitored, and the percentage of cells remaining in the gate following treatment was measured, called the V-gate value (n = 5000 events). Apoptotic cells were identified and quantified based upon the method described by Schmid et al. 32,33 These cells were analyzed for the ability to take up 7-AAD. The 7-AADdull–stained cells are the live cells, 7-AADmoderate are the early apoptotic, and 7-AADbright are the late apoptotic or necrotic populations. 31,32 The values were reported as an average percentage. Each individual percentage was obtained after counting 5000 events on the flow cytometer.
Immunophenotyping of Cells Using Monoclonal Antibodies and 7-AAD Double Staining
The spectral properties of 7-AAD allow it to be used in combination with FITC and R-PE cell surface labels. In this experiment, 7-AAD was used in combination with 2 monoclonal antibodies, 1 labeled with FITC and 1 with R-PE. Splenic immune cells (~90% lymphocytes) were treated with pesticides (refer to the section titled Cytologic Identification of Apoptotic Cells) for 16 hours. Working solutions (concentration equivalent to 1 µg/1 × 106 cells) of FITC–rat anti-mouse CD 90.2 (Thy-1.2) (T-cell specific), R-PE–rat anti-mouse CD45R/B220 (B-cell specific), isotype FITC rat IgG2aκ, and isotype R-PE rat IgG2aκ(BD Pharmingen, San Diego, Calif) were prepared using sterile, cold PBS, just prior to addition to the cells. Isotype-matched negative controls were used to negate background fluorescence. The cells were incubated with the proper isotype or antibody solution for 20 minutes at 4°C, in the dark, gently on an orbital shaker. Cells were rinsed with PBS and pelleted (250g, 10 minutes, 4°C), and 7-AAD was added as described above (refer to the section titled Flow Cytometric [7-AAD] Staining Assay). Cells were processed as described above. The data were processed as described for the 7-AAD staining assay except that FITC-positive cells (T cells) and R-PE–positive cells (B- cells) were also gated. 32-34
Statistical Analysis
We used SAS 8.0 software (SAS Institute, Cary, NC) for data analysis. Data for each cytotoxicity assay were analyzed using prespecified comparisons determined during the experimental design. These comparisons include statistical comparison of each individual pesticide treatment to the appropriate pesticide mixture, statistical comparison of each pesticide or pesticide mixture to the vehicle control and the Unt control, and statistical comparison of the Unt control to the vehicle control. The SAS Proc Mix model was used to determine whether statistical differences were evident. Experimental means were used to calculate the least square means (LSM) ± standard error of the LSM (SEM). Data are presented as the LSM ± SEM. If P ≤ .05, the treatments were considered statistically different. The exception was the alamarBlue time study, which was analyzed using the general linear model procedure.
Results
Effect of Pesticides on Cytotoxicity
The cytotoxicity, measuring metabolic proliferation, of each pesticide was assessed using alamarBlue. A dose response, using concentrations of 0 to 300 µM, was performed for each compound. A percentage decrease in fluorescence corresponds to the percentage cytotoxicity generated by each treatment. Extrapolation of the dose-response curve yielded 15% to 25% cytotoxicity-inducing concentrations (<LC15-25) of 50 µM, 70 µM, and 55 µM for Mal, Lind, and PBO, respectively. These concentrations were further used in the mixture studies (Figure 1).
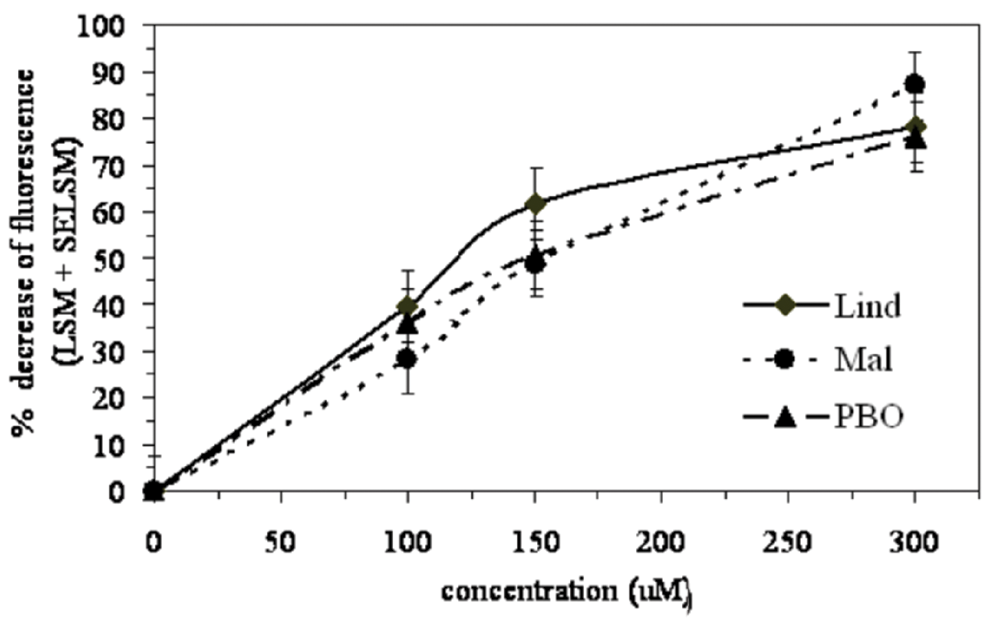
Dose response of C57BL/6 murine splenocytes treated with each pesticide. Cells were treated for 16 hours with varying concentrations of lindane (Lind), malathion (Mal), and piperonyl butoxide (PBO) (0-300 µM) and were assessed using the alamarBlue cytotoxicity assay. Each value represents the percentage cytotoxicity least square means (LSM) ± standard error of the LSM (SEM) (n = 16 per treatment). PBO 100 µM and 150 µM were not statistically different from each other. All other treatments for each specific compound were statistically different.
Cytotoxicity was examined in a time-response mixture assay using alamarBlue. The change in fluorescence was measured after 4, 8, and 16 hours of treatment. An increase in cytotoxicity throughout the 16-hour treatment was observed, particularly in the mixture treatments (Figure 2). Increases in cytotoxicity, for up to 16 hours, were observed in the Lind (70 µM) and PBO (55 µM) treatments, whereas Mal (50 µM)–induced cytotoxicity reached a plateau after 8 hours of treatment. Individual pesticide treatments were significantly different from the corresponding mixture treatments at 4-, 8-, and 16-hour time points. The level of cytotoxicity inflicted by the binary mixtures was significantly greater than that observed for the individual pesticides, particularly after 16 hours of exposure treatment (Figure 2).
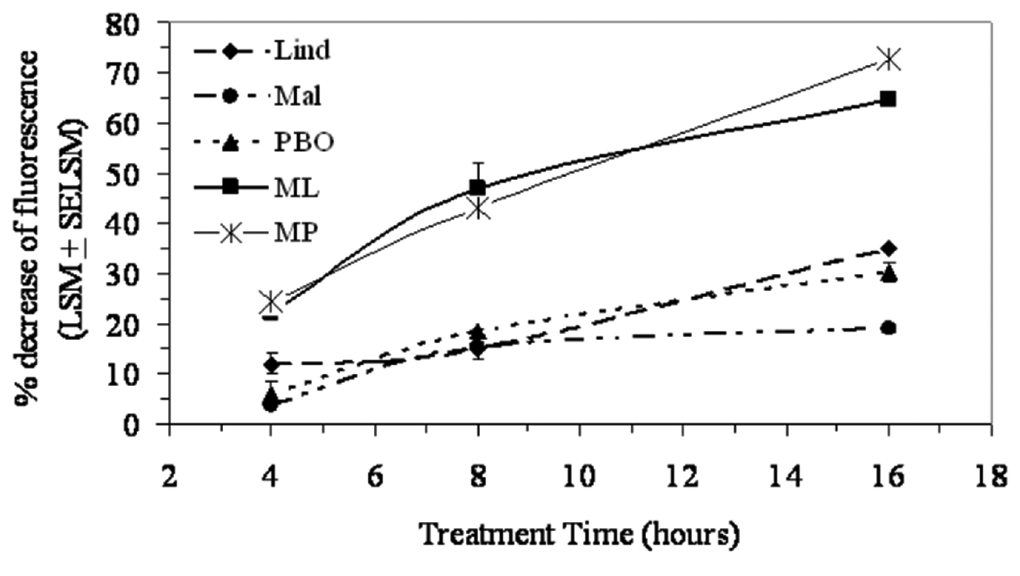
Time response of C57BL/6 murine splenocytes treated with each pesticide or pesticide mixture. Cells were treated with lindane (Lind) 70 µM, malathion (Mal) 50 µM, piperonyl butoxide (PBO) 55 µM, Mal-Lind (ML), or Mal-PBO (MP) and were assessed at 4, 8, and 16 hours following treatment using the alamarBlue cytotoxicity assay. Each value represents the percentage cytotoxicity least square means (LSM) ± standard error of the LSM (SEM) (n = 4 per treatment per time point with the exception of the untreated group, n = 8). The individual pesticide treatments were statistically different than their corresponding mixture treatments.
Effects of Pesticides on Cell Morphology
Cytology was used to detect early morphologic changes in splenocytes that could be suggestive of either apoptotic or necrotic events. Untreated (0 hours) splenic suspension at time of seeding appeared as a monomorphic population of individualized, round, small, mononuclear cells measuring approximately 10 µm in diameter with a high nuclear cytoplasmic ratio (~6:1) (Figure 3A). The cell morphology was similar in the Unt 16 hours with mildly increased pleomorphism characterized by increased size variation (anisocytosis) attributable mostly to the presence of slightly larger size cells with increased cytoplasmic volume and variation in their nuclear cytoplasmic ratio (~3:1), which was reduced compared with Unt 0 hours. Additional observations included increased nuclear lobularity with frequent cleaved nuclei, mild nuclear swelling and rarefaction of the chromatin pattern (karyolysis), and increased cytoplasmic basophilia and occasional cells with a few small punctate vacuolation and indistinct regions of perinuclear clearing (Figure 3B). These observations were supported by results obtained from trypan blue staining, which showed a 33% loss of viability in Unt cells following 16 hours of culturing (data not shown). The cells treated with DEX 10 µg/mL (positive control for apoptosis) exhibited significantly reduced cellularity secondary to cellular disruption. In remaining intact cells there was a marked pleomorphism due to shrunken cells with hyperchromatic nuclei, and there was cytoplasmic blebbing suggestive of apoptotic cell death. Other cells exhibited features more typically associated with cell death by necrosis: increased cytoplasmic volume and rarefaction along with nuclear swelling, indistinct nuclear margins, and karyolysis as well as multiple lysed cells along with multiple small cytoplasmic fragments noted in the background (Figure 3C). The cells cultured with Mal 50 µM were similar to the Unt 16 hours but with slightly greater pleomorphism and cellular degeneration characterized by mild cytoplasmic swelling, nuclear swelling, and karyolysis (Figure 3D). Lind 70 µM–cultured splenocytes had moderate pleomorphisms exhibiting features indicating cellular injury associated with cell death by necrosis: increased cytoplasmic volume and rarefaction along with nuclear swelling, indistinct nuclear margins and karyolysis, and changes associated with apoptosis: nuclear fragmentation (karyorrhexis) (Figure 3E). The PBO 55–µM cultured cells had marked pleomorphisms with the same cellular changes described in Lind 70 µM (Figure 3F). For the Unt 16 hours and the 3 single pesticide exposures, a scattering of lysed cells and occasional cytoplasmic fragments were observed in the background. Splenocytes cultures with Mal-Lind or Mal-PBO displayed marked pleomorphism; a majority of cells exhibited features of cellular injury similar to PBO, but apoptosis characteristics predominated: nuclear blebbing and karyorrhexis along with less common characteristics of necrosis, such as cell swelling, cytoplasmic vacuolation, and karyolysis (Figure 3G). Mal-PBO–treated splenocytes had greater numbers of lysed nucleated cells (Figure 3H).
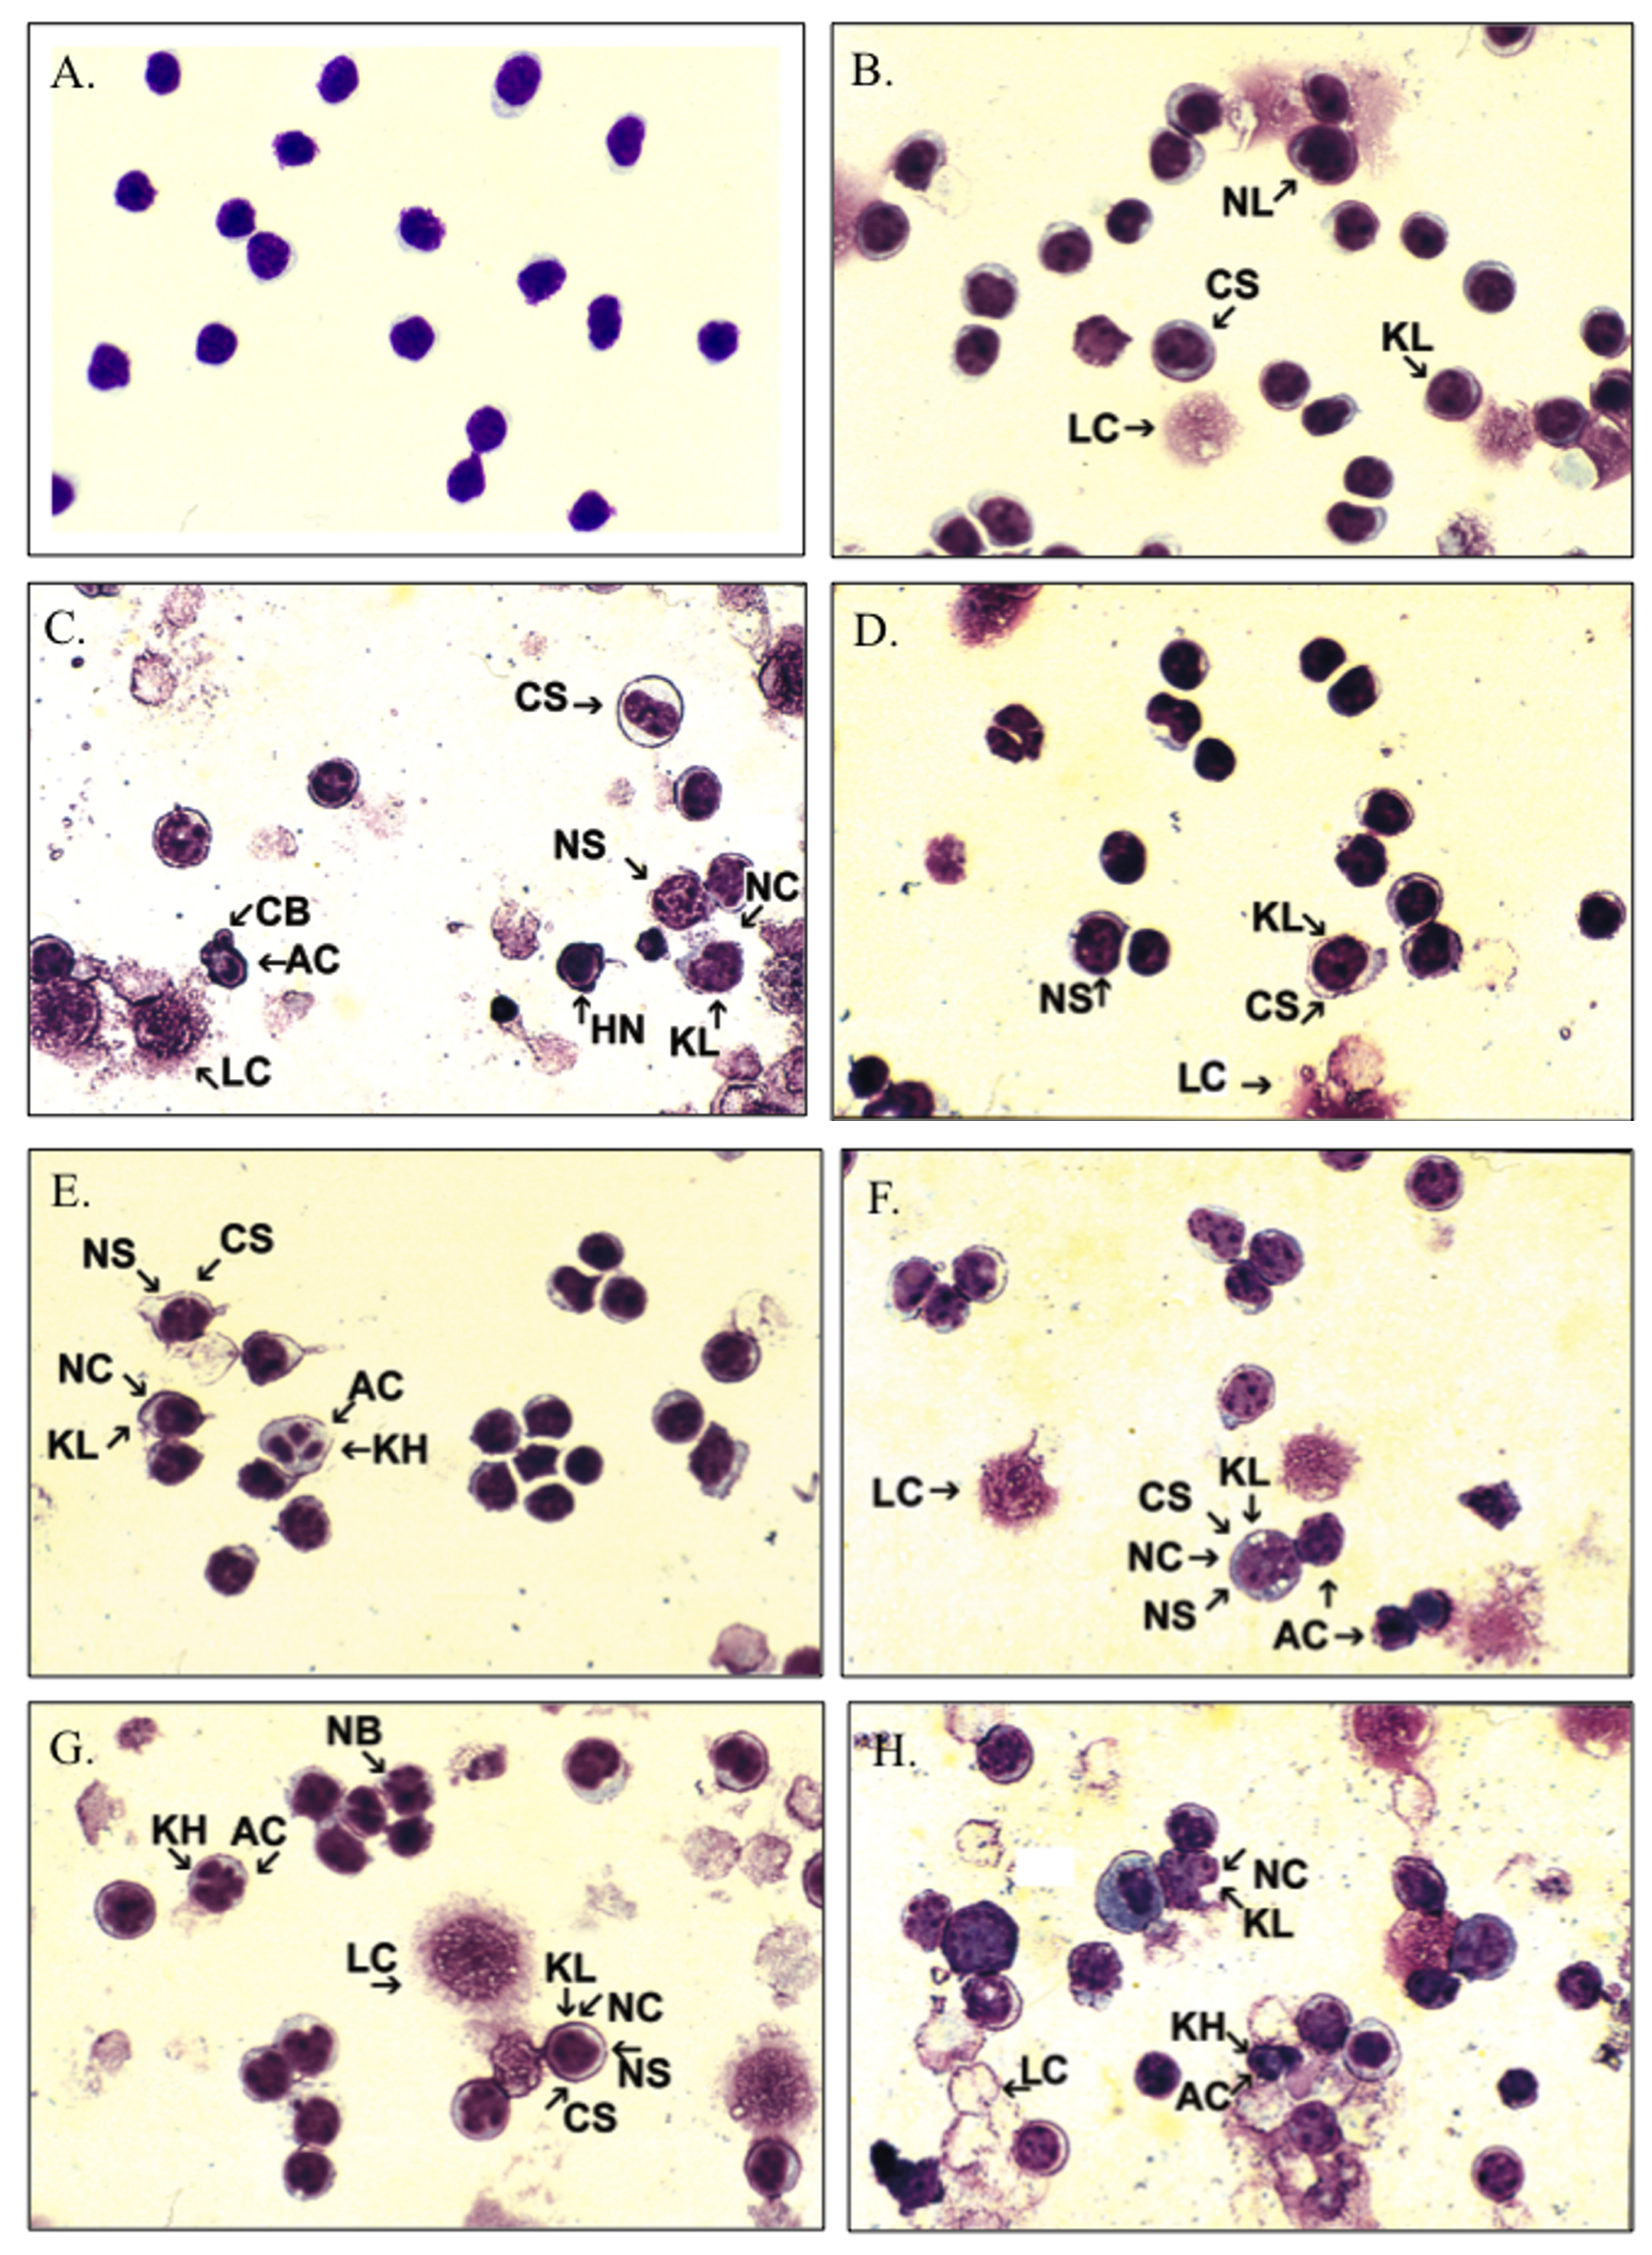
Representative cytology slides of splenic mononuclear cells from C57BL/6 mice. Cells were cytospined to slides, stained with modified Wright stain, and observed following (A) culture in media at 0 hours (Unt 0 hours), (B) culture in media at 16 hours (Unt 16 hours), (C) 16 hours of treatment with DEX 10 mg/mL, (D) 16 hours of treatment with Mal 50 µM, (E) 16 hours of treatment with Lind 70 µM, (F) 16 hours of treatment with PBO 55 µM, (G) 16 hours of treatment with Mal-Lind, and (H) 16 hours of treatment with Mal-PBO. AC, apoptotic cell; CB, cytoplasmic blebbing; CS, cell swelling, DEX, dexamethasone; HN, hyperchromatic nuclei; KH, karyorrhexis; KL, karyolysis; LC, lysed nucleated cell; Lind, lindane; Mal, malathion; NB, nuclear blebbing; NC, necrotic cell; NL, nuclear lobularity; NS, nuclear swelling; ×250, Wright’s stain; PBO, piperonyl butoxide; Unt, untreated.
Effects of Pesticides on DNA Fragmentation
DNA fragmentation, a hallmark of apoptosis, was examined using the DNA ladder assay and gel electrophoresis. DNA from splenocytes cultured in the presence of pesticides for 4 hours showed ladder bands, evident in all cases except the Unt 0 hours cell DNA (Figure 4). The samples treated with DEX 10 µg/mL, MAL-LIND, and MAL-PBO displayed vivid ladder formation. At 8 hours of treatment, the ladder bands for all samples increased in intensity compared with the 4-hour sampling, suggesting an increase in apoptosis with time (data not shown). At each time point, the Mal-Lind and Mal-PBO ladder band intensities were comparable to the ladder band intensity of DEX-treated cells. Smearing was also observed in several lanes, suggesting random cleavage of the DNA during sample preparation.
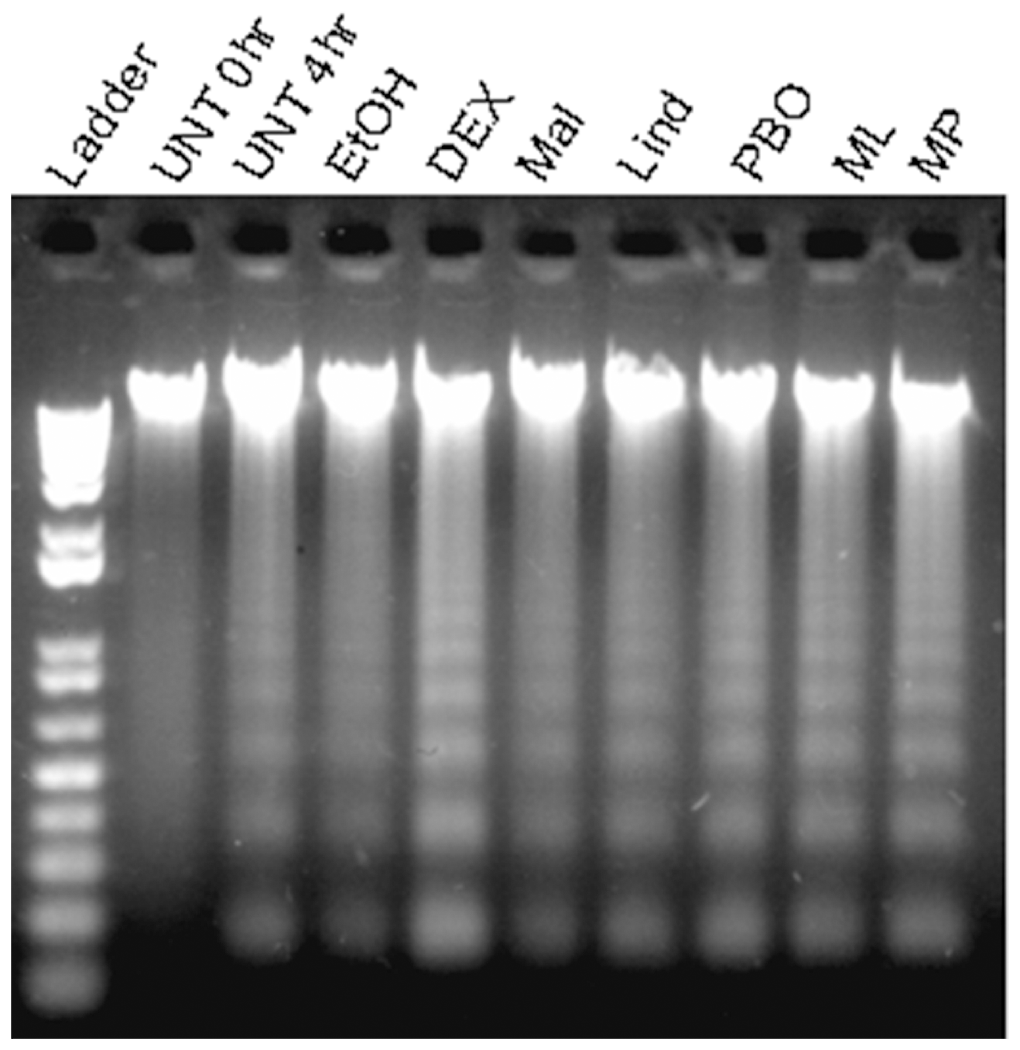
DNA ladder analysis of C57BL/6 murine splenocytes. Cells were treated for 4 hours with each pesticide or pesticide mixture. Treatments were untreated (Unt) 0 hours, Unt 4 hours, ethanol (EtOH) 0.3%, dexamethasone (DEX) 10 mg/mL, malathion (Mal) 50 µM, lindane (Lind) 70 µM, piperonyl butoxide (PBO) 55 µM, Mal-Lind, or Mal-PBO. All samples were run on a 1% agarose gel, stained with ethidium bromide, and observed for ladder or smearing.
Effect of Pesticides on Early Apoptotic Versus Necrotic Events
Flow cytometric analysis with 7-AAD was used to assess the percentage of early apoptotic and late apoptotic–necrotic cells in each treatment. The V-gate region was established using the 0-hour samples and identifying or gating on the area of highest cell concentration. This gate was monitored for each sample and was denoted as V gate (Table 1). Any shift in the forward scatter–side scatter positioning of the cells was identified, and a percentage was obtained as indicated (Table 1). The Unt population had the highest percentage of cells in the V gate after 16 hours of culture, whereas the Mal-Lind, Mal-PBO, and DEX populations typically had the least. The flow cytometry analysis measured 3 prominent staining intensities as dull, moderately stained, or brightly stained with 7-AAD. These intensities correspond to viable, early apoptotic, or late apoptotic–necrotic cell populations, respectively. The average percentage of cells corresponding to 7-AAD staining intensity was calculated (Table 1). The viable cell population was greatest in the Unt samples at 16 hours (52.4%) and least in the samples treated with Mal-Lind, Mal-PBO, and DEX. The viabilities of cells cultured in EtOH, Mal, Lind, PBO, Mal-Lind, Mal-PBO, and DEX averaged 0.1%, 7.4%, 15.9%, 14.7%, 21.8%, 27.4%, and 34.9% lower than the control, respectively. Early apoptotic cell populations significantly increased in the pesticide treatments `compared with Unt 16 hours. The average percentage observed in the Mal, Lind, PBO, Mal-Lind, and Mal-PBO treatments was 6.5%, 12%, 13.2%, 19.3%, and 23.4% greater than in Unt 16 hours, respectively. The late apoptotic–necrotic cell populations ranged from a minimum of 5.9% of the total cells in EtOH to a maximum of 9.0% in the Mal-PBO treatment. The percentage of late apoptotic–necrotic cells in the Mal-PBO treatment was significantly different from Unt, EtOH, Mal, Lind, PBO, and Mal-Lind.
Effect of Pesticide and Pesticide Mixtures on C57BL/6 Murine Splenocyte Cell Size and Granularity (V-Gate) and Viability via 7-Amino-Actinomycin D
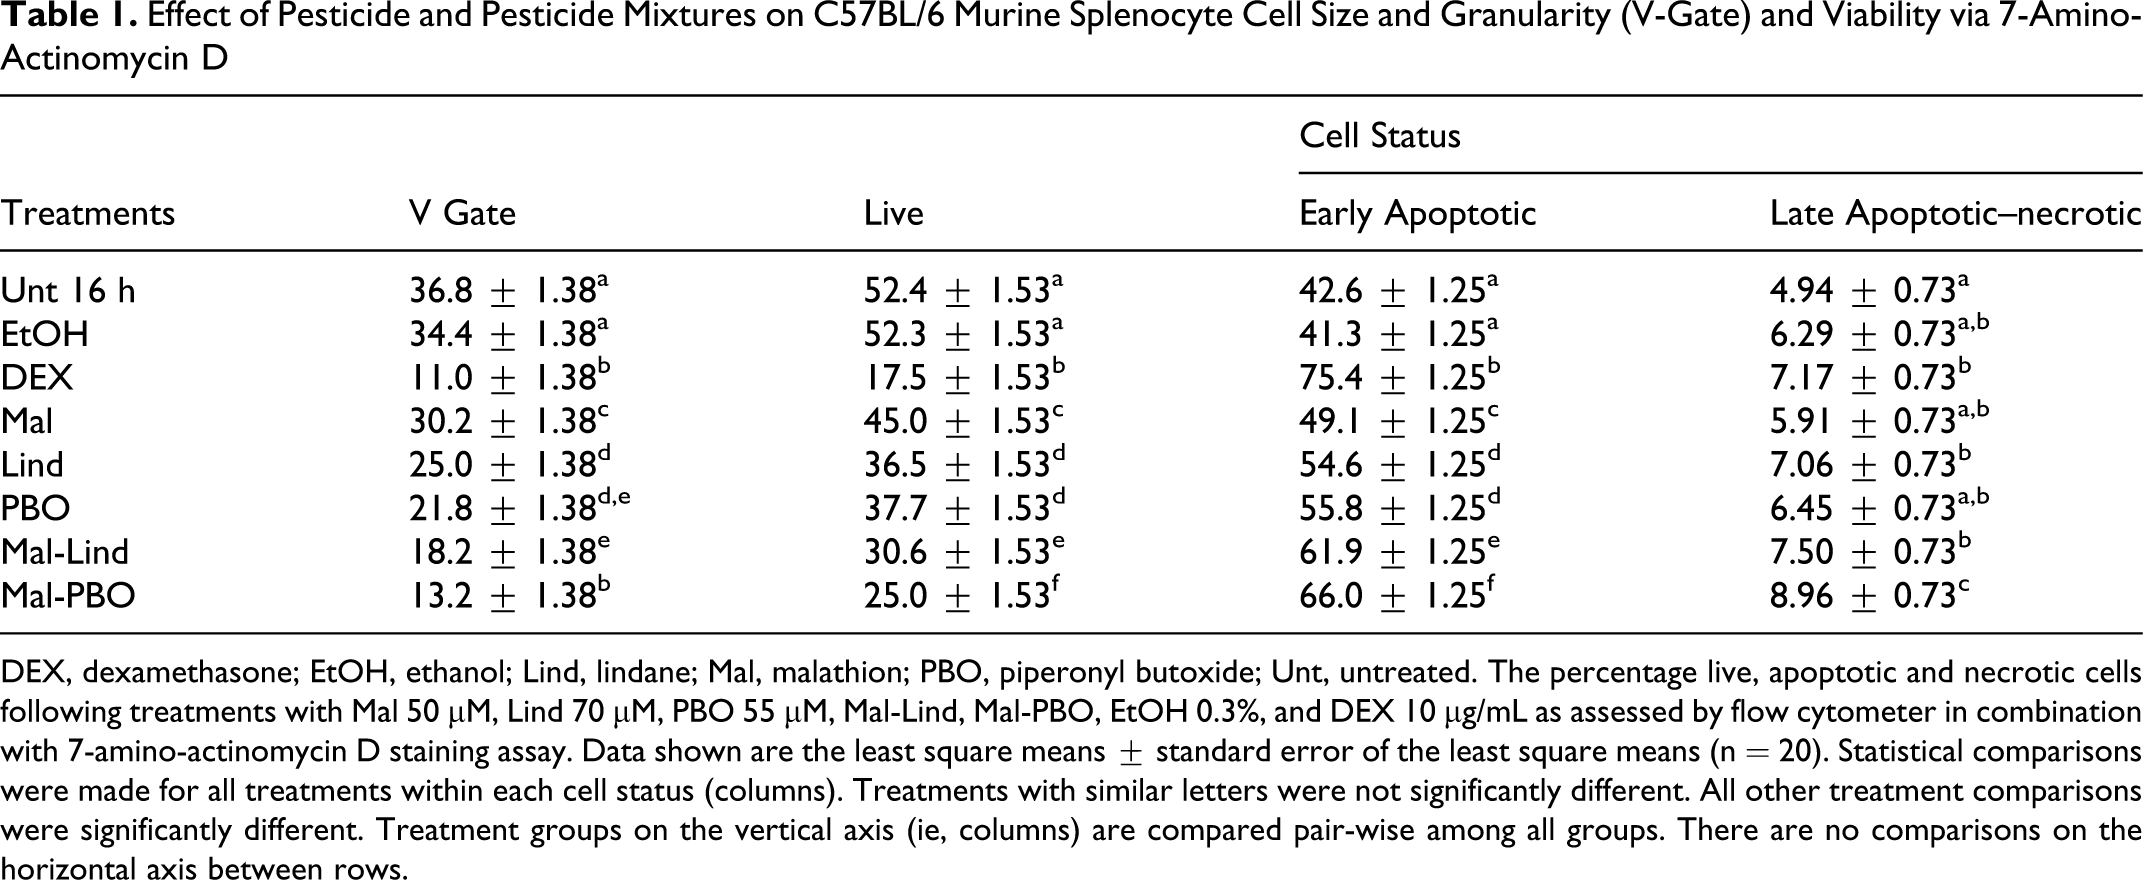
DEX, dexamethasone; EtOH, ethanol; Lind, lindane; Mal, malathion; PBO, piperonyl butoxide; Unt, untreated. The percentage live, apoptotic and necrotic cells following treatments with Mal 50 µM, Lind 70 µM, PBO 55 µM, Mal-Lind, Mal-PBO, EtOH 0.3%, and DEX 10 µg/mL as assessed by flow cytometer in combination with 7-amino-actinomycin D staining assay. Data shown are the least square means ± standard error of the least square means (n = 20). Statistical comparisons were made for all treatments within each cell status (columns). Treatments with similar letters were not significantly different. All other treatment comparisons were significantly different. Treatment groups on the vertical axis (ie, columns) are compared pair-wise among all groups. There are no comparisons on the horizontal axis between rows.
Effects of Pesticides on Splenocyte Subpopulations
Flow cytometric analysis using 7-AAD staining in combination with B-cell–specific (R-PE:CD45R/B220) and T-cell–specific (FITC:CD90.2) fluorescent-labeled monoclonal antibody staining was performed. Cells were sorted electronically, based on cell subset expression of FITC or R-PE positive antigens, and then again for 7-AAD staining intensity (Dullviable, Moderateearly apoptotic and Brightlate apoptotic–necrotic) in the resulting B (R-PE +) and T (FITC +) cell populations, which were statistically compared for each treatment. The incidence of viable, early apoptotic and late apoptotic–necrotic B cells and T cells is summarized in (Figure 5).
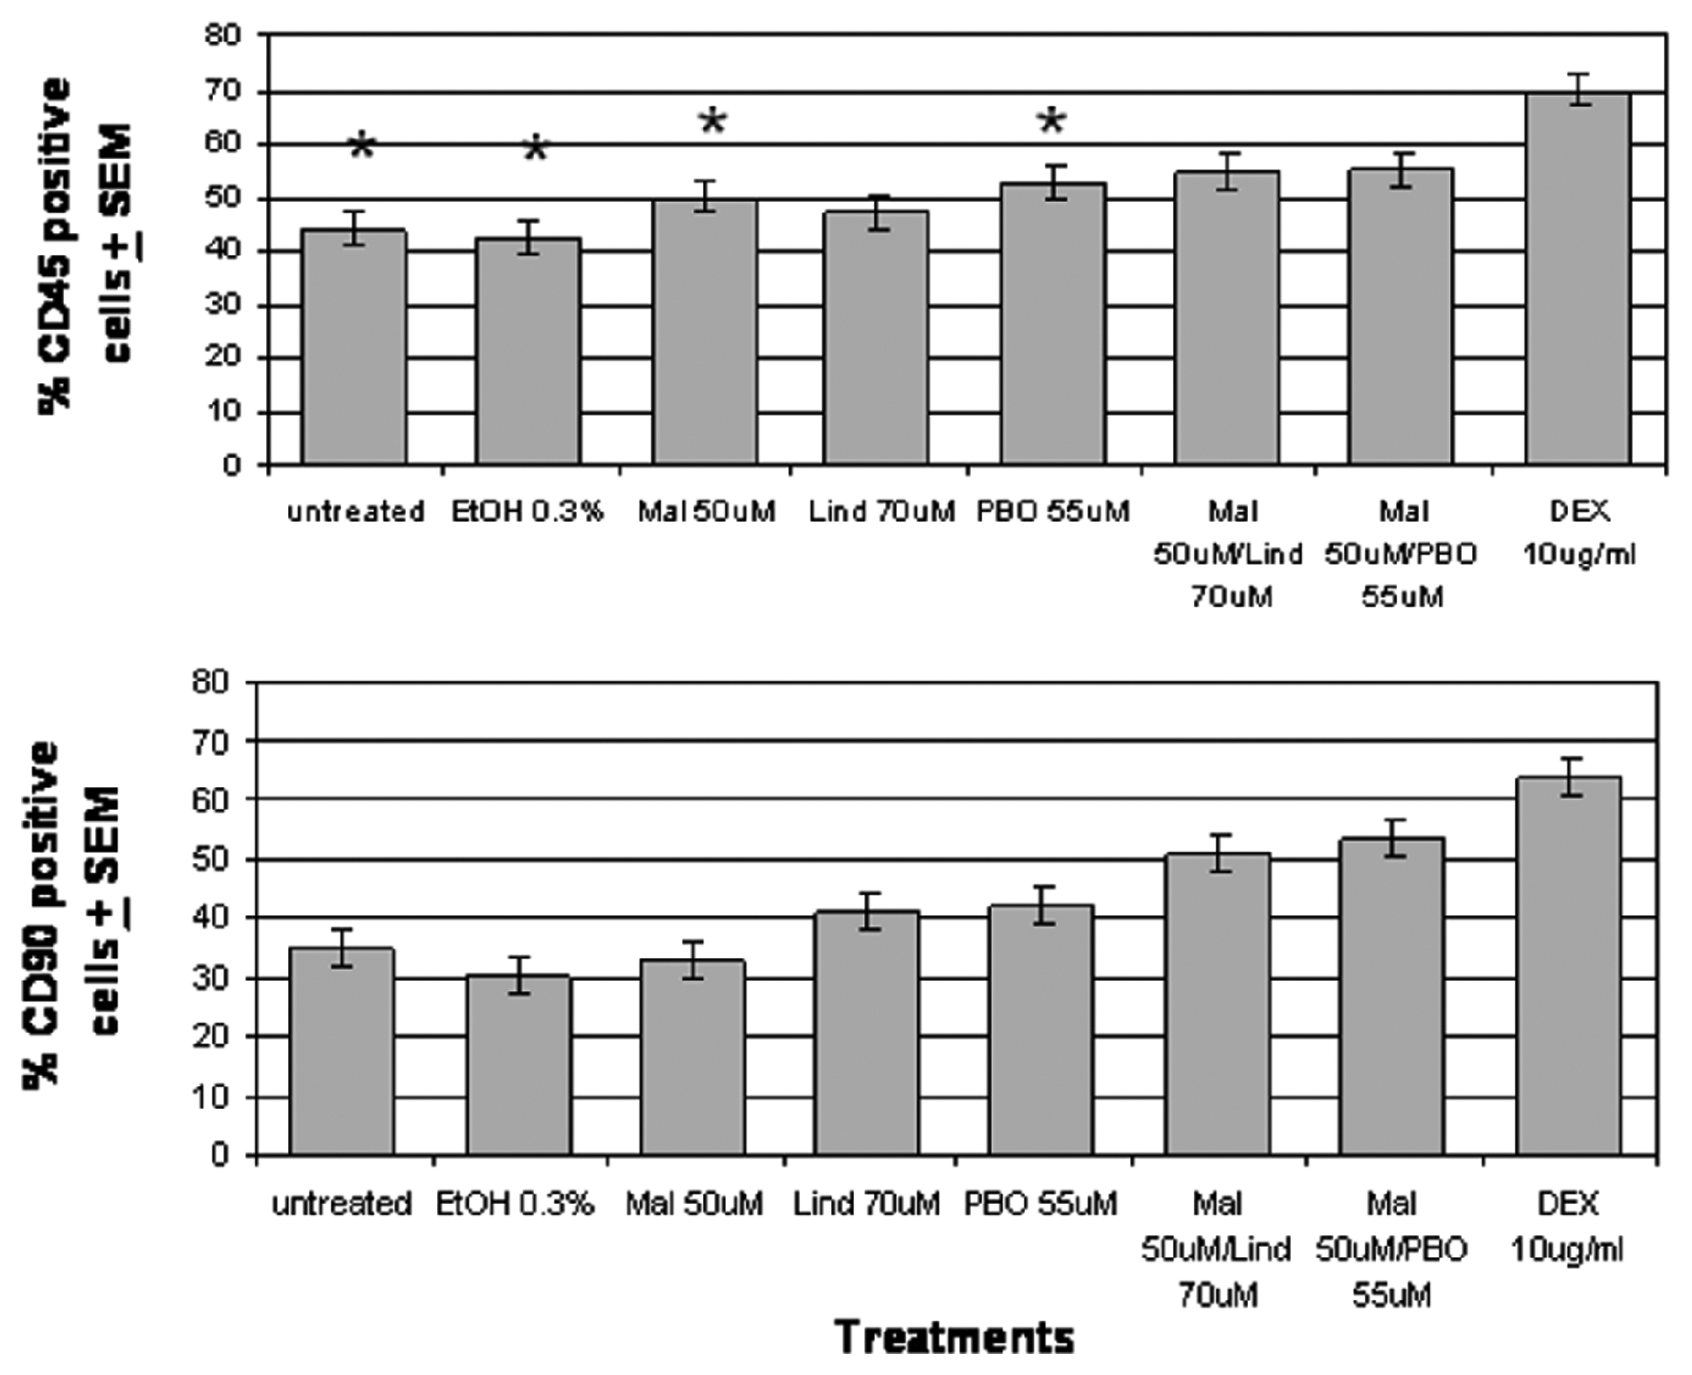
7-AAD staining of C57BL/6 murine splenocyte B-cell and T-cell subpopulations. Cells were treated with each pesticide or pesticide mixture for 16 hours. Subpopulations and samples labeled with T- or B-cell–specific antibodies were stained with 7-amino-actinomycin D. The percentage of early apoptotic T cells (CD90.2 positive) and B cells (CD45R/B220 positive) in each sample was measured using flow cytometry. Each value represents the percentage least square means (LSM) ± standard error of the LSM (SEM) (n = 14). *P < .05, significantly different levels of apoptosis from T-cell population. EtOH, ethanol; Mal, malathion; Lind, lindane; PBO, piperonyl butoxide; DEX, dexamethasone.
Table 2 summarizes the percentages of viable, early apoptotic, and late apoptotic–necrotic cell populations for B cells and T cells. In the Unt 16-hour sample, 46.4% of B cells were viable. All other treatments, particularly the pesticide mixtures, resulted in reduced B-cell viability compared with control. The viabilities of cells cultured in EtOH, Mal, Lind, PBO, Mal-Lind, Mal-PBO, and DEX averaged 2.2%, 9.6%, 12.5%, 16.2%, 18.4%, 20.2%, and 30.5% less than Unt 16 hours, respectively. The Unt 16-hour sample also had the lowest percentage of early apoptotic B cells, 44%, a value that increased significantly in all treatment groups compared with Unt 16 hours, with the exception of EtOH. The early apoptotic cells in Mal, Lind, PBO, Mal-Lind, Mal-PBO, and DEX averaged 6.0%, 3.0%, 8.7%, 10.7%, 10.9%, and 26% greater than the Unt 16 hours, respectively. Lind and Mal-PBO had the largest amount of late apoptotic–necrotic B cells with 19.0% and 18.9%, respectively. Unt 16 hours had the lowest level with 9.5%. Statistical significance of Mal compared with either pesticide mixture was observed. No other treatment comparisons between Lind, PBO, Mal-Lind, and Mal-PBO were statistically significant.
Effect of Pesticide and Pesticide Mixtures on C57BL/6 Murine Splenocyte B-Cell (R-Phycoerythourin–CD45R/B220 Positive) and T-Cell (Fluorescein-Isothiocyanate–CD90.2 Positive) Viability and Apoptosis via 7-Amino-Actinomycin D
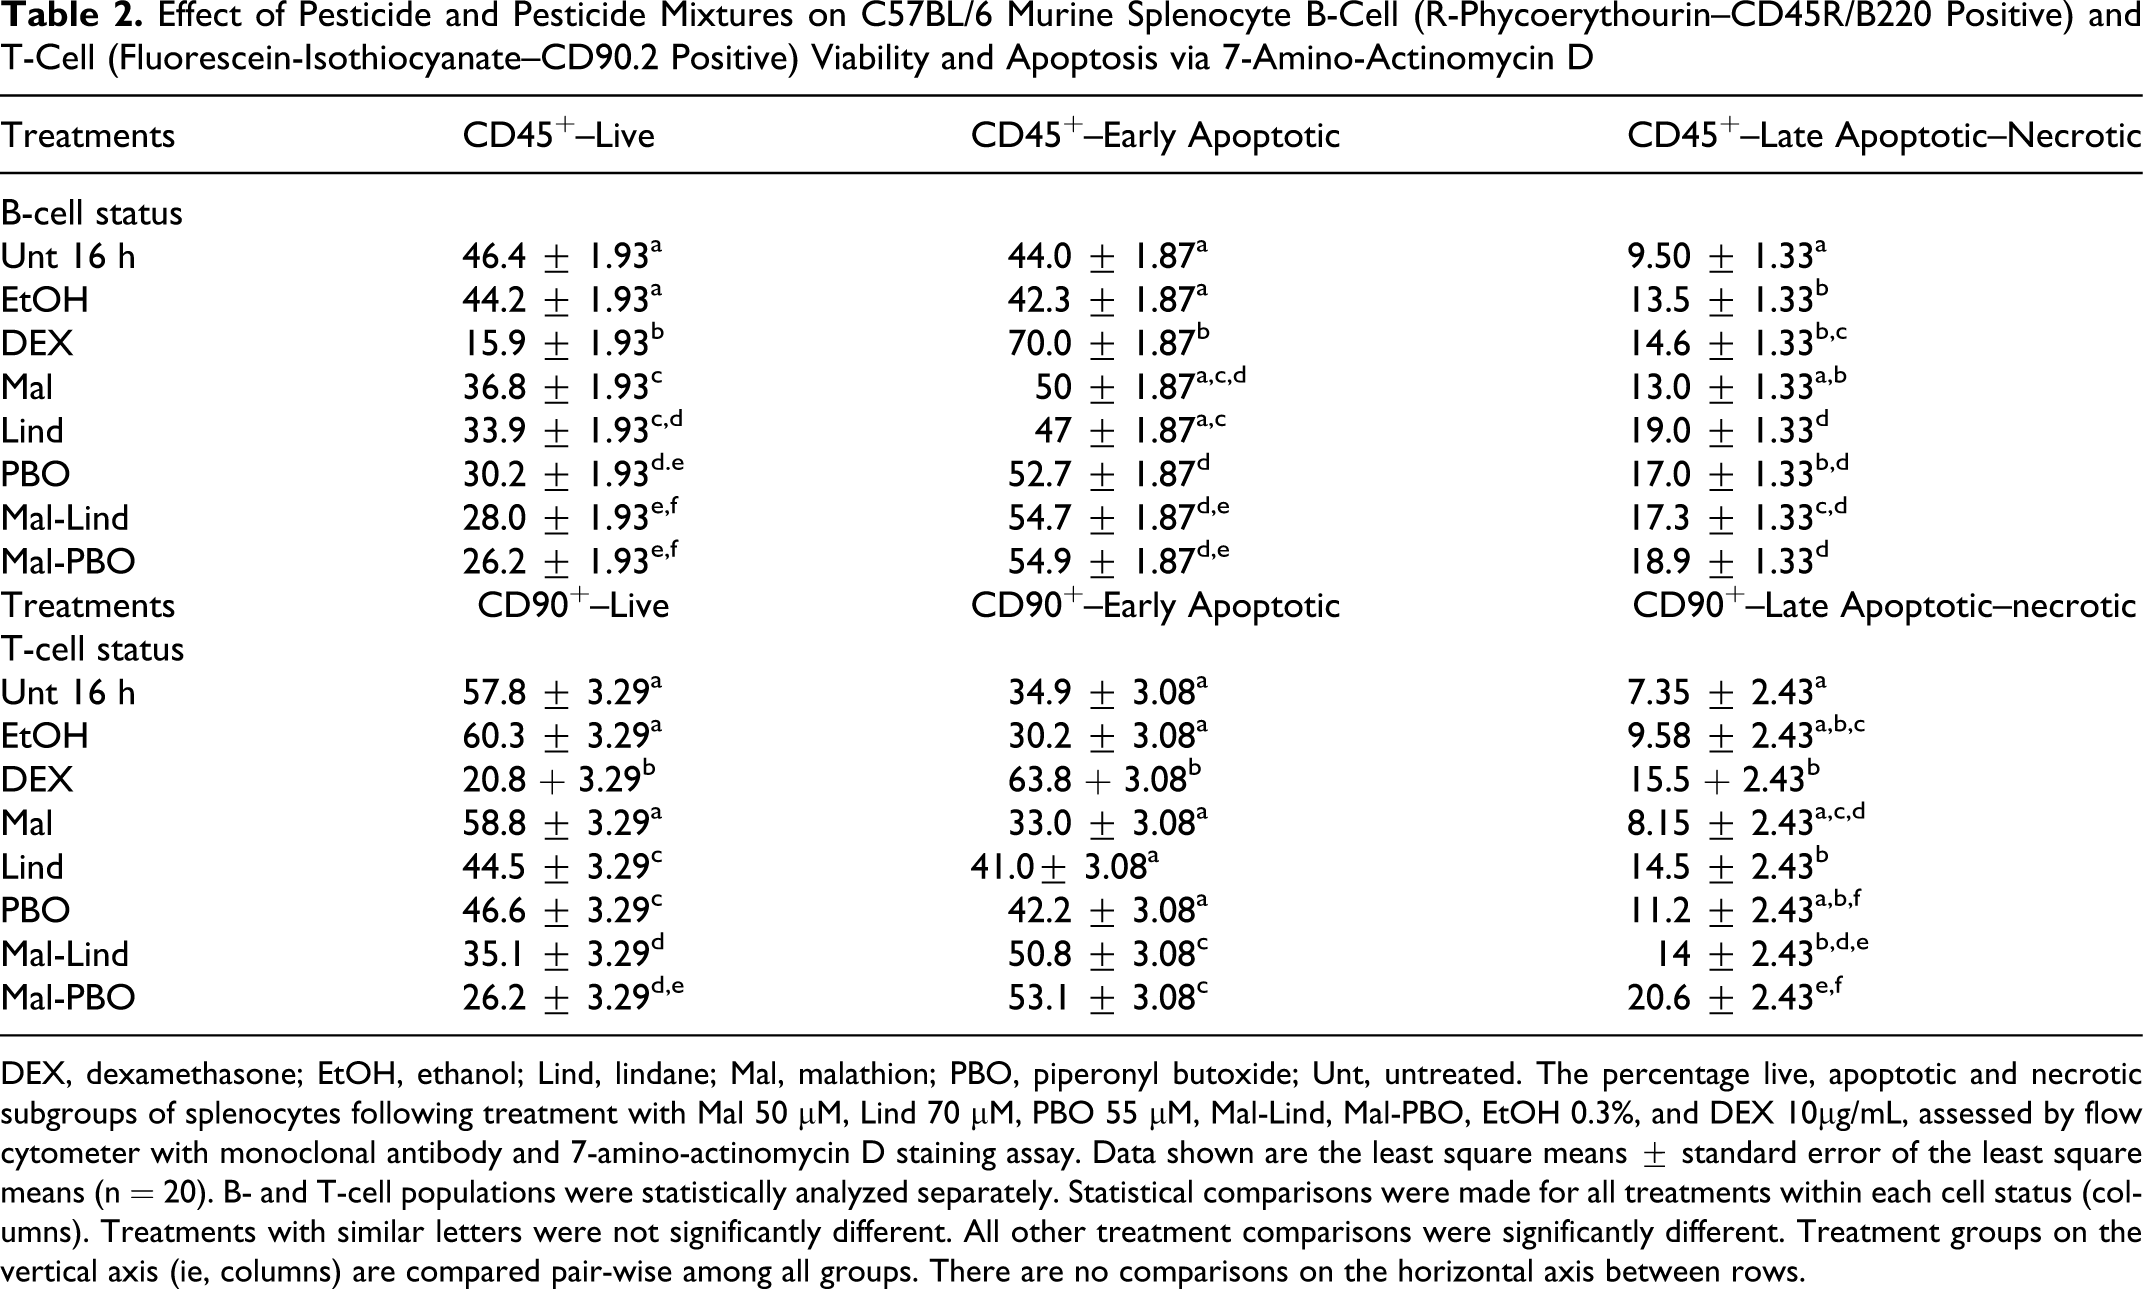
DEX, dexamethasone; EtOH, ethanol; Lind, lindane; Mal, malathion; PBO, piperonyl butoxide; Unt, untreated. The percentage live, apoptotic and necrotic subgroups of splenocytes following treatment with Mal 50 µM, Lind 70 µM, PBO 55 µM, Mal-Lind, Mal-PBO, EtOH 0.3%, and DEX 10µg/mL, assessed by flow cytometer with monoclonal antibody and 7-amino-actinomycin D staining assay. Data shown are the least square means ± standard error of the least square means (n = 20). B- and T-cell populations were statistically analyzed separately. Statistical comparisons were made for all treatments within each cell status (columns). Treatments with similar letters were not significantly different. All other treatment comparisons were significantly different. Treatment groups on the vertical axis (ie, columns) are compared pair-wise among all groups. There are no comparisons on the horizontal axis between rows.
In the Unt 16-hour sample, 57.8% of T cells were viable (Table 2). All other treatments, except Mal and EtOH, had reduced T-cell viability compared with the Unt 16-hour control. The viability in Lind, PBO, Mal-Lind, Mal-PBO, and DEX averaged 13.3%, 11.2%, 22.7%, and 31.6% lower than the Unt 16-hour control, respectively. Similar to the viability, the early apoptotic cell population for Mal and EtOH did not significantly increase; however, all other treatments had increased early apoptotic populations compared with control. As with the B cells, the amount of early apoptotic cells was greatest in the Mal-Lind, Mal-PBO, and DEX treatments. The early apoptotic population in Lind, PBO, Mal-Lind, Mal-PBO, and DEX averaged 6.1%, 7.3%, 15.9%, 18.2%, and 28.4% greater than control, respectively. The individual pesticide treatments were statistically different from the pesticide mixtures with respect to live and early apoptotic cell populations. The Mal-PBO treatment resulted in 20.6% of the total T-cell population being late apoptotic–necrotic, whereas Unt 16 hours had 7.35%. There were no significant differences between the pesticide mixtures and either of the 2 individual pesticides used in their formulation for the percentage of cells undergoing late apoptotic–necrotic events.
Discussion
The widespread use and persistence of pesticides in the environment have made it necessary to evaluate the potential toxicity associated with pesticide mixtures, particularly in non–target organ systems, such as the immune system. 4 Thus, an understanding of the potential adverse health effects associated with low-level pesticide (particularly pesticide mixtures) exposures is urgently needed. This study was designed to increase understanding in these 2 areas by examining pesticide toxicity to a typical non–target organ system in vitro, that is, splenic immune cells, and by exploring the potential certain pesticides have to interact in simple mixtures, at low concentrations.
A linear dose-response relationship was observed for the pesticides examined, demonstrating that increased concentrations resulted in enhanced splenocyte toxicity (Figure 1). The time response studies, using the LC25 or greater concentration selected for each pesticide, indicated that 16 hours of culture was sufficient to observe a toxic effect on primary splenic immune cells (Figure 2). The selection of incubation time was a critical factor in toxicity assessments, because the viability of primary cells decreases with culture time. Previous studies using mouse immune cells in vitro used a similar incubation time. 35,36 Once exposure time and concentration were determined, the pesticides were introduced in simple mixtures. An additive increase in cytotoxicity inflicted by each (Mal-Lind and Mal-PBO) mixture, compared with the corresponding individual pesticide, was observed. This study provides new insight into understanding how certain pesticide mixtures affect splenic immune cell survival under acute exposure conditions. Throughout this study, the vehicle used was 0.3% ethanol, which notably had no statistically significant effect on cell viability as compared with Unt control (P > .05).
Three assays were performed to determine whether enhanced cytotoxicity by the pesticide mixtures was affected via apoptosis or necrosis. Each assay identified a different morphological, biochemical, or physiological aspect of cell death. Cytologic identification of the morphological changes associated with necrotic or apoptotic cells using light microscopy was the first method used (Figure 3). Typically, apoptotic cells are identified by characteristic pleomorphism cells, nuclear chromatin condensation, karyorrhexis, nuclear and membrane blebbing, cell shrinkage, and apoptotic body formation. Necrotic cells are identified by the presence of pleomorphic cells, increased cytoplasmic volume or cell swelling, indistinct nuclear margins, nuclear swelling, karyorrhexis, and karyolysis. 16 In this study, low to moderate percentages of apoptotic cells were observed in the individual pesticide treated cultures following 16-hour exposures (Figure 3A-D). Induction of apoptosis, as well as low levels of necrosis, was observed upon pesticide mixture treatment. Mal-Lind treatment resulted in a moderate to high proportion of apoptotic cells, whereas Mal-PBO–treated cultures had high percentages of both apoptotic and necrotic cells (Figure 3E-H). The presence of both necrosis and apoptosis as a result of chemical insult is not a new phenomenon. For instance, a number of hepatotoxins have been noted to similarly induce apoptosis and necrosis simultaneously in vivo. Thus, it is possible that the same effect is occurring with these immunotoxicants in vitro, and therefore it appears that the 2 events are not entirely separate. However, an increase in apoptosis is suggestive of cell signaling alterations or modulation of other cell control mechanisms as a result of pesticide mixture exposure. The morphology of cells treated with either pesticide mixture was similar to that observed upon DEX treatment, a positive control for apoptosis. 30 At the time the cell suspensions were seeded in culture, there was no indication of cell death or debris. Unt 16-hour cultured cells showed modest levels of cell debris typical of a primary cell line. Studies by others have shown that when mature, primary immune cells are placed in culture, a percentage of cells will undergo spontaneous apoptosis. 35,36 In addition, attributing the cell debris to loss of cells via apoptosis seems feasible because other cells appear unaffected, suggesting that the mode of cell death is not necrotic, because ensuing lyses would inflict additional injury to surrounding cells.
The DNA ladder assay assesses biochemical changes associated with apoptosis and is a qualitative assay used to show the presence of apoptosis in cells. Numerous reports have shown that during apoptosis, nuclear DNA is nonrandomly cleaved into 180 to 200 base pair units, which, upon electrophoresis in an agarose gel, are detectable as a DNA ladder. 16,37 Interestingly, when samples were incubated with pesticides for as little as 4 hours, laddering was observed in the pesticide-treated samples, particularly in the PBO, Mal-Lind, and Mal-PBO treatments (Figure 4). DEX also had an intense laddering effect, verifying its efficacy as an inducer of apoptosis. DNA fragmentation has been suggested to be one of the first irreversible events triggering mature immune cell apoptosis. 38,39 This would explain the earlier detection of laddering compared with other markers, which appeared much later in the treatment. It may even be inferred that DNA fragmentation triggers the onset of other apoptotic mechanisms in the cells, an aspect that has yet to be examined. 39,40 There was some degree of DNA smearing in all samples, suggestive of necrotic cellular events such as random DNA cleavage. The intensity of the smearing increased over time, indicating that the presence of necrotic cells in culture was consistent with the cytologic observations.
The staining of splenocytes with 7-AAD facilitated the monitoring of shifts in the forward scatter–side scatter positioning of the cells during flow cytometric analysis. Freshly collected cell suspensions designated as Unt 0-hour samples were used to set baseline gate. This region was designated as V gate. The concentration of cells remaining in this gate after a given chemical treatment was compared with Unt 0 hours and was used as an indicator of potential cell injury. All treatments, compared with Unt 0 hours, showed a decreased percentage of cells in the V-gate region. Mal-Lind, Mal-PBO, and DEX had the least amount of cells in the V gate following 16 hours of treatment, suggestive of decreased cell viability (Table 1). The cells were stained with 7-AAD, allowing for quantitative evaluation of early apoptotic cell populations within the V-gate region. 30 The principle of the 7-AAD assay is that staining intensity reflects the loss of membrane integrity. Because early apoptotic cells have more membrane integrity than late apoptotic–necrotic cells, the staining intensities should vary for these 2 populations. Dully stained cells are considered viable, moderately stained cells are considered early apoptotic, and brightly stained cells are considered late apoptotic–necrotic. An additive effect on the number of apoptotic cells observed upon exposure to the pesticide mixtures compared with the individual pesticide treatments was observed, suggesting there is limited or no interaction between these chemicals when placed in mixture. In addition, the significant level of early apoptosis observed in the Unt 16-hour samples supports the previously mentioned idea that it is not unusual for a certain level of spontaneous apoptosis to occur. 35,36 Last, the level of late apoptotic–necrotic cells never exceeded 9%, indicating only a small amount of cells were late apoptotic–necrotic in any given treatment. The low percentage of cells in this category was a direct intent of the study design. Low concentrations of each individual pesticide were selected to minimize cellular toxicity, allowing for the assessment of the combined effects of the 2 pesticides as mixtures.
Because the enriched splenic fraction is composed primarily of B and T cells, which are important in immune function, it was of interest to examine whether either subset had a greater sensitivity to these pesticides or pesticide mixtures. We unexpectedly observed a higher percentage of early apoptotic events in the Unt B cells compared with the Unt T cells at 16 hours (Table 2). However, when these lymphocyte cell subsets were evaluated across all of the pesticide exposures and compared with the Unt 16-hour groups, the percentages of both B cells and T cells in early apoptosis were increased. When the percentages of early apoptotic cells for Unt 16 hours were subtracted from each pesticide treatment and compared with the T-cell subsets, the relative percentage of pesticide cultured T cells and B cells undergoing apoptosis showed similar trends. Lind, PBO, and DEX treatments induced the same level of apoptosis in both B- and T-cell types. Furthermore, in the B cells and T cells, the percentage of late apoptotic–necrotic cells (Table 2) increased to almost twice what was seen in the 7-AAD–only results for the same category (Table 1). This would suggest that B and T cells are the more sensitive cell subsets to pesticide treatments, because the total population of splenocytes had far lower percentages of late apoptotic–necrotic cells in the 7-AAD study.
The consistency observed between each of the parameters measured allows us to confidently conclude that these pesticides and pesticide mixtures, at LC15-25, induced apoptosis in murine splenocytes in vitro. Because apoptotic events are very rapid and often occur simultaneously with necrotic events, observations of both forms of cell death were not surprising. 40 Other investigators have reported similar findings. For instance, Mal-induced apoptosis in a neuroblastoma cell line and Lind-induced apoptosis in fish splenic immune cells have been documented. 41,42 Olgun et al 14 reported similar events in thymocytes treated in vitro with Mal, Lind, and permethrin. The additive effect of the pesticide mixtures Mal-Lind and Mal-PBO on inducing a higher percentage of apoptotic events was also a critical finding, in that it suggested there was no measure of chemical interaction between the pesticides in these mixtures. Because limited data are available regarding the effects of pesticide mixtures on splenocytes or other immune cells, it is difficult to assess the impact of our findings on other exposure scenarios or the potential of these mixtures to induce other apoptotic mechanisms. 20 Preliminary studies have been conducted to examine the pro-oxidant and antioxidant status of splenocytes treated with these pesticides and pesticide mixtures prior to and during the induction of apoptosis. Oxidative stress has been implicated in both chemical metabolism and apoptosis, and measuring indices within immune cell types may offer insight into the influence of oxidative status on immunotoxicity. 43
The potential exposure to the pesticides in this study, either singly or in mixture, is indeed likely due to their common and frequent household uses. Following the treatment of lice, scabies, or mites, lindane and PBO contaminate wastewater. The half-life for lindane is 400 or more days and that of PBO is a minimum of 79 days, enabling both to be available for weeks and months after entering the environment. 23,44 Although malathion is more temperature- and light-sensitive and has a half-life shorter than 6 days, it is often distributed farther from the point of application because aerosolization and can result in exposure after the fact. This information combined with the fact that all 3 chemicals are commonly used treatments for lice emphasizes the high probability an individual undergoing treatment could be exposed to a mixture of these pesticides, even sequentially, is a likely scenario.
Our results showed that Mal, Lind, PBO, and mixtures of Mal-Lind and Mal-PBO induced apoptotic splenocyte cytotoxicity in vitro. The pesticide mixtures Mal-Lind and Mal-PBO induced an additive increase in cytotoxicity compared with the corresponding individual treatments. Although small percentages of necrotic cells were observed in most pesticide treatment groups, our data suggest that apoptosis was the primary mode of cell death.