
Abstract
The constitutive androstane receptor (CAR) is essential for Cyp2b induction, liver hypertrophy, and hepatocarcinogenesis in response to phenobarbital (PB). Liver hypertrophy with Cyp2b induction is a major mode of action of hepatocarcinogenesis in rodents. However, it remains unclear whether CAR is involved in the response to many other nongenotoxic hepatocarcinogens besides PB. In this study, we investigated CAR involvement in liver hypertrophy and hepatocarcinogenesis of Cyp2b-inducing nongenotoxic hepatocarcinogens, piperonyl butoxide (PBO), and decabromodiphenyl ether (DBDE), using wild-type and CAR knockout (CARKO) male mice. PB was used as the positive control. In the wild-type mice, 4-week treatment with PBO, DBDE, or PB induced hepatocellular hypertrophy with increased Cyp2b10 messenger RNA and Cyp2b protein expression. In CARKO mice, only PBO showed liver hypertrophy with Cyp2b10 and Cyp3a11 induction. After 27-week treatment following diethylnitrosamine initiation, PBO and PB generated many eosinophilic altered foci/adenomas in wild-type mice; however, the lesions were far less frequent in CARKO mice. DBDE increased the multiplicity of basophilic altered foci/adenomas in wild-type and CARKO mice. Our findings indicate that murine CAR plays major roles in hepatocarcinogenesis but not in liver hypertrophy of PBO. DBDE may act via CAR-independent pathways during hepatocarcinogenesis.
Introduction
Constitutive androstane receptor (CAR; NR1I3) is a nuclear receptor that plays critical roles in regulating enzymes involved in xenobiotic metabolism, such as members of the cytochrome P450 (CYP) family (Ueda et al. 2002), sulfotransferases, uridine diphospho-glucuronosyltransferases (Chen et al. 2007; Sugatani et al. 2001), and various transporters (Assem et al. 2004).
Phenobarbital (PB) induces liver hypertrophy accompanied by the induction of certain drug metabolic enzymes such as various CYPs (particularly Cyp2b), stimulation of cell proliferation activity, and inhibition of apoptosis. Moreover, long-term treatment with PB promotes liver tumorigenesis in rodents (Whysner, Ross, and Williams 1996). However, in CAR knockout (CARKO) mice, PB does not induce Cyp2b, liver hypertrophy, or liver tumorigenesis, clearly indicating that CAR is essential for PB-inducible liver hypertrophy in mice (Wei et al. 2000; Yamamoto et al. 2004).
PB has been widely used therapeutically as an antiepileptic drug in humans for a long time; yet, extensive epidemiological investigations of patients receiving pharmacologically active doses of PB have not shown any significant elevation of liver tumors (International Agency for Research on Cancer 2001; Lamminpää et al. 2002). These findings suggest the possibility that hepatocarcinogenesis induced by PB is specific to rodents. Recently, it was reported that humanized CAR and humanized pregnane X receptor (PXR) double mutant mice briefly treated with PB showed liver hypertrophy with Cyp2b induction but did not show any increase in cell proliferation activity (Ross et al. 2010), suggesting that CAR is involved in the difference of susceptibility in the hepatocarcinogenic potential of PB between rodent and human. However, the long-term effects of PB on hepatocarcinogenesis using this double mutant model have not been elucidated. In addition to PB, carcinogenicity studies have shown that many other nongenotoxic chemicals induce liver tumors in rodents, particularly in mice, and it is always necessary to consider the significance of rodent liver tumors in relation to the assessment of human cancer risk (Cohen et al. 2004; Holsapple et al. 2006).
Over the last two decades, a mode of action (MOA) framework for chemical carcinogenesis in rodents has been developed through the International Life Sciences Institute (ILSI), the U.S. Environmental Protection Agency, and the International Programme on Chemical Safety (Sonich-Mullin et al. 2001). Further work conducted by the ILSI Risk Science Institute determined how MOA studies could be used to establish the relevance of rodent tumors to humans (Cohen et al. 2003, 2004; Meek et al. 2003). After that, the MOA for hepatocarcinogenesis in rodents treated with PB-like chemicals was established at the 2005 Society of Toxicology annual meeting (Holsapple et al. 2006). The MOA is characterized by several key events such as the induction of Cyp2b, enhanced cell proliferation, inhibition of apoptosis, hypertrophy, and development of altered hepatic foci. If test compounds with hepatocarcinogenic potential in rodents have robust data for a PB-like MOA, then it can be concluded that their carcinogenic responses are not human relevant (Holsapple et al. 2006). Nevertheless, MOA analysis has not been performed for all PB-like chemicals that have been known to induce Cyp2b, liver hypertrophy, and liver tumorigenesis in rodents. Furthermore, clear evidence of CAR dependency for key events in the promotion of liver tumorigenesis has only been provided for a few “PB-like” chemicals (Deguchi et al. 2009; Osimitz and Lake 2009; Peffer et al. 2007). In addition, the essential pathways for hepatocarcinogenesis induced by CAR activators remain unknown in rodents despite recent intensive studies (Blanco-Bose et al. 2008; Phillips et al. 2007).
Piperonyl butoxide (PBO, a pesticide synergist) and decabromodiphenyl ether (DBDE, a brominated flame retardant) are Cyp2b inducers and have been reported to induce liver hypertrophy and to have nongenotoxic hepatocarcinogenic potential in rats and mice (Fujitani et al. 1993; National Toxicology Program [NTP] 1986; Takahashi et al. 1997; Van der Ven et al. 2008). However, the involvement of CAR in their effects on the liver has not been determined. Hence, in this study, we investigate the role of CAR in PBO- or DBDE-inducible liver hypertrophy and liver tumor using CARKO mice. PB-induced hypertrophy and liver tumor development are used as positive controls for CAR-mediated effects. The CARKO mice, derived from the C3H strain in which spontaneous liver tumors occur frequently, are useful for determining whether CAR is involved in the mechanism of liver hypertrophy or hepatocarcinogenesis promoted by a certain chemical.
Materials and Methods
Test Substances
DBDE (CAS No.1163-19-5, purity 98%), PBO (CAS No. 51-03-6, purity >90%), and PB sodium (PB, CAS No. 57-30-7, purity 98%) were purchased from Wako Pure Chemical Industries Ltd. (Osaka, Japan).
Animals
C3H/HeNCrl background CARKO mice were courteously provided by Dr. M. Negishi, National Institute of Environmental Health Sciences, NC (Kodama et al. 2004; Yamamoto et al. 2004). C3H/HeNCrlCrlj mice were purchased from Charles River Laboratories Japan Inc. (Kanagawa, Japan) and used as wild-type mice in the present study. All protocols were approved by the Animal Care and Utilization Committee of the National Institute of Health Sciences, and all studies followed the guidelines for the use of laboratory animals of the National Institute of Health Sciences.
Experimental Procedures
Experiment 1 (Exp. 1) was conducted to clarify the roles of CAR in mouse liver hypertrophy and inductions of liver metabolism enzyme induced by test chemicals in a 4-week feeding study. Experiment 2 (Exp. 2) was performed to investigate the early effects of test chemicals on hepatocyte proliferations in wild-type and CARKO mice in a 1-week feeding study. In both Exps. 1 and 2, 6-week-old male wild-type and CARKO mice were divided into 4 groups consisting of 5 mice per group for each genotype. The wild-type and CARKO mice in the control group were fed a basal diet (powdered CRF-1, Oriental Yeast Co., Ltd., Tokyo, Japan). The wild-type and CARKO mice in the treated groups were given PBO (5,000 ppm), DBDE (50,000 ppm), and PB (500 ppm) in the basal diet ad libitum for 4 weeks in Exp. 1 and for 1 week in Exp. 2. The selected doses were found sufficient to induce liver hypertrophy and liver tumorigenesis (Fujitani et al. 1993; NTP 1986; Takahashi et al. 1997; Yamamoto et al. 2004).
Experiment 3 (Exp. 3) was carried out to investigate the roles of CAR in mouse hepatocarcinogenesis pathways in accordance with a standard protocol for tumor initiation and promotion (Diwan et al. 1986). All mice were administered a single intraperitoneal injection of 90 mg/kg body weight diethylnitrosamine (DEN) at 5 weeks of age. One week after DEN initiation, 20 wild-type mice/group and 21 to 24 CARKO mice/group were fed PBO, DBDE, or PB in basal diet at the same doses as those in Exp. 1 for 27 weeks. A few animals per group in both genotypes died due to fighting during the treatment period. The surviving animals at termination were evaluated.
All mice of the 3 experiments were examined daily for their clinical condition. Body weight and food intake were measured throughout all three experiments. At the termination of each experiment, all surviving mice were euthanized under deep carbon dioxide anesthesia. After complete macroscopic examination, the livers were weighed and dissected for use in the following analysis for all experiments.
Pathological and Immunohistochemical Examination of the Liver
In Exp. 1, the left and median lobes of the liver were fixed in 10% buffered formaldehyde solution, embedded in paraffin wax, and stained with hematoxylin–eosin (H&E) and periodic acid–Schiff reaction. In addition, small frozen pieces of formaldehyde-fixed liver tissue samples were stained with oil red O to detect neutral fat droplets in hepatocytes in all groups of both genotypes. Serial deparaffinized liver sections in each group were incubated with an antibody for the Cyp2b synthetic peptide (Millipore Co., Billerica, MA) at 4°C overnight. After the incubation, the sections were reacted with secondary antibodies conjugated to peroxidase-labeled dextran polymers (Histofine® Simple Stain mouse MAX PO (R), Nichirei Co., Tokyo, Japan) and visualized by 3-3′-diaminobenzidine reaction (Sigma Chemical Co., St. Louis, MO). We confirmed there were no nonspecific reactions incubating without the primary antibodies.
In Exp. 3, all livers were quickly removed and fixed in 10% buffered formaldehyde solution. Whole liver in all mice was dissected into 13 sections per liver, including 8 and 5 sections from the median and left lobes, respectively. After dissection, all sections were routinely processed and stained with H&E for histopathological analysis. Proliferating lesions in the liver (hepatocellular adenomas and foci of hepatocellular alteration) were classified into 3 types, that is, eosinophilic, basophilic, and others. Mixed or clear types were classified as “Other.” The incidence and multiplicity (average number per animal) of proliferative lesions of each type were calculated. The classification of liver proliferating lesions was in accordance with the criteria of the International Harmonization of Nomenclature and Diagnostic Criteria of Lesions in Rats and Mice (Thoolen et al. 2010).
Labeling Indices of Hepatocytes
The paraffin-embedded liver sections in Exps. 1 and 2 were used for evaluation of hepatocyte proliferation. The deparaffinized liver sections were incubated with an antibody for proliferating cell nuclear antigen (PCNA, Clone PC10, DAKO) at 4°C overnight. The sections were reacted with secondary antibodies conjugated to peroxidase-labeled dextran polymers (Histofine® Simple Stain MAX PO (Multi), Nichirei Co., Tokyo, Japan) and visualized by 3-3′-diaminobenzidine reaction (Sigma Chemical Co., St. Louis, MO), then counterstained with hematoxylin. Percentages of the number of PCNA positive nuclei among at least 1,000 hepatocytes from 5 randomly chosen fields that contained both periportal and central areas were calculated for each individual mouse.
Real-time Quantitative PCR Analysis of Genes Related to Drug Metabolism
In Exp. 1, liver tissue samples were immediately frozen in liquid nitrogen for later RNA isolation and preparation. Total RNA was extracted from the frozen liver tissue samples using ISOGEN (Nippon Gene Co. Ltd., Tokyo, Japan), following the manufacturer’s instructions. Complementary DNA was synthesized from 1 µg of total RNA using High Capacity Reverse Transcription kits (Applied Biosystems, Foster City, CA). After RNA quantity and quality were checked, real-time PCR was performed using a TaqMan Fast Universal PCR Master Mix (Applied Biosystems, Foster City, CA). As for primer–probe sets, we used TaqMan Gene Expression Assays from Applied Biosystems for the quantitative analysis of specific messenger RNA (mRNA) expression levels of genes: Cyp1a1 (Mm00487218_m1), Cyp1a2 (Mm00487224_m1), Cyp1b1 (Mm00487229_m1), Cyp2b10 (Mm01972453_s1), Cyp3a11 (Mm00731567_m1), Cyp4a10 (Mm01188913_g1), CYP reductase (Mm00435876_m1), CAR (Mm00437986_m1), PXR (Mm01344139_m1), and aryl-hydrocarbon receptor (Mm01291777_m1). Real-time PCR was performed using a 7900HT Fast Real-time PCR System (Applied Biosystems). The relative changes in gene expression level were calculated by the relative standard curve method, normalized against endogenous GAPDH (Glyceraldehyde 3-phosphate dehydrogenase; TaqMan Rodent GAPDH Control Reagent, Applied Biosystems). The mRNA expression level of Gadd45beta was analyzed according to the method in a previous report (Ozawa et al. 2011).
Statistical Analyses
All data except for the incidence of proliferative lesions were expressed as M ± SD per group and genotype. Each value of the treated groups was compared with the value of the control group for the corresponding genotype. Each value of CARKO mice was compared with the value of wild-type mice in the corresponding group for the expression level of mRNA and multiplicity of proliferative lesions. Values were analyzed by the Bartlett test to evaluate the homogeneity of variance. If the variances were homogenous, Student’s t-test was performed. If the variances were heterogeneous, Welch’s t-test was performed. The incidences of proliferative lesions were compared between each treated group and the control group for the corresponding genotype or between wild-type and CARKO mice in each group by Fisher’s test. Results were considered statistically significantly different at p < .05 and p < .01.
Results
Clinical Signs, Body Weight, and Liver Weight (Exps. 1, 2, and 3)
No treatment-related clinical signs or deaths were detected during the 1-, 4-, or 27-week treatment, except for one CARKO animal in the PBO group in the 4-week study, which died due to inanition on day 13 of administration. The final body weights and liver weights are shown in Table 1. In all the 3 experiments, PBO caused lower body weights in both genotypes compared to the corresponding controls. The lower body weights in the PBO groups were related to taste avoidance, since food consumption of the PBO group in the 4-week study was lower than that of control (data not shown). In the 27-week treatment group, the body weights of all mice transiently decreased after intraperitoneal injection of DEN, but recovered in a few weeks (Supplemental Figure 1). The body weights of CARKO mice in the 27-week PB treatment group were lower than those in the corresponding control group, though there were no avoidance of food intake in the PB group (data not shown). In all the 3 experiments, absolute and relative liver weights were greatly increased in the PBO group of both genotypes and in the PB group of only wild-type mice compared to the control group of each genotype (Table 1). DBDE increased absolute and relative liver weights of wild-type mice after 4- and 27-week treatment, but did not affect the liver weights of CARKO mice except for a small magnitude of relative liver weight increase after 27-week treatment. The absolute or relative liver weights in the PB group of CARKO mice were decreased after 4-week treatment or more.
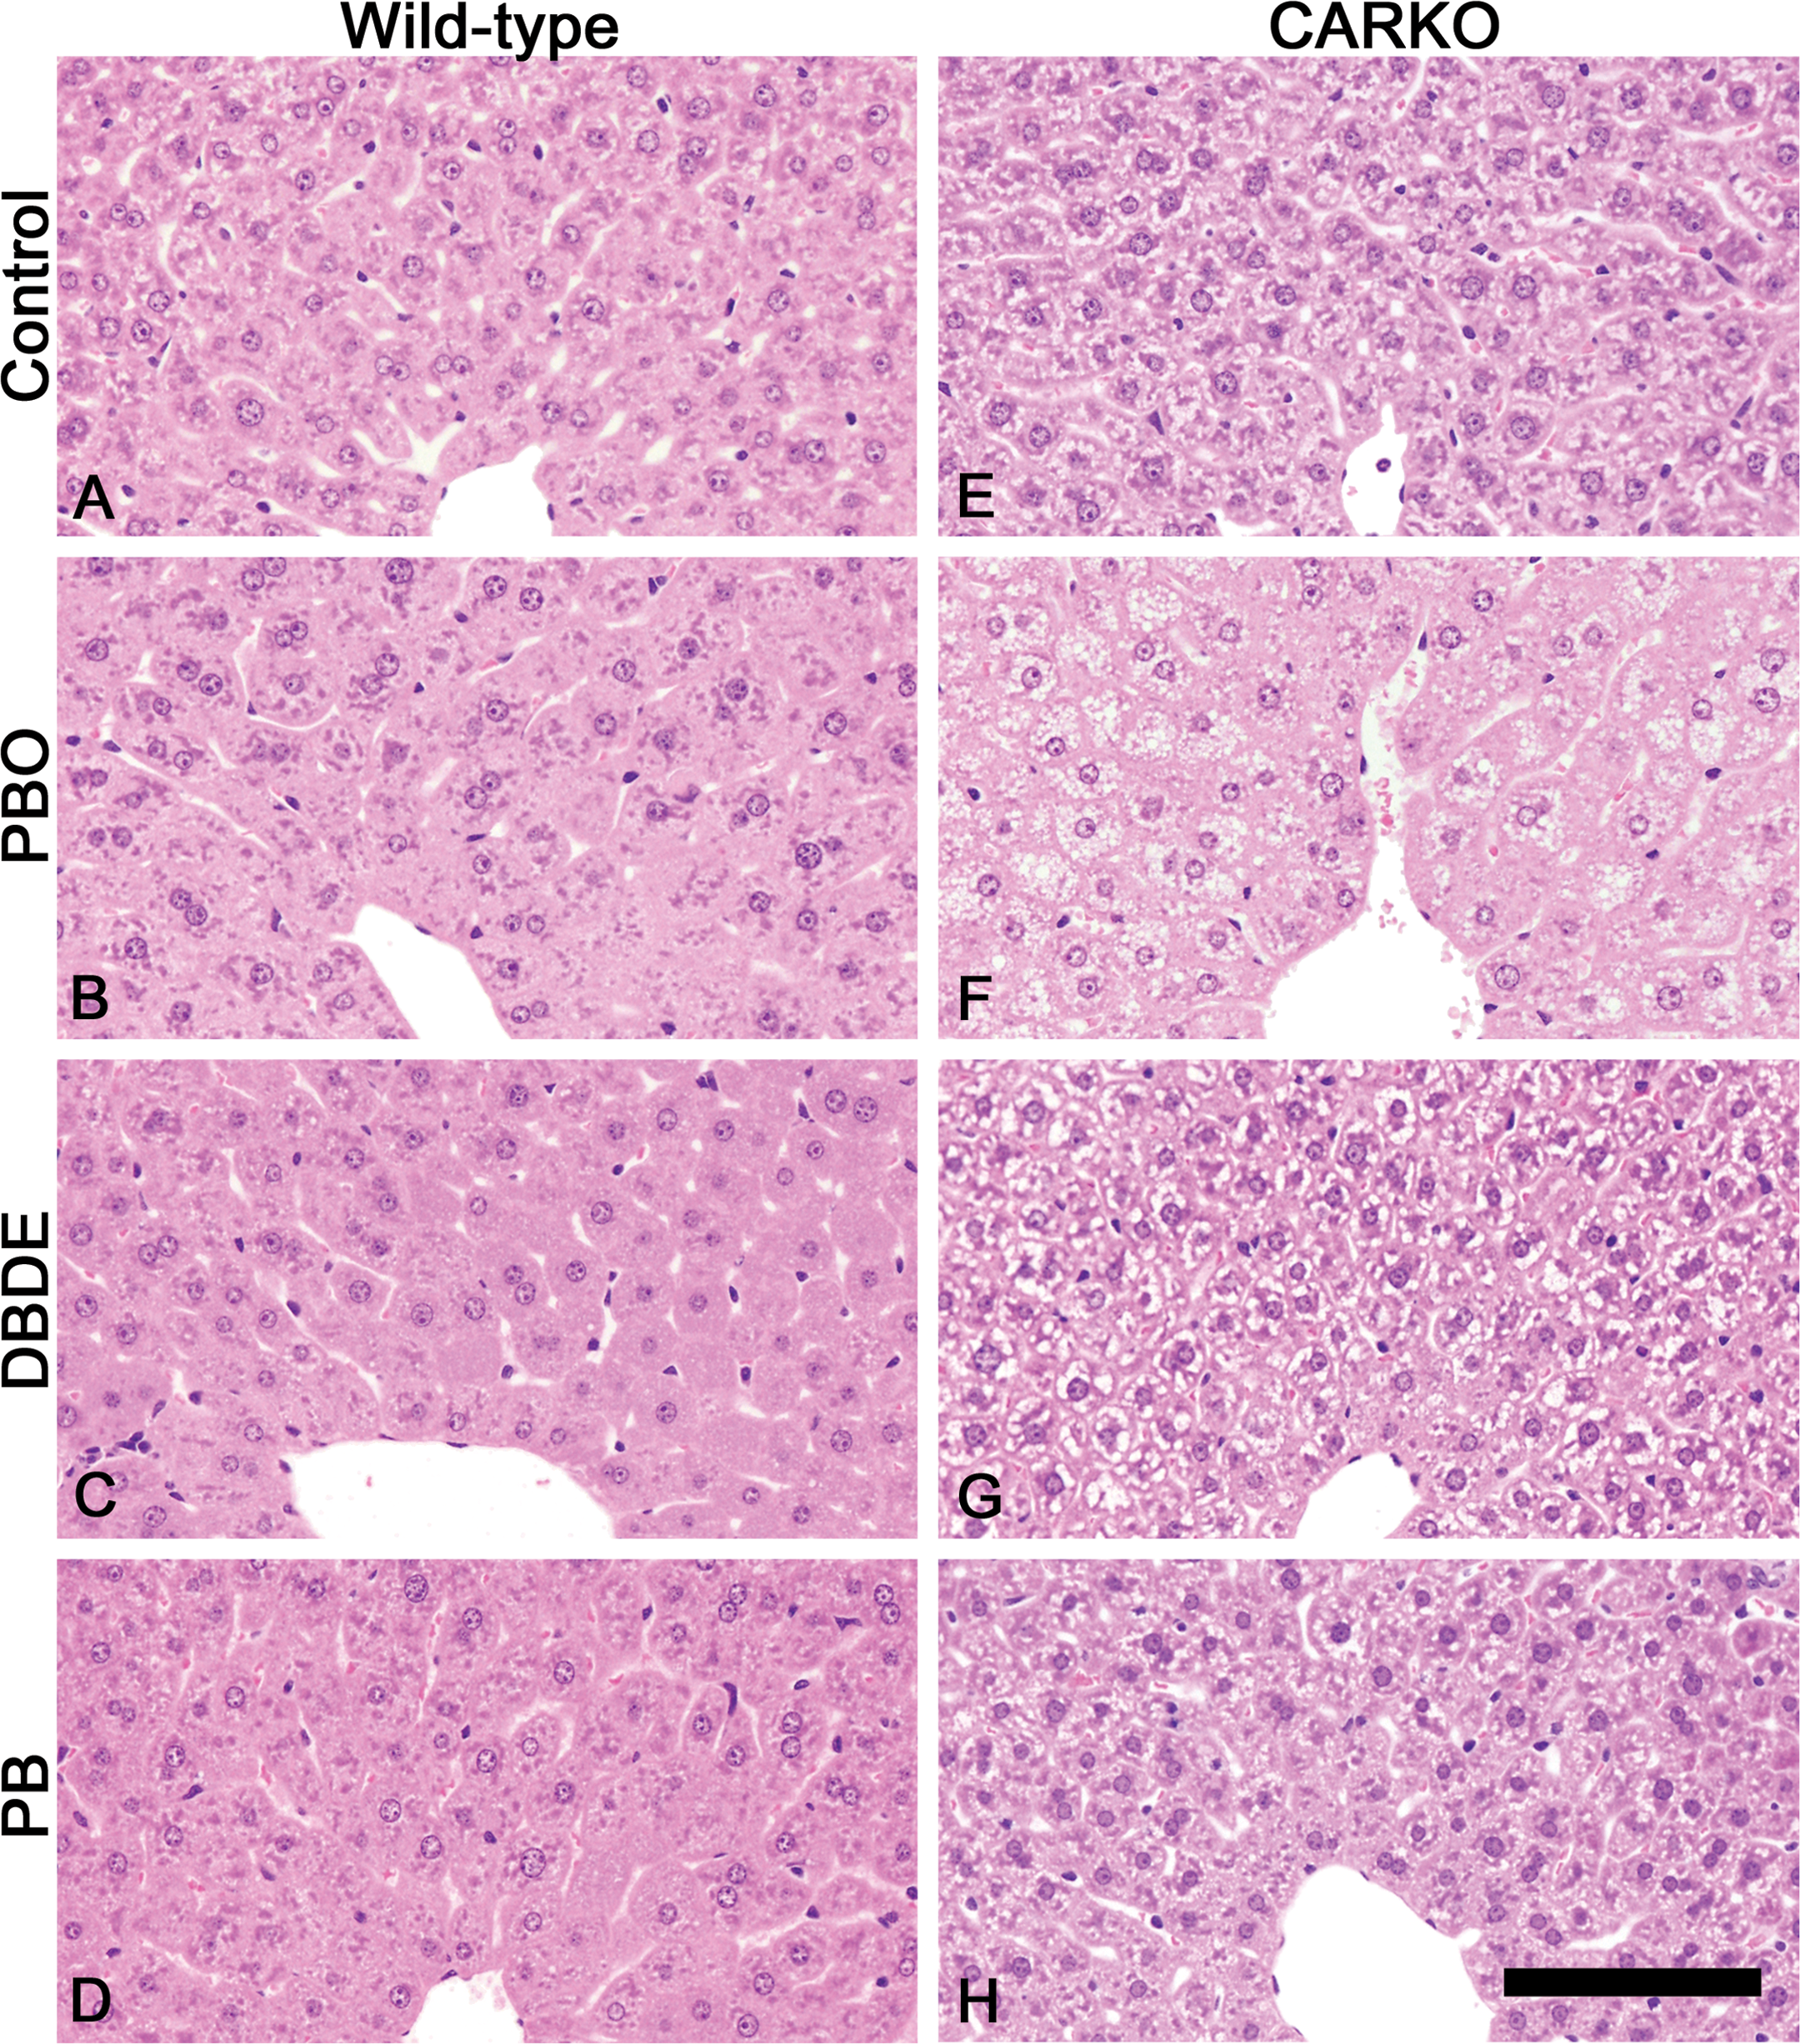
Livers of wild-type and CAR knockout (CARKO) mice treated with piperonyl butoxide (PBO), decabromodiphenyl ether (DBDE), and phenobarbital (PB) or fed basal diet (control group) for 4 weeks. A–D are from wild-type mice. E–H are from CARKO mice. A and E are from the control group. B and F are from the PBO group. C and G are from the DBDE group. D and H are form the PB group. Centrilobular hepatocellular hypertrophies were prominent in every treated group of wild-type mice (B, C, and D). In CARKO mice, no hypertrophies were seen except for the PBO group (F). Vacuolations in centrilobular hepatocytes were also observed in the PBO group of CARKO mice (F). Hematoxylin and eosin (H&E) staining. The scale bar represents 100 µm.
Body weights and liver weights in wild-type and CARKO mice treated with PBO, DBDE, or PB for 1, 4, or 27 weeks.
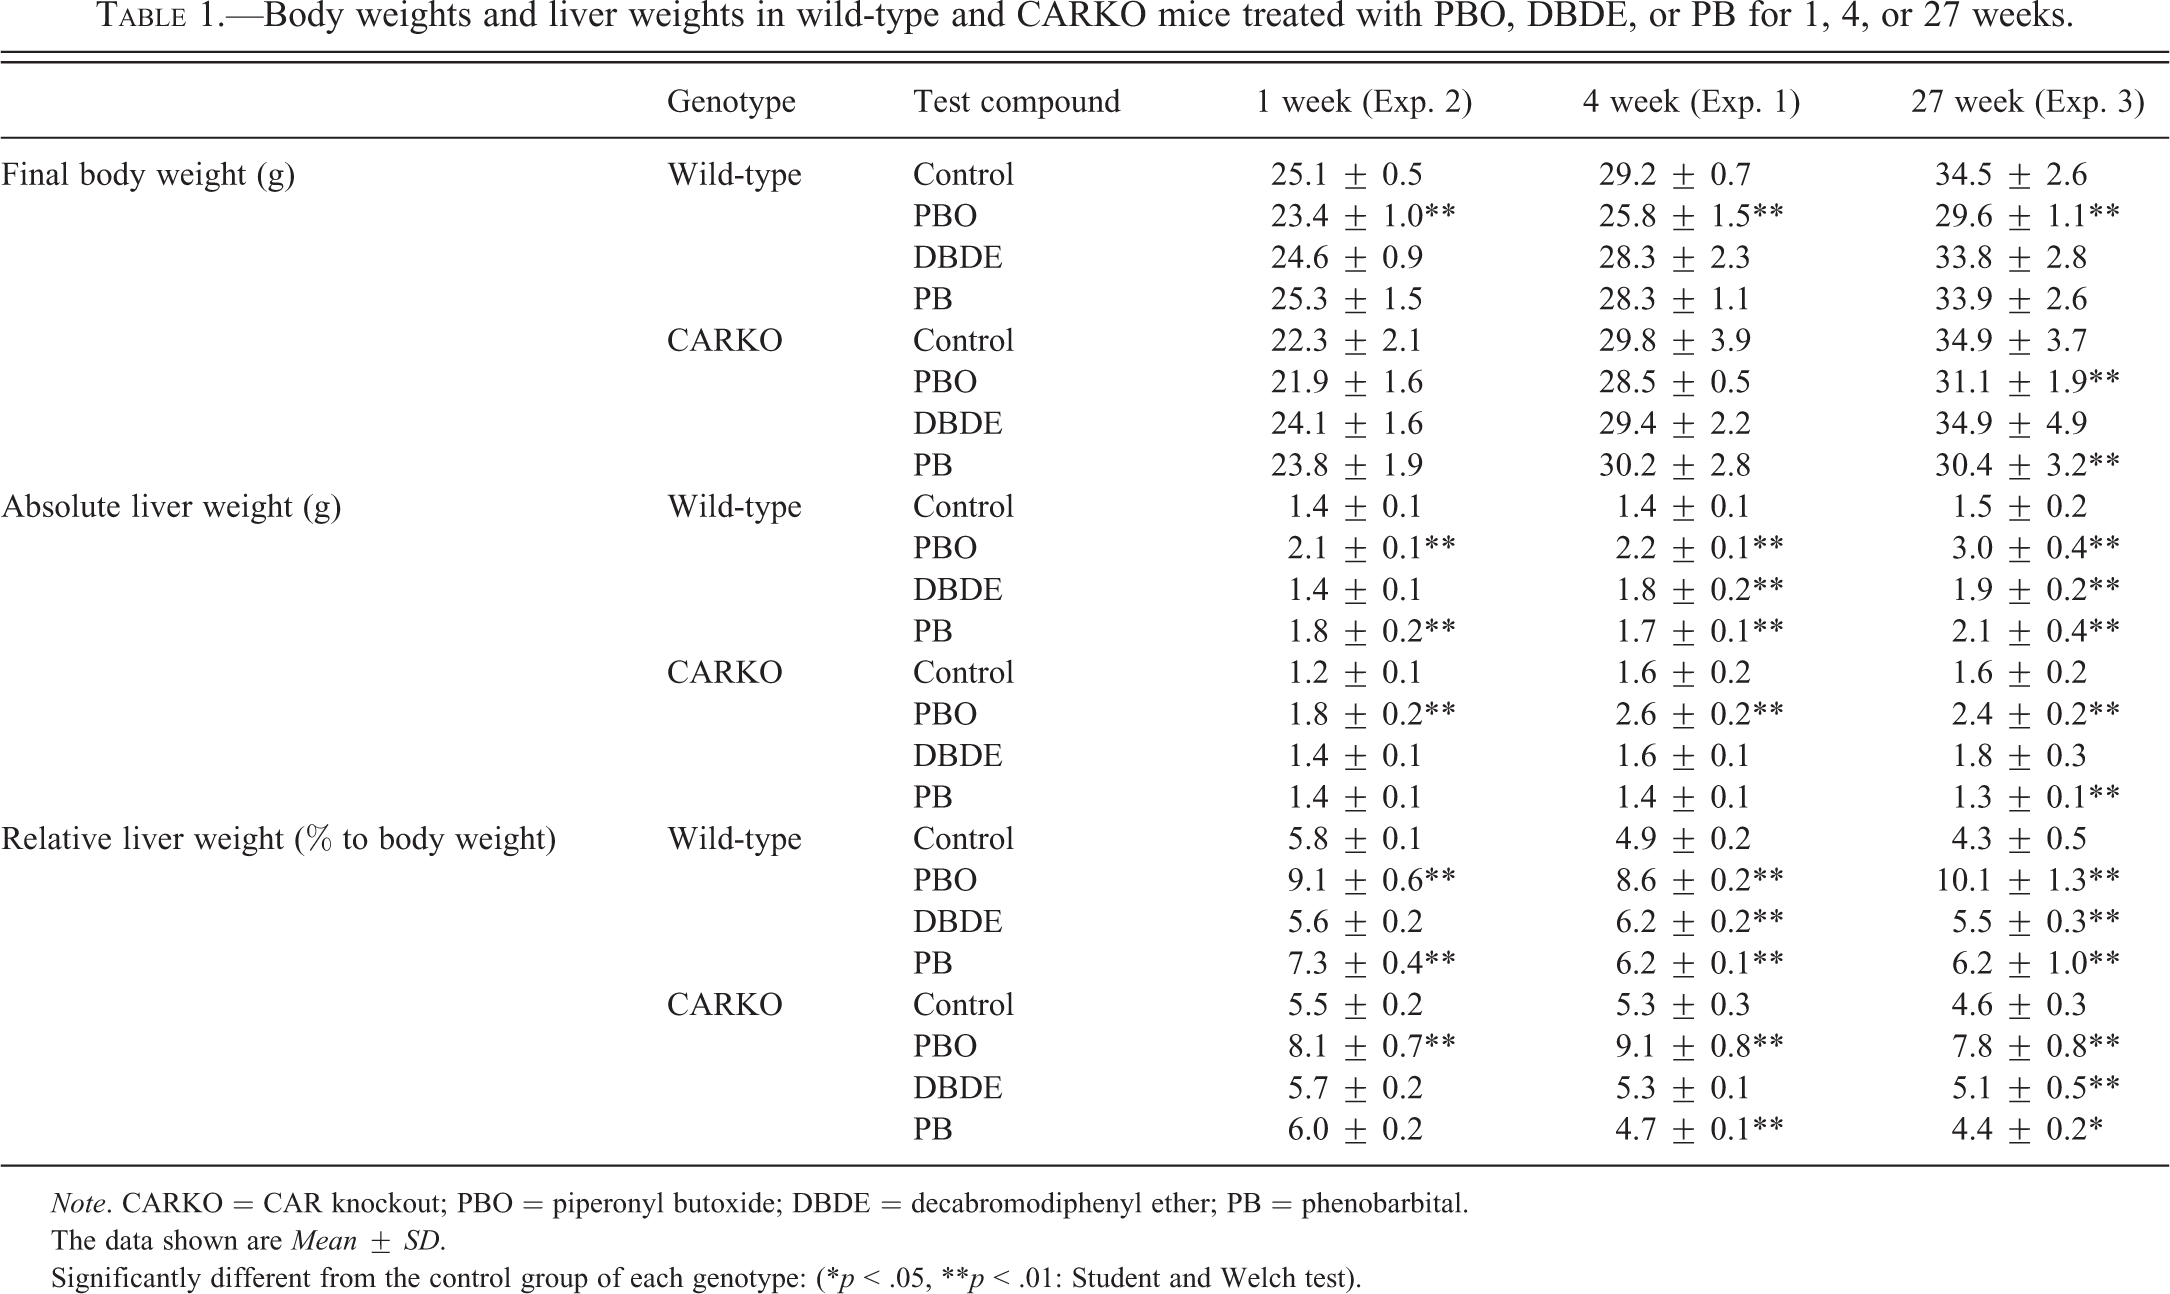
Note. CARKO = CAR knockout; PBO = piperonyl butoxide; DBDE = decabromodiphenyl ether; PB = phenobarbital.
The data shown are Mean ± SD.
Significantly different from the control group of each genotype: (*p < .05, **p < .01: Student and Welch test).
Histology of Liver (Exp.1)
In the histopathological examination, hepatocellular hypertrophy was concomitantly detected with increase in liver weight. Histopathological features are summarized in Table 2 and typical patterns of hypertrophy are shown in Figure 1. All the treated groups of wild-type mice showed hepatocellular hypertrophy: in the centrilobular area in the DBDE and PB groups and in the centrilobular to midzonal area in the PBO group. The grades of hypertrophy in the PBO, DBDE, and PB groups were marked, moderate, and moderate to marked, respectively. In CARKO mice, no hypertrophy was observed in the DBDE and PB groups. However, CARKO mice in the PBO group showed hepatocellular hypertrophy in the centrilobular area or from the centrilobular to midzonal areas. In addition, cytoplasmic vacuoles, which were positive to oil red O, were found at a moderate level in the hepatocytes of most CARKO mice in the PBO group and at a low level in a few mice in the DBDE group (Table 2, Supplemental Figure 2). Focal neutrophil infiltrations indicating acute hepatocyte injury were detected in the PBO group of both phenotypes.
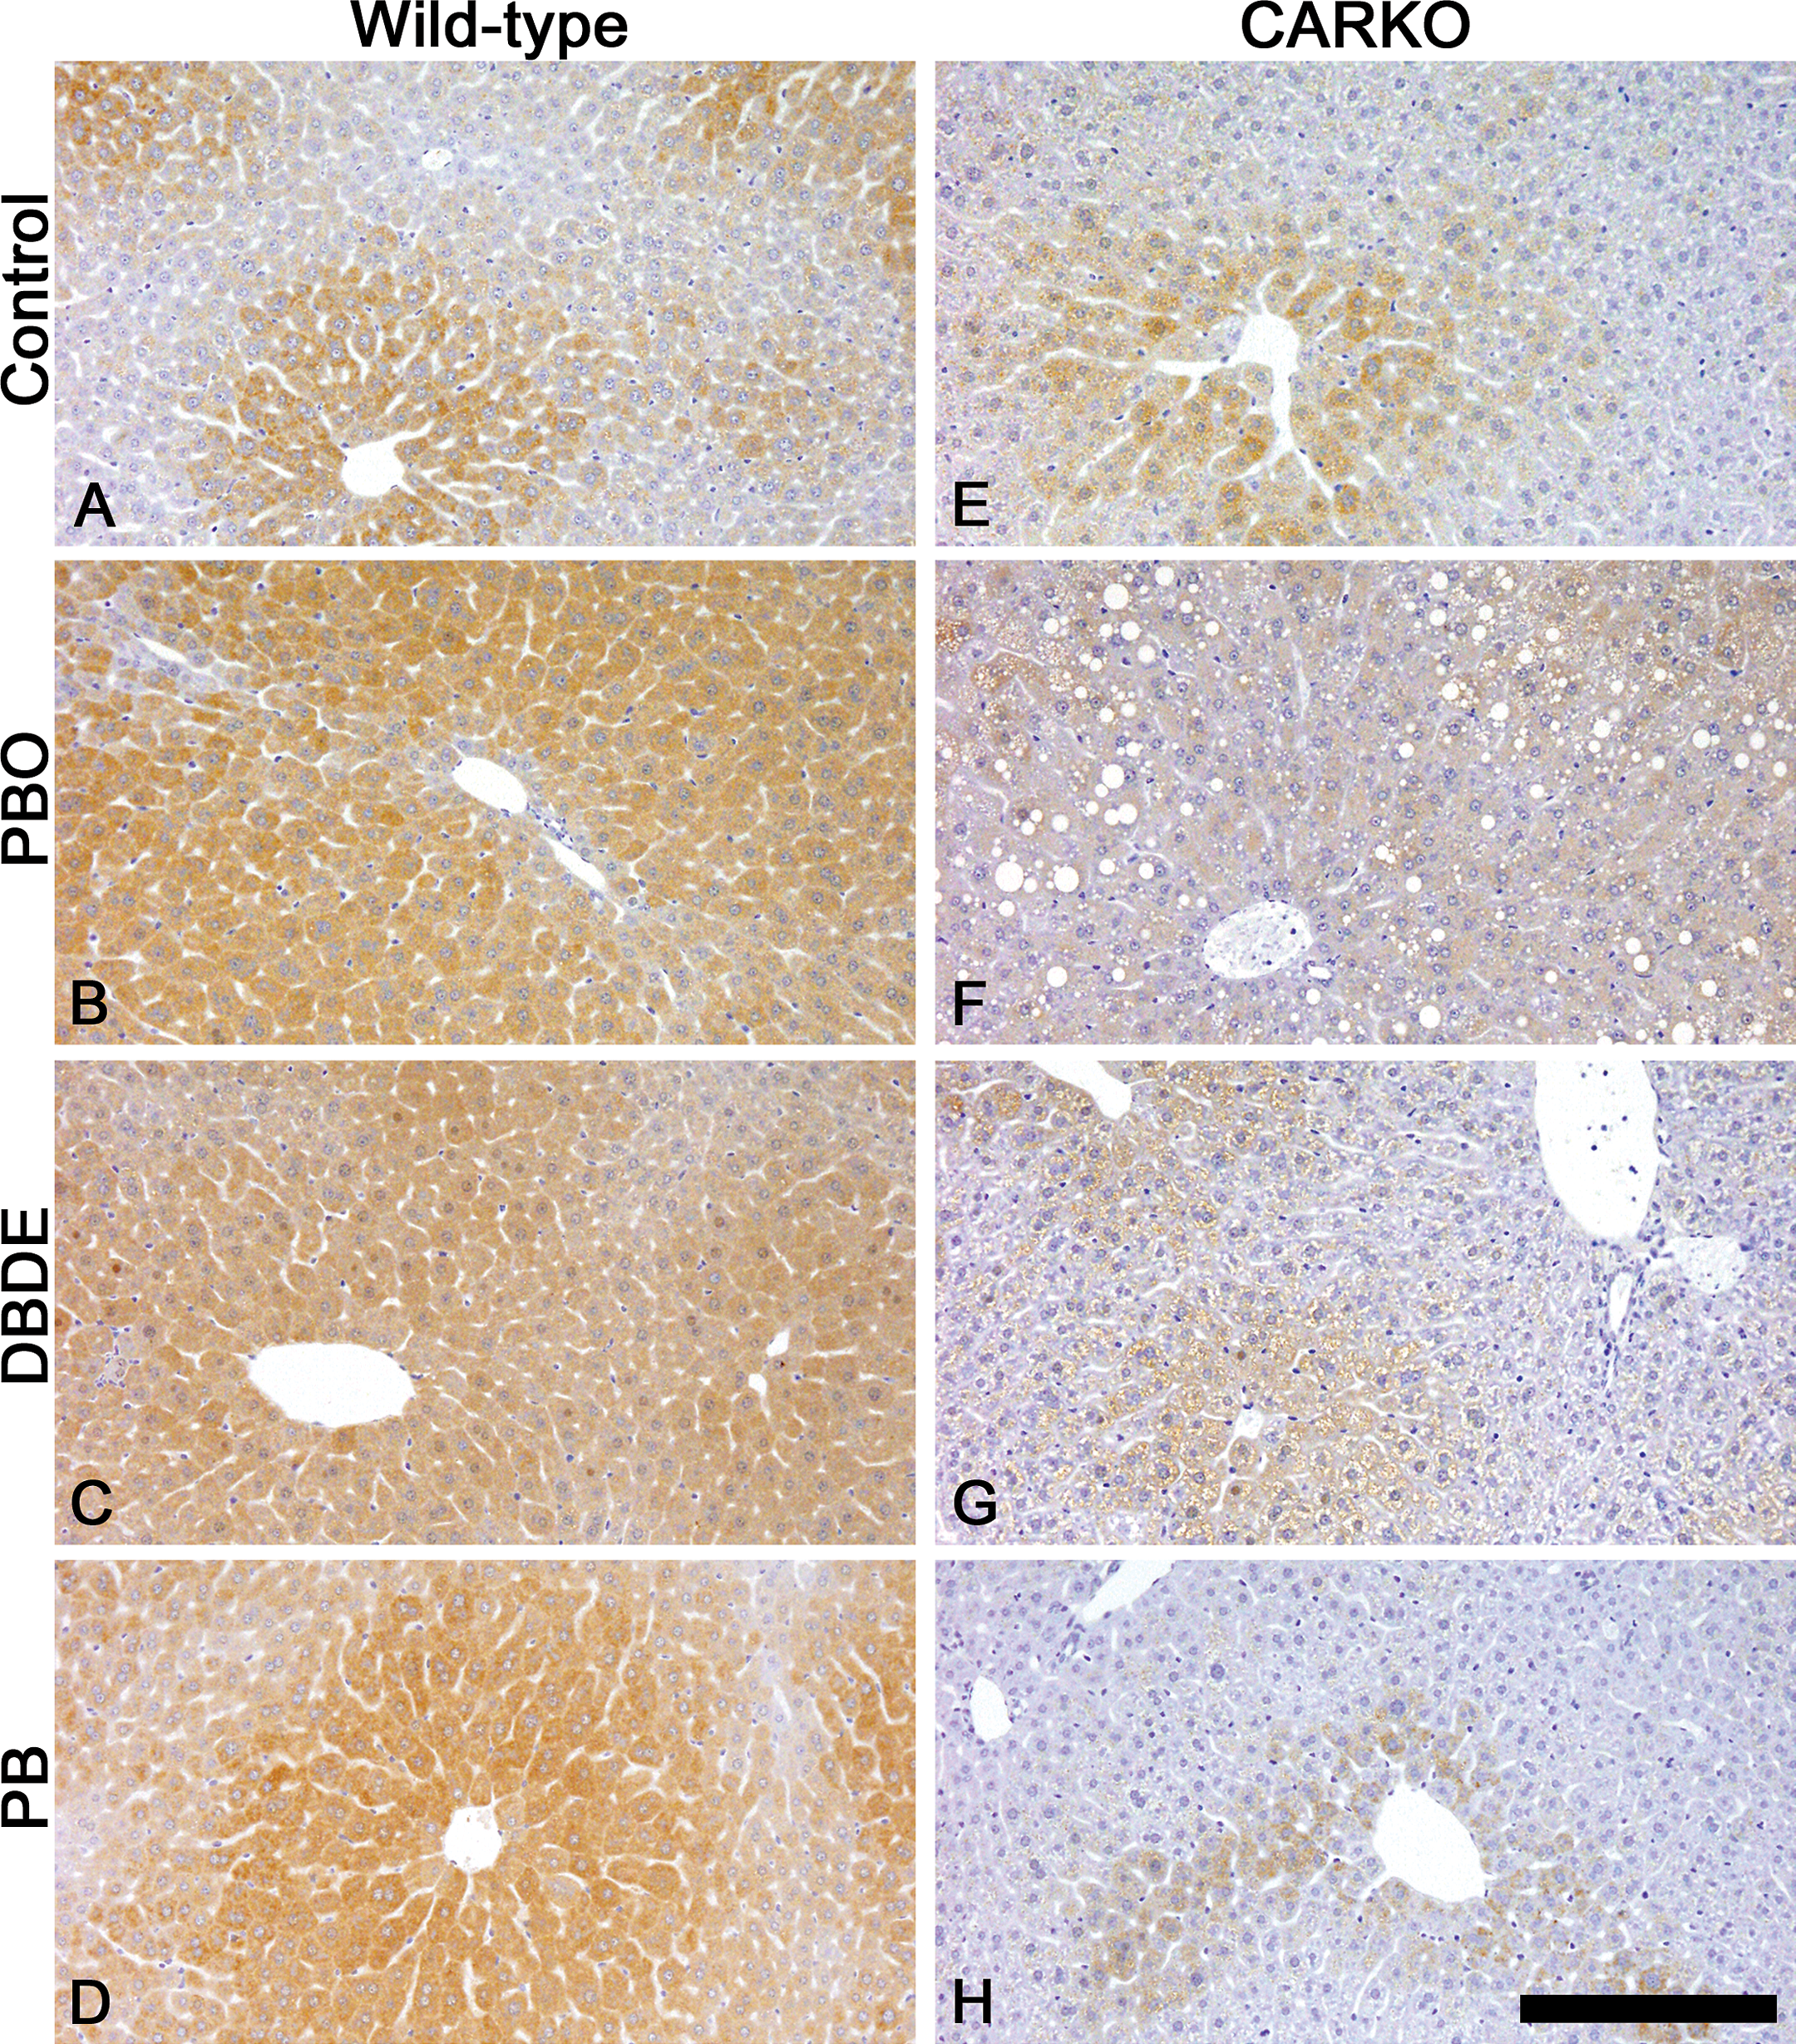
Liver sections stained with immunohistochemical reaction to Cyp2b. Livers were of wild-type and CAR knockout (CARKO) mice treated with piperonyl butoxide (PBO), decabromodiphenyl ether (DBDE), and phenobarbital (PB) or fed basal diet (control group) for 4 weeks. A–D are from wild-type mice. E–H are from CARKO mice. A and E are from the control group. B and F are from the PBO group. C and G are from the DBDE group. D and H are from the PB group. Wild-type mice in the control group showed weak staining intensity in centrilobular area (A). In the PBO, DBDE, and PB groups on wild-type mice, strong staining intensities were detected diffusely (B, C, and D). In CARKO mice, faint staining intensities were seen in centrilobular hepatocytes of the control, DBDE, and PB groups (E, G, and H). The staining intensities in the PBO group of CARKO mice were also faint; however, they were diffusely detected (F). The scale bar represents 200 µm.
Histopathological findings of livers in wild-type and CARKO mice treated with PBO, DBDE, or PB for 4 weeks in Exp.1.
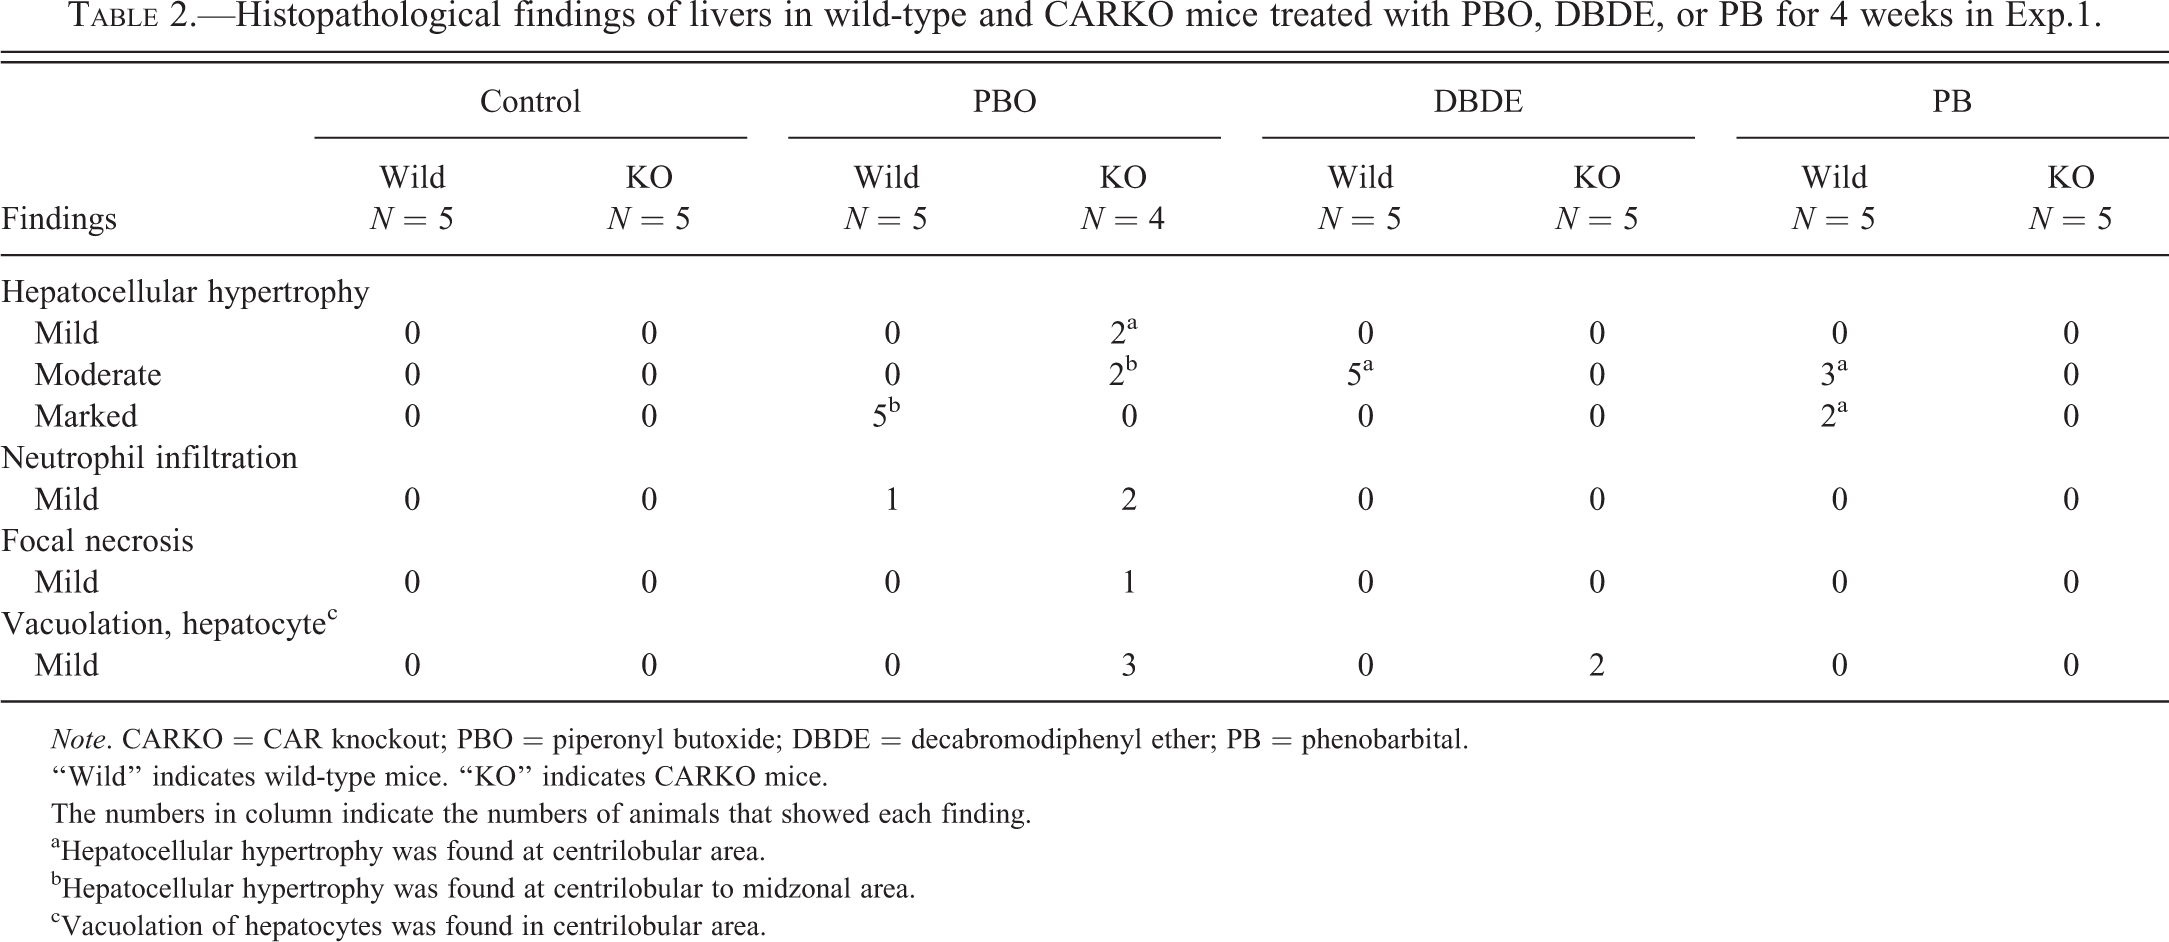
Note. CARKO = CAR knockout; PBO = piperonyl butoxide; DBDE = decabromodiphenyl ether; PB = phenobarbital.
“Wild” indicates wild-type mice. “KO” indicates CARKO mice.
The numbers in column indicate the numbers of animals that showed each finding.
aHepatocellular hypertrophy was found at centrilobular area.
bHepatocellular hypertrophy was found at centrilobular to midzonal area.
cVacuolation of hepatocytes was found in centrilobular area.
Immunohistochemically, the hepatocytes of wild-type mice in all treated groups showed strong positive signals to Cyp2b, while the control group showed weak signals in the centrilobular area. The signals were distributed diffusely in the PBO group and were observed in the centrilobular area in the DBDE and PB groups (Figure 2). In CARKO mice, there were faint signals in the centrilobular area of the control, DBDE, and PB groups, while weak and diffuse signals were observed in the PBO treatment group.
mRNA Expression in Liver (Exp. 1)
The results of mRNA expression of genes encoding liver metabolic enzymes are shown in Figure 3. The expression level of Cyp2b10 mRNA in the liver was greatly increased in the PBO, DBDE, and PB groups of wild-type mice. Cyp2b10 in the PBO group of CARKO mice was also increased, although it was lower than the wild-type mice treated with PBO. Cyp2b10 significantly decreased in the control, DBDE, and PB groups of CARKO mice compared with the control group of wild-type mice. Cyp3a11 was induced by PBO and by PB in both genotypes, the increase being higher in PBO. DBDE significantly increased Cyp1a1, Cyp1a2, and Cyp1b1 in both genotypes. Cyp1a2 was slightly increased in the PBO group of both genotypes and in the PB group of wild-type mice. Cyp4a10 in the CARKO mice was expressed at a higher level than that in the wild-type mice for all groups, being particularly high in the PBO group of CARKO mice. Gadd45beta, a major player in endogenous nuclear factor-kappaB-mediated resistance to apoptosis, was highly expressed in the PBO group of both genotypes and in the PB group of wild-type mice. CYP reductase mRNA was highly expressed in all treated groups of wild-type mice and in the PBO group of CARKO mice. In CARKO mice, CYP reductase was also induced by DBDE, but it was lower than the wild-type mice treated with DBDE.
Relative mRNA expression levels of Cyp2b10, Cyp3a11, Cyp1a1, Cyp1a2, Cyp1b1, Cyp4a10, Gadd45beta, and P450 reductase in the liver of wild-type and CARKO mice treated with test chemicals for 4 weeks. Values represent Mean ± SD of each group and genotype. The expression levels of each gene were divided by the expression levels of GAPDH mRNA of corresponding individuals. * and ** indicate statistically significant differences from the control group of each genotype (*p < .05, **p < .01: Student and Welch test). # and ## indicate statistically significant differences from the wild-type animals of each group (# p < .05, ## p < .01: Student and Welch test).
Proliferating Activity of Hepatocytes (Exps. 1 and 2)
Labeling indices of hepatocytes in Exps. 1 and 2 are shown in Figure 4. After 1-week treatment, the percentages of PCNA positive hepatocytes were significantly increased by PBO and PB treatment in wild-type animals, and an increased trend was seen in the PBO group of CARKO mice compared to the control group of each genotype. After 4-week treatment, there were some statistically significant changes compared between each genotype or the control and treated groups. However, the labeling percentages in all groups on both genotypes were less than 1%.
Labeling indices of hepatocytes after the 1- and 4-week treatment of test chemicals. Values represent Mean ± SD of each group and genotype. * and ** indicate statistically significant differences from the control group of each genotype (*p < .05, **p < .01: Student and Welch test). # and ## indicate statistically significant differences from the wild-type animals of each group (# p < .05, ## p < .01: Student and Welch test).
Hepatocarcinogenesis and Histology in Liver (Exp. 3)
Macroscopic appearances of liver after the 27-week treatment are shown in Figure 5. A number of nodules on liver surface were observed in wild-type mice treated with PBO and PB, whereas nodules were few in CARKO mice treated with PBO or PB. The livers in the DBDE group of both genotypes showed a greater number of nodules than the corresponding controls. Under microscopic observation, these proliferative lesions were classified as foci of hepatocellular alteration (described as “foci” hereafter) and adenomas, and subclassified into eosinophilic, basophilic, and other type (see Supplemental Figure 3 for typical eosinophilic and basophilic adenomas).
Macroscopic appearance of livers after the 27-week treatment of test chemicals. A–D are from wild-type mice. E–H are from CAR knockout (CARKO) mice. A and E are from the control group. B and F are from the piperonyl butoxide (PBO) group. C and G are from the decabromodiphenyl ether (DBDE) group. D and H are from the phenobarbital (PB) group. Wild-type mice treated with PBO and PB showed many protruding nodules on livers (B and D); however, there are few or no nodules in those groups of CARKO mice (F and H). DBDE treatment induced pale nodules in both genotypes (C and G). The scale bar represents 1 cm.
The incidences of foci and adenomas are shown in Table 3. In wild-type mice, PBO and PB treatments increased the incidence of eosinophilic foci and adenomas, which were detected in all mice in these groups. In CARKO mice, incidences of eosinophilic foci and/or adenomas were significantly decreased in these groups compared to similarly treated wild-type mice. Basophilic foci and/or adenomas were found in all groups of both genotypes, but the incidence in the PB group of CARKO mice was significantly lower than wild-type mice treated with PB and also lower than the control group of CARKO mice. Although other types of foci and/or adenomas were increased in the DBDE and PB groups compared to those in the control group of wild-type mice, no significant changes were observed in CARKO mice.
Incidence of proliferative lesions in wild-type and CARKO mice treated PBO, DBDE, or PB for 27 weeks after DEN initiation in Exp. 3.
Note. CARKO = CAR knockout; PBO = piperonyl butoxide; DBDE = decabromodiphenyl ether; PB = phenobarbital.
“Wild” indicates wild-type mice. “KO” indicates CARKO mice.
The numbers in column indicate the numbers of animals in which one or more lesions were found.
Significantly different from the control group of each genotype: (*p < .05, **p < .01: Fisher’s test).
Significantly different from wild-type mice of each group: (# p < .05, ## p < .01: Fisher’s test).
The multiplicities (average number per animal) of foci and adenomas are shown in Figure 6. In the wild-type mice, PBO significantly increased the multiplicities of eosinophilic foci and adenomas compared to the control group, and PB also increased them though it was not statistically significant. In the CARKO mice, eosinophilic foci and adenomas were dramatically decreased in the PBO and PB groups compared to the respective wild-type mice. On the other hand, DBDE increased the multiplicities of basophilic foci and adenomas in both genotypes compared with the corresponding controls. PBO also slightly increased the number of basophilic adenomas. Basophilic proliferative lesions were observed in all groups including the control group of both genotypes; however, the multiplicities of these lesions in CARKO mice were lower than those in the wild-type mice. Other types of proliferative lesions were rare compared to eosinophilic or basophilic types, but all compounds induced other types of foci and/or adenomas in wild-type mice. On the other hand, other types of proliferative lesions were hardly seen in CARKO mice.
Multiplicity (average number per animal) of proliferative lesions that are found in the liver sections of each individual. Values represent Mean ± SD of each group and genotype. * and ** indicate statistically significant differences from the control group of each genotype (*p < .05, **p < .01: Student and Welch test). # and ## indicate statistically significant differences from the wild-type animals of each group (# p < .05, ## p < .01: Student and Welch test).
Nonproliferative lesions after 27-week treatment are shown in Table 4. Hepatocellular hypertrophy was observed in all treated groups of wild-type mice and in the PBO group of CARKO mice, consistent with the results of Exp. 1 (4-week treatment), except for mild or moderate hepatocellular hypertrophy in most CARKO mice treated with DBDE. Hepatocellular vacuolation in the centrilobular area occurred in the PBO and DBDE groups of CARKO mice only, and the intensities were more severe than those observed in Exp. 1. The increased severity is likely due to prolonged treatment time (4 weeks vs. 27 weeks). Karyocytomegaly of hepatocytes was observed in less than half of mice of both genotypes treated with PBO or DBDE. In the PB group, karyocytomegaly was seen in all of the wild-type mice but in none of the CARKO mice. Focal necrosis was found in the PBO group of both genotypes and the incidence was higher in CARKO mice than in wild-type mice. Multifocal neutrophil infiltrations were prominent in the DBDE group of CARKO mice. Yellow pigment deposition in foci of histiocytes was observed in all treated groups; the incidences were relatively high in the DBDE group of both genotypes and in the PB group of wild-type mice. This deposition was occasionally accompanied by mononuclear cell infiltrations and increases in the number of oval cells.
Nonneoplastic histopathological findings of livers in wild-type and CARKO mice treated PBO, DBDE, or PB for 27 weeks after DEN initiation in Exp. 3.
Note. CARKO = CAR knockout; PBO = piperonyl butoxide; DBDE = decabromodiphenyl ether; PB = phenobarbital.
“Wild” indicates wild-type mice. “KO” indicates CARKO mice.
The numbers in column indicate the numbers of animals which showed each finding.
aHepatocellular hypertrophy was observed in centrilobular area.
bYellowish pigment deposition was found in foci of histiocytes and this change was occasionally accompanied by mononuclear cell infiltration and oval cell hyperplasia around periportal area.
cVacuolations in centrilobular area were supposed to be lipid accumulations which were seen in the same groups of CARKO mice in Exp. 3.
Discussion
In the present experiments, we investigated the involvement of CAR in liver hypertrophy and hepatocarcinogensis induced by PBO and DBDE using wild-type and CARKO mice, using compounds known to induce Cyp2b drug metabolite enzymes and mouse liver tumors.
Short-term (1 or 4 weeks) treatment showed a clear relationship between CAR and the test substances. In wild-type mice, PBO, DBDE, and PB induced liver weight increases and hepatocellular hypertrophy that correspond with immunopositivity for Cyp2b and increased Cyp2b10 mRNA expression, indicating that all compounds are Cyp2b inducers. In CARKO mice, liver hypertrophy or Cyp2b induction was not observed after short-term treatment with DBDE and PB, while only PBO induced those changes, demonstrating that DBDE- or PB-induced liver hypertrophy is mediated by CAR activation, but CAR is not essential for liver hypertrophy by PBO. The induction of Cyp3a11 mRNA by PBO in both genotypes indicated the involvement of other nuclear receptors such as PXR, a hypothesis that would correspond with a previous report (Beigneux et al. 2002).
Our results indicate that DBDE is not a simple CAR-dependent Cyp2b inducer but also a CAR-independent Cyp1 family inducer. Lee et al. (2010) reported that DBDE induces CYP1A2, 3A1, and 2B1 enzymes with increased mRNA expressions of CAR and PXR in Sprague-Dawley rats. Pacyniak et al. (2007) reported that brominated flame retardants, including DBDE, are PXR activators as they induce Cyp2b and Cyp3a but not Cyp1a1 in C57BL/6 mice. These results indicate that DBDE induces Cyp enzymes via CAR or other pathways, and the induction patterns are different between strains or species.
The increased mRNA expression level of CYP reductase associated with liver hypertrophy observed in the present study reflected the activation of CYPs in the liver (Henderson et al. 2003). The high mRNA expression level of Cyp4a10 in CARKO mice is in agreement with previous reports that CAR activation repressed the expression of Cyp4a10 mRNA (Ueda et al. 2002).
The long-term (27-week) study demonstrated that CAR plays a major role in the development of eosinophilic foci and adenomas induced by PBO and PB. The multiplicity indicated clearer results than the incidence. The wild-type mice treated with PBO developed eosinophilic foci/adenomas, which are typically induced by PB treatment (Whysner, Ross, and Williams 1996; Yamamoto et al. 2004), suggesting that major liver tumor production pathways in PBO treatment might be common to PB. Foci/adenomas were still detected in CARKO mice in the PBO group, but were far fewer than those in wild-type mice, suggesting that minor but other CAR-independent pathways such as PXR might exist in PBO-induced hepatocarcinogenesis (Figure 7). On the contrary, the increases in the number of basophilic foci and adenomas in the DBDE group of both genotypes indicate that the main mechanism of liver tumor promotion is CAR independent, unlike PBO and PB (Figure 7).
Schematic illustration of possible pathways in liver hypertrophy and adenoma induction in the wild-type (upper) and the CAR knockout (CARKO; lower) mice treated with piperonyl butoxide (PBO), phenobarbital (PB), and decabromodiphenyl ether (DBDE). The pink, green, and yellow arrows indicate the possible pathways of PBO, PB, and DBDE, respectively.
It is unclear why the numbers of basophilic and other type proliferative lesions were fewer in CARKO mice compared to wild-type mice, including the control group and particularly in the PB group (Figure 6). CAR deficiency might affect the susceptibility to DEN initiation, considering a report that showed PB treatment in rats enhances the metabolism of DEN and attenuates its hepatotoxicity (Magour and Nievel 1971).
The PB-like hepatocarcinogenic MOA and the effects of test chemicals on liver are summarized in Table 5. Liver hypertrophy has been considered a key event in the hepatocarcinogenic MOA for PB-like CYP inducers in rodents (Holsapple et al. 2006). However, our results showed that PBO treatment induced liver hypertrophy accompanied by Cyp2b induction in both genotypes but far fewer liver tumors were observed in CARKO mice than in wild-type mice (Figure 7). Short-term treatment of DBDE induced liver hypertrophy and Cyp2b induction only in wild-type mice, while 27-week treatment increased liver tumors whether CAR exists or not (Figure 7). These results indicate that there is no relationship between liver hypertrophy and hepatocarcinogenesis induced by PBO and DBDE. Many investigations have been conducted to elucidate the mechanisms of liver tumorigenesis promoted by PB-like CYP inducers; some suggested the involvement of aberrant DNA methylation (Phillips and Goodman, 2009; Phillips, Burgoon, and Goodman 2009a, 2009b) or different mechanisms of hepatocarcinogenesis induced by triazole fungicides from those induced by PB in rodents (Nesnow et al. 2009). Although essential factors to promote liver tumorigenesis by Cyp2b inducers such as PB or PBO have not been found, the factors obviously lie downstream of CAR, but Cyp2b is not a factor. Some other Cyp2b inducers such as DBDE have CAR-independent pathway in hepatocarcinogenesis.
Variability of events in PB-like hepatocarcinogenic MOA compared to the control group of each genotype.
Note. −, no change; +, mild; ++, moderate; +++, marked.
The authors defined each grade in the table, considering statistical significance or variations of absolute values.
Increased cell proliferation activity is one of the key events in PB-like MOA of hepatocarcinogenesis. One-week treatment of PBO, which induced marked liver hypertrophy in both genotypes, showed increases in labeling index in both genotypes, but the CAR gene defect drastically reduced liver tumors. On the other hand, DBDE did not increase liver weight and labeling index after 1-week treatment in both genotypes, but induced liver tumors in both genotypes after 27 weeks. These results indicate that labeling index increases at early time points of treatment might reflect rapid increase in liver size, but might not be predictive of liver tumor induction after long-term treatment. In the PBO group of both genotypes and the PB wild-type group, increased labeling indices after 1-week treatment dropped to the control level after 4 weeks, and the relative liver weights were comparable between the 1- and 4-week treatments. These results also suggest that increased cell proliferation activity strongly correlates with early phase of liver hypertrophy.
Increased expression levels of Gadd45beta mRNA, implying resistance of apoptosis, were significant in the PBO group of both genotypes and in the PB group of wild-type mice, in which marked liver weight increase were seen after 4-week treatment. Decrease of apoptosis is also considered a key event of the MOA, but the PBO group in CARKO mice scarcely showed tumor promotion.
Continuous damage and repair processes are accepted as an important pathway of liver tumorigenesis in rodents. Hepatocyte karyocytomegaly can be induced by some chemicals, including PB, as a result of toxic injury (Thoolen et al. 2010). This change was not observed in the PB group of CARKO mice, in which the incidence of proliferative lesions was very low, suggesting hepatocyte karyocytomegaly might be related to hepatocarcinogenesis. However, continuous damage to the liver was generally not serious in the present study.
CAR is known to be involved in energy metabolism. Lipid accumulation in hepatocytes of the PBO and DBDE groups in 4- and 27-week studies (see Supplemental Figure 2) indicates that these treatments might alter lipid production and degradation under CAR deficiency condition. Lipid accumulation might contribute to the slight increase in liver weight in the DBDE group in Exp. 3.
The present study shows that CARKO mice could be a powerful tool to detect whether liver hypertrophy and/or tumor promotion processes of test chemicals in rodents are CAR mediated. In addition, research to find key factors for rodent hepatocarcinogenesis will be advanced using this model. While PBO treatment in wild-type mice showed PB-like responses such as Cyp2b induction, increased proliferating activity of hepatocytes, resistance of apoptosis, and hepatocellular hypertrophy, resulting in induction of eosinophilic foci/adenomas (Table 5), however, PBO treatment in CARKO mice still showed liver hypertrophy with Cyp2b/Cyp3a induction and a slight increase in tumors, although eosinophilic tumors were drastically decreased. These results indicate that the hepatocarcinogenic MOA of PBO is not completely identical to that of PB, using CARKO mice. We also elucidated that DBDE is not a PB-type hepatocarcinogen since its effects on liver do not correspond with the PB-like hepatocarcinogenic MOA and DBDE induced liver tumors even in the CARKO mice (Table 5).
In conclusion, the present study indicates that CAR plays essential roles in liver hypertrophy in response to DBDE and PB but not PBO. Furthermore, CAR plays important roles in PBO- and PB-inducible hepatocarcinogenesis. Other pathways independent of CAR could be involved in DBDE-inducible hepatocarcinogenesis. We hypothesize that the CAR-mediated liver hypertrophy pathway is different from CAR-mediated liver tumorigenesis in mice.
Supplemental Materials
See Supplemental Figure 1 at (http://tpx.sagepub.com/supplemental) for body weight changes over the course of 27-week treatment of test chemicals.
See Supplemental Figure 2 at (http://tpx.sagepub.com/supplemental) for oil red O stained liver sections after 4 weeks treatments.
See Supplemental Figure 3 at (http://tpx.sagepub.com/supplemental) for the typical cases of eosinophilic and basophilic adenoma.
Footnotes
Acknowledgments
We thank Tomomi Morikawa and Ayako Kaneko for expert technical assistance in performing the animal experiments and processing histological materials.
The author(s) declared no potential conflicts of interest with respect to the research, authorship, and/or publication of this article.
The author(s) disclosed receipt of the following financial support for the research, authorship, and/or publication of this article: This study was supported in part by a grant-in-aid for the research program for risk assessment study on food safety from the Food Safety Commission, Japan (No. 0703 for KN, SO, MY, AN, and MD).
Abbreviations
References
Supplementary Material
Please find the following supplemental material available below.
For Open Access articles published under a Creative Commons License, all supplemental material carries the same license as the article it is associated with.
For non-Open Access articles published, all supplemental material carries a non-exclusive license, and permission requests for re-use of supplemental material or any part of supplemental material shall be sent directly to the copyright owner as specified in the copyright notice associated with the article.