
Abstract
Recent pension reforms have shifted a larger responsibility towards savers. Individuals therefore need better knowledge of the rules and incentives embedded in the pension system to adequately save and prepare for retirement. In this paper, we use a novel Swedish survey matched with high-quality administrative data to show that many lack, and feel that they lack, such pension-specific knowledge. We also show that the most economically vulnerable groups know the least. Linking pension knowledge to behavior, we find that knowing less is associated with lower preparedness for retirement, even after controlling for financial literacy and subjective knowledge. Moreover, a large majority state the complexity of the pension system, or that they have planned to learn more about pensions but that it just hasn’t happened, as reasons for why they do not have sufficient knowledge.
Introduction
During the last decades, pension systems have in many countries been reformed in such a way that individuals or households bear a larger responsibility for their pension incomes. Typically, pension systems have changed from relying on a defined benefit to a defined contribution structure. This transition means that the demographic and financial risks have been shifted from the pension plan administrator to the individual retirement saver. These reforms thus increase the number of choices individuals need to make in the labor market and within the pension system to appropriately prepare for retirement. This heavy reliance on individual competence in the realm of financial decision-making may thus affect the economic well-being in the long run and income inequality in old age. 1
As pension choices are complex and contingent on many rules, these reforms require individuals to learn more about the pension system in order to make good choices and plan adequately for retirement. Previous studies have documented a link between retirement planning and general financial literacy (Lusardi and Mitchell 2014). In particular, those with lower financial literacy amass less retirement wealth (Behrman et al. 2012), are less likely to plan for retirement (Lusardi and Mitchell 2011b; Kalmi and Ruuskanen 2018) and have less diversified pension portfolios (Koh et al. 2020). 2 However, while general financial knowledge is important for making good financial decisions, it may not be enough, as discussed by Hastings and Skimmyhorn (2013) and Fernandes et al. (2014), to prepare individuals for the relatively sophisticated and infrequent choices related to pensions, such as how much to save, where to invest and when to retire. Individuals may need to have more specific knowledge about the pension system to make rational decisions.
As a result, other studies have examined the role of knowledge more specifically linked to pensions. In particular, many retirement savers have been shown to be ignorant about their own pension situation and the incentives they face. As for such individual-specific knowledge, individuals may not know about how much they contribute to retirement (Gustman and Steinmeier 2005; Chan and Stevens 2008), the potential size of their future pension (Gustman and Steinmeier 2004; Maunu 2007; Barrett et al. 2015) and pension choices they may have made in the past (Hagen 2022). Chan and Stevens (2008) further show that those who are ill-informed or ignorant about their pension wealth during the savings phase are more likely to choose sub-optimal retirement dates and fail to respond to built-in incentives in the pension system, compared to the well-informed. 3
In contrast to such individual-specific knowledge, individuals may also lack knowledge about the rules and incentives embedded in the pension system at a more general level. Landerretche and Martínez (2013) explore the importance of system-specific knowledge and show that Chileans with greater knowledge about the pension system are more likely to have additional retirement savings. Exploiting time and cross-country variation in pension regulations in several European countries, Bucher-Koenen et al. (2019) show that the effect of pension reforms on individuals’ labor supply decisions is driven by individuals with a good knowledge of such reforms. 4
Using a novel and detailed large-scale survey on individuals’ knowledge about pensions, we evaluate how well-informed the public is about their own pension and the pension system, document socioeconomic and demographic gradients in pension knowledge, as well as reasons for why so many seem to lack adequate pension knowledge. We also analyze the relationship between pension knowledge and preparedness for retirement and compare the role of pension knowledge with financial literacy for a large battery of questions capturing various aspects of retirement planning.
With our broad survey design we can also differentiate between many aspects of pension knowledge. First, we differentiate between system-specific knowledge that is related either to the phase of building up a pension capital—the accumulation phase, or to the phase when the pension is taken out—the decumulation phase. Second, by matching administrative register data to our survey results, we can identify the individual-specific pension knowledge in terms of accumulated contributions and pension fund management choices. Third, we compare if individuals’ subjective knowledge of the pension system works different from their objective pension knowledge in explaining retirement preparedness. Previous studies have shown that self-perceptions of financial knowledge—conditional on actual knowledge—may influence financial behaviors and retirement preparedness (Allgood and Walstad 2016; Anderson et al. 2017; Angrisani and Casanova 2019). To our knowledge, we are the first to study the role of subjective versus actual pension knowledge on retirement preparedness. Finally, we contrast our measures of pension knowledge vis-à-vis more general financial knowledge by controlling for financial literacy. The only study we are aware of that simultaneously considers the role of financial literacy and knowledge about the pension system for retirement planning is Pedroni and Rieskamp (2015). 5
The survey was conducted at the end of 2017 and early 2018 and was sent to 12,000 randomly selected individuals between the ages of thirty one and sixty (born 1957–1986) with a response rate of about 30 percent. In the survey, we ask factual questions about the Swedish pension system that pertain both to the accumulation phase (e.g., fee levels and at what levels pension contributions are capped or increases) and payout phase of retirement (e.g., retirement ages and withdrawal periods). We also ask the “Big 3” questions on financial literacy (Lusardi and Mitchell 2014), allowing us to address the role of specific pension knowledge while accounting for financial literacy. The survey responses are matched to individual-level administrative data on pension contributions and fund management choices in the public pension system, as well as a rich set of socioeconomic and demographic variables, including test results from a cognitive ability test taken by young men at the mandatory military enlistment.
We ask respondents a number of questions that relate to retirement planning: whether they have tried to figure out how much they need to save for retirement, if they save for their retirement, if they have planned at what age they will retire and if they have made a forecast of their pension. We also ask how they feel about their retirement preparedness: if they are happy with the amount that they save, and to what extent they worry about their pension.
Our first finding suggests that a large fraction of the population of retirement savers lack basic pension knowledge. More than two thirds of the respondents in our survey also say that they do not have sufficient knowledge to understand how their own choices affect their future pension. When analyzing the answers to a large number of factual questions, this picture is reinforced as a large majority was not able to answer even half of the questions correctly.
Second, we also document a large degree of heterogeneity in pension knowledge: it is on average lower among younger, the less educated, low-income earners and women. Notably, these groups are more vulnerable to economic distress, suggesting that those who lack knowledge could be those that need it the most.
Third, we find that individuals are more informed about the rules surrounding the decumulation (payout) phase compared to the accumulation (savings) phase or their individual-specific circumstances (e.g., own pension wealth).
Fourth, using multiple regression analysis, we find that pension knowledge is highly correlated with different retirement planning outcomes. Those who have more knowledge about the Swedish pension system are more likely to have planned or be prepared for their retirement than those who have less of that specific knowledge. In addition, we find that specific knowledge about the pension system is more important for decision-making related to retirement than general financial literacy. Similar to the results for objective knowledge, we find that those who believe they lack adequate pension knowledge are also less likely to plan for retirement. In addition—and different from the results for objective knowledge—we find that they are more worried about their pension and less likely to be satisfied with their current savings. Individuals who are more ignorant about their own pension, that is, score lower on the individual-specific pension questions, also worry more about their future pension.
Fifth, to get at the question of why so many lack adequate knowledge, we ask individuals who perceive themselves as ignorant why they have not acquired sufficient pension knowledge. Close to 80 percent point out the complexity of the pension system as an obstacle to acquire adequate knowledge, and about as many state that they had planned to learn more about the pension system, but that it “just hasn’t happened.” In fact, the latter share is fairly constant across different age groups, indicating substantial procrastination. To explore whether individuals’ ability to understand the pension system, as well as whether procrastination plays a role in explaining individuals’ lack of pension knowledge, we use questions about respondents’ time preferences and math skills. 6 We find that those who are impatient, tend to procrastinate and have low math skills have comparatively little pension knowledge, supporting the notion that the complexity of the pension system and individuals’ tendencies to procrastinate are plausible causal mechanisms for the lack of pension knowledge.
Our design and results broadly contribute to the large literature on pension choices, addressing the question on how to prepare individuals for retirement and the role of knowledge. In addition, our study contributes by studying Sweden, a particularly interesting case to study as it was one of the first countries to reform the pension system in response to the challenge imposed by an ageing population. The reform, which was implemented in 1999, resulted in a shift from defined benefit to defined contribution, and introduced individually managed mutual fund portfolios (Barr 2013; Hagen 2017). Because the reform shifted responsibility from the government to the individual retirement savers, individuals need to be more knowledgeable about the pension system in order to plan well for their financial well-being at older ages. Moreover, in 2017, 16 percent of all elderly (65+) in Sweden were at risk of poverty, that is, having an income lower than 60 percent of median income (Eurostat, 2019), indicating that many have not saved enough. This share is slightly below the EU average, but well above the other Nordic countries where 6–13 percent of the elderly are at risk of poverty. The design of the Swedish pension system has also caught considerable attention, most recently by Cronqvist et al. (2018) showing that nudges built into the choice architecture have had persistent effects on choices within the system (see also, e.g., Cronqvist and Thaler 2004; Palme et al. 2007; Cesarini et al. 2010; Hagen et al. 2022). However, while this previous literature has studied the outcome of these choices, we study the direct knowledge of the choice-architecture. The system has now been in effect for around twenty years, giving individuals ample time to adapt. It is therefore a good time to evaluate whether individuals know enough about the pension system to make informed choices regarding their future retirement.
The rest of the paper is structured as follows. Section “Institutional Background” provides an institutional background to the Swedish pension system. Section “Data” describes the survey and the register-based data sources. Section “Results” presents the results and Section “Concluding Remarks” concludes.
Institutional Background
The Swedish pension system has three pillars: a universal public pension system, quasi-mandatory occupational pensions (for workers whose employer is tied to some occupational pension plan) and private savings. Below, we discuss these pillars briefly (for a more detailed description of the Swedish pension system, see, Barr 2013 and Hagen 2013, 2017). The purpose is to provide some essential information about the system retirement savers need to be knowledgeable about.
The public pension is the most important source of pension income for most retirees. The current public pension system in Sweden was introduced in 1999, being changed from a defined-benefit (DB) to a predominantly defined-contribution (DC) system. The total contribution to the public pension system is 18.5 percent of the salary and other taxable benefits up to a maximum level (the income ceiling). 7
The public pension system has in itself three tiers. The first two tiers are income-related and are referred to as the income pension and the premium pension, to which 16 percent and 2.5 percent of earnings are contributed, respectively. The income pension is a pay-as-you-go system which indexes pension rights to the average wage growth in Sweden. Contributions to the premium pension are allocated to individual financial accounts where individuals choose how to invest their funds. 8
The monthly pension in each of these components is calculated by dividing the pension capital that an individual has accumulated at retirement by an annuity divisor. 9 The size of the pension capital is therefore a function of past pension contributions and the return of these contributions.
There is no set age at which people must retire in Sweden, nor is there an upper age limit on how long an individual may work. However, the public pension can be paid out at the earliest at age sixty one, while unemployment protection is lifted at age sixty seven (as of 2022, these ages have been changed to sixty two and sixty eight, respectively). The third tier is called the minimum guarantee and is paid out to pensioners above sixty five years of age who have low or no earnings-related pension.
The second pillar consists of a number of different occupational, employer-provided pension plans. A similar transition to a DC system as that in the public pension has taken place also in the occupational pension system. In the old DB system, transferability of accumulated assets was limited, and benefits after retirement were typically received in the form of life annuities. Currently, individuals can choose how to invest their occupational pension wealth and the pension can be paid out during a fixed number of years (minimum of five years) as an alternative to lifetime annuitization (Hagen 2015). Available estimates suggest that at least 90 percent of the total work force today are covered by the four major occupational pension plans (Kjellberg 2018; The Swedish Social Insurance Inspectorate 2018). Contributions to the second pillar are essentially proportional to income up to the income ceiling. The employer is mandated to contribute between 4 percent and 6 percent of the wage that does not exceed the income ceiling. For wages above this threshold, marginal contribution rates are much higher, typically around 30 percent. The minimum claiming age is in most cases fifty five, and the pension is typically paid out from age sixty five if no action is taken. 10
The third pillar consists of private savings. Up until 2016 there were tax incentives to save in individual retirement accounts, but the tax rebate has since been abolished. Any long term savings can thus be considered as retirement savings, depending on the intention behind the saving and how it eventually affects personal finances during retirement.
In 2018, the average pension in Sweden was 17,589 SEK (roughly equivalent to 2,000 USD or 1,800 EUR) per month before taxes, of which 68 percent, 27 percent, and 5 percent can be attributed to the first, second, and third pillar (only the tax-favored individual retirement accounts mentioned above), respectively. 11 The net replacement rate was 53.4 percent, slightly below the OECD average of 58.6 percent (OECD, 2020).
Data
At the end of 2017 and early 2018, we conducted the survey Economy and Pension 2017. 12 The purpose of the study was to measure Swedish retirement savers’ knowledge of—and attitudes towards—the pension system.
The survey was sent to 12,000 randomly selected individuals between the ages of thirty one and sixty (born 1957–1986). The sample was stratified on age such that 6,000 individuals in the age group thirty one to fifty (born 1967–1986) were selected (300 each year), while 6,000 individuals in the age group fifty one to sixty (born 1957–1966) were selected (600 each year). The age range is motivated by the fact that the focus is on retirement savers, that is, people of working age who have not yet retired.
The survey consisted of ninety six questions divided into four parts. In the first part, we tested respondents’ knowledge of the pension system by asking factual questions on, for example, fee levels, retirement ages and withdrawal periods, within both the occupational pension and the public pension. In the second part, we asked questions about the survey participants’ own pension, for example, if they had tried to figure out how much they need to save for retirement, at what age they plan to retire, if they know how much pension capital they have, if they save privately for retirement and if they are satisfied with their savings. We also asked whether the respondents considered themselves to have sufficient knowledge about the pension system to understand how their own choices affect their future pension income. In the third part, we asked questions about the respondents themselves, including about their income level, housing type, debt and assets, and perceived health. Finally, a number of questions on financial literacy, economic preferences and attitudes towards different economic situations were drawn from international research in the field.
The survey data are matched with register-based data from several different sources. From Statistics Sweden we retrieve data on gender, marital status, labor market status and highest attained education level. From the Swedish Pensions Agency we observe each individual’s earned pension rights and pension capital in both the income and premium pension 13 , as well as the entire history of fund choices for the individual’s premium pension capital. Finally, from the Swedish Military Archives we obtain the results from a cognitive ability test used by the Swedish military in preparation for the compulsory military service. To perform the matching, all data (both survey and register data) were sent to Statistics Sweden who used the individuals’ social security number (swe: “personnummer”) to match the data. A code key was created and the social security number was removed such that we only had access to pseudonymized data. More information about the register-based variables is given in Section “Register-Based Variables and Sample Selection” in the Appendix.
Sample Selection
Out of the sample of 12,000 individuals (which we term the full sample), 3,526 answered the survey (which we term the response sample), resulting in a response rate of about 30 percent. Out of these, slightly less than 60 percent of the survey respondents agreed to let us add register data to their responses. We remove respondents who did not finish the survey, as well as observations where register data are missing. Furthermore, in the survey, we also asked about the gender and year of birth of the respondents, and we remove the twenty one respondents where the survey answers do not match the register variables, as such a mismatch suggest that a different person than the intended answered the survey. In the end, we are left with 1,976 respondents, which we term the final sample.
Because these respondents are self-selected, it is important to study to what extent they are representative of the target population of interest. Table A1 in the Appendix shows how the register-based covariates in the sample compared to known values of the target population. The table shows that the response rate is higher among older individuals, women, married, employed, highly educated and individuals with larger income pension capital.
Based on these results, respondents seem likely to be in a better economic situation than non-respondents, and we may also suspect that they are more knowledgeable about the pension system and more financially literate. 14 For our results to be representative of the Swedish population age thirty one to sixty, we therefore need to account for the sample selection. We do so by using the entropy balancing technique suggested by Hainmueller (2012). With this method, weights are constructed such that the weighted sample has means of the observed covariates that exactly correspond to the means in the target population. A unique set of weights are found by minimizing the deviation from some base weights, which in our case is one for all observations. 15 The covariates we use are those that are listed in table A1. In section “The Distribution of Pension Knowledge,” we discuss in more detail how the entropy balancing helps to mitigate the issue of sample selection.
Measuring Knowledge
To measure individuals’ objective knowledge about their own pension and the Swedish pension system, we asked a total of nineteen questions, listed in table 1, which had one correct answer per question. Three of the questions dealt directly with the survey participants’ individual pension capital, where the correct answers come from the register data from the Swedish Pensions Agency. The three questions covered knowledge of the total income pension and premium pension capital of the survey participants, as well as whether they could correctly identify the number of active fund choices they had made in their premium pension portfolio. Ten of the questions covered knowledge of the public pension system, while the final six questions pertained to the occupational pension system. We construct a “pension knowledge index” as the share of correct answers on the nineteen questions. The full questions and answers are provided in table A1 in the Appendix.
Descriptive Statistics of Knowledge Questions.
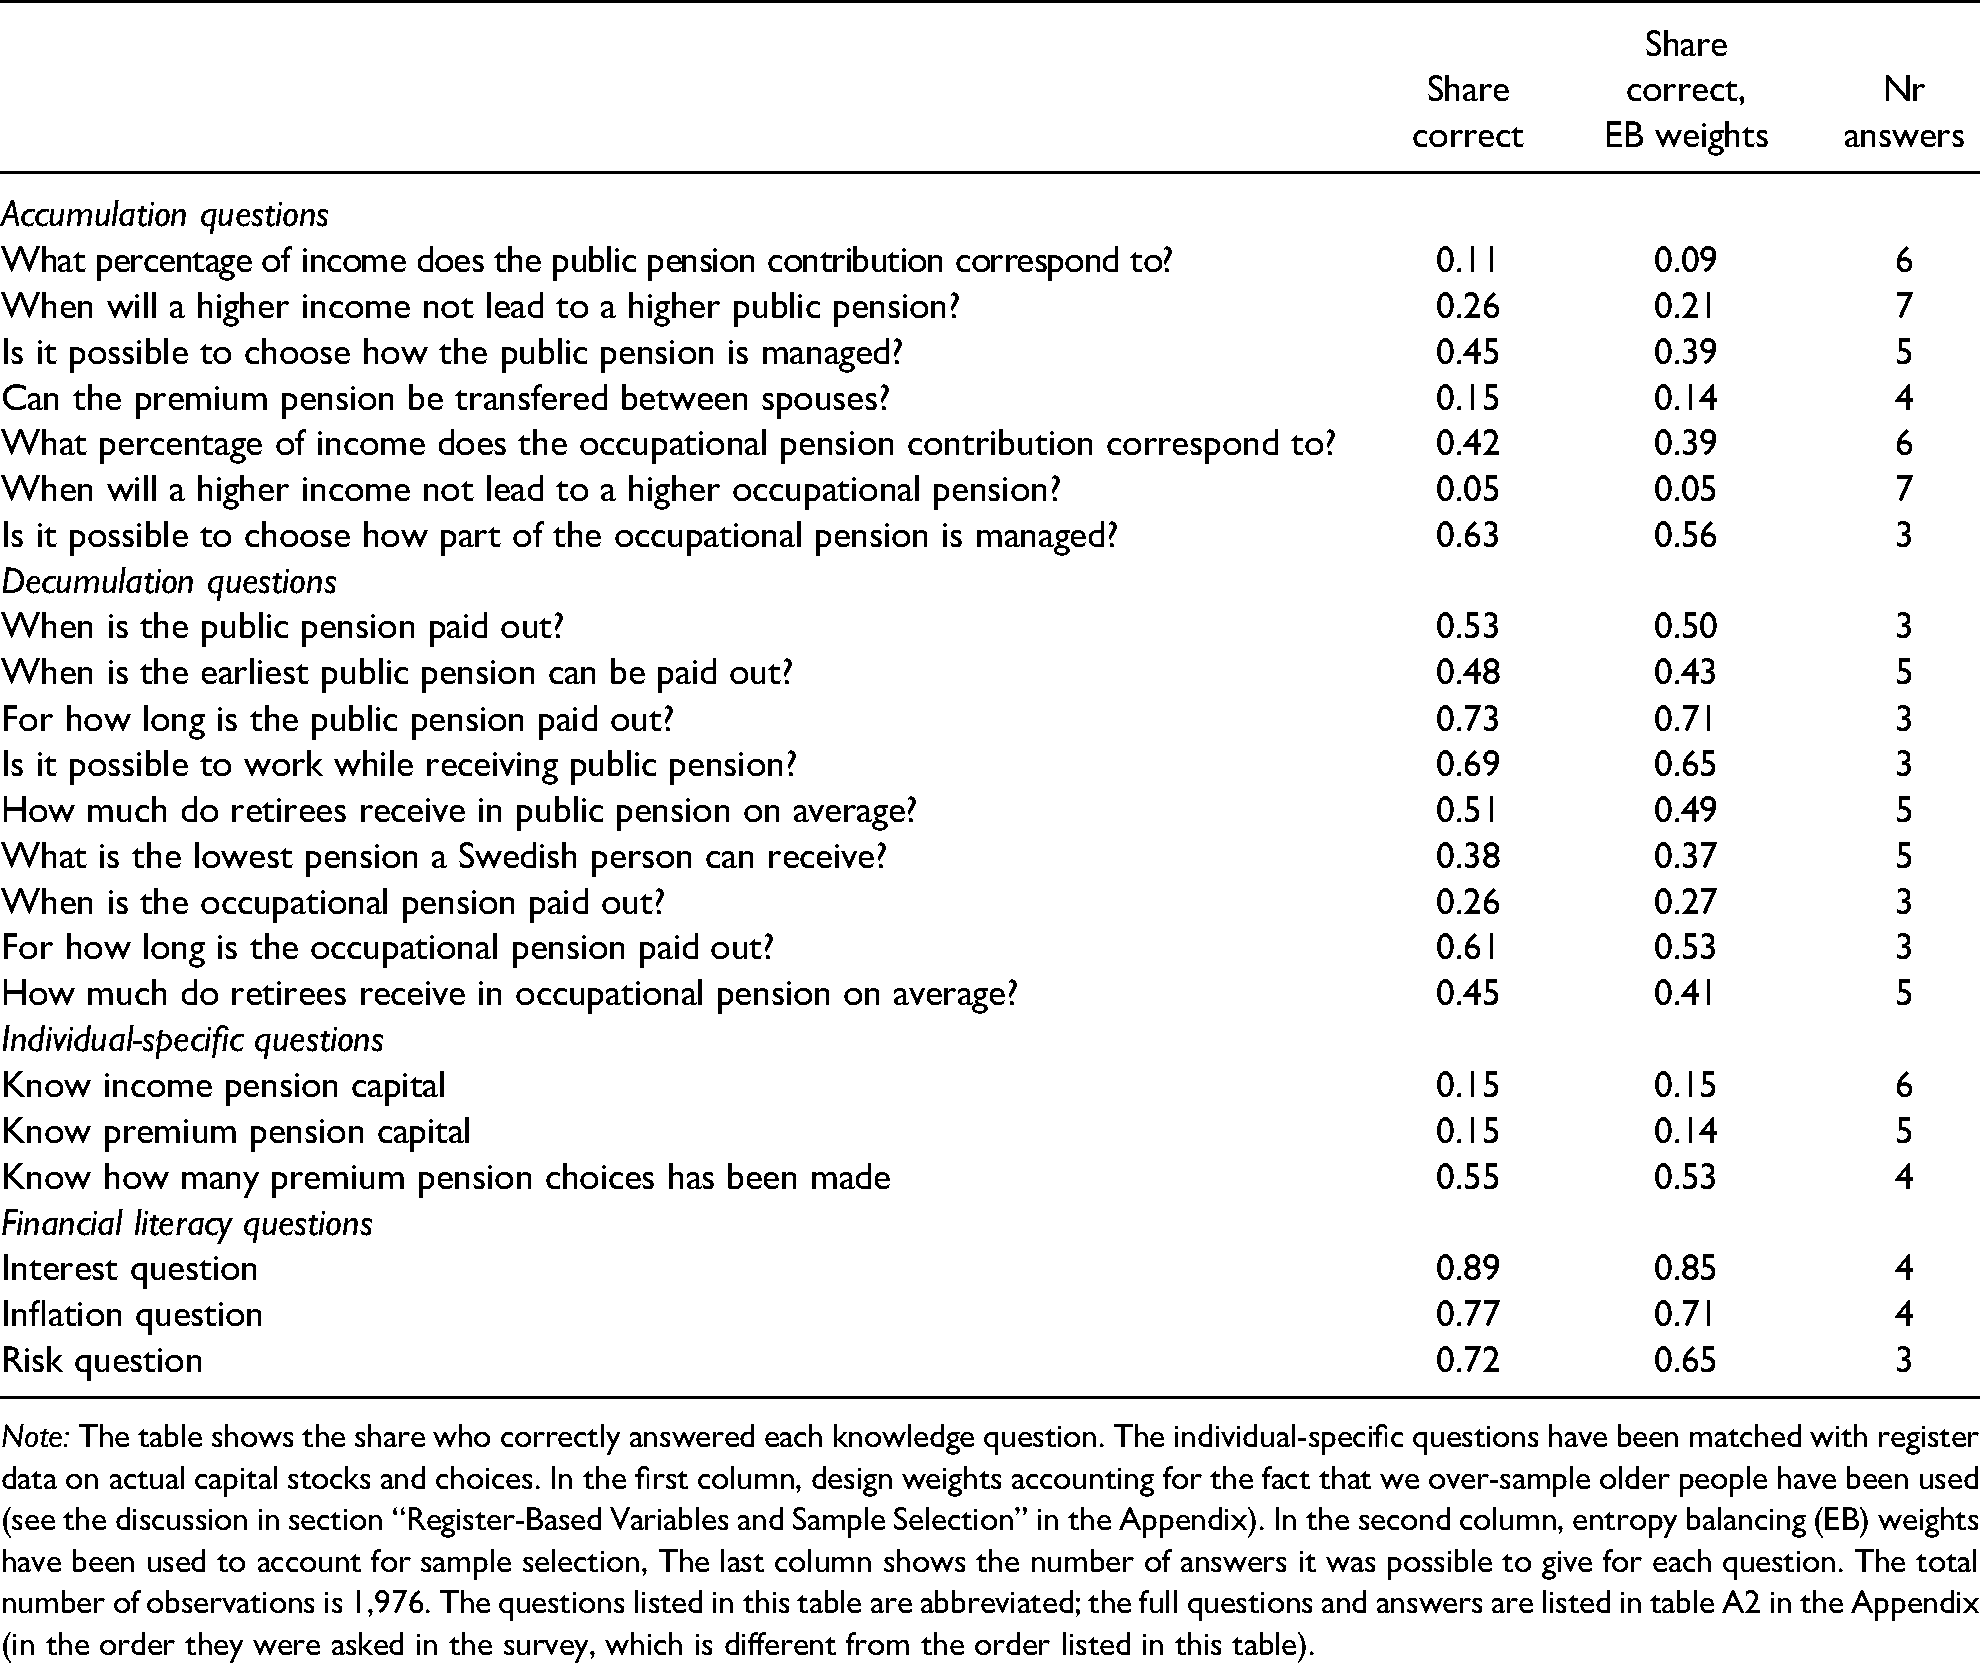
Note: The table shows the share who correctly answered each knowledge question. The individual-specific questions have been matched with register data on actual capital stocks and choices. In the first column, design weights accounting for the fact that we over-sample older people have been used (see the discussion in section “Register-Based Variables and Sample Selection” in the Appendix). In the second column, entropy balancing (EB) weights have been used to account for sample selection, The last column shows the number of answers it was possible to give for each question. The total number of observations is 1,976. The questions listed in this table are abbreviated; the full questions and answers are listed in table A2 in the Appendix (in the order they were asked in the survey, which is different from the order listed in this table).
We further divide the pension knowledge index into three sub-indexes to measure different aspects of pension knowledge: two of these are system-specific—knowledge about the accumulation phase of a pension wealth 16 and knowledge about the decumulation phase 17 , while the third is individual-specific—knowledge about accumulated pension wealth in the public pension components, along with knowledge about how often they have made changes to their individual fund portfolio in the premium pension. 18 The indexes are constructed as the share of correct answers on the respective questions.
These pension knowledge indexes give a detailed account of individuals’ knowledge of several aspects of their pension and the pension system. However, depending on individual circumstances, different aspects of the pension system may be more or less important to adequately prepare for retirement. We therefore complement our objective measure of pension knowledge in the survey with the following question: “Do you have sufficient knowledge about the pension system to understand how your own choices affect your future pension?” We contrast this subjective knowledge with objective knowledge about pensions.
To assess the role of pension knowledge separately from that of financial literacy, we also asked the three standard questions on financial literacy (the “Big 3” for measuring financial literacy, see more details in Lusardi and Mitchell 2014) on interest compounding, inflation and diversification (stock risk). In section “Register-Based Variables and Sample Selection” in the Appendix, we list the three questions (see Table A3) and show that results are comparable to previous evidence from Sweden.
Results
The Distribution of Pension Knowledge
A first notable result from assessing our pension knowledge index is shown in figure 1, which shows the distributions of our measures of pension knowledge: nobody answered all questions correctly and a clear majority answered less than half of the questions correctly. The solid line shows the distribution of knowledge among the final sample of the 1,976 individuals who agreed to let us add register data. On average, these individuals answered 7.5 of the nineteen questions correctly. 19 The figure also shows how the share answering that they have sufficient knowledge about the pension system is related to the pension knowledge index (dotted line). The strong upward trend makes it clear that subjective knowledge is strongly related to objective knowledge as respondents with more correct answers to the objective knowledge questions are also more likely to say that they have sufficient knowledge about the pension system. For instance, among individuals with more than fifteen correct answers, almost 90 percent said that they had sufficient knowledge, whereas among those with fewer than 5 correct answers the corresponding number was 15 percent. On average, 28 percent claimed to have sufficient knowledge.
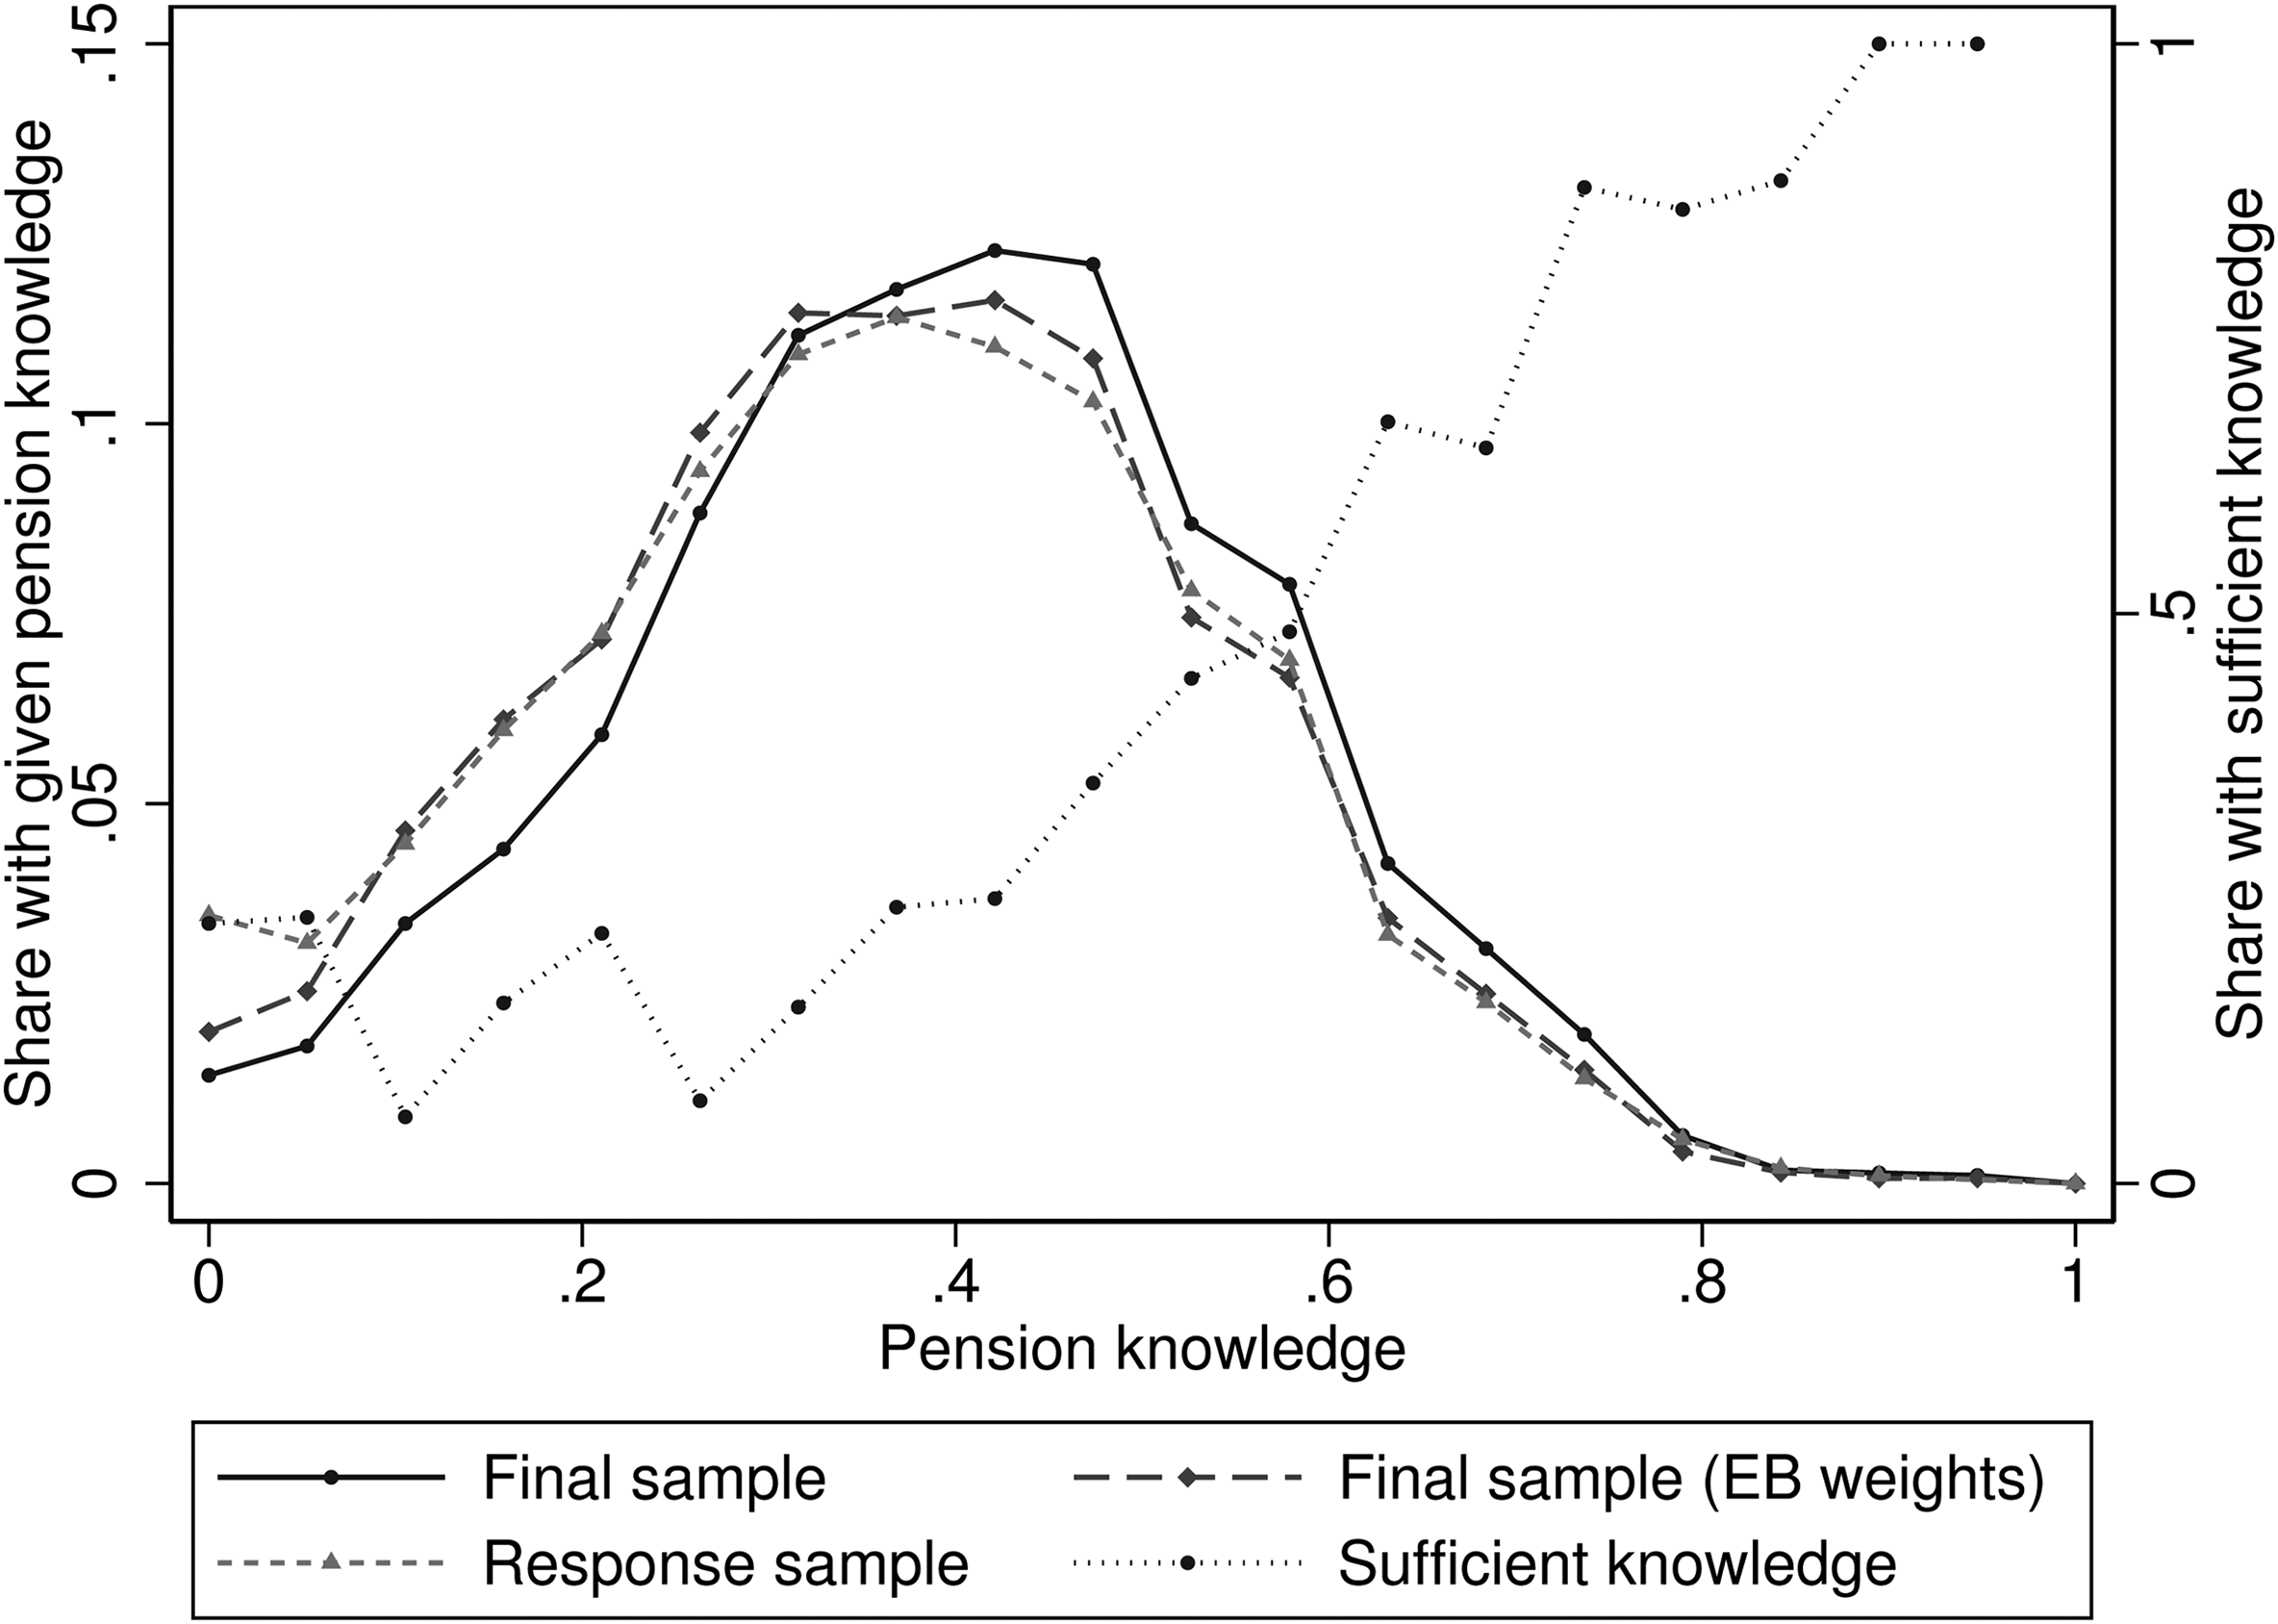
Distribution of pension knowledge. Note: The figure shows the distribution of share of correct answers (the pension knowledge index) for the final sample, using design weights (solid line, see section “Register-Based Variables and Sample Selection” in the Appendix) or entropy balancing weights (long dashed line). The distribution of the pension knowledge index is also shown for the response sample weighted with design weights (short dashed line). The dotted line shows the share of individuals for a given knowledge level who consider themselves to have sufficient knowledge to understand how their own choices affect their future pensions (for the final sample, weighted with entropy balancing weights). The number of observations with data on the pension knowledge index is 1,976 for the final sample and 3,439 for the response sample.
As discussed in section “Sample Selection,” our survey sample is most likely selected in the sense that those who are more knowledgeable about the pension system are more likely to answer the survey. To mitigate the issue of sample selection, we balance on variables which we believe are likely to cause such selection issues, such as education, age and gender. The dashed line in figure 1 shows that after we use entropy balancing weights (EB weights), the distribution of knowledge is shifted slightly to the left with the estimate of the average number of correct answers dropping to 7.0 out of nineteen. The fact that the knowledge level drops when we use entropy balancing weights strengthens the notion that the sample is positively selected from the population (see the discussion in sections “Sample Selection” and “Register-Based Variables and Sample Selection”). 20
Because our sample may also be selected in terms of who agreed to match register-based information to their survey responses, figure 1 also shows the distribution of pension knowledge in the response sample, including the individuals who did not agree to the use of register data. Reassuringly, the distribution for the response sample is quite similar to the distribution in the final sample (the average number of correct answers in the response sample is 6.9), especially once entropy balancing weights are used, in which case the distributions are virtually identical.
We conclude that regardless of how we deal with sample selection, most individuals lack significant knowledge about their pension and the pension system. The results also suggest that the entropy balancing weights work well in dealing with the sample selection issue and for the rest of the paper, we only show results for the final sample with entropy balancing weights.
Figure 2 shows the distribution for the three subindexes: the accumulation index, the decumulation index, and the individual-specific index. From the figure, it can be seen that respondents in general are more knowledgeable about the decumulation part of the pension system than they are about the accumulation part or their own pension. On average, the average share of correct answers is around a half for the decumulation index, but only around a quarter for the other two indexes.
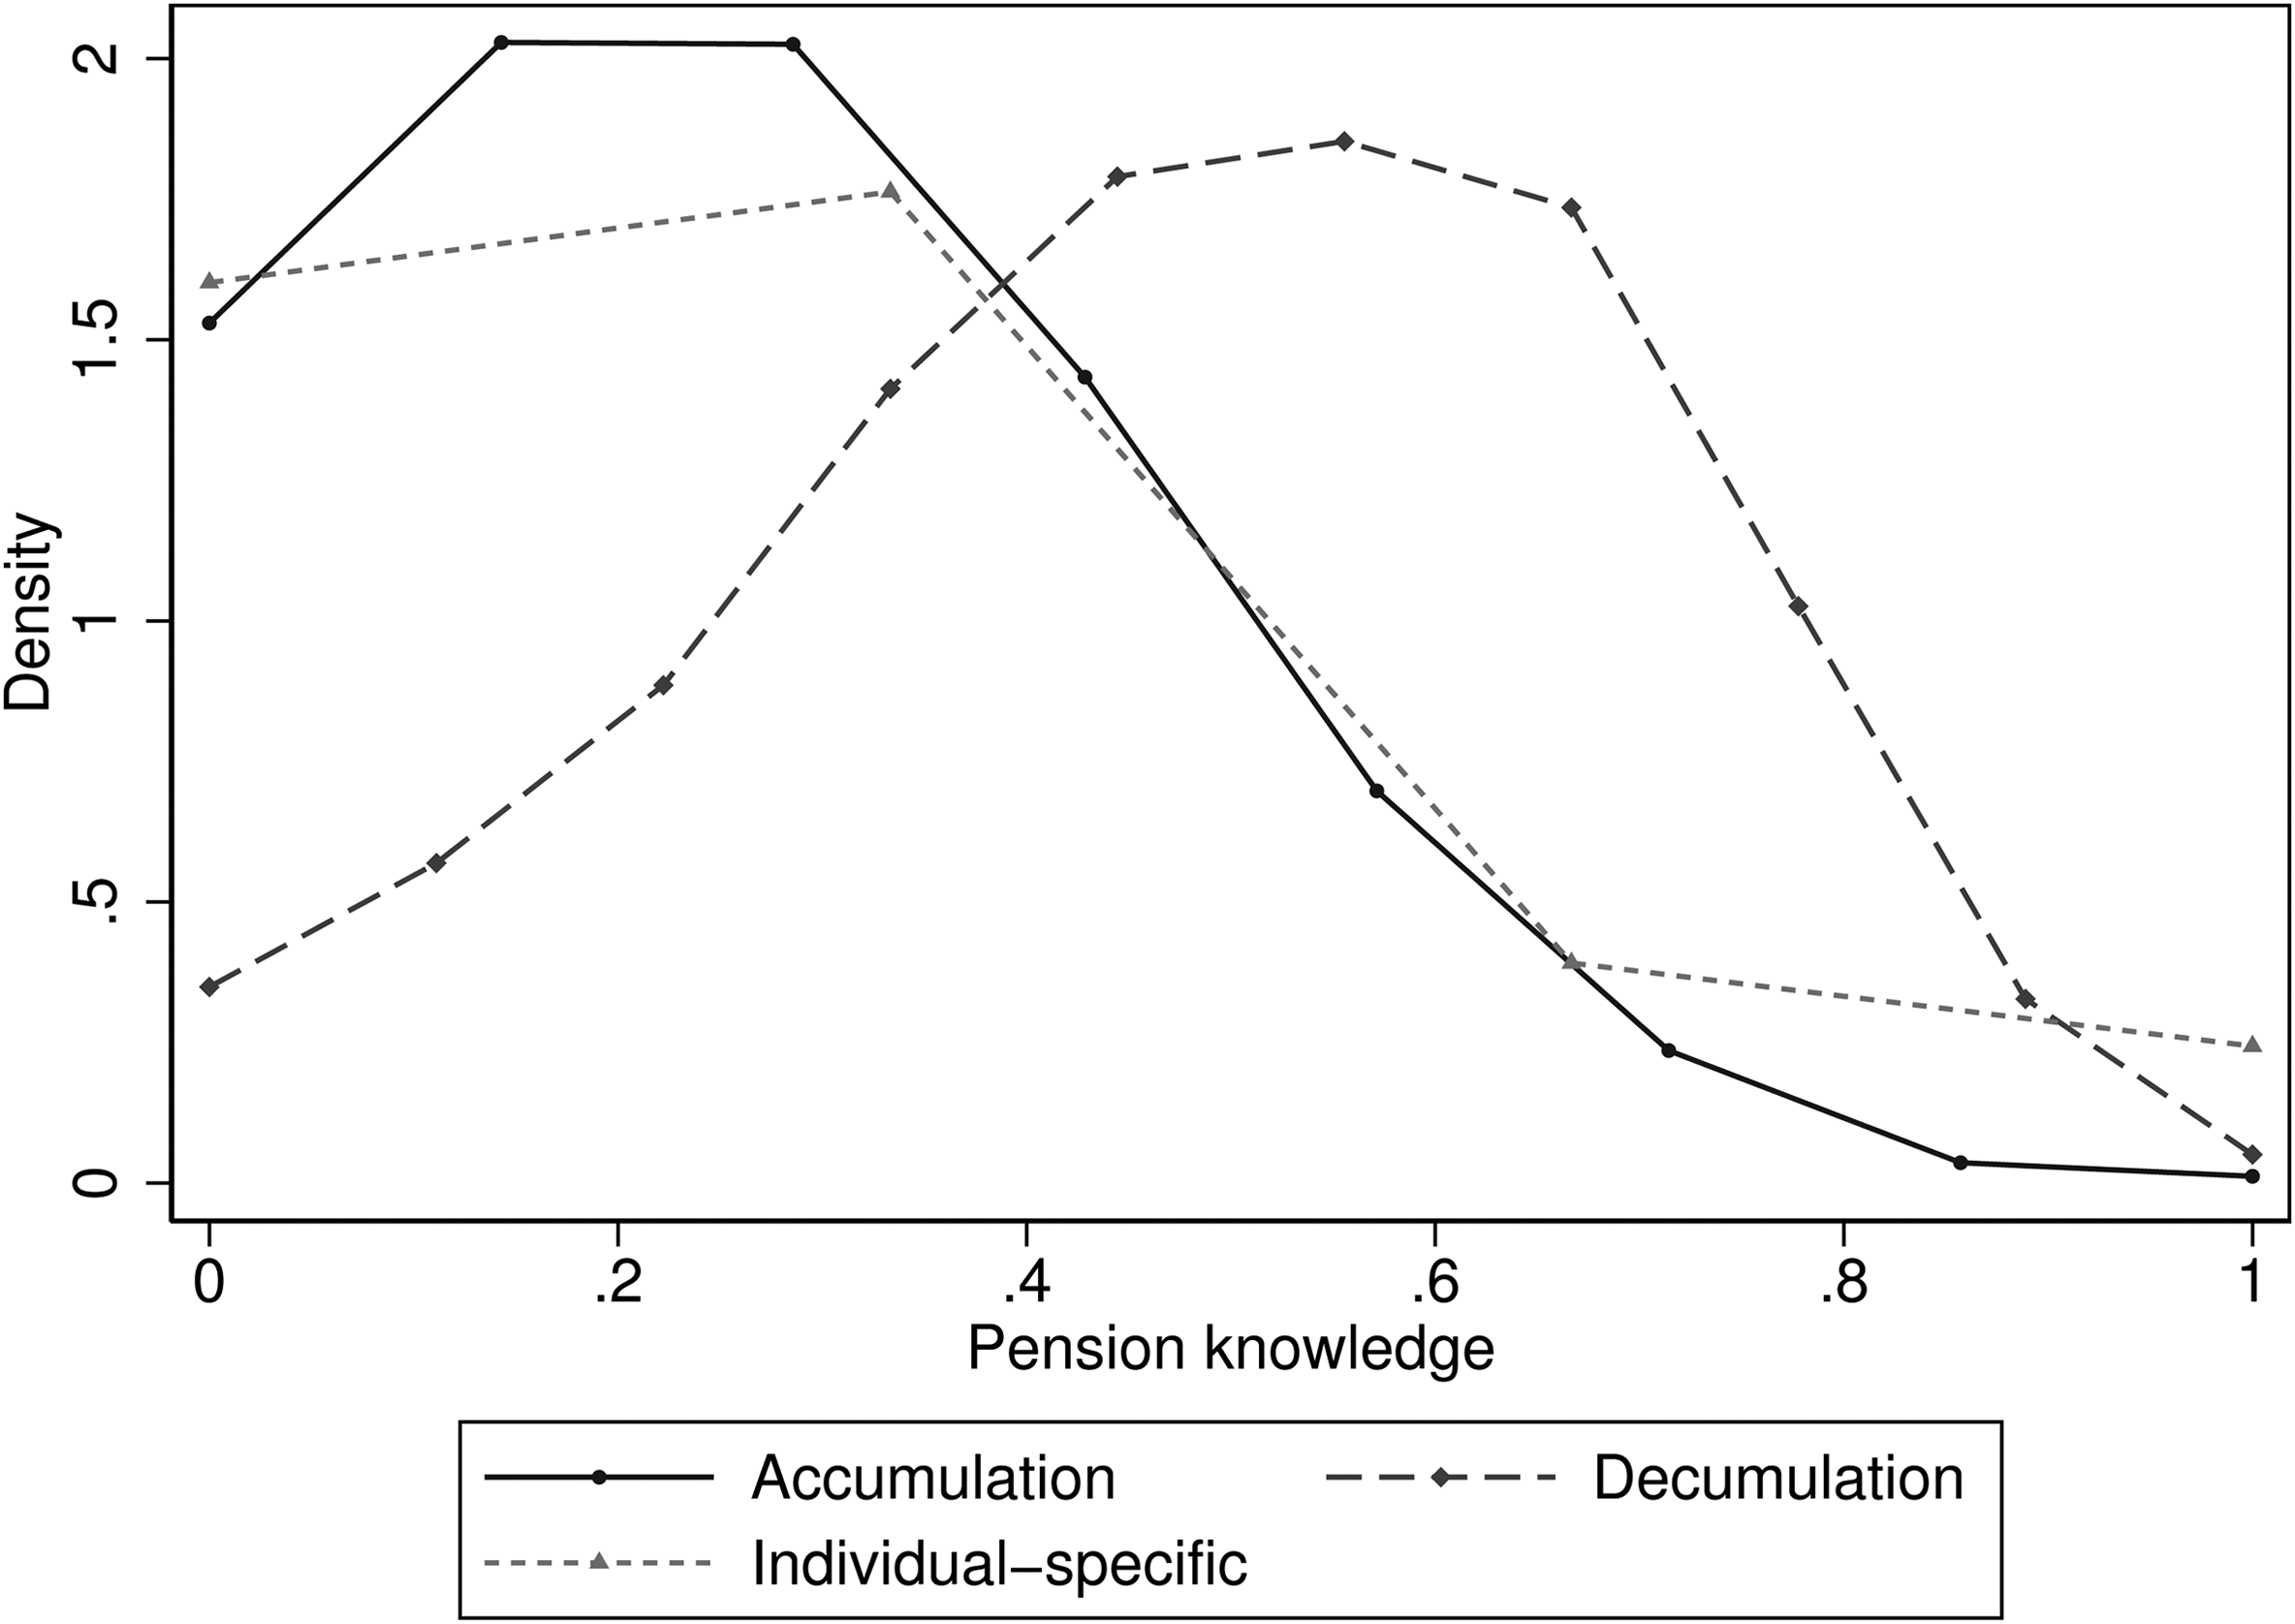
Distribution of sub-indexes of pension knowledge.
Note: The figure shows the distribution of the share of correct answers for the three sub-indexes of pension knowledge. Note that the
Socioeconomic and Demographic Differences in Knowledge
To examine knowledge heterogeneity among Swedish retirement savers, we regress pension knowledge on the different socioeconomic and demographic variables listed in table A1. The results are shown in column (1) of table 2, where the pension knowledge index have been standardized to have a mean of zero and standard deviation of one, to facilitate the interpretation of the different variables.
Socioeconomic and Demographic Differences in Knowledge.
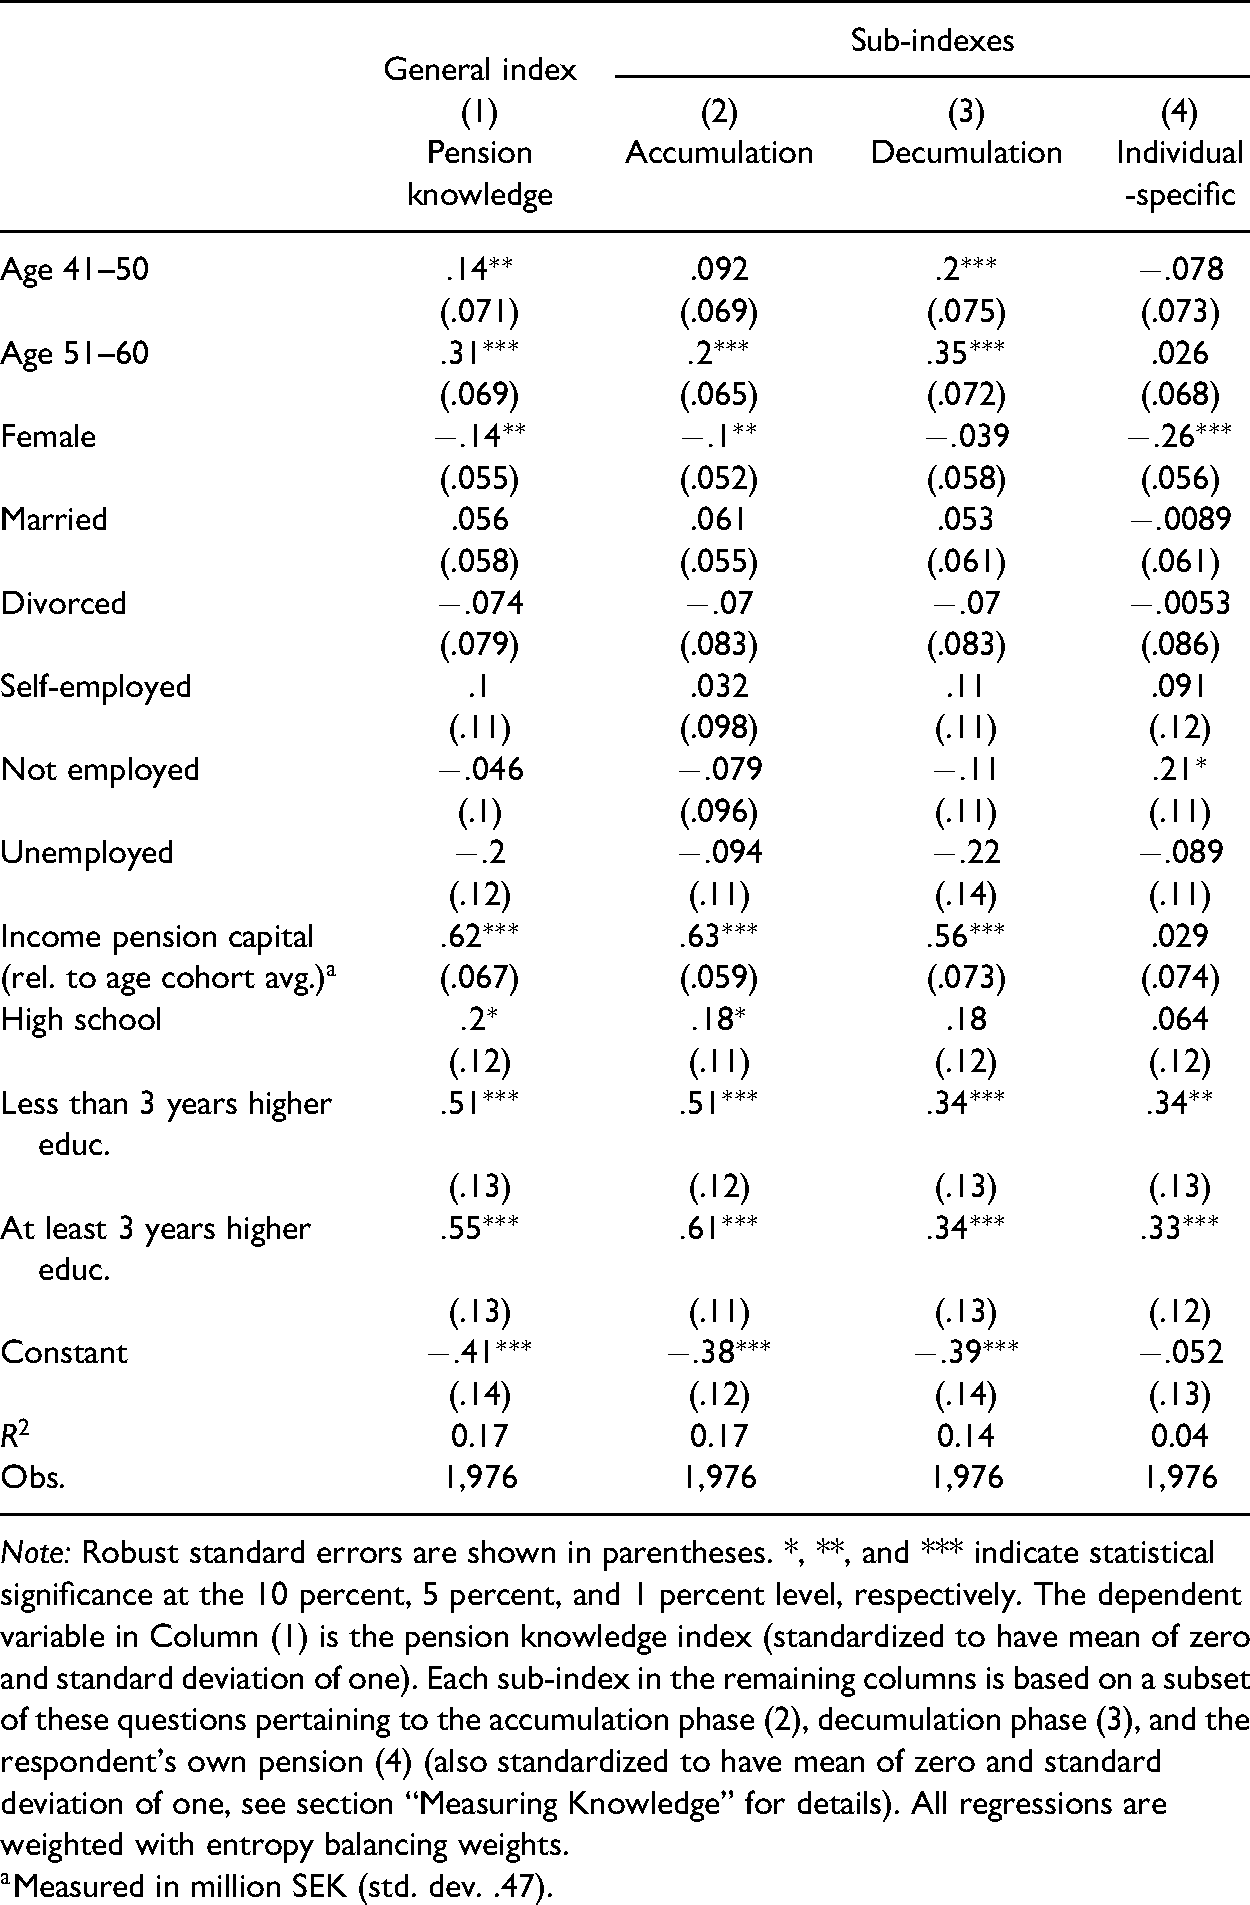
Note: Robust standard errors are shown in parentheses. *, **, and *** indicate statistical significance at the 10 percent, 5 percent, and 1 percent level, respectively. The dependent variable in Column (1) is the pension knowledge index (standardized to have mean of zero and standard deviation of one). Each sub-index in the remaining columns is based on a subset of these questions pertaining to the accumulation phase (2), decumulation phase (3), and the respondent’s own pension (4) (also standardized to have mean of zero and standard deviation of one, see section “Measuring Knowledge” for details). All regressions are weighted with entropy balancing weights.
We find that pension knowledge is increasing with age; those aged fourty one to fifty and fifty one to sixty have significantly higher scores on the pension knowledge index compared to individuals aged thirty one to fourty. Gender is also important with women being on average less knowledgeable about pensions than men. Furthermore, pension knowledge differs by marital and labor market status, although there is substantial uncertainty in the estimates. Compared to singles (the baseline category), married individuals know slightly more while divorced know less. We also find that those with an unemployment history during 2016 are less knowledgeable.
As may be expected, there is a strong positive gradient along income history and education. These characteristics (together with age) are also the most important in terms of magnitude in explaining differences in pension knowledge. To measure income history we use the accumulated pension wealth in the income pension component of the public pension system which is a rough indicator of an individual’s labor income history. 21 We standardize this variable by removing the average value within the same birth cohort. Our results show that having a large pension wealth relative to others in the same birth cohort is a strong predictor for pension knowledge. Having a higher education is also associated with having a higher level of pension knowledge.
Taken together, we find stark differences in pension knowledge among different groups. For instance, based on the regression results, an unemployed woman aged thirty one to fourty with elementary schooling and with an average income pension capital, are predicted to have almost two standard deviations lower pension knowledge than an employed man aged fifty one to sixty with university education and with one million SEK more in pension capital relative to his peers.
To investigate if some groups have more or less knowledge about the rules and incentives applicable to the time when they accumulate the pension income, to the time when the retirement capital is taken out, or to their own pension levels, Columns (2), (3), and (4) of table 2 report corresponding estimates of socio-economic and demographic differences for the sub-indexes relating to the accumulation phase (2), decumulation phase (3), and the individual’s own pension (4), respectively. 22
While we mainly see a similar pattern to the one shown for the full pension knowledge index, some characteristics stand out. The strong age gradient found for pension knowledge is mainly explained by knowledge of the decumulation phase. This result makes sense as knowledge of these issues are more important for individuals closer to the retirement age. In addition, no gender gap is prevalent in knowledge of the decumulation phase, while there is a significant gap in the knowledge of the accumulation phase or of the individuals’ own pension knowledge. The fact that women are significantly less knowledgeable about the accumulation phase is especially noteworthy as women are more likely to work part-time and take longer parental leave than men, decisions which generally have a negative effect on pension accumulation.
Pension Knowledge and Retirement Planning
To understand how pension knowledge and retirement planning are correlated in our survey, we use six retirement related questions or statements.
23
Plan retirement saving: “I have tried to figure out how much I need to save for retirement.” Respondents could give an answer from one to five ranging from “completely disagree” to “completely agree.” This question has been used frequently in the literature when studying retirement planning and financial literacy (see, Lusardi and Mitchell 2011b for an overview of this research). We consider respondents to have planned if they answered at least a three on the five-point scale, which is true for 32 percent of respondents in the sample. Plan retirement age: “At what age do you plan to retire?” Possible answers include five age intervals and “I have started to collect my pension” and “I have not thought about that yet.” The dependent variable is a dummy that equals one if the respondent mentions a specific age interval or have already started to collect pension, and zero otherwise. Sixty six percent of respondents in the sample had a planned retirement age or were already retired (see table A4).
24
Saves privately: “Do you save privately for retirement?.” Possible answers include “No, I have never saved privately for retirement,” “No, I saved earlier but not anymore,” “Yes, but no fixed amount each month,” and four SEK intervals between 0 and +2000 per month. The dependent variable takes a value of one for any of the five “Yes”—answers and zero for the two “No”—answers. Fifty five percent of respondents in the sample saved privately. Forecast pension: “Have you made a pension forecast on minpension.se”?
25
Possible answers include “Yes,” “No,” and “Don’t know.” The dependent variable is a dummy that equals one if the answer is “Yes.” Thirty one percent of respondents in the sample had made such a forecast. Satisfied with saving: “Are you satisfied with the amount that you currently save?” Possible answers include “Yes,” “No, I should save more,” “No, but I cannot afford to save more,” and “No, I think I save too much.” The dependent variable is a dummy that equals one if the answer is “Yes.” Thirty three percent of respondents in the sample were satisfied with their savings level. Worried pension: “I worry that my pension will be too low”. Respondents could give an answer from one to five ranging from “completely disagree” to “completely agree.” We consider a respondent to be worried if they answered at least a three on the five-point scale, which is true for 66 percent of respondents in the sample.
Table 3 presents six sets of estimates, one for each of the retirement planning variables listed above. The first column for each set of estimates in table 3 shows the result from regressing the given dependent variable on the pension knowledge index. In the second column, we include a set of other variables. First, as control variables we use the set of socioeconomic and demographic, register-based, controls that were included in the previous regressions in table 2. Second, we control for general financial literacy (share of the three financial literacy questions that were answered correctly, standardized to have a mean of zero and standard deviation of one) to account for pension knowledge having a separate role from financial literacy. Third, we account for subjective pension knowledge using an indicator for whether the respondents consider themselves sufficiently knowledgeable about the pension system.
Pension Knowledge and Preparedness for Retirement.
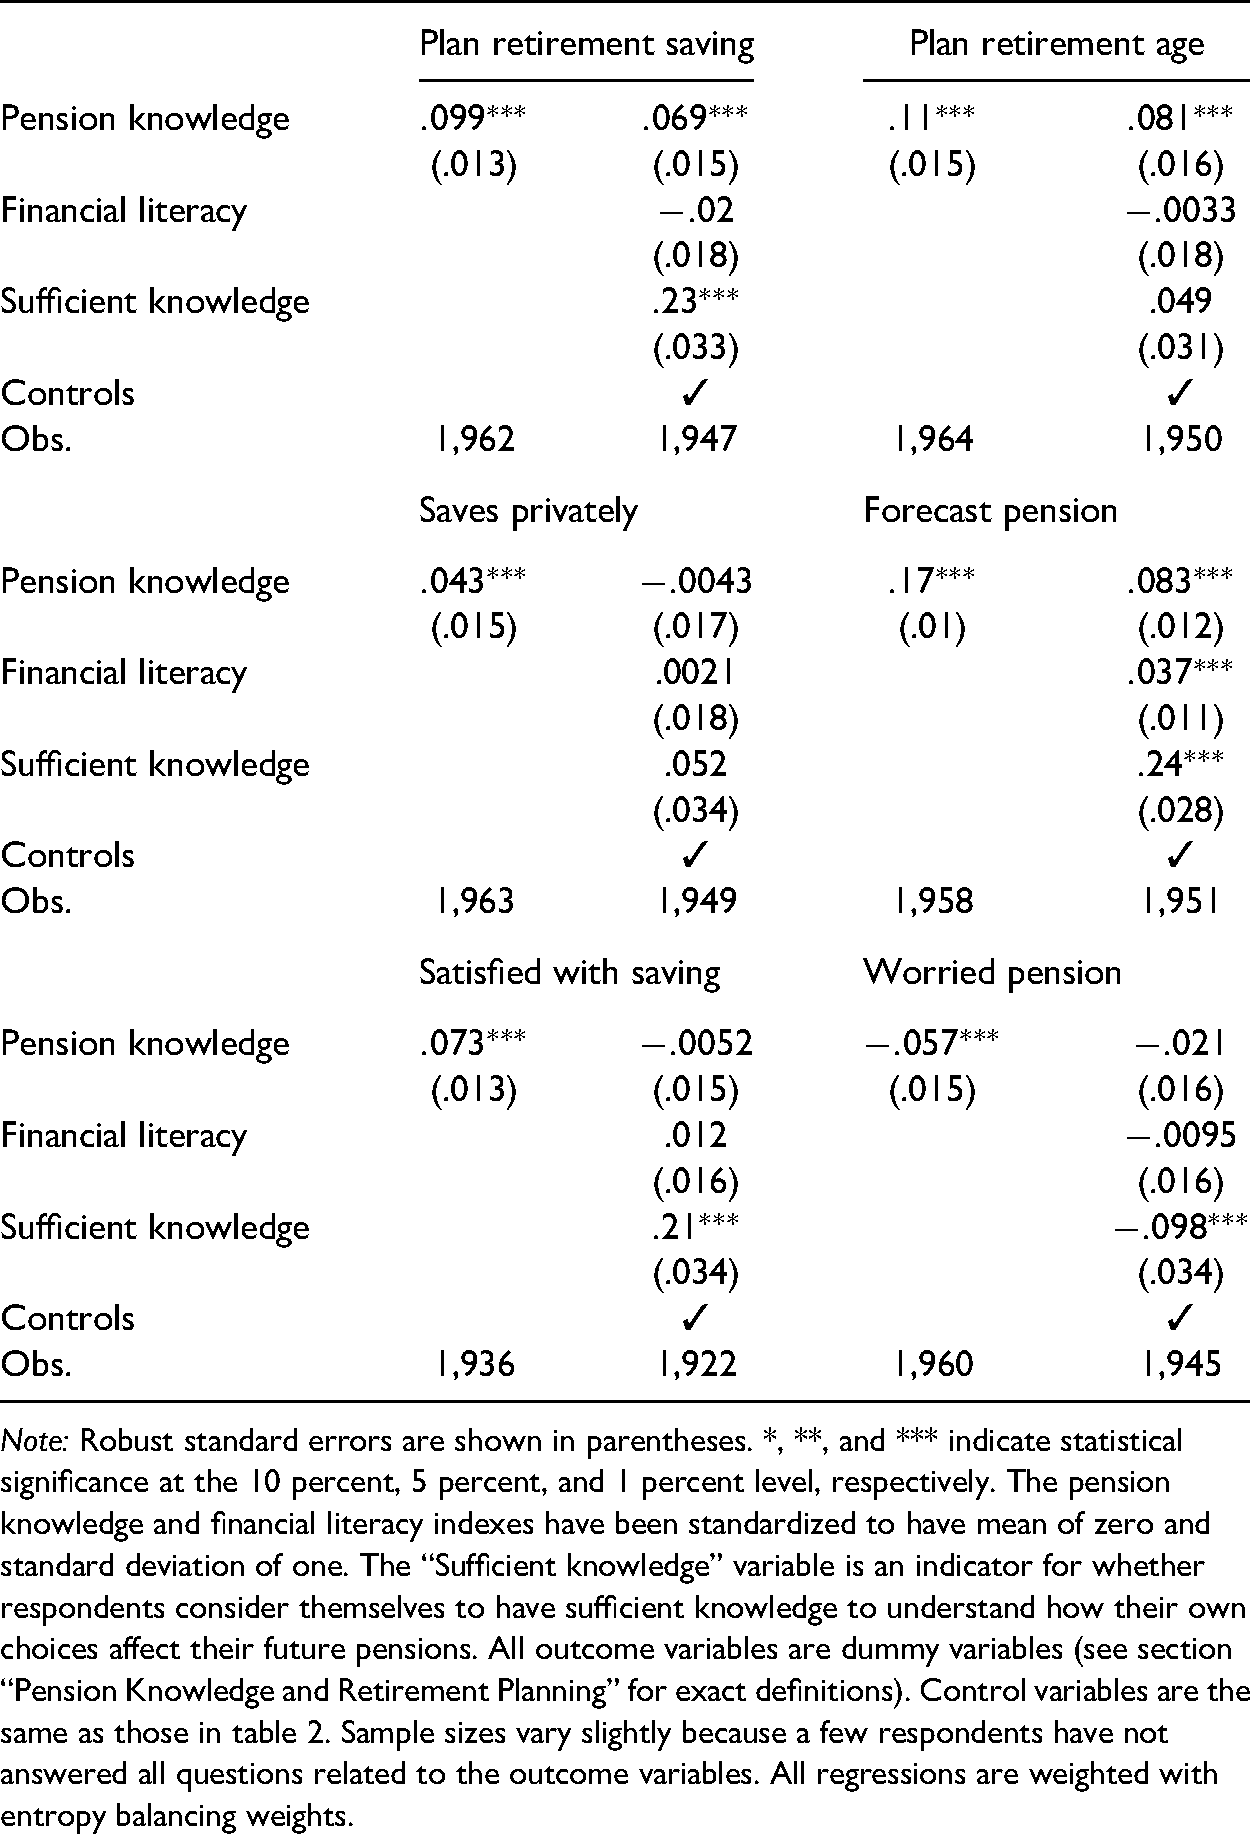
Note: Robust standard errors are shown in parentheses. *, **, and *** indicate statistical significance at the 10 percent, 5 percent, and 1 percent level, respectively. The pension knowledge and financial literacy indexes have been standardized to have mean of zero and standard deviation of one. The “Sufficient knowledge” variable is an indicator for whether respondents consider themselves to have sufficient knowledge to understand how their own choices affect their future pensions. All outcome variables are dummy variables (see section “Pension Knowledge and Retirement Planning” for exact definitions). Control variables are the same as those in table 2. Sample sizes vary slightly because a few respondents have not answered all questions related to the outcome variables. All regressions are weighted with entropy balancing weights.
We first note that pension knowledge is positively correlated with having planned how much to save and at which age to retire. On average, a standard deviation increase in pension knowledge is associated with an increase of 10 percentage points in the probability of having planned retirement saving and 11 percentage points increase in the probability of having planned when to retire.
When adding controls, the point estimates for a pension knowledge drop somewhat, but there is still a clear positive relationship. The point estimate for financial literacy, however, is actually negative, although close to zero, indicating that financial literacy does not explain retirement planning once pension knowledge is controlled for. In line with previous literature (Lusardi and Mitchell 2011b), we also find that financial literacy is positively correlated with planning by itself (see table A6 in the Appendix), hence it is notable that all that correlation disappears once we condition on pension knowledge.
Also, subjective pension knowledge, as measured by the indicator for whether respondents consider themselves to have sufficient knowledge, has a strong positive relationship with planning for retirement saving, although less so for planning for retirement age. This is in line with van Rooij (Lusardi) showing that those with more confidence in their financial literacy knowledge accumulate more wealth as compared to those with less confidence in their knowledge.
When it comes to actual savings behavior the relationship is weaker, and once control variables are added the relationship disappears. On the other hand, all three knowledge variables are positively related to having made a pension forecast although the correlation is smaller for financial literacy than the two other variables.
For the last two variables, the relationship is most pronounced for subjective knowledge. One interpretation of this finding is that the last two variables—in contrast to the first four—measure attitudes towards pension planning rather than actual behavior. It makes sense that subjective knowledge matters more than objective knowledge for such attitudinal outcomes.
Finally, we also tested if there is a heterogeneous association between the different types of pension knowledge—accumulation, decumulation or individual-specific knowledge—and retirement preparedness (see tables A7, A8 and A9 in the Appendix). Analyzing each of these knowledge indexes separately, we find the same qualitative pattern as that for the full pension knowledge index for the four planning variables. However, knowledge of one’s own pension has a different association with individuals’ attitudes towards their preparedness compared to general pension knowledge, where those who know more about their pension wealth are significantly less likely to report being worried about their pension being too low. This result suggests that increasing savers’ awareness of their own pension situation could mitigate feelings of stress towards retirement.
Taken together, the results show that pension knowledge has a positive relationship with different variables relating to pension planning, but less so for attitudes towards planning. Subjective knowledge is related to both retirement planning and to attitudes towards planning. Financial literacy, on the other hand, has, for most outcomes, virtually no relationship with the outcomes conditional on objective and subjective pension knowledge.
Why Do So Many Lack Adequate Knowledge?
Having documented that a large share of pension savers lack knowledge about the pension system, and that those with less knowledge are less prepared for retirement, it is natural to ask why so many seem to be lacking in knowledge? To explore this question, we asked respondents who stated that they lacked sufficient knowledge why they haven’t acquired that knowledge. Respondents could choose from a list of answers with the ability to mark more than one answer. Figure 3 shows the responses.
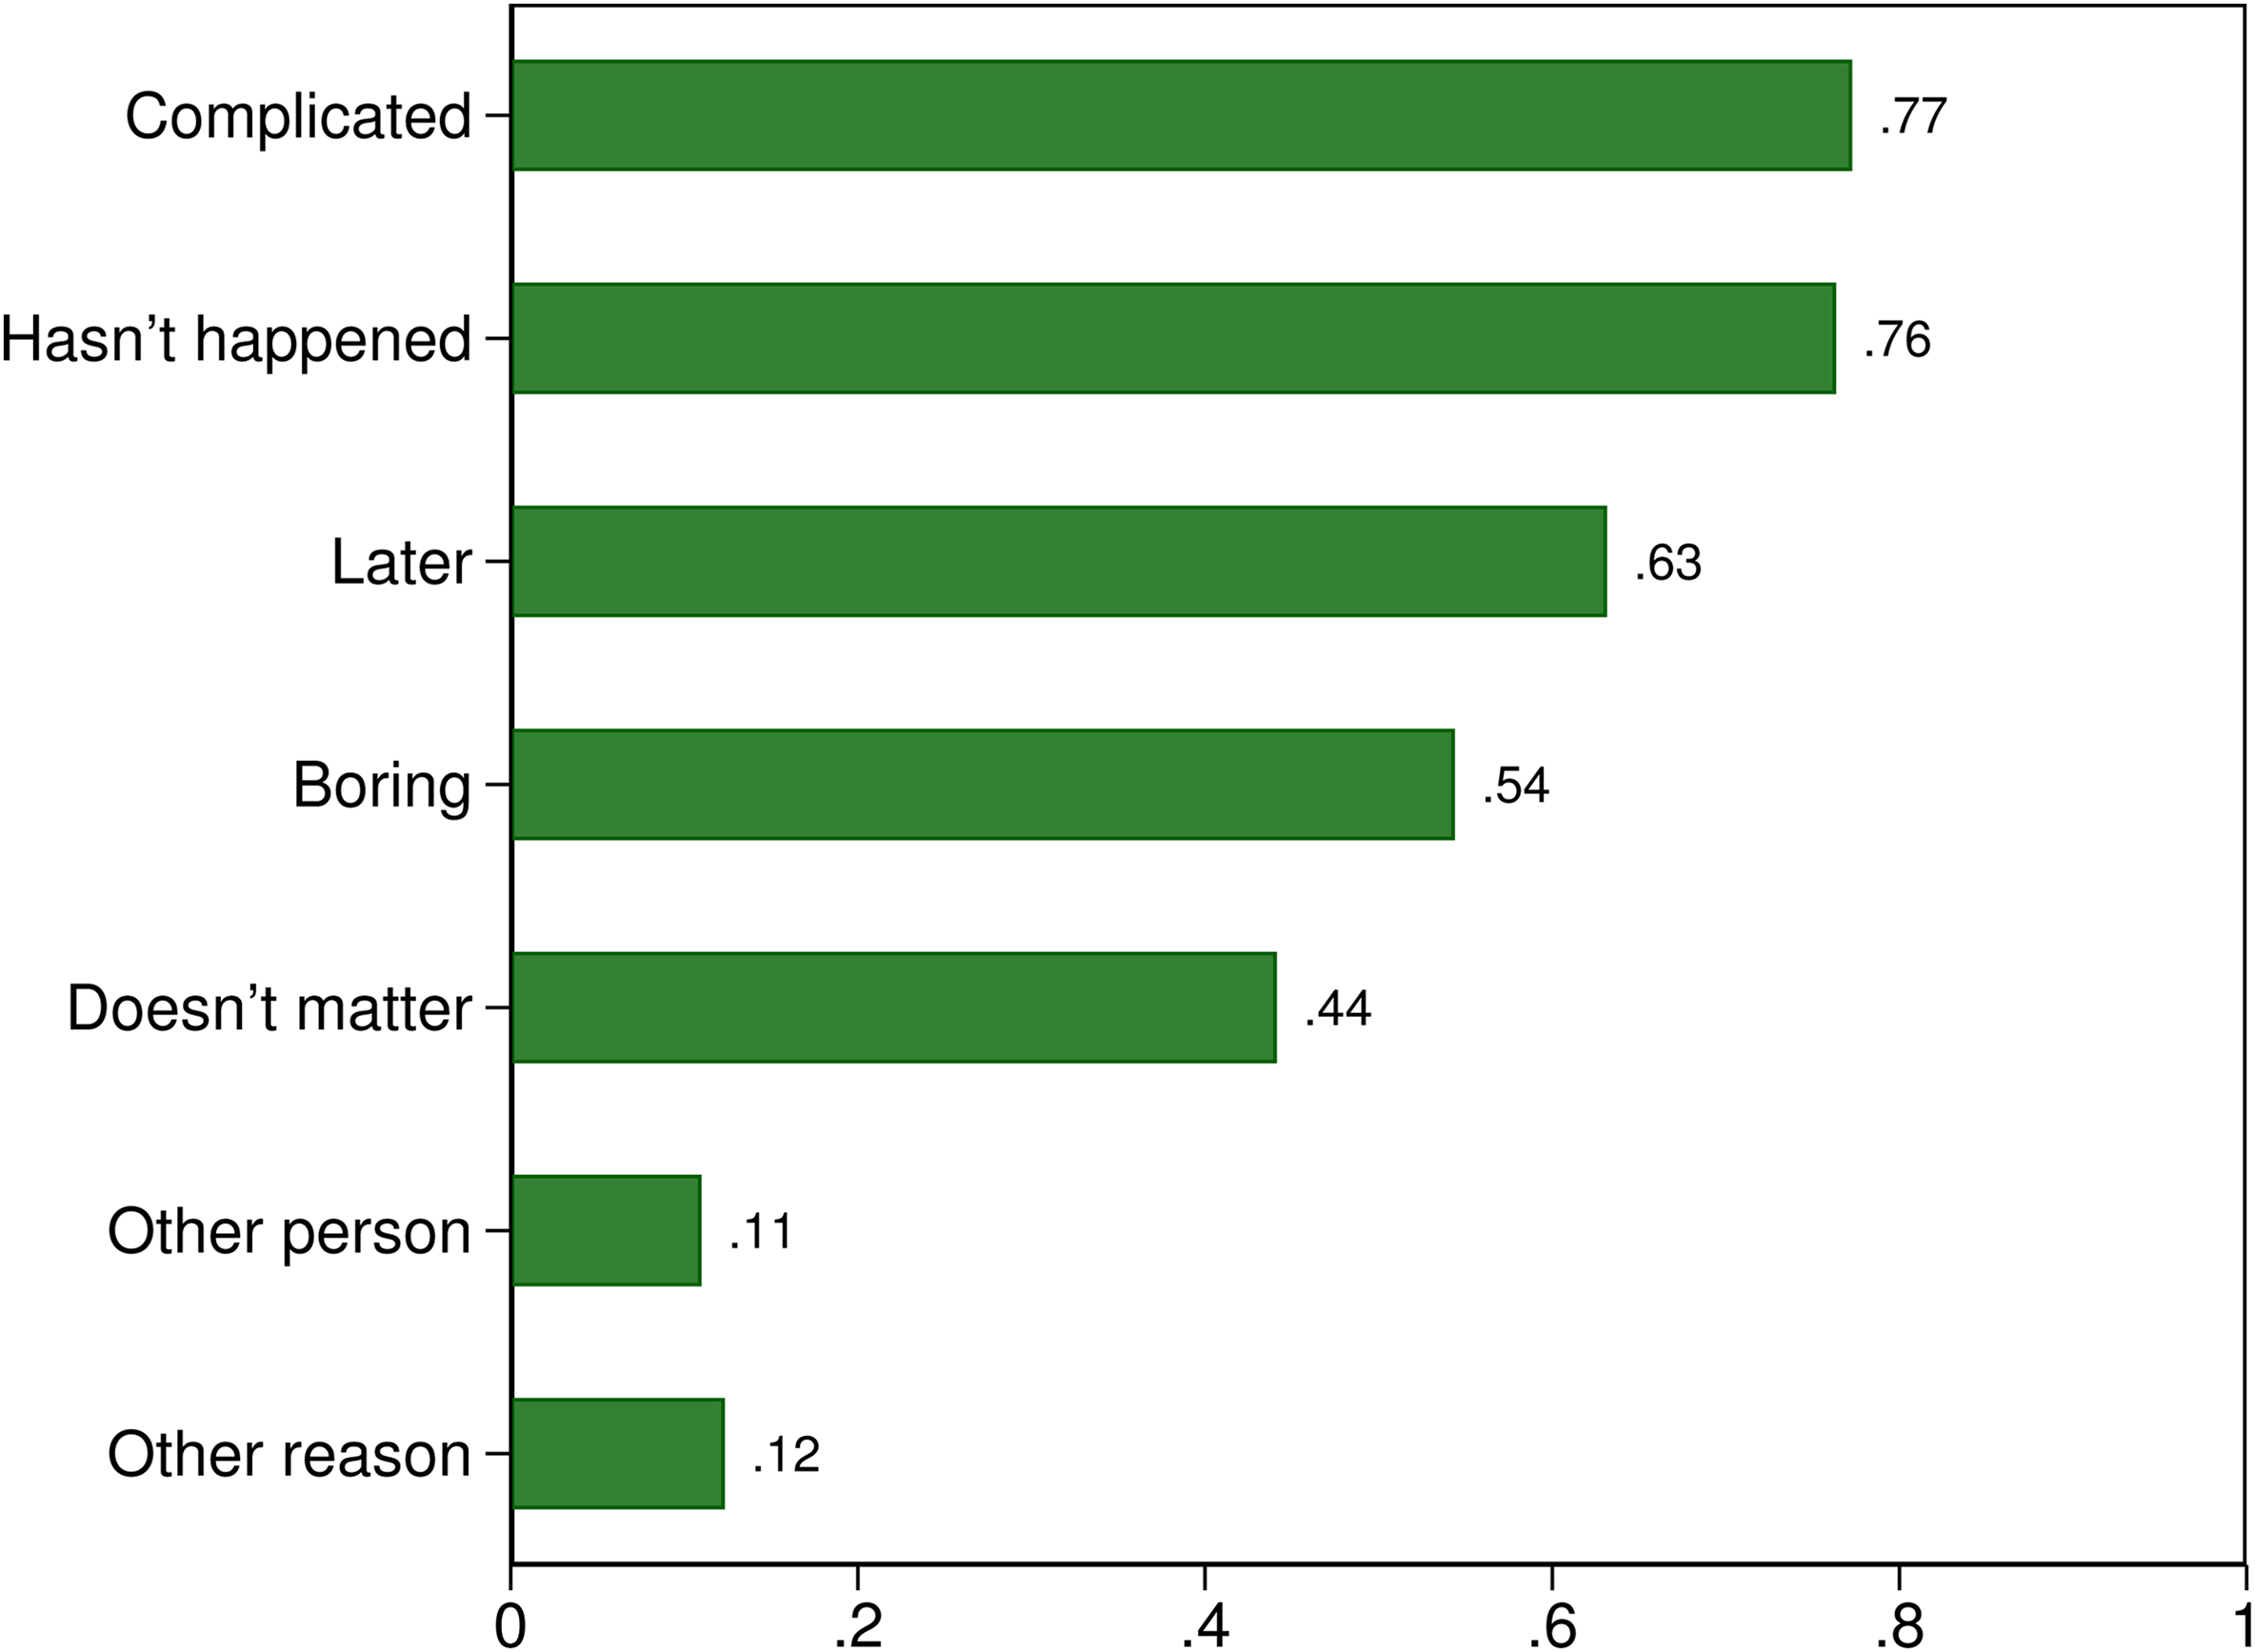
Reasons for lack of knowledge. Note: The figure shows the reasons respondents gave for why they did not have sufficient knowledge of the pension system to understand how their own choices affect their future pension. Respondents could mark more than one alternative and the bars and numbers indicate the share of respondents who marked each alternative. The alternatives were (i) “The pension system is too complicated,” (ii) “I have been thinking about doing it, but it just hasn’t happened,” (iii) “I will do it once I get closer to retirement,” (iv) “Thinking about pension is boring,” (v) “I do not think it matters much if I learn how it works,” (vi) “A person I trust looks after my pension,” and (vii) “Other reason.” The entropy balancing weights have been used to estimate the shares.
Seventy seven percent of respondents gave the complexity of the pension system as the reason for lack of knowledge, 76 percent of respondents stated that they had planned to acquire knowledge but that it just hadn’t happened yet, whereas 63 percent said that they plan to do it when they approach retirement. In total 87 percent marked at least one of the two latter answers and, interestingly, even for those aged fifty six to sixty, this number does not change much (83 percent), suggesting substantial procrastination with potentially severe effects for the individuals. Furthermore, 54 percent gave the fact that they considered thinking about pensions to be boring as a reason for not having acquired sufficient knowledge, whereas 44 percent did not believe that it matters much to know how the pension system works. Only a few said that another person is looking after their pension (11 percent) or claimed that there were other reasons for not having sufficient knowledge (12 percent).
A small but growing literature has focused on how task characteristics affect individuals’ propensity to procrastinate. Related to our findings, it has been shown that task complexity increases the propensity to procrastinate (Ackerman and Gross 2005, 2007) and that people are more inclined to procrastinate a task which is perceived to be boring (Ackerman and Gross 2005). While acquiring knowledge about the pension system is undoubtedly important for the individual, it is always possible to postpone for a little while. The fact that many perceive the pension system to be complicated and boring to think about is likely to increase the likelihood that individuals procrastinate the task to acquire relevant knowledge about the pension system.
Of course, the reason many individuals lack pension knowledge could also be because they value future consumption less, that is, that they have a high discount factor. If so, standard economic theory tells us that it is unproblematic that many individuals postpone information acquisition, it merely reflects the individuals’ rational decision-making. 26
The fact that many individuals lack knowledge may also simply be because it is difficult to understand how the pension system works. The large literature on financial literacy suggests that many individuals lack even basic financial knowledge, and the fact that so many respondents highlight that the pension system is “too complicated” may be a reflection of the difficulty to understand the intricacies of the pension system.
To deepen our understanding of the mechanisms at play we make use of questions previously used in the Global Preference Survey (GPS, see, Falk et al. 2016, 2018). In particular, just as in the GPS, we asked the respondents to rate how willing they are to give up something today in order to benefit in the future, on a scale from 0 to 10, where 0 corresponds to “not at all willing to do so” and 10 “very willing to do so.” To use it in regressions below, we reverse the order, such that a higher value means individuals discount the future more, and we also standardize it such that its standard deviation is one. We label this variable Discounting.
We also asked the respondents how well the following statement describes them: “I tend to procrastinate tasks even if I know that it would be better to undertake them immediately.” The answers are on a scale from 0 to 10, where 0 corresponds to “Does not describe me at all” and 10 corresponds to “Describes me perfectly.” We standardize this question to have a standard deviation of one and label the resulting variable Procrastination.
Finally, we want to assess how cognitive ability relate to pension knowledge, which we do in two different ways. First, we follow previous literature which suggest that self-rated math skills is a proxy for cognitive ability (see, e.g., the discussion in Falk et al. 2018). We asked respondents to consider the statement: “I am good at math,” again on a scale from 0 to 10, where 10 corresponds to “Describes me perfectly.” We label this variable Good at math (also standardized to have a standard deviation of one). Second, for a subsample of the data (mainly older men), we also have access to test scores on a cognitive ability test taken in preparation for the mandatory military service around each individual’s eighteenth birthday. This test has been used extensively in the literature as a measure of cognitive ability. The correlation between the self-rated math skills and the military test score is around 0.44.
The top panel of table 4 shows results from regressions for the final sample. The first three columns shows results from bivariate regressions. We find that a one standard deviation increase in Procrastination is associated with about .08 standard deviations lower pension knowledge. Similarly, a one standard deviation increase in Discounting is associated with .12 standard deviations lower pension knowledge. Finally, for self-rated math skills the corresponding increase in pension knowledge is about .23 standard deviations.
Pension Knowledge, Time Preferences and Cognitive Ability.
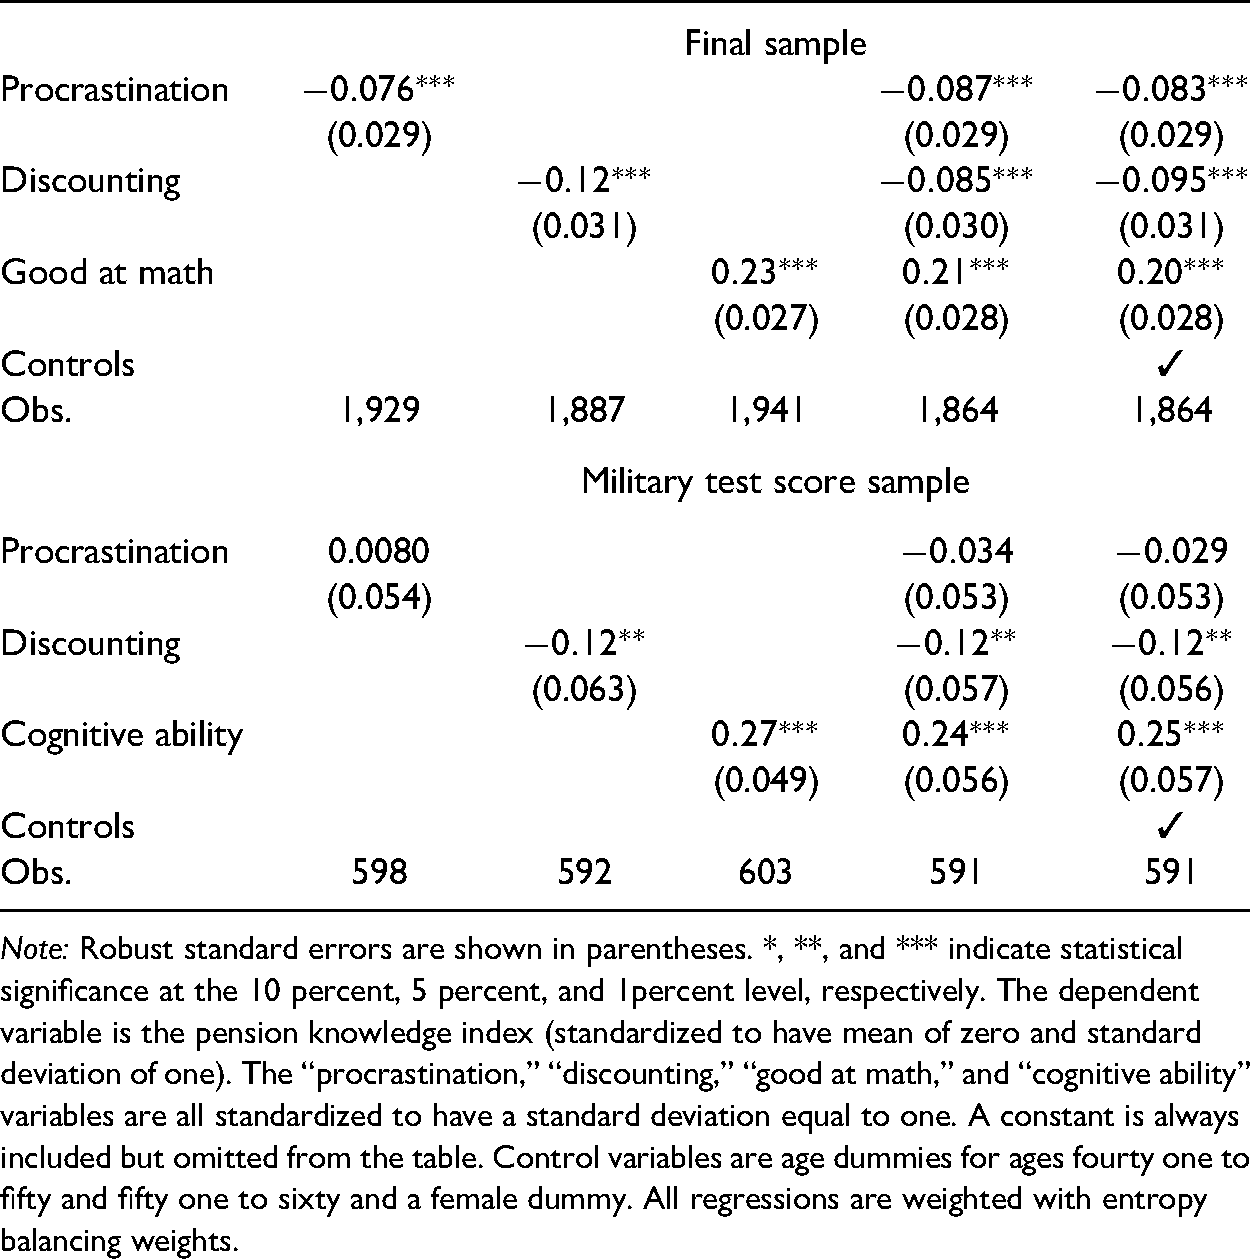
Note: Robust standard errors are shown in parentheses. *, **, and *** indicate statistical significance at the 10 percent, 5 percent, and 1percent level, respectively. The dependent variable is the pension knowledge index (standardized to have mean of zero and standard deviation of one). The “procrastination,” “discounting,” “good at math,” and “cognitive ability” variables are all standardized to have a standard deviation equal to one. A constant is always included but omitted from the table. Control variables are age dummies for ages fourty one to fifty and fifty one to sixty and a female dummy. All regressions are weighted with entropy balancing weights.
The results are very similar when all variables are included in the same regression, and inclusion of control variables for age and gender do not change the results in any important way. We do not include any additional controls as other controls are all likely to be endogenous with respect to these personal traits.
The bottom panel shows results from the subsample of individuals who have taken the military test score. Naturally, the standard errors are now larger as the sample size is smaller. Estimates are similar for the discounting variable and the cognitive ability variable exhibits a similar pattern as for self-rated math skills. Only the coefficient for the procrastination variable deviates substantially, although it should be noted that a 95 percent confidence interval for the coefficient covers the estimate of procrastination for the full data. Given that the final sample is more relevant than the restricted subsample, we conclude that there is evidence that proclivity to procrastinate is negatively related to pension knowledge.
To conclude, we find that time preferences, such as the tendency to procrastinate and to discount the future, are related to pension knowledge acquisition. Furthermore, cognitive ability, as measured by subjective math assessment or by actual test scores are also strongly related to knowledge. These findings lend support to the idea of using behavioral tools to encourage individuals to make better decision for their future (see, e.g., Thaler and Benartzi 2004) and for the providing simplified information about individuals’ pensions and the pension system.
Concluding Remarks
The transition from a defined benefit to a defined contribution pension system that we see in many developed countries today implies that individual retirement savers need to take on more responsibility for their financial well-being at older ages. Defined contribution pensions typically come with more choices and greater uncertainty about the future pension. Individuals therefore need to be well-informed about the rules and incentives embedded in the pension system for individuals to adequately save and prepare for retirement.
Using novel survey and high-quality register data, we have shown that context-specific pension knowledge is a rare asset. Most individuals aged thirty one to sixty years old lack important knowledge about the pension system. Without knowledge of the rules of—and incentives in—the pension system, it is likely that individuals will not save optimally for retirement. In line with previous studies, we also find that many individuals lack information on their own expected level of pension wealth (see, e.g., Gustman and Steinmeier 2004, 2005; Maunu 2007; Chan and Stevens 2008; Barrett et al. 2015). There is also a strong socioeconomic gradient in pension knowledge, meaning that individuals with low income or low education are less likely to have adequate knowledge about the pension system. The fact that pension knowledge is highly correlated with socioeconomic status and preparedness for retirement, therefore adds to the worry that the socioeconomic gradient in ability to make sound financial decisions may contribute to economic inequality.
Notably, we also find that while previous studies have shown that financial literacy is highly correlated with retirement planning (Almenberg and Säve-Söderbergh 2011; Lusardi and Mitchell 2011b, 2014), measured as having tried to estimate how much one needs to save for retirement, we found that this correlation virtually disappears once we control for pension knowledge. However, pension knowledge is highly correlated with retirement planning even when controlling for financial literacy. 27 This pattern is repeated for several other measures of retirement planning, such as having thought about when to retire. Our findings thus suggest that system-specific and individual-level specific pension knowledge has a role to play beyond that of financial knowledge.
Our survey furthermore reveals that a large fraction of respondents point out the complexity of the pension system as an obstacle to acquire adequate knowledge. Moreover, an overwhelming majority state that they had planned to learn more about the pension system, but that “it just hasn’t happened.” Motivated by these results, we show that people who are intrinsically more prone to procrastination, are impatient or have lower cognitive ability are more likely to lack knowledge about the pension system. The complexity of the pension system as well as individual procrastination therefore seem to be plausible causal mechanisms for individuals’ lack of pension knowledge.
A well-designed choice architecture, including sound default options and easily available information about the pension system should therefore be key priorities for policy makers and pension plan administrators. Digital tools that collect and personalize information on accumulated pension capital in different pension plans could also provide a potential means to reduce the perceived complexity and allow retirees to get a better overview of their financial situation.
Footnotes
Appendix A
Acknowledgements
The authors wish to thank FORTE (The Swedish Research Council for Health, Working Life and Welfare, grant numbers 2013-2482 and 2017-00092) for financial support. The survey has been financed jointly by FORTE, IFAU (Institute for Evaluation of Labor Market and Education Policy) and ISF (The Swedish Social Insurance Inspectorate). The authors wish to thank Helge Bennmarker, Scott Findley, Georg Graetz, Daniel Hallberg, Per Johansson, Håkan Selin, Gabriella Sjögren Lindquist, Sanna Tenhunen and participants at the International Institute of Public Finance (IIPF) conference in Glasgow and seminar participants at the Institute for Evaluation of Labor Market and Education Policy (IFAU) for valuable and helpful comments.
Declaration of Conflicting Interests
The authors declared no potential conflicts of interest with respect to the research, authorship and/or publication of this article.
Funding
The author(s) disclosed receipt of the following financial support for the research, authorship, and/or publication of this article: Funding has been received from FORTE (The Swedish Research Council for Health, Working Life and Welfare, grant numbers 2013-2482 and 2017-00092) for financial support. The survey has been financed jointly by FORTE, IFAU (Institute for Evaluation of Labor Market and Education Policy) and ISF (The Swedish Social Insurance Inspectorate).