
Abstract
The majority of public sector employees in the United States still have access to defined benefit (DB) retirement plans, with some retaining a choice between a defined benefit plan and a defined contribution (DC) plan when hired. This research was based on a survey assessing individuals’ financial literacy, risk tolerance, and time orientation and the influence those three variables had on preferences for DB versus DC plans. Greater financial skill and risk tolerance were associated with a preference for DC plans, while a time orientation focused on the present was associated with a preference for DB plans. This research could benefit employers as they determine retirement plan options that they choose to offer employees. Employers who offer both plan types may benefit from informing employees about the factors associated with preferences for each plan type as greater awareness of such factors could improve employee satisfaction and increase retention.
Beginning in the 1980s, the proportion of U.S. employers that offered defined benefit (DB) retirement plans to employees began to outpace the proportion offering defined contribution (DC) plans, especially in the private sector. In a DB plan, individuals and their employers contribute to the plan during their employed years; in retirement, employees receive annuity payments, with the amount based on years of service and the highest or most recent salaries (Internal Revenue Service, n.d.; U.S. Department of Labor, n.d.). In a DC plan, the employee and the employer make contributions to the employee’s individual account; the employee chooses where the money is invested from among the plan choices (U.S. Department of Labor, n.d.). In retirement, the employee decides when and how much to withdraw from the account. Employees who leave their employer after they are vested may take the employer’s contribution when they leave; the vesting periods are longer in DB than in DC plans (Andrietti & Hildebrand, 2016; Burke et al., 2017; Munnell et al., 2012).
Especially in the public sector, employees may be able to choose between a DC and a DB plan. This research investigates the factors that influence an employee’s choice between the two different types of plans. It reports the results of a survey investigating the influence of financial literacy, risk tolerance, and time orientation on retirement plan choice. Data are analyzed using logistic regression. The results are relevant to employers seeking to improve recruitment and retention of employees, to human resource professionals and financial planners assisting employees in making retirement plan choices, and to researchers.
Background
Within the U.S. civilian workforce, approximately 72% of workers (68% of private-sector workers and 92% of those in the public sector) had access to a retirement plan as of September 2021 (U.S. Bureau of Labor Statistics, 2021). The two most common types of retirement plans are defined benefit retirement plans and defined contribution retirement plans (U.S. Department of Labor, n.d.).
By 1960, DB plans had become quite popular, with DB coverage increasing to 50% of the private sector workforce (Phipps, 2020). DB plans remained popular until the 1980s, when the percentage of workers enrolled in DB plans began to decline (Friedberg & Webb, 2005). Enrollment in DC plans had increased substantially by 2019, when 87.2% of retirement plan participants were enrolled in DC plans compared with only 12.8% in DB plans (U.S. Department of Labor, 2021).
Employers were motivated to shift from DB to DC plans due to the higher cost (Internal Revenue Service, n.d.) and the potential investment risk of maintaining DB plans. The employer assumes all of the investment risk in a DB plan, while the risk shifts to the employee in a DC plan (Copeland, 2019).
In the public sector, there was a much smaller shift away from DB plans. In 2021, only 15% of workers in the private sector had access to DB plans compared to 86% of public-sector workers (Congressional Research Service, 2021). The persistence of DB plans in the public sector relative to the private sector is likely the result of a higher union membership rate (U.S. Bureau of Labor Statistics, 2020b) and a longer employee tenure in the public sector, making the mobility risk associated with DB plans less relevant to public-sector employees (Copeland, 2019). While the employers of 12% of all workers offered a choice between DB plans and DC plans in 2020 (U.S. Bureau of Labor Statistics, 2020a), the percentage of workers in the public sector with such an option is likely greater. Supporting this statement is the fact that 24 state university systems offer a choice between a DB plan and a DC plan (see Appendix).
Elected officials making decisions regarding retirement plans in the public sector must choose whether to continue to offer DB plans as options to their employees or replace them with DC plans. Since the Employee Retirement Income Security Act (ERISA) does not apply to public sector plans, such DB plans generally are underfunded with an average funding ratio of 53.2% (Federal Reserve System, 2022). The existing funding issues coupled with declining tax revenues (Butrica et al., 2009) and the balanced budget provisions within state constitutions (National Conference of State Legislatures, 2010) increase the incentives for decision makers to offer DC plans.
Given that Social Security typically provides an income replacement rate of only 35% (Rhee, 2013), individuals need other sources of income in retirement. To improve employee recruitment and retention, employers have an incentive to provide the type of retiree plan that employees prefer (Chingos & West, 2015; Goldhaber & Grout, 2016). Thus, this research seeks to determine the factors that shape individuals’ preferences for DB plans versus DC plans. The factors investigated were financial literacy, risk tolerance, and time orientation.
Because DC retirement plans require the employee to make multiple decisions about where and when funds are invested, financially literate individuals may be more comfortable with those plans than individuals who are less financially literate. Because DC plans shift all of the investment risk to employees, DC plans also may be more attractive to individuals who are more risk tolerant. In addition, future-oriented individuals are likely to prefer DC retirement plans as they may be less affected by the short-term fluctuations associated with investments in DC plans.
Literature Review
While there are risks associated with DB plans, many employees view them as sources of riskless annuities, perceiving them to be safer than DC plans (Rauh et al., 2019). While there is no investment risk to the employee in a DB plan, these plans also reduce or eliminate the opportunity for employees to choose investments that might potentially match their own preferences regarding risk and return and generate the higher rates of return associated with investing in equities (Craig & Toolson, 2008). In DC plans, equity holdings represent a large portion (67.8%) of the invested assets (Investment Company Institute, 2022). However, many individuals are not willing to accept the volatility associated with investing in equities, particularly immediately after a downturn in the market (Gerrans & Clark, 2013). In situations where employees could choose between a DB plan and a DC plan, the preference was for DB plans after the financial downturns in 2000 and 2001 (Brown & Weisbenner, 2014) and from 2007 to 2009 (Chingos & West, 2015).
In contrast, mobility risk is a significant concern for employees who choose a DB plan because of the longer vesting periods associated with DB plans versus DC plans (Andrietti & Hildebrand, 2016; Clark & Pitts, 2002). Among DB plans offered by state and local governments, 58.7% had vesting periods of five years, and 24.6% had vesting periods of 10 years (Munnell et al., 2012); in contrast, over 40% of DC plans featured immediate vesting (Burke et al., 2017). As a result, employees who require greater job mobility are likely to prefer DC plans (Coco & Lopes, 2011). While individuals can receive ample retirement benefits through DB plans, the back-loaded nature of these plans means that individuals are only likely to do so after several years of service (Chingos & West, 2015).
Financial Literacy
Based on the existing body of work on financial literacy (Huhmann & McQuitty, 2009), this paper defines financial literacy as the degree to which an individual has knowledge of economic and financial concepts and conditions and the ability and confidence to apply such knowledge to manage personal finances in both the short-term and the long-term to achieve financial well-being. The concept of financial literacy refers not only to the acquisition of the requisite knowledge but also to the ability to use that knowledge effectively. Because DB plans are professionally managed, the employee’s need for financial literacy is greater for DC plans. In a DC plan, enrollees determine the investments to make within the plan and when and how much to withdraw after retirement (Brown & Larrabee, 2017). Less financially literate individuals may have less accurate expectations regarding the retirement income they could derive from retirement plans, which could impact their financial well-being and potentially force individuals to retire later than originally planned (Gustman & Steinmeier, 2004).
Despite the likely significant impact of the choice of a retirement plan on financial well-being, researchers have reported that many individuals devote little time to choosing a retirement plan (Clark & Pitts, 2002) and may not be able to distinguish between the two plan types and the associated risks. In one study (Gustman & Steinmeier, 2004), the majority of employees enrolled in DC plans mistakenly thought they had enrolled in DB plans.
While there are various components of financial literacy, the three central factors used for this analysis were numeracy, financial knowledge, and financial skill. Numeracy is necessary, but not sufficient, to achieve financial literacy (Almenberg & Widmark, 2011). Individuals must also possess the ability to read and understand numerical information. Lusardi and Mitchell (2011) assessed numeracy based on the ability to calculate the impact different interest rates had on growth in savings account balances and determined that individuals who could not make such calculations were less likely to successfully plan for retirement. Other methods of measuring numeracy include Fernandes et al.’s (2014) in which respondents were asked to assess their own numeracy as a component of financial literacy. Researchers have provided evidence of a correlation between numeracy and financial wealth (Gustman et al., 2012) and between numeracy and retirement saving (Banks & Oldfield, 2007).
Financial knowledge is another critical component of financial literacy. Financial knowledge is memory-based and includes both vocabulary and conceptual knowledge (Huhmann & McQuitty, 2009). Huston (2010) indicated the critical areas of financial knowledge were personal finance basics, borrowing, saving and investing, and protecting resources. The Organization for Economic Co-operation and Development (OECD, 2015) identified five dimensions of financial knowledge—simple interest, compound interest, the time value of money, the impact of inflation on price levels, and the impact of inflation on investment returns.
The most commonly used measures of financial knowledge are those developed by Lusardi and Mitchell (2011). The questions focus on compound interest, inflation, and investment diversification and are commonly referred to as the “Big Three.” This set of questions has been used in a variety of surveys, including the U.S. Survey of Consumer Finances, the Dutch Household Survey, and the German SAVE (Lusardi & Mitchell, 2017). The 2009 wave of the National Financial Capability Survey added questions regarding mortgage interest and bond pricing (Hastings et al., 2013), establishing a “Big Five” set of questions.
While the Big Three and the Big Five are the most commonly used question sets, researchers also have used question sets of different sizes to assess financial knowledge; larger question sets, such as the one in van Rooij et al.’s (2012) study, often include some or all of Lusardi and Mitchell’s Big Five. Of note is Brown and Weisbenner (2014) who used only one question about compound interest in their research investigating the connection between financial knowledge and the choice of a DB plan versus a DC plan.
Existing research suggests mixed results regarding the relationship between financial knowledge and retirement saving behaviors. In Hastings and Mitchell’s (2011) research, the ability to understand concepts such as inflation, compounding, and investment returns had a limited impact on retirement saving. Choi et al. (2002) reported that individuals with more financial education were more likely to plan to save, but few individuals followed through on such plans. Wagner and Walstad (2022) suggested that improving financial literacy through financial education could lead to an increase in financial planning activities, which would include retirement planning and building wealth for the future. In contrast, Hauff et al. (2020) found that fact-based financial knowledge was positively correlated with retirement planning, retirement saving, and investment management.
Financial literacy requires financial knowledge, but an individual must know how to apply such knowledge (Huston, 2010) in order to perform specific financial activities (Atkinson et al., 2007). As such, financial skill is a necessary component of financial literacy (OEDC, 2015). According to the Consumer Financial Protection Bureau (CFPB, 2018), financial skill includes knowing when and how to find reliable information to make financial decisions, how to process financial information to make financial decisions, and how to execute financial decisions. The CFPB developed a ten-question scale to assess respondents’ ability to locate, process, and act on financial information; the scale was field tested in the 2016 National Financial Well-Being Survey. Data analysis indicated that financial skill was correlated with financial well-being (CFPB, 2018).
Thus, based on previous research, we hypothesized that individuals who are more financially literate are more likely to select DC plans when given a choice of plans. In particular, we expected greater numeracy, greater financial knowledge, and greater financial skill to be correlated with an increased likelihood that an individual would select a DC plan over a DB plan.
Risk Tolerance
Risk tolerance, which is how comfortable one is with risk, also may be relevant to the choice between a DB plan and a DC plan. Risk tolerance is relevant to a wide range of financial behaviors including saving, investing, and credit card usage (Campbell, 2006). Regarding choices related to the investment behaviors that are required to manage a DC plan, risk tolerance is critical given that individuals who are more willing to accept the risk associated with investments may earn greater returns in the long run (Samsuri et al., 2019). Those who are less risk tolerant are more likely to avoid investing in stocks, and thus may prefer a DB rather than a DC plan, if given a choice. A market downturn may amplify that preference (Gerrans & Clark, 2013). Thus, our second hypothesis was:
Time Orientation
In addition to financial literacy and risk tolerance, an individual’s time orientation may impact their preference for a DB plan versus a DC plan. Essentially, time orientation is the degree to which an individual is biased toward the past, toward the present, or toward the future (Zimbardo & Boyd, 1999). Individuals who are more future-oriented may be better suited to make the forward-looking investment decisions associated with a DC plan. Individuals who are more present oriented may lack the time perspective necessary to participate in a DC plan.
Although there are other ways to measure time orientation, including Strathman et al.’s (1994) Consideration of Future Consequences Scale (CFCS) and the Zimbardo Time Perspective Inventory (ZTPI) (Zimbardo & Boyd, 1999), the current study used an instrument known as the expanded CFCS-14. Joireman et al. (2012) created the scale, which measures both immediate time orientation and future time orientation.
Researchers have used the CFCS upon which the CFCS-14 is based in various ways in more than 40 studies (Ryack, 2008). In general, researchers have added the sums of the future item responses to the sums of the reverse-coded immediate item responses to obtain measures of future orientation (Hevey et al., 2010). While this unidimensional approach provided a best fit for Hevey et al., other researchers found that separately analyzing a grouping of future responses and a grouping of immediate responses yielded an appropriate measurement process (McKay et al., 2016). Thus, our third hypothesis was:
Thus, the model for this study (which is represented in Figure 1) assumed that financial literacy, risk tolerance, and time orientation influence preferences for a DC plan versus a DB plan. Consistent with previous research, financial literacy was operationalized as numeracy, financial knowledge, and financial skill. Variables expected to influence plan choice.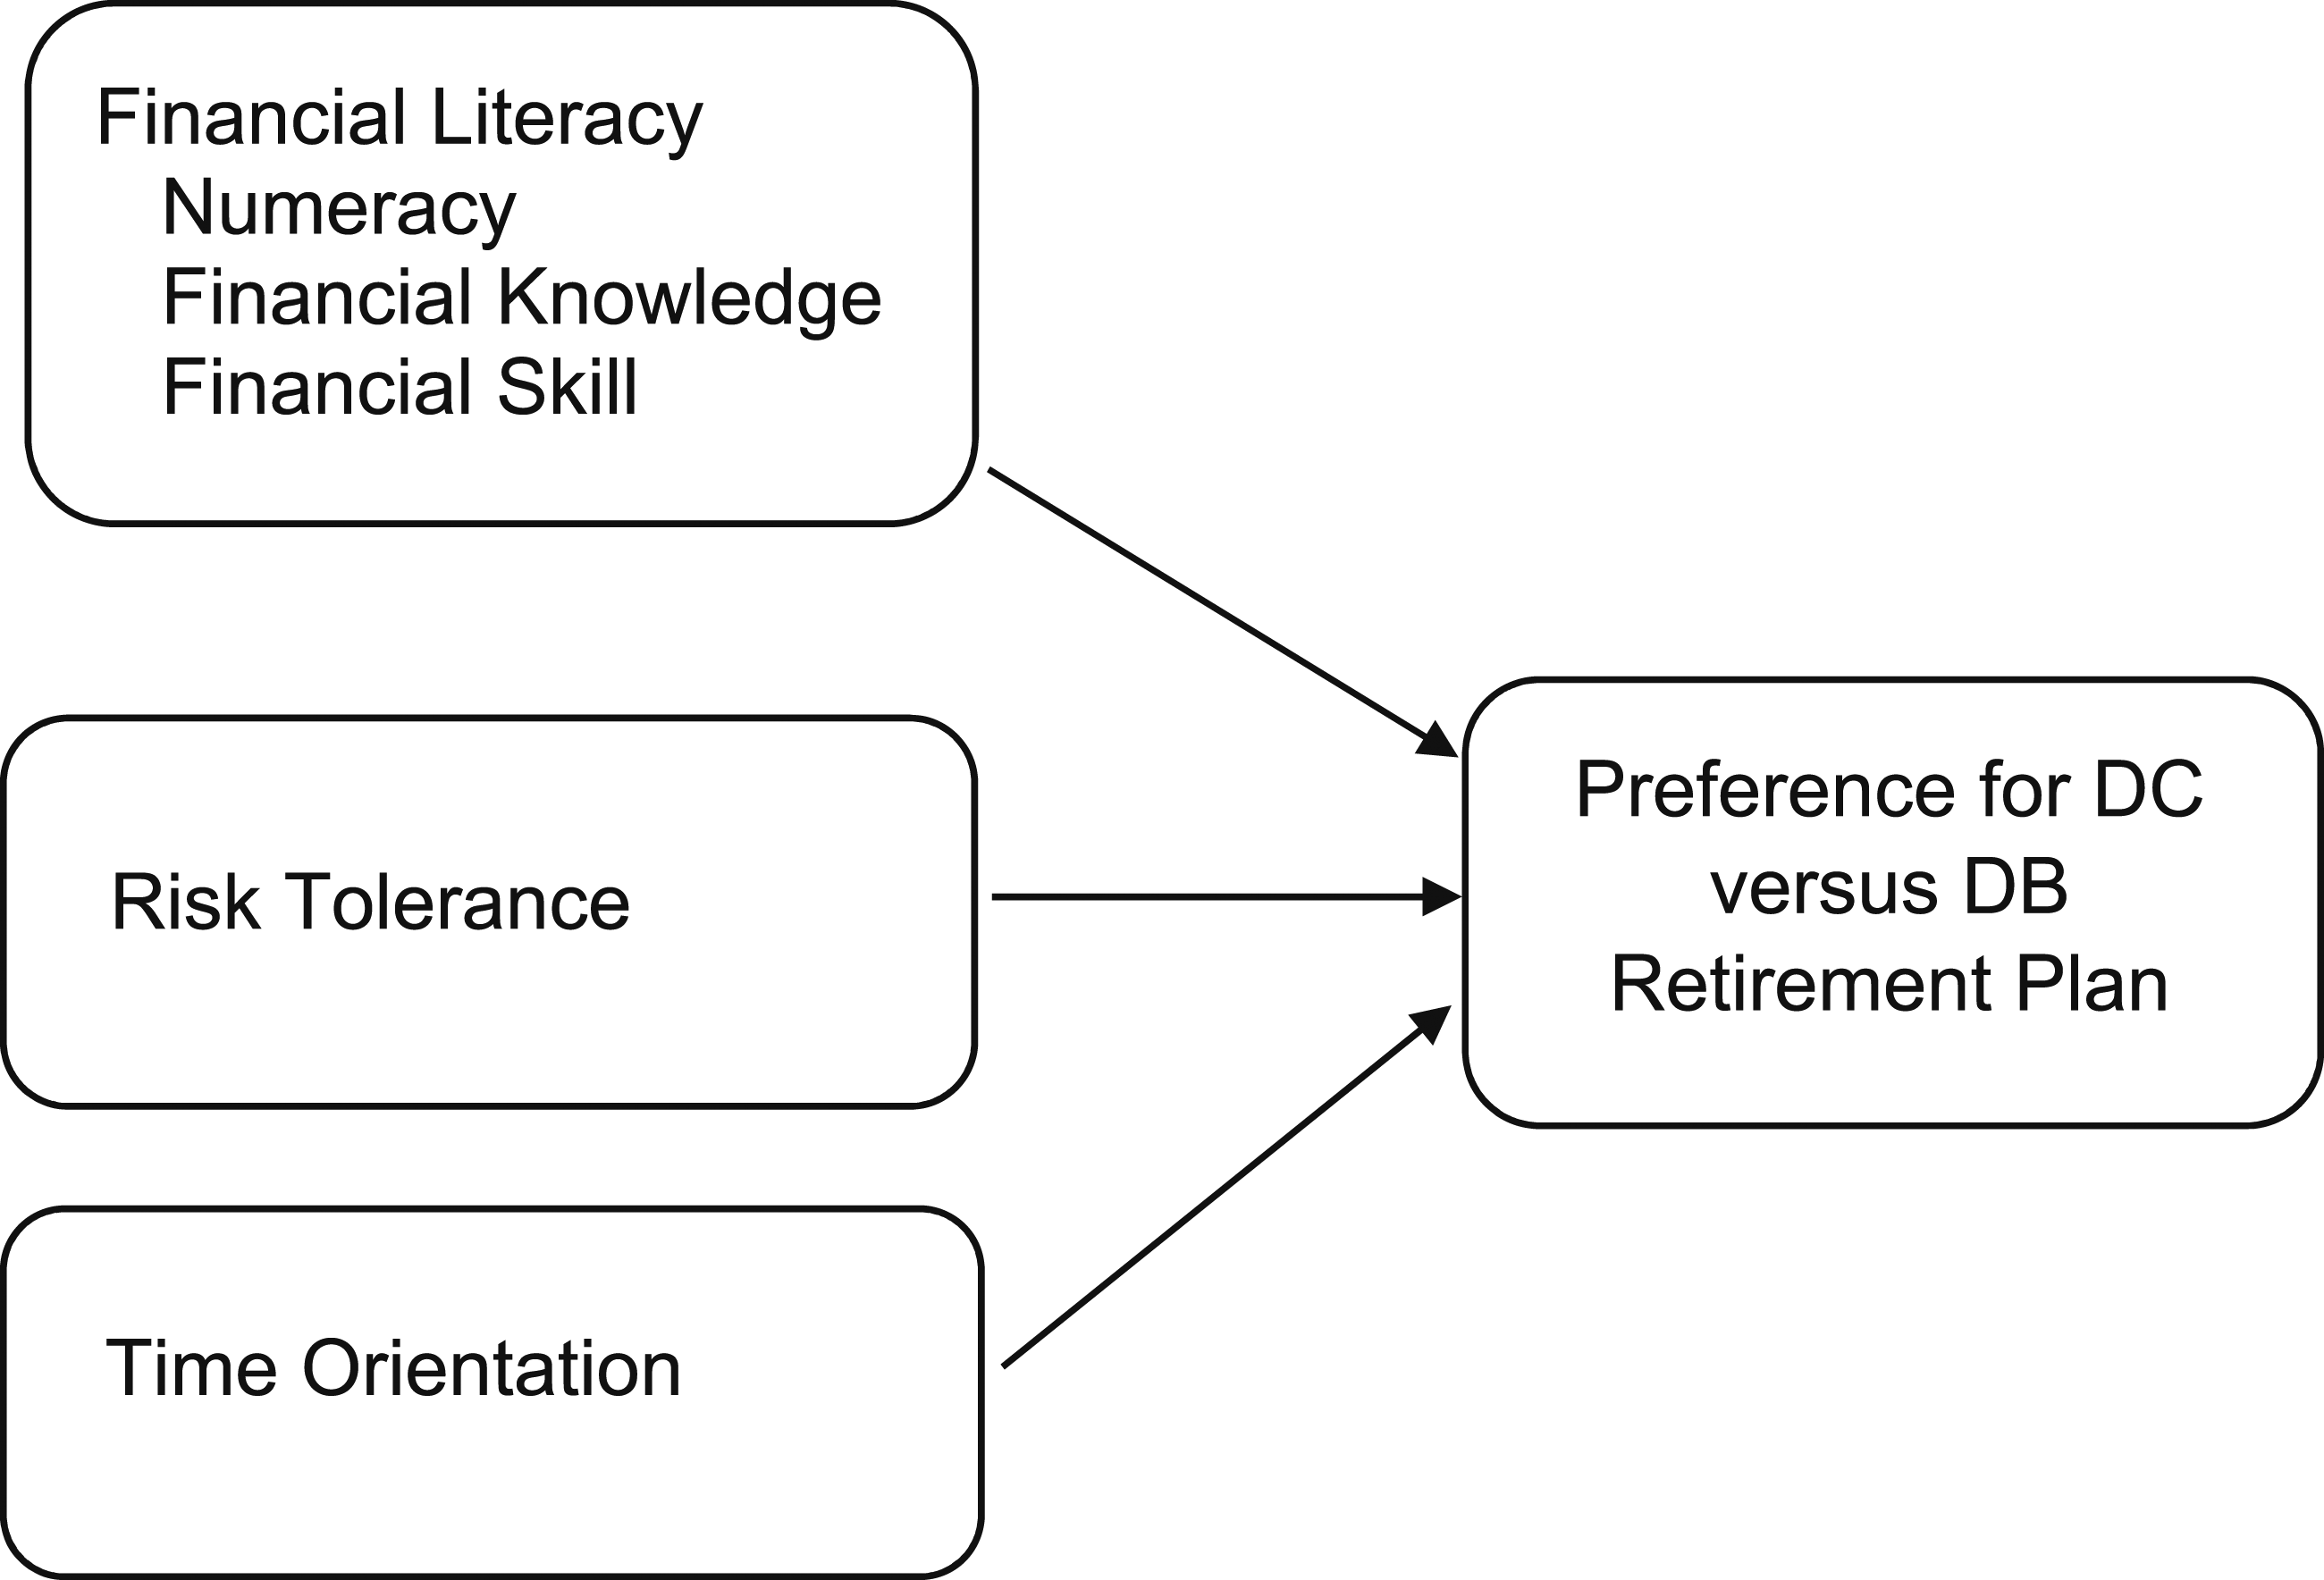
Methods
Construct Items and Measurement.
To assess the respondents’ preferences for DB plans versus DC plans, the survey included one question asking respondents which type of plan they would choose if they were starting a new employment position. The question was future-oriented as the respondents were university graduate students. Because respondents might not be familiar with the characteristics of DB and DC plans, the survey provided basic information about the common attributes of each plan type as indicated in Figure 2. Because the majority of private-sector employers do not offer DB plans but the majority of public-sector employers do (U.S. Department of Labor, 2021), the survey also included one question asking respondents if they expected to work in the private sector or the public sector. Comparison of defined benefit and defined contribution plans.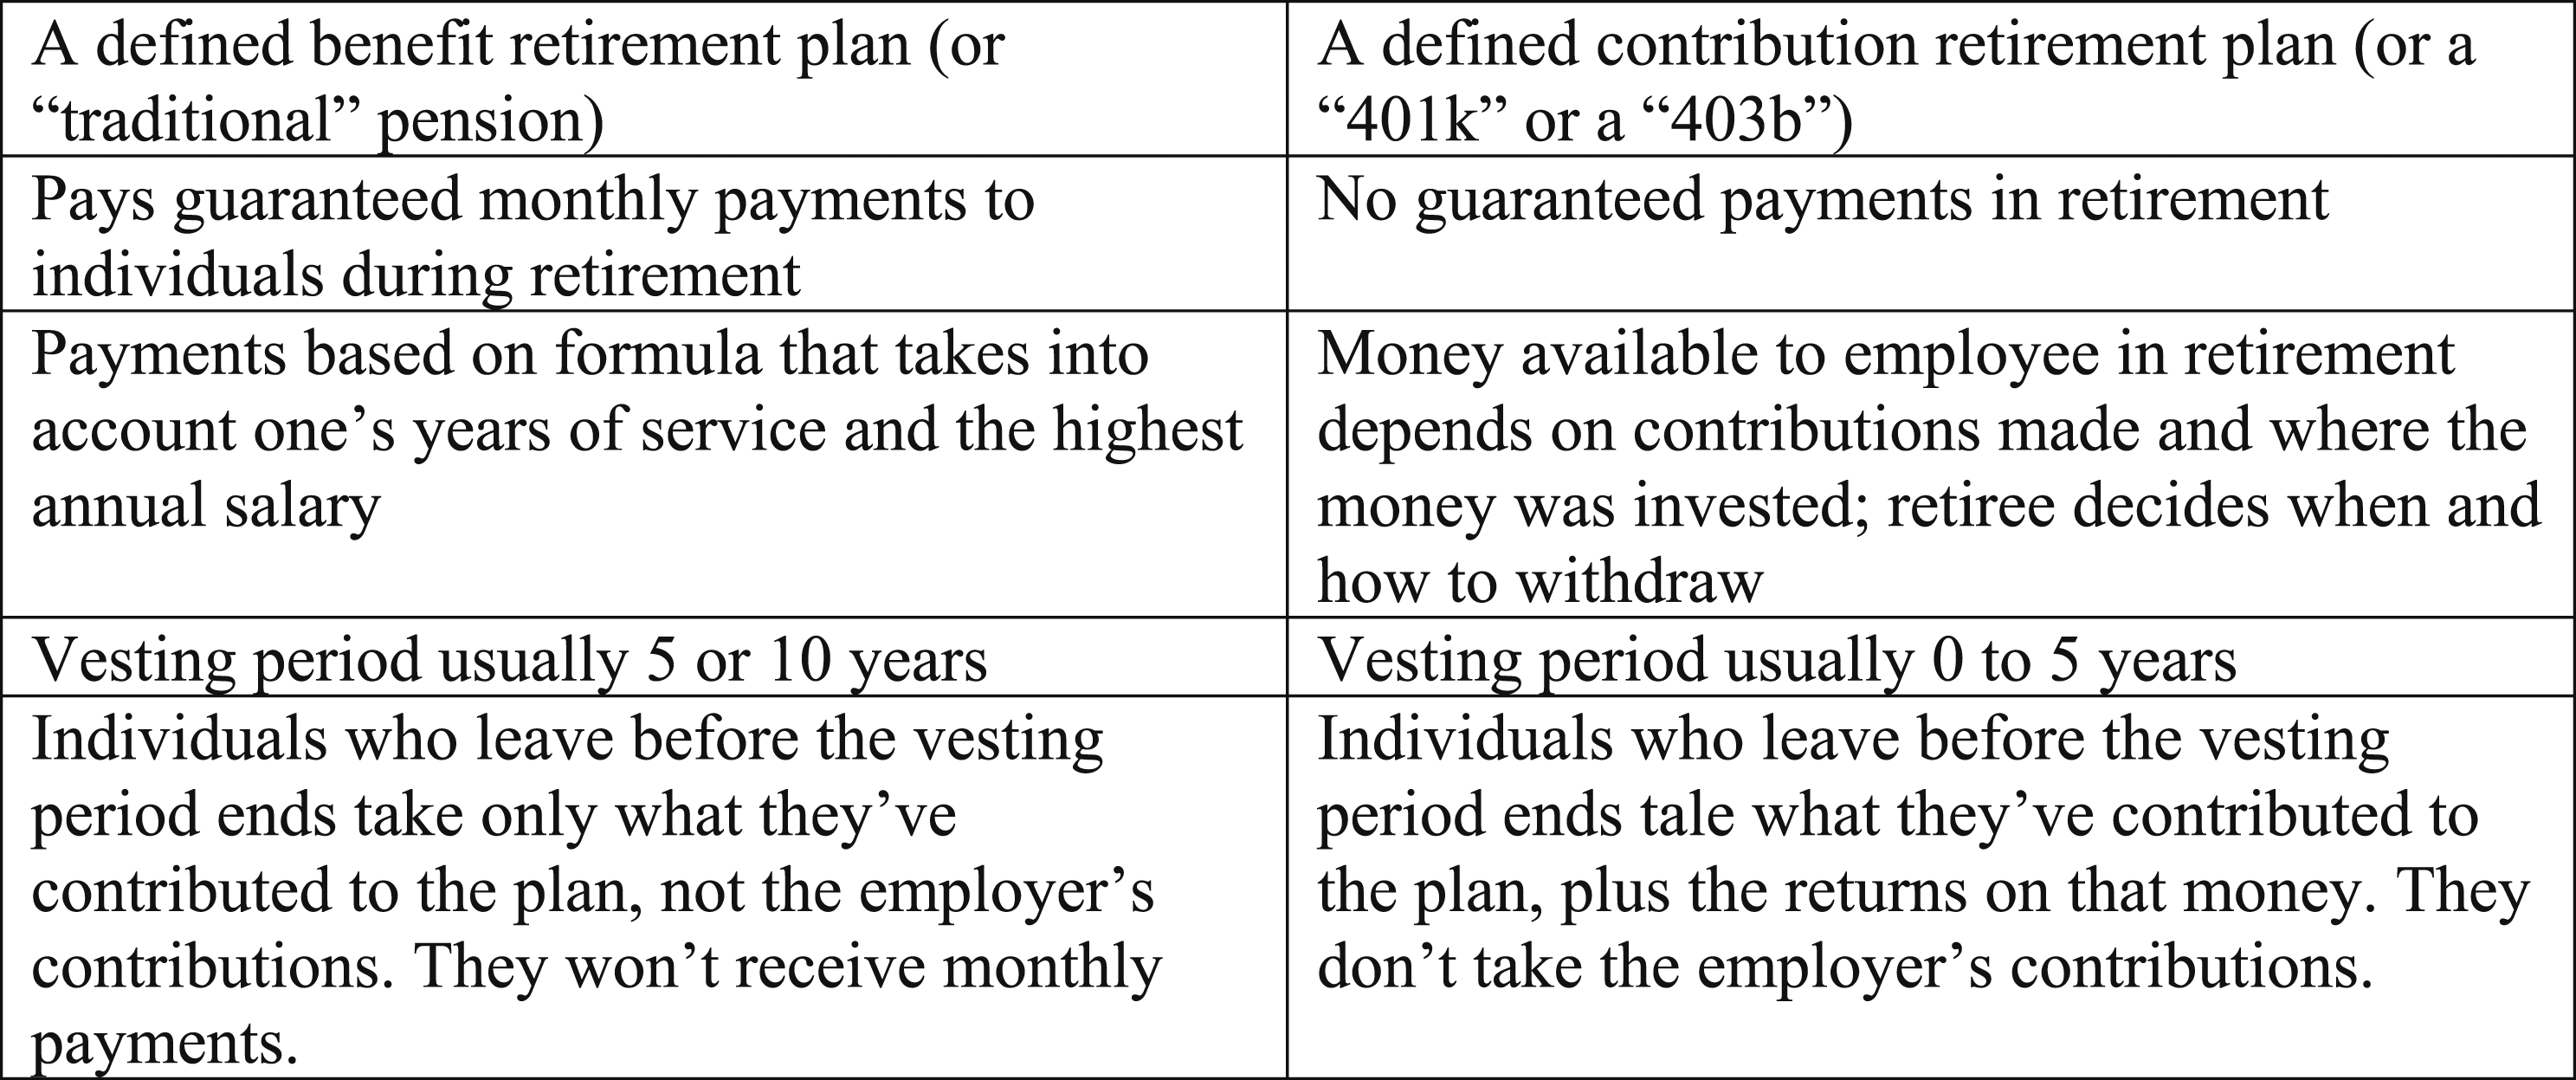
The survey included questions about the respondents’ demographic information and their expectations about income once they start a professional position. The survey also included questions about the respondents’ academic disciplines and type of degree programs, and if they (or a spouse) had previous work experience which was expected to provide retirement income through a DB plan or a DC plan. As U.S. stock markets featured substantial volatility in 2020 (Federal Reserve Bank of St. Louis, n.d.) when this survey was developed and administered, the survey assessed respondents’ opinions about the condition of the U.S. economy and their own financial situation on a four-point scale. Respondents also were asked about their expectations for both in 1 year with responses on a three-point scale.
With approval from the University of Georgia’s (UGA) Institutional Review Board (University of Georgia Office of Institutional Research, 2020), we emailed the link to a Qualtrics survey to 7304 graduate students at UGA in the Fall 2020 semester. To increase the likelihood that individuals would respond, this study used the tailored approach advocated by Dillman et al. (2014). We chose to begin the survey with questions regarding risk tolerance with the expectation that respondents would find those questions to be interesting, increasing the likelihood that they would continue with the remainder of the survey. In addition, the email informed respondents they would receive their scores on the numeracy, financial knowledge, financial skill, risk tolerance, and future orientation scales as a benefit to them in exchange for their time and effort to complete the survey. Initially, 1008 individuals completed the 85-question survey with a median time of completion of approximately 19.5 minutes. However, several respondents left some survey answers blank. Little’s test of missing completely at random (MCAR) resulted in χ2 distance of 3394 with 3363 degrees of freedom and p-value of .3501, indicating the data were MCAR with a significance level of .05. As a result, listwise deletion was used producing unbiased estimates (Schafer & Graham, 2002) and resulting in a final sample of 938 observations, or 12.8% of the UGA graduate student population.
A binary PLANCHOICE variable was created to denote plan preference, with a value of one indicating a preference for a DC option and a value of 0 indicating a preference for a DB option. To analyze this binary dependent variable, ordinary least squares was not appropriate (Long, 1997); instead, a binary logit model was used.
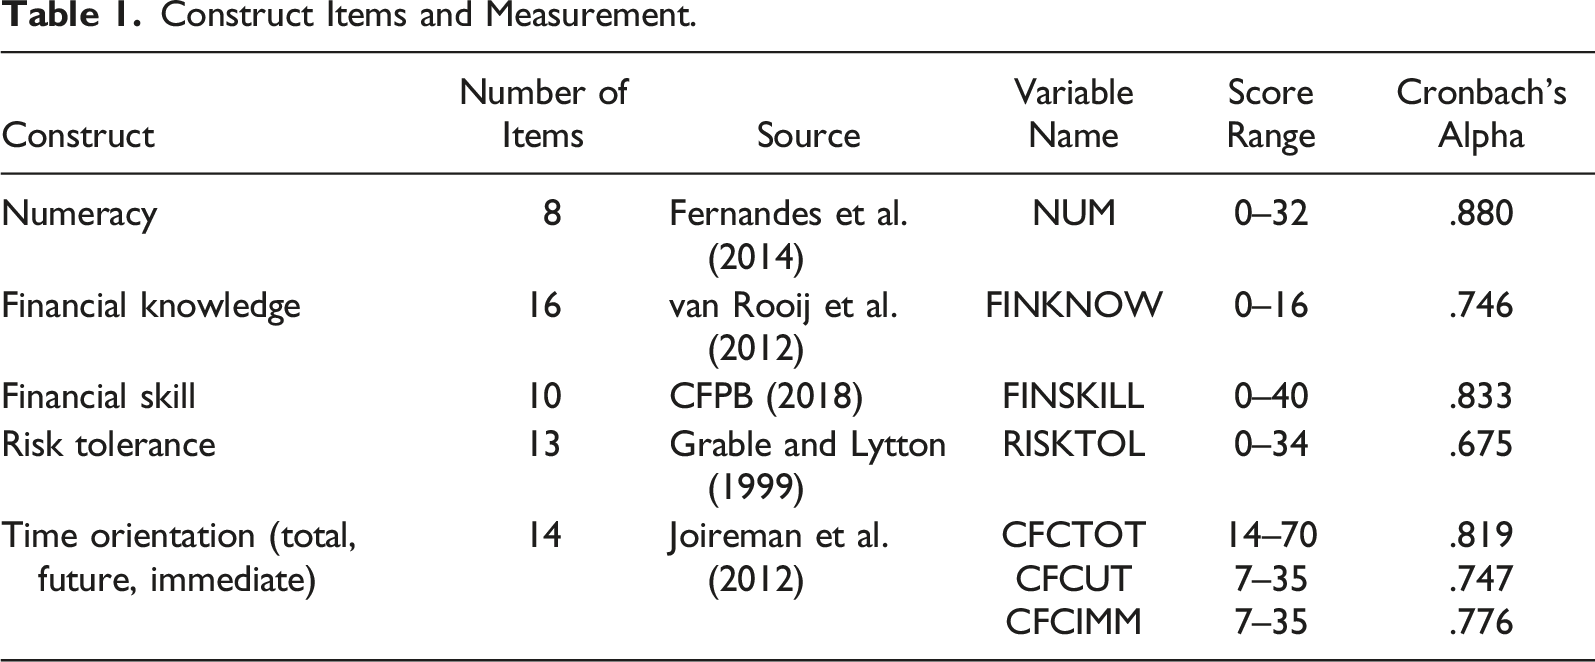
As indicated above, the relevant independent variables were numeracy, financial knowledge, financial skill, risk tolerance, and future time orientation. The variable names and range in scores for each variable are reported in Table 1.
Cronbach’s alphas for each of the scales and subscales are also reported in Table 1. All of the scales and subscales except one had acceptable internal consistency as indicated by alpha values greater than .7 (Adeniran, 2019). The alpha value for the risk tolerance scale was slightly less than .7. However, this risk tolerance scale has been tested extensively (Rabbani et al., 2018), and removing items did not increase the alpha value to the acceptable range.
There were other independent variables in addition to the basic demographic variables. EXPECTPUBLIC was coded as one if respondents expected to work in the public sector and 0 if they expected to work in the private sector. The PENSELIG variable was coded one if the respondent expected to receive retirement income from a DB plan and 0 if not. The SPOUSEDB variable indicated the same expectations for respondents’ spouses or partners.
The ECON (PERFIN) variable was coded from 1 (poor) to 4 (excellent) to indicate the respondents’ view of the current condition of the U.S. economy (personal financial situation). The variables ECONYR and PERFINYR, which indicated respondents’ views about the U.S. economy and their personal financial condition in 1 year’s time, respectively, were coded one to three for responses indicating “worse,” “about the same,” and “better.”
The existing literature (Bannier & Neubert, 2016; Dimmock et al., 2016; Gibson et al., 2013) suggests that there is a relationship between financial literacy and risk tolerance. In particular, greater levels of financial literacy are associated with greater levels of risk tolerance. As a result, we included interaction terms to assess the potential for interdependent results between risk tolerance and numeracy, risk tolerance and financial knowledge, and risk tolerance and financial skill.
Because there were two ways to measure time orientation using responses to the CFCS-14, there were two different logistic regression models. The first model used the aggregated measure of time orientation, combining both the future and immediate items.
The second model used each of the two time orientation subscales as independent variables.
Stepwise logistic regression was used to analyze each of the models. To focus on the specific impact of the financial literacy factors (NUM, FINKNOW, and FINSKILL), these variables were introduced in Step 1a of each model. RISKTOL was the independent variable in Step 1b and CFCTOT in Step 1c (CFCFUT and CFCIMM in Model 2). The next regression included all variables related to financial literacy, risk tolerance, and time orientation as well as interaction terms between the three financial literacy variables and risk tolerance as Step 2 in both models. Lastly, the demographic variables and other control variables were added as independent variables in Step 3 of the logistic regression for each model.
Results
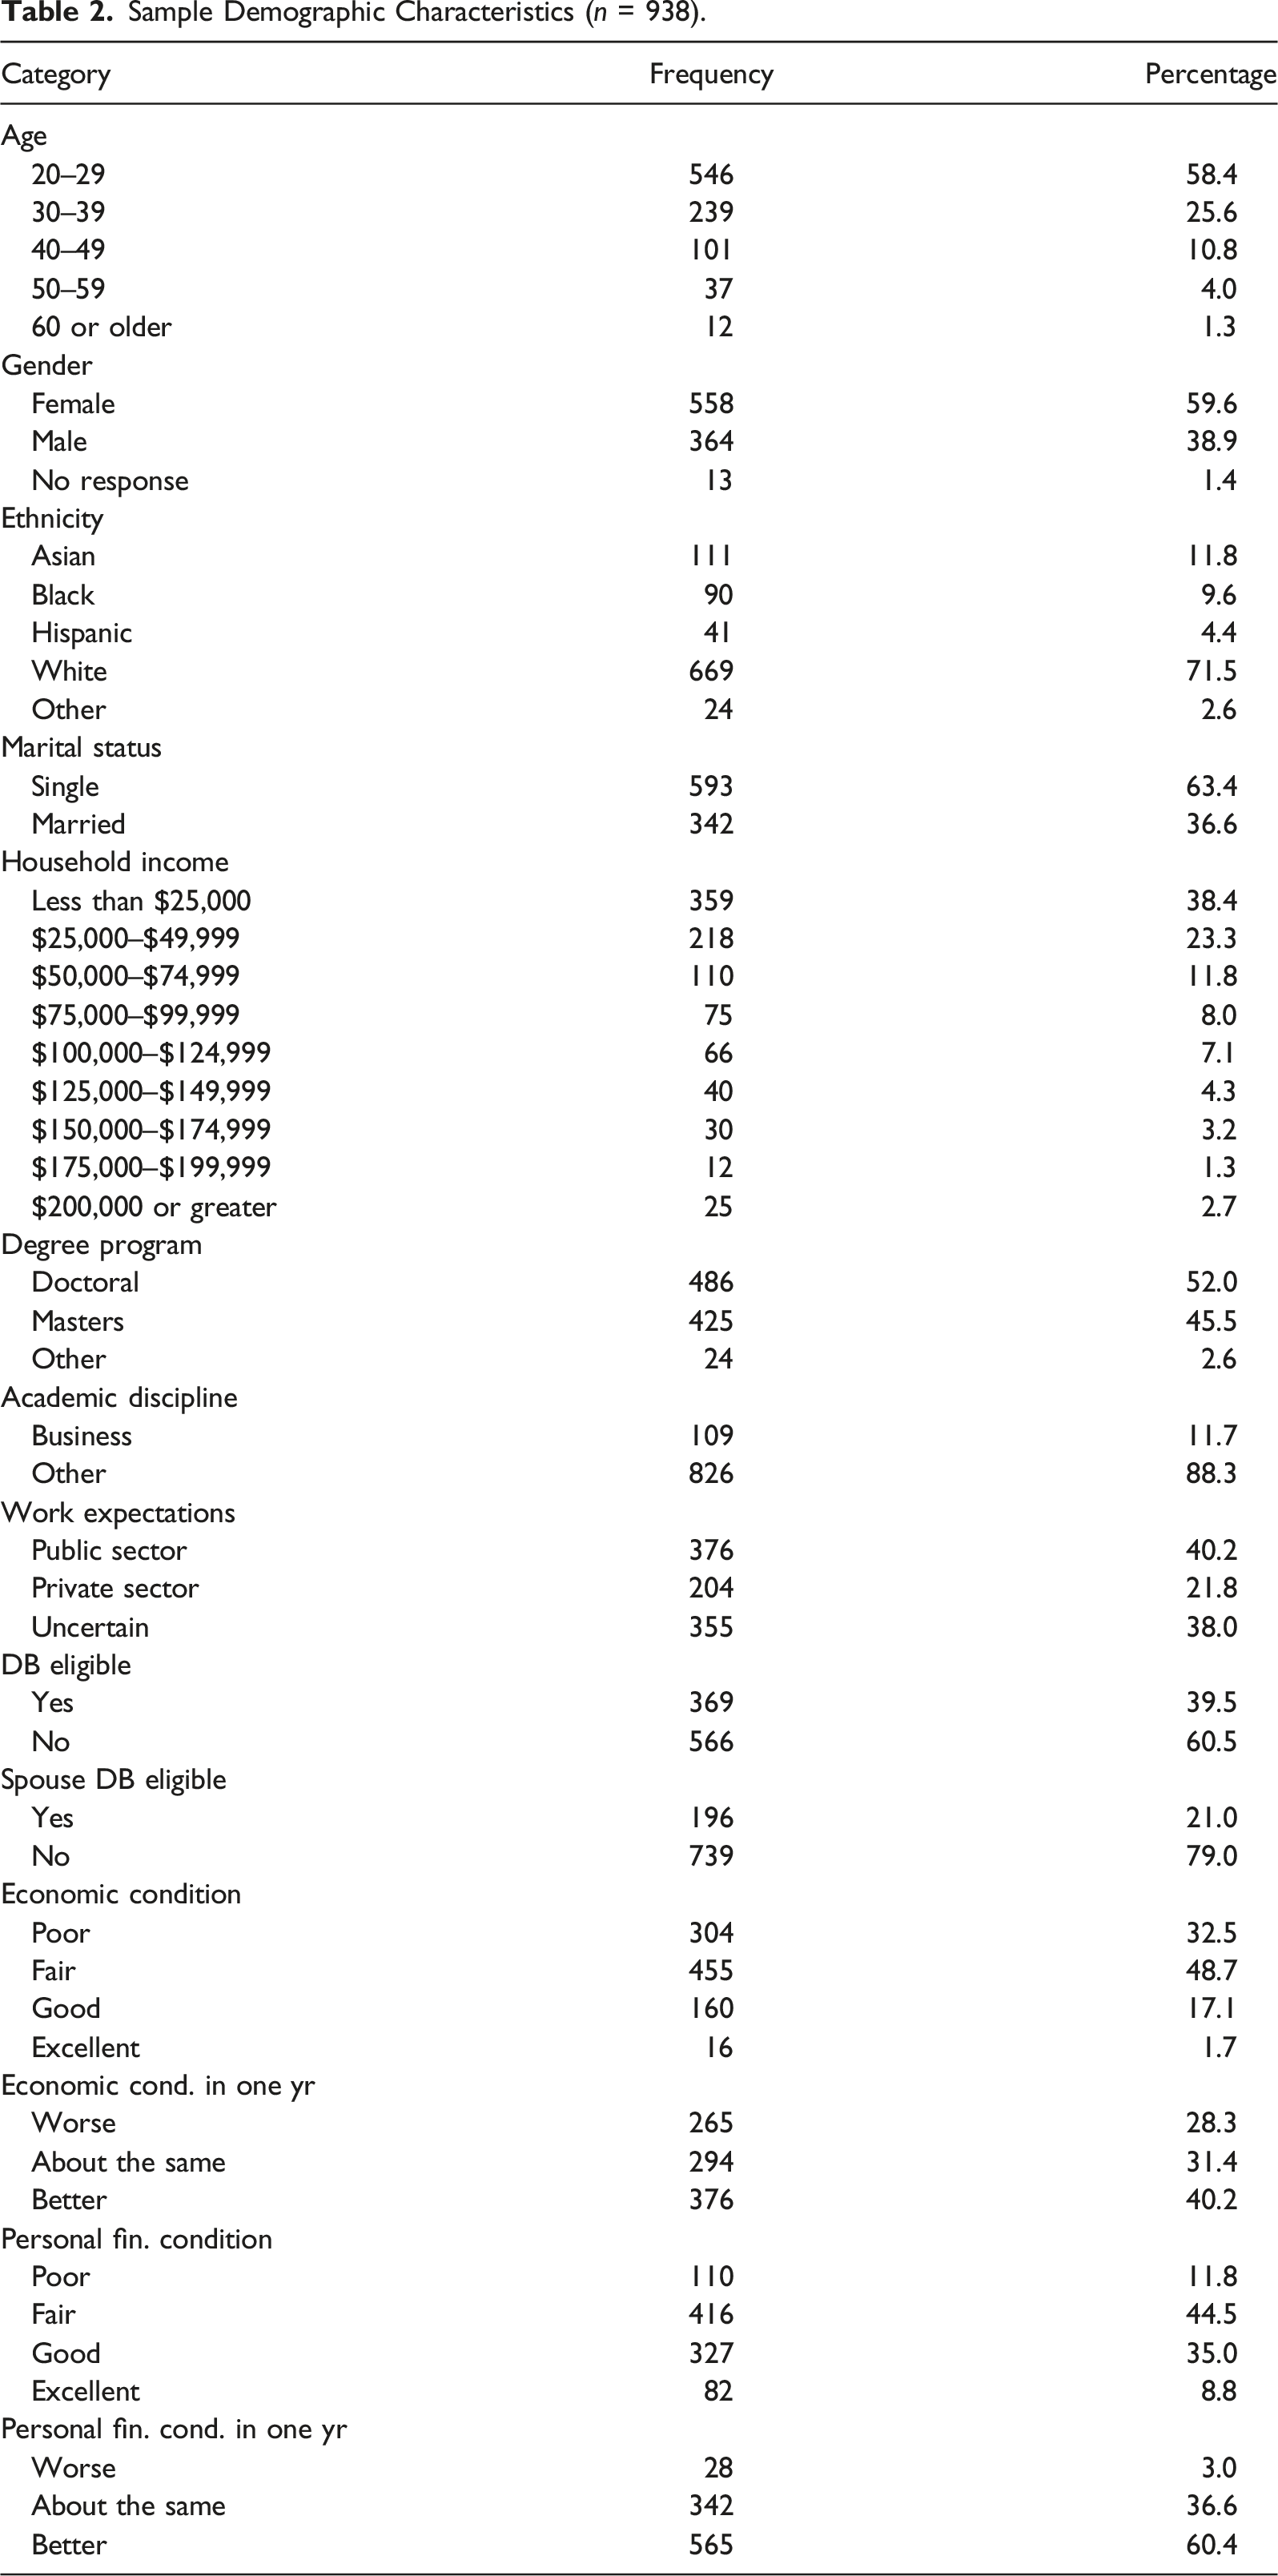
Sample Demographic Characteristics (n = 938).
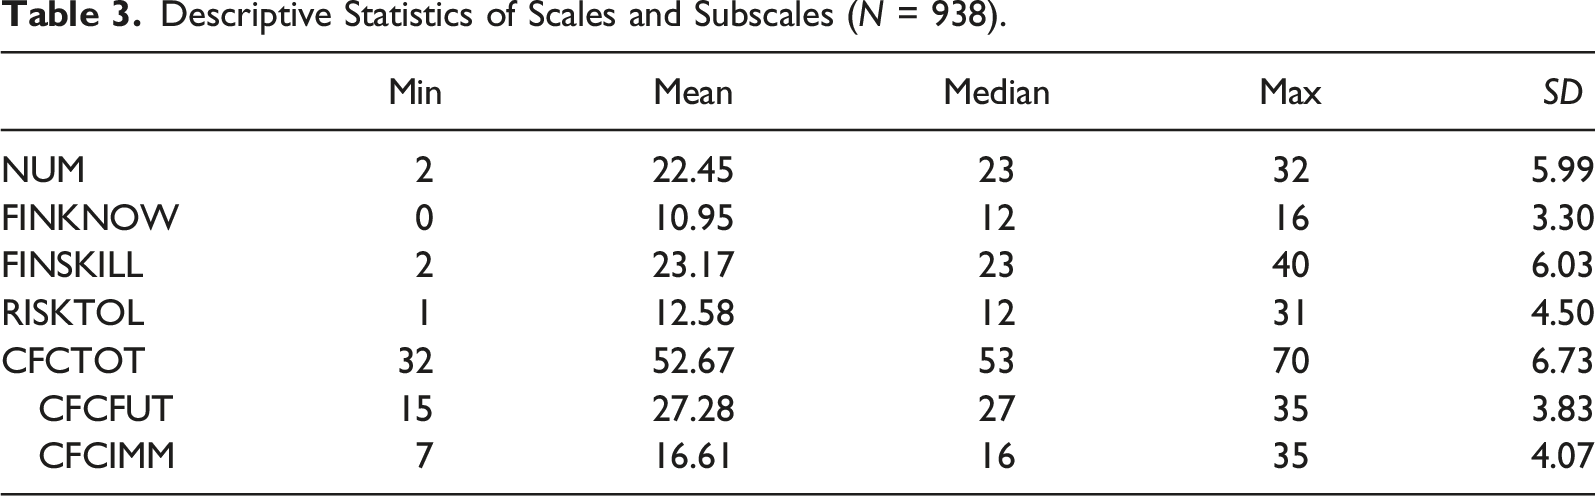
Descriptive Statistics of Scales and Subscales (N = 938).
Construct Mean Values and Standard Deviations by Plan Choice.
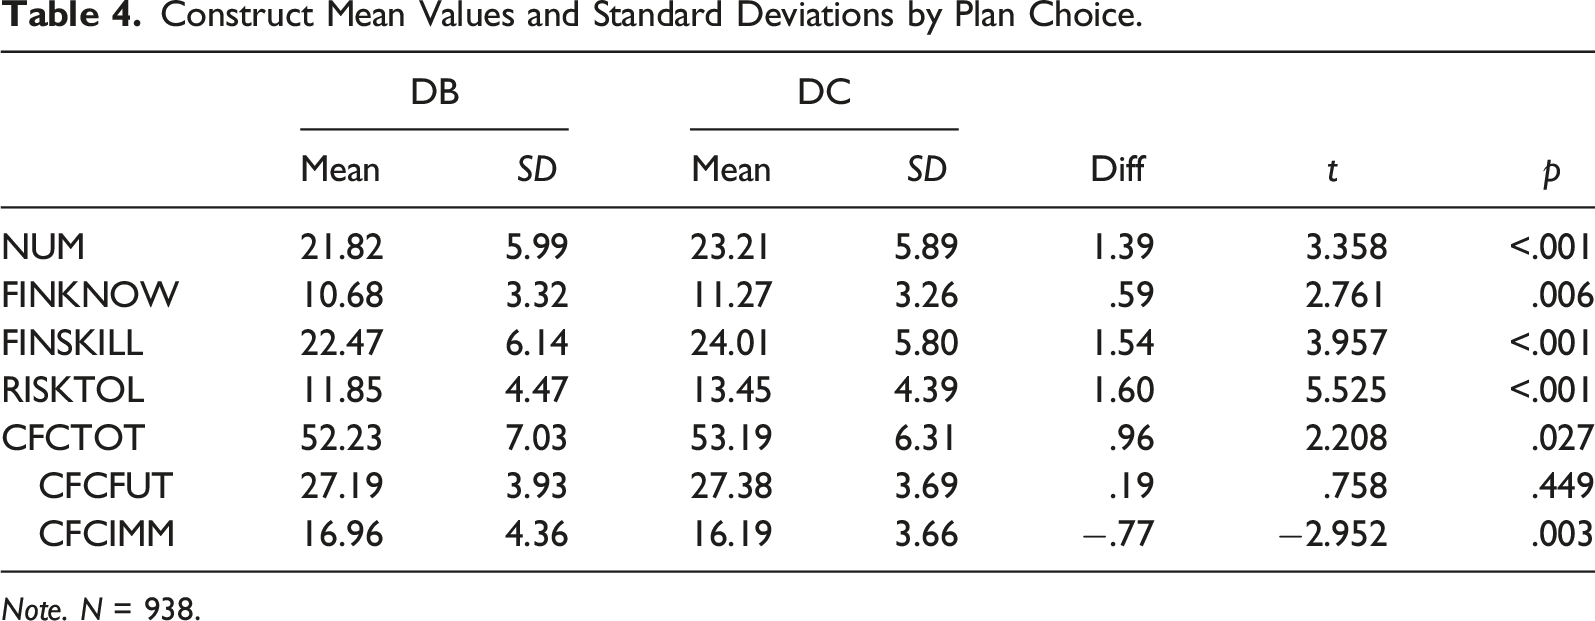
Note. N = 938.
Stepwise Regression Results
Stepwise Regression to Explain Retirement Plan Choice with CFC-Total (n = 938).
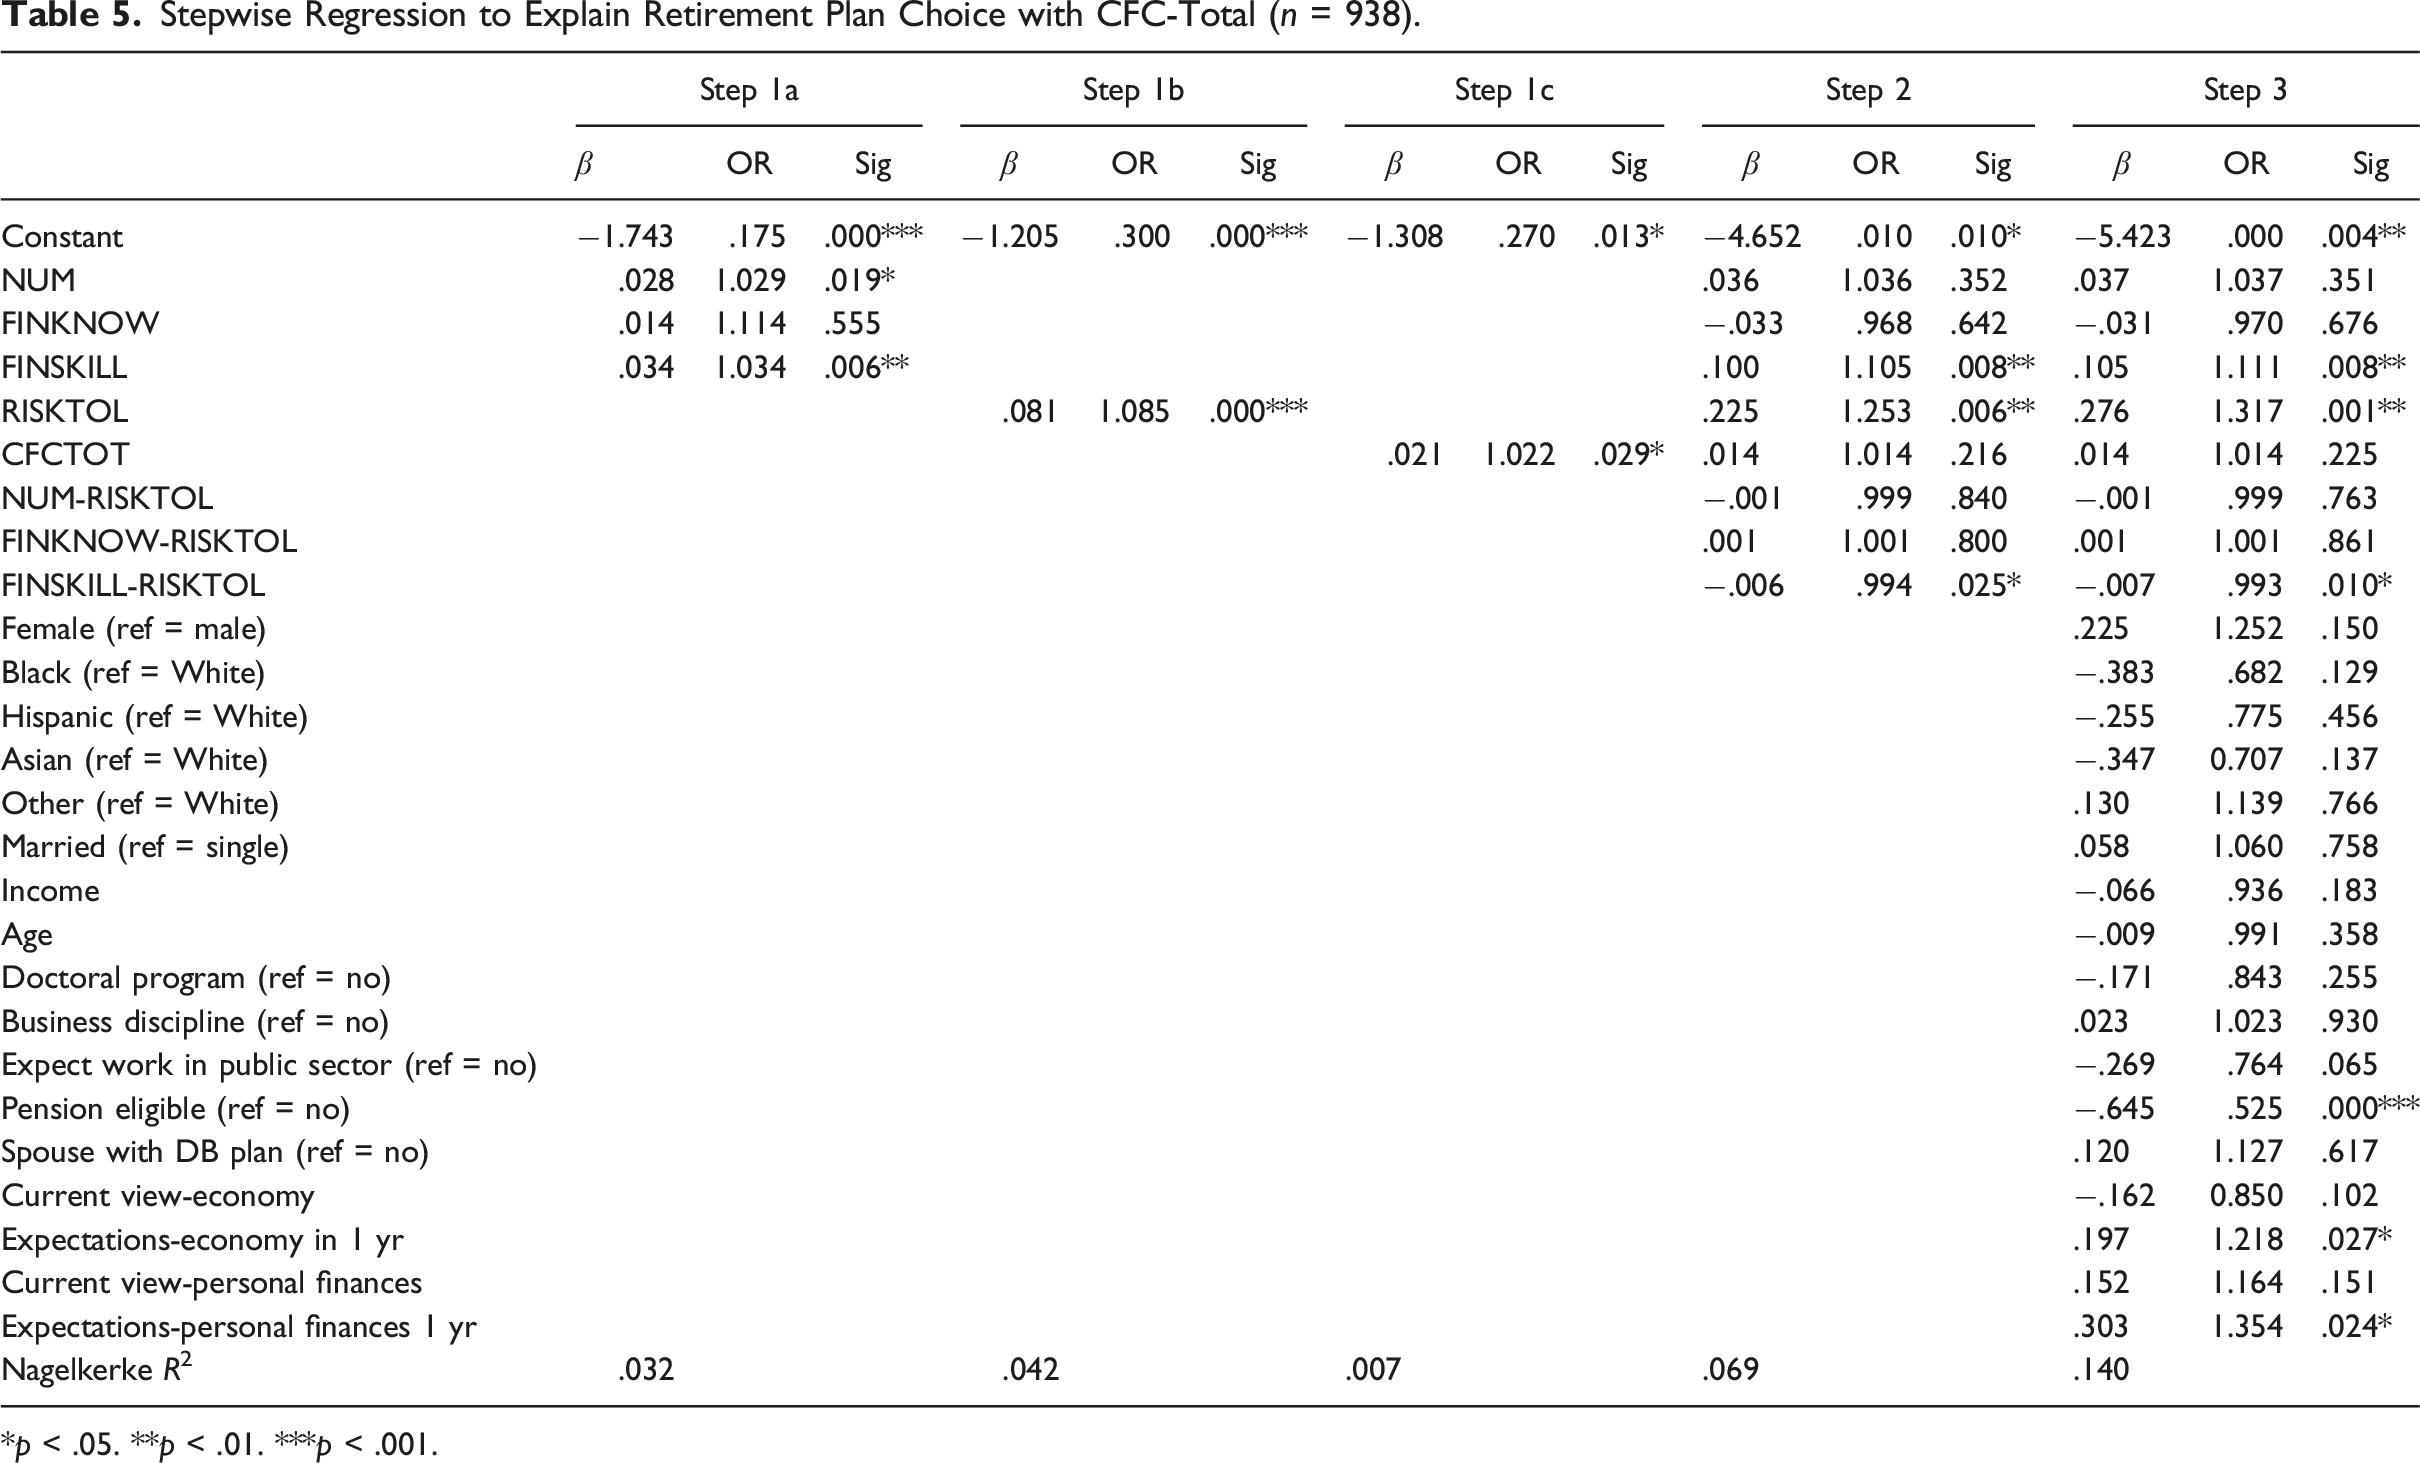
*p < .05. **p < .01. ***p < .001.
Stepwise Regression to Explain Retirement Plan Choice with CFC-Future and CFC-Immediate (n = 938).
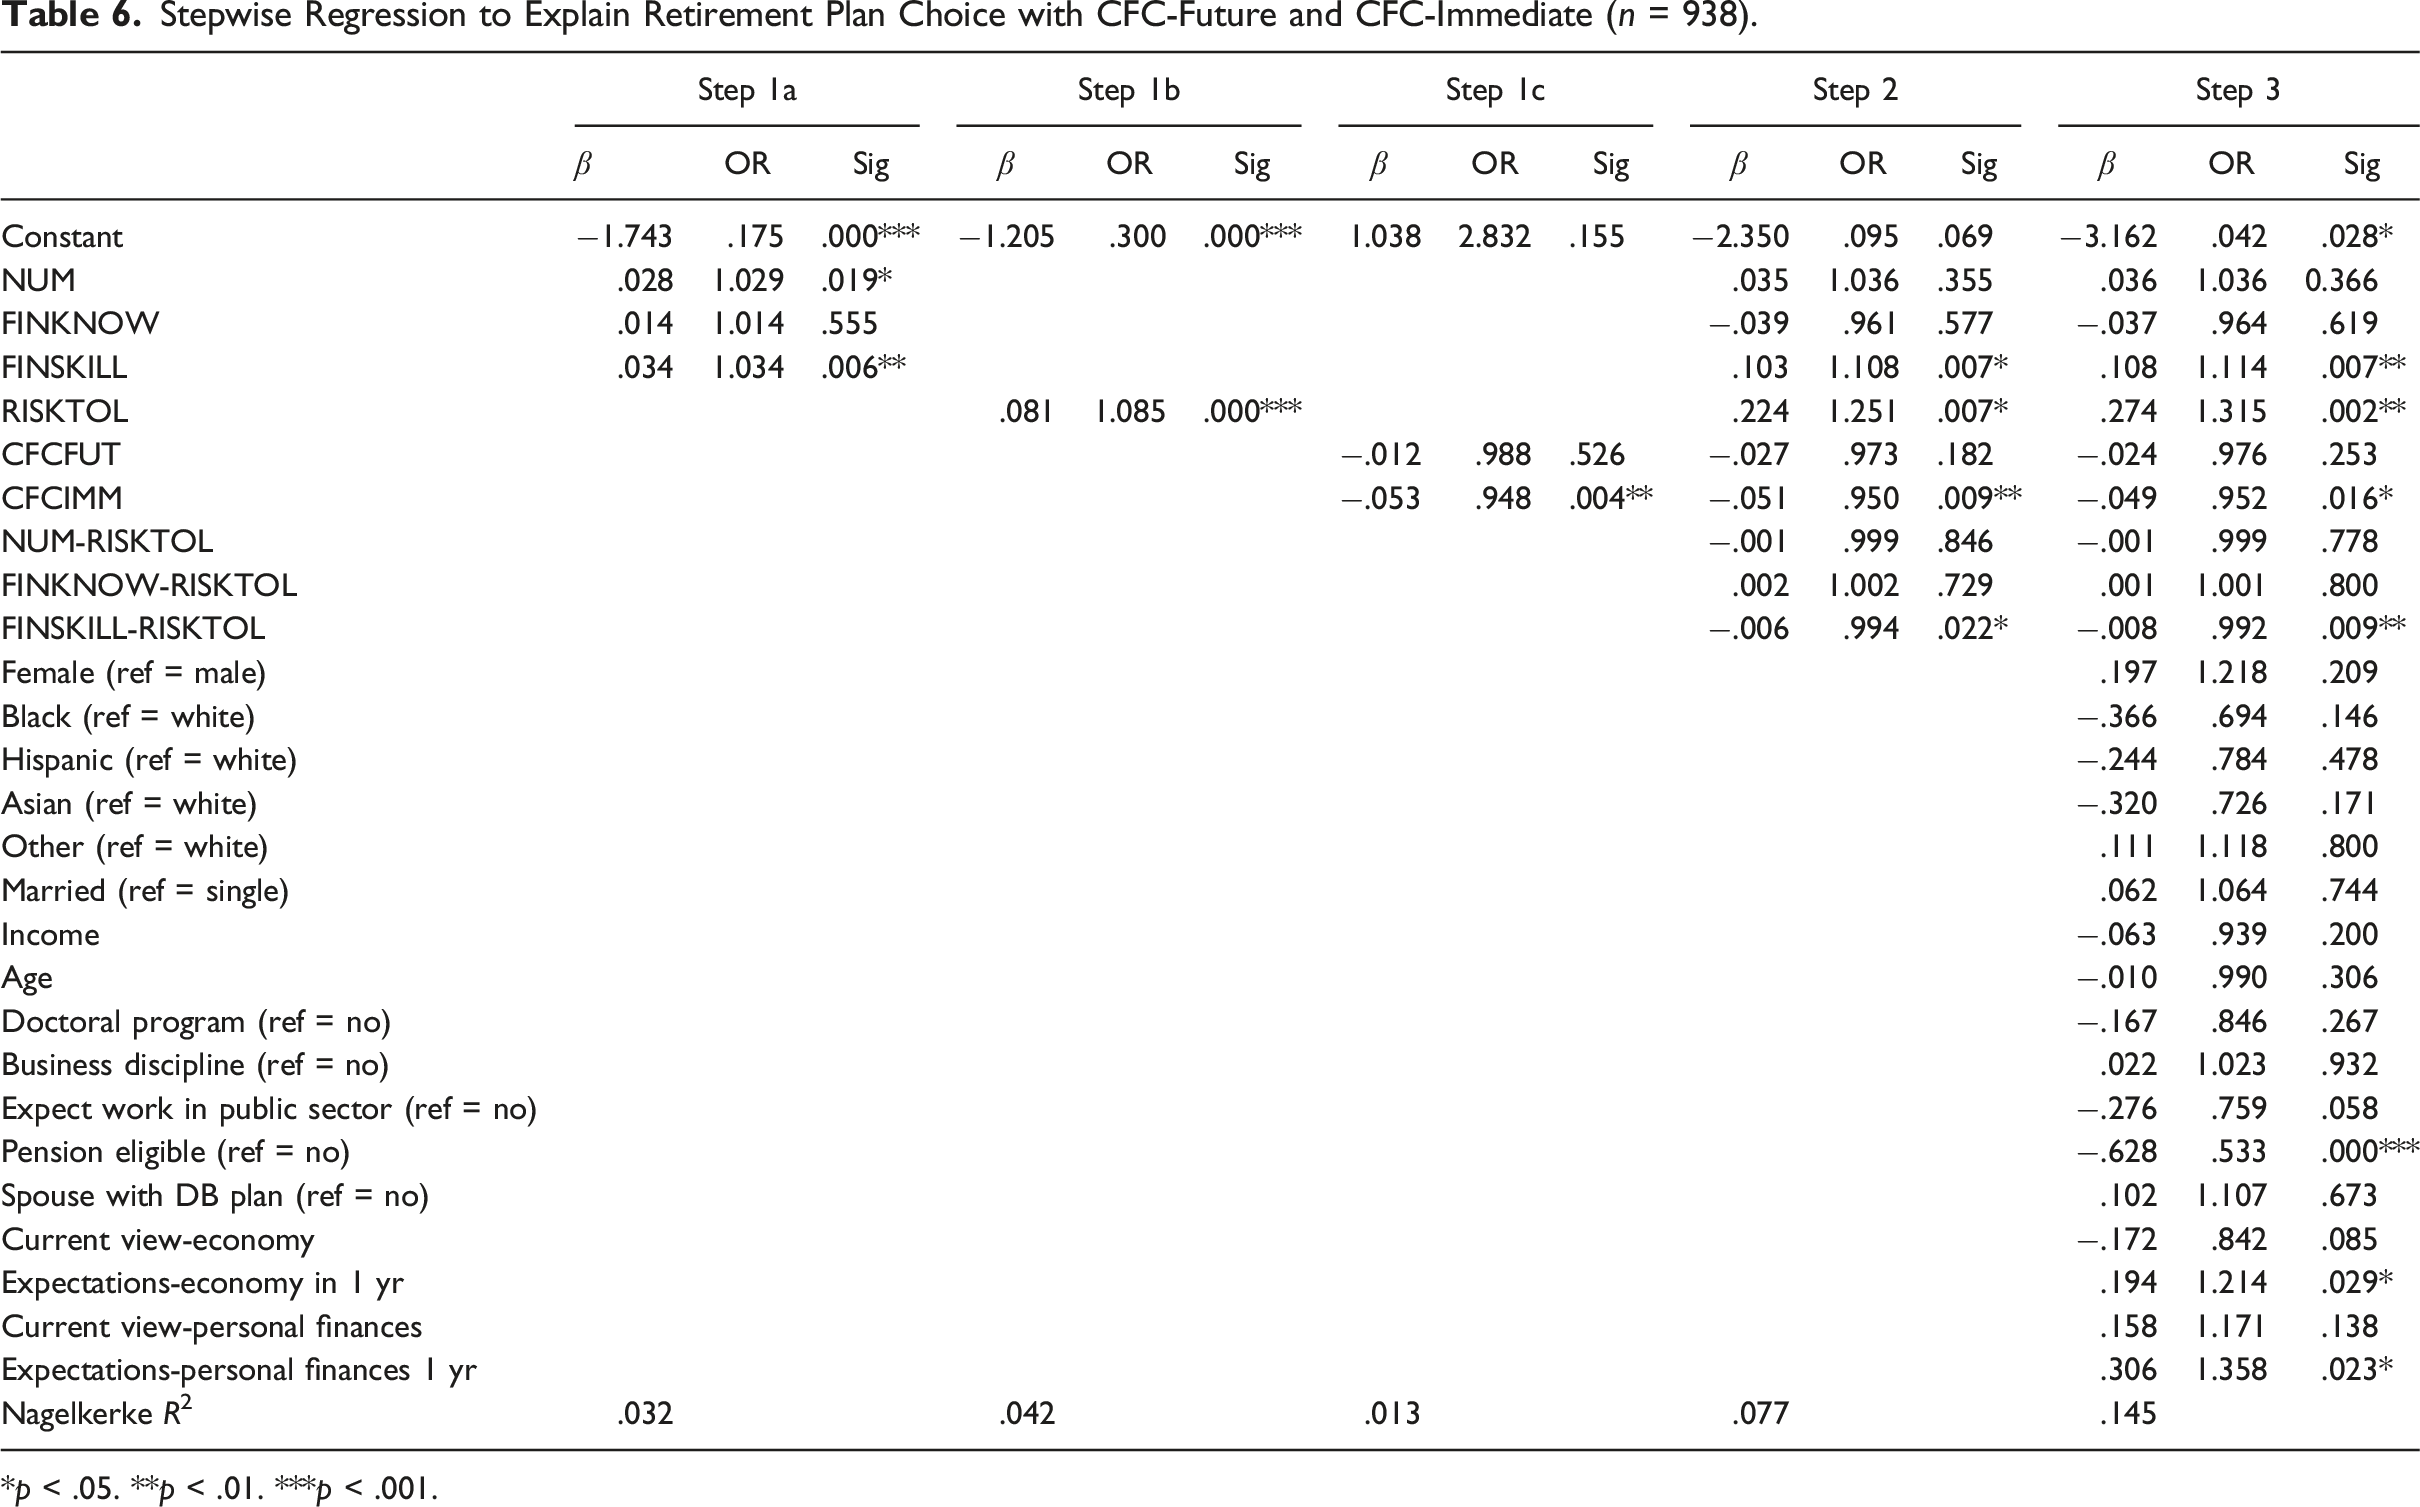
*p < .05. **p < .01. ***p < .001.
Equivalent linear regression models were developed to apply collinearity diagnostics (Midi et al., 2010) and determine if multicollinearity was an issue. As the diagnostics yielded variance inflation factors (VIFs) ranging from 1.026 to 2.146, we concluded that multicollinearity was not an issue as all VIFs were less than 5. To further analyze potential multicollinearity issues, we checked Pearson correlations for all variables used. The highest bivariate correlation had a magnitude of .560, suggesting only a moderate correlation (Ratner, 2009).
Financial Literacy
In the first step of the first model (results reported in Table 5), NUM was significant and positively related to the choice of a DC plan. However, when control variables were added in later steps, the NUM variable was not significant. The same pattern emerged in the second model (results reported in Table 6) in which NUM was not significantly related to plan choice. As such, the results do not support Hypothesis 1a.
The FINKNOW variable was not statistically significant in any of the steps of either model. Thus, the results did not support Hypothesis 1b.
With regard to financial skill, this variable was positively and significantly related to plan choice in each of the three steps of this model. Focusing solely on the impact of this variable, the odds ratio of 1.111 implied an 11.1% increase in the odds of a respondent preferring a DC plan over a DB plan for every one-unit increase in the respondent’s financial skill score. FINSKILL also was significant and positively related to plan choice in each of the three steps in the second model. In Step 3 of that model, the odds ratio of 1.114 implied an 11.4% increase in the odds of a respondent preferring a DC plan rather than a DB plan for every one-unit increase in their financial skill score. Thus, the results support Hypothesis 1a.
Risk Tolerance
RISKTOL was significantly and positively related to plan choice in all steps of both models. Focusing exclusively on risk tolerance, the odds ratio of 1.317 in Step 3 of the first model implied a 31.7% increase in the odds that a respondent would choose a DC plan instead of a DB plan for every one-unit increase in that individual’s risk tolerance score. The odds ratio and relationship in the second model were similar to those in the first model. Thus, the results provide strong support for Hypothesis 2.
Time Orientation
The first model used only CFCTOT to represent time orientation. CFCTOT did not have a statistically significant relationship to plan choice in the later steps of that model that included control variables. The second model used both CFCFUT and CFCIMM as independent variables. Only CFCIMM was statistically significant in all steps and the relationship was negative. The odds ratio for CFCIMM was .952 in Step 3, indicating a 4.8% decrease in the odds that an individual would select a DC plan over a DB plan for every one-unit increase in the CFCIMM score.
Interaction Terms
In Steps 2 and 3, both models included three interaction terms to assess the potential for interconnected effects of the risk tolerance variable and the three financial literacy variables, which were numeracy, financial knowledge, and financial skill. With the goal of improving the interpretation of the interaction terms, we adjusted the numeracy scale and the risk tolerance scale so that the minimum for each scale was zero. The interaction terms between risk tolerance and numeracy and between risk tolerance and financial knowledge were not significant in any step of either model. However, the RISKTOL-FINSKILL interaction term was significantly related to plan choice with an odds ratio of .993 in the first model and an odds ratio of .992 in the second model.
Odds Ratio Scenarios with Interaction Terms.
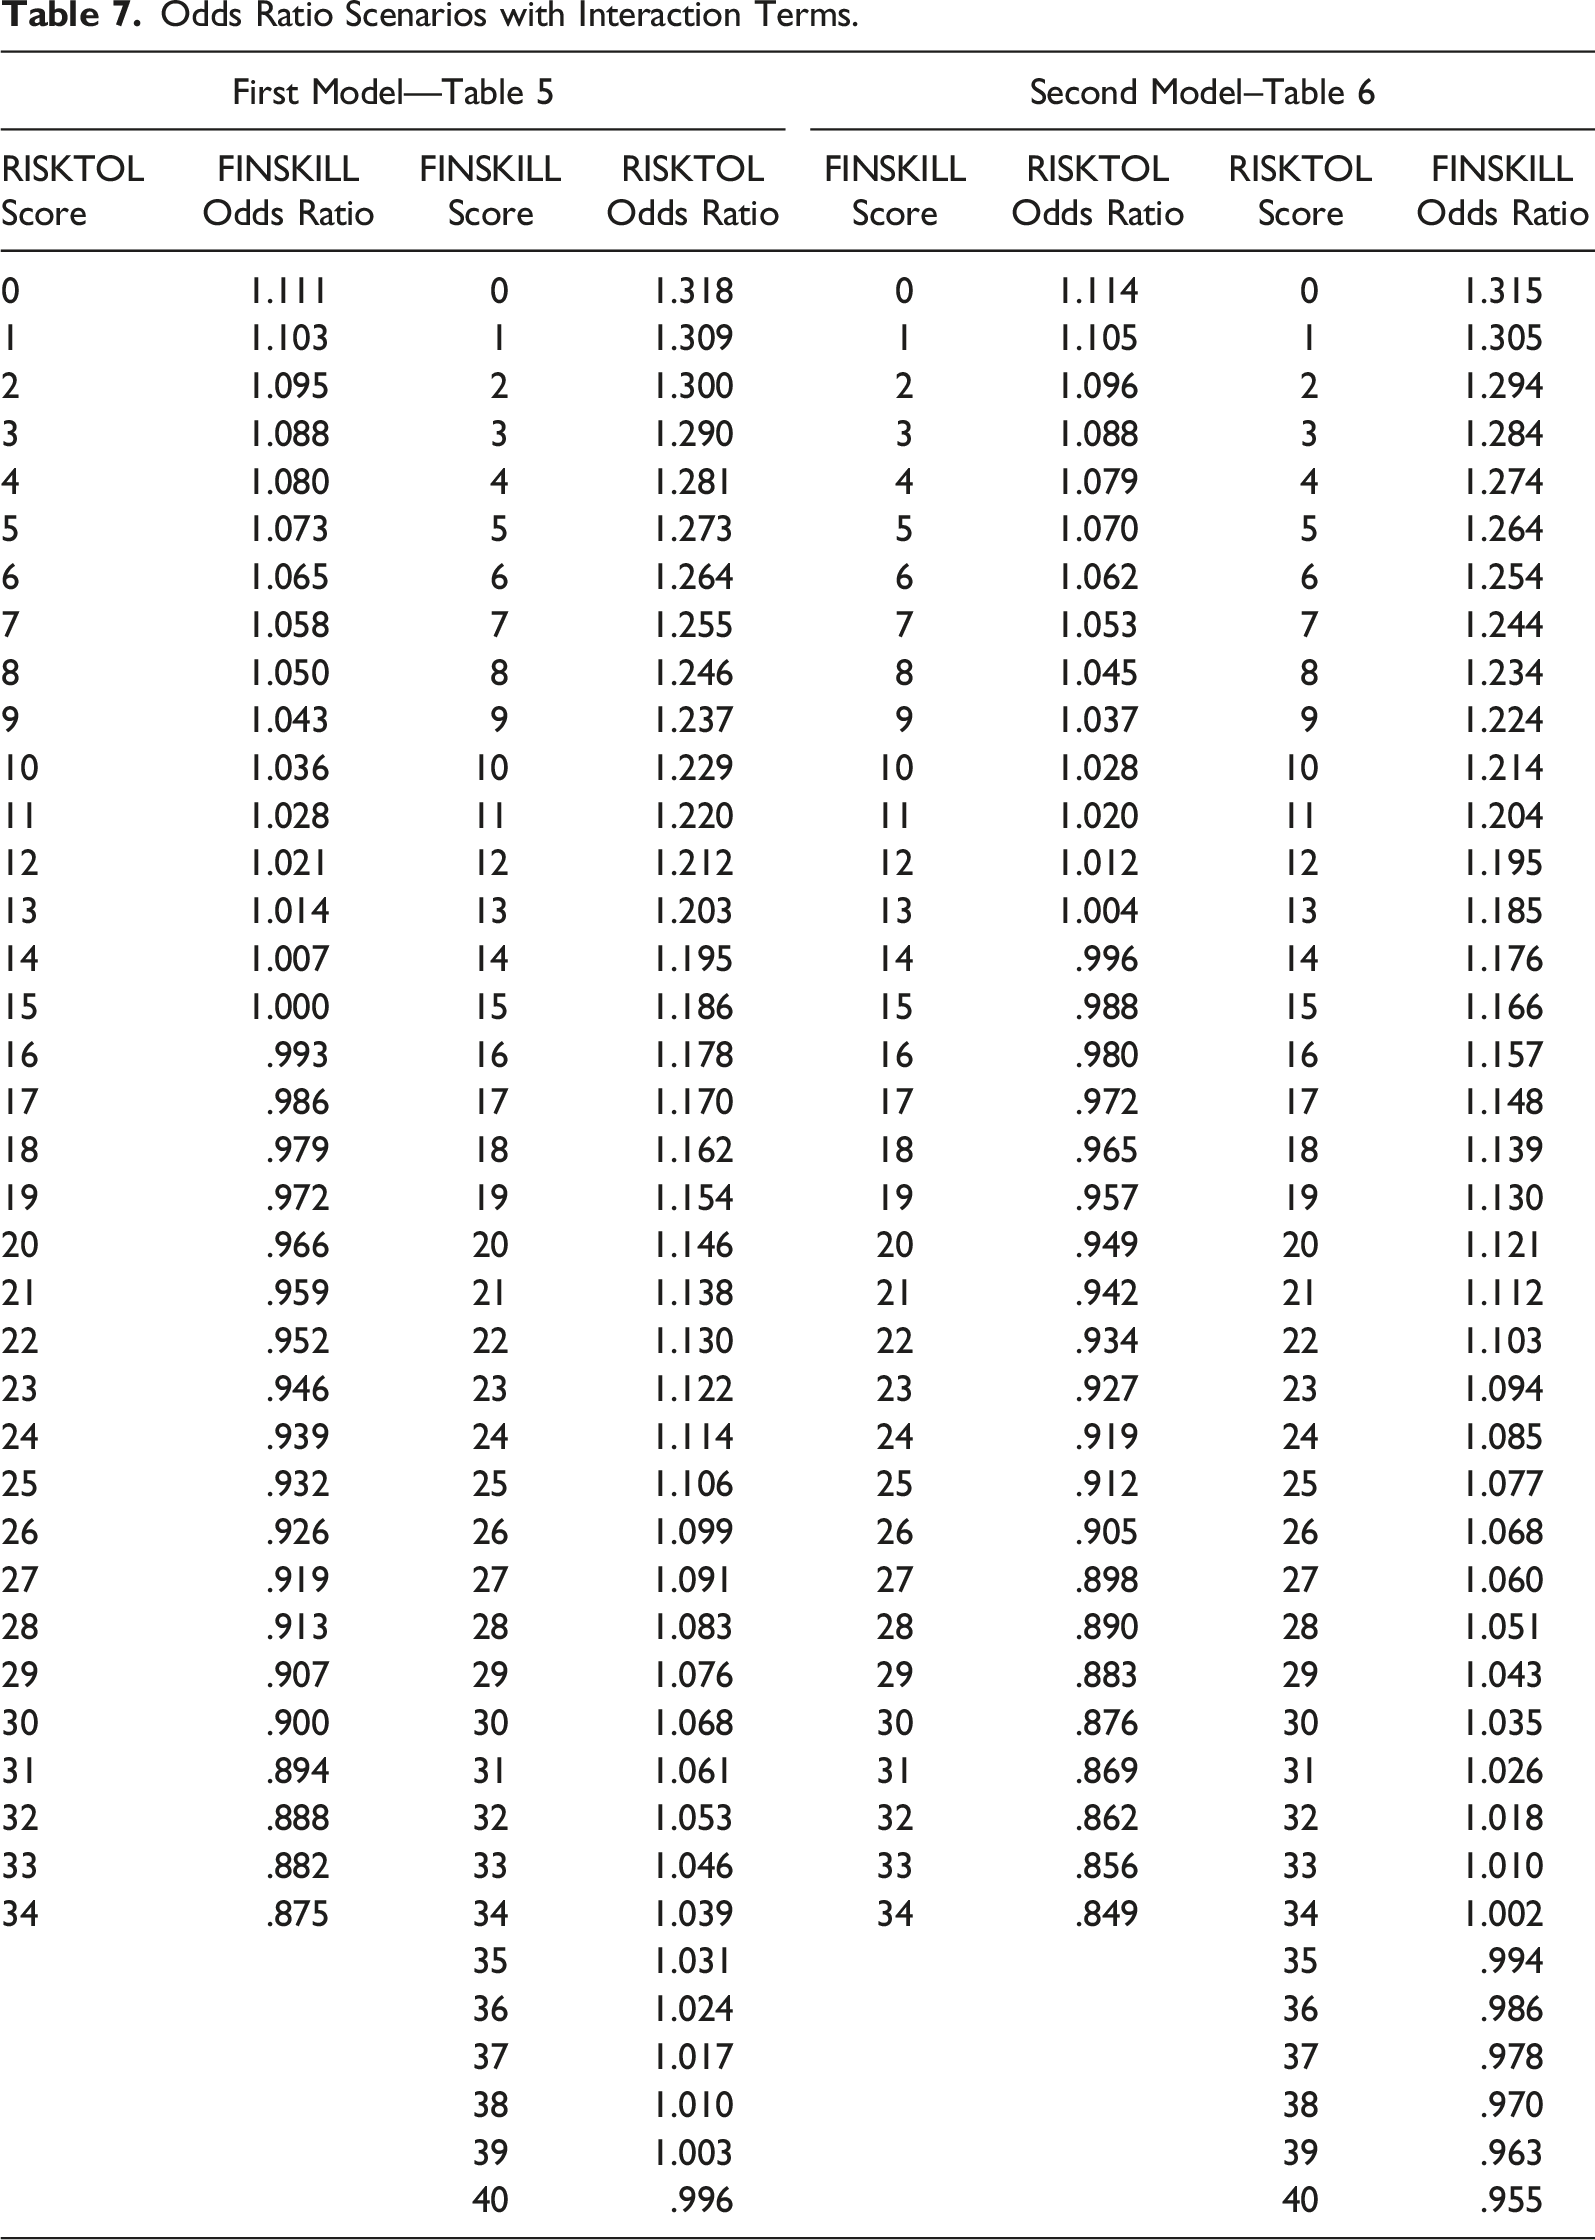
The same pattern of relationship holds in the opposite direction. With a FINSKILL score of zero, the odds ratio for RISKTOL is 1.317, implying a 31.7% increase in the odds of selecting a DC plan for each one-unit increase in RISKTOL. However, with a FINSKILL score of 1, the RISKTOL odds ratio declines to 1.309, implying a 30.9% increase for the same change in the RISKTOL score. With a FINSKILL score of 40, the maximum for that scale, the RISKTOL odds ratio is .996, implying a 0.4% decrease in the odds of selecting a DC plan for each one-unit increase in RISKTOL.
A similar relationship is evident in the second model as indicated in Table 7. Again, an increase in either RISKTOL or FINSKILL dampens the impact of the other variable.
Demographic Characteristics
None of the demographic characteristics was significantly related to plan choice in either model. This is somewhat surprising as previous researchers had found that younger individuals (Ali & Frank, 2019; Gerrans & Clark, 2013) and individuals with higher incomes (Brown & Weisbenner, 2014; Clark & Pitts, 2002) prefer DC plans. The lack of significant results in this study regarding the impact of gender on plan preference is not as surprising given the mixed results related to gender reported by other researchers (Ali & Frank, 2019; Gerrans & Clark, 2013).
Other Control Variables
Among the control variables, only PENSELIG, ECONYR, and PERFINYR were significant in the last step; all three were significant in both models.
PENSELIG, a binary variable with a value of one if the individual was eligible to receive benefits from an existing DB plan, was negatively related to plan choice. The odds ratio of .525 in the final step of the first model suggested a 47.5% decrease in the odds that an individual would select a DC plan versus a DB plan if the individual was eligible for benefits from an existing DB plan.
The variables ECONYR and PERFINYR, which assessed respondents’ expectations about the condition of the U.S. economy and their personal financial situation in 1 year’s time, were statistically significant and positively related to plan choice in both models. In the first model, the odds ratio of 1.218 for ECONYR indicates a 21.8% increase in the odds an individual would choose a DC plan rather than a DB plan for every one-unit increase in that individual’s expectations regarding the economy in 1 year. In the second model, the odds ratio was 1.206. The results for the PERFINYR variables were similar but with slightly higher odds ratios (1.354 in the first model and 1.358 in the second model).
Conclusions
Overall, the analyses provided support for the importance of risk tolerance, financial skill, and one element of time orientation as influences on retirement plan choice. Individuals with greater risk tolerance were more likely to select DC plans rather than DB plans. The significance of risk tolerance was expected given that DC plans require employees to bear all of the investment risk (Gerrans & Clark, 2013). Risk-tolerant individuals are more comfortable investing in equities which have more volatility but also a greater potential for returns, especially if investing for the long run as in investing for retirement. Those who select a DC plan may have the potential for higher retirement income than those who choose a DB plan (Craig & Toolson, 2008).
Financial skill, a component of financial literacy, was positively related to choosing a DC plan. This result was not surprising since individuals must have the ability to apply financial knowledge in order to perform financial activities (Atkinson et al., 2007; Huston, 2010). With a DC retirement plan, the individual faces more financial decisions and must be able to find and use reliable information to make those decisions.
In contrast, it was somewhat surprising to observe the interrelationship between risk tolerance and financial skill. For these variables, the interaction suggested that an increase in one variable dampens the impact of the other variable. With regard to financial skill, as an individual has higher levels of risk tolerance, the impact of financial skill on the selection of a DC plan initially “wears off.” Initially, the influence of financial skill on the choice of a plan declined slightly. At particularly high levels of risk tolerance, an increase in financial skill makes individuals less likely to select a DC plan. The same relationship holds for risk tolerance but to a lesser extent. As an individual has higher levels of financial skill, the impact of risk tolerance on the selection of a DC plan declines, but in the case of risk tolerance only at the highest possible financial skill level is there a decrease in the likelihood of selecting a DC plan. Both traits together are not required for an individual to prefer a DC plan. In particular, individuals with relatively high levels of risk tolerance do not require substantial financial decision-making abilities to make them comfortable with a DC plan. Their ability to accept risk overshadows their inability to find and process financial information to make financial decisions. In shaping preference for a DC plan, individuals likely need either financial skill or risk tolerance, but the results suggest it is not necessary that they have both.
Respondents with a present-time orientation were less likely to select a DC plan. To their credit, individuals with an immediate time orientation seemed aware that their focus on the present meant they were less well-suited to the extensive planning associated with a DC plan. Neither the total scale (CFCS-14) nor the CFC-Future scales were significant influences on retirement plan choice. Joireman et al. (2012) noted that future orientation and immediate orientation cannot accurately be viewed as polar opposites. Perhaps graduate students’ projections to “the future” may be shorter term than would be true of a sample that was more representative of the general population.
While financial knowledge often has been used as the only element of financial literacy included in previous research, (e.g., Gustman et al., 2012; Hauff et al., 2020; Lusardi & Mitchell, 2011), in this analysis it was not significantly related to plan choice in any of the steps in either model. The lack of a relationship between objectively-measured knowledge and plan choice is not entirely surprising given that retirement planning has more often been associated with perceived rather than actual knowledge in previous research (Robb & Woodyard, 2011).
Similarly, numeracy is an element of financial literacy in that previous research has suggested that individuals with greater quantitative abilities are better suited to managing financial investments (Gustman et al., 2012). However, in this analysis numeracy was not significantly related to plan choice in any of the steps in either model. It is likely that individuals relied more on specific abilities related to financial decisions as opposed to general quantitative abilities in forming their preferences for one type of retirement plan or the other.
Another potentially noteworthy finding was that individuals who were eligible to receive benefits from an existing DB plan from prior work experience were less likely to prefer a DC plan. Those who are eligible to receive benefits from an existing DB plan may know more about and be more comfortable with that type of plan. However, financial planning experts might recommend that they diversify their retirement planning and choose a DC plan if they already have a DB plan.
Among the control variables, it was somewhat surprising to see that there was not a significant relationship between marriage and plan choice nor a significant relationship between having a spouse with a DB plan and the respondent’s plan choice. While these results were somewhat unexpected, they do echo those of Clark and Pitts (2002), who found no relationship between marital status and plan choice and also no relationship between a spouse with a DB plan and plan choice. It could be reasonable for married individuals to choose different plan types in an effort to diversify. However, another possibility may be that the retirement plan preferences of one spouse shape those of the other spouse. The existence of these two opposing incentives may have contributed to the lack of significance of these variables in this analysis.
While the respondents’ outlook on the future of the U.S. economy and their personal financial situation was significantly related to plan choice, their perception of the current condition of both was not. This somewhat contradicts previous research indicating a negative relationship between current economic conditions and preferences for DC plans (Brown & Weisbenner, 2014; Chingos & West, 2015). Since the survey was administered in September 2020, it is likely that respondents were aware of the substantial volatility in the stock market in the preceding months, with the S&P 500 Index declining from a high of 3386.15 on February 19, 2020, to a 3-year low of 2237.40 on March 23, 2020 (Federal Reserve Bank of St. Louis, n.d.). However, it is likely that some respondents viewed this decline in the market as a temporary event caused by the pandemic as opposed to a more permanent impact on the market or the economy. As a result, they may have focused more on their long-term expectations, which may have shaped their preference for a DC plan as opposed to a DB plan. It could be helpful for future research to compare results regarding plan preference during the pandemic with those from a similar analysis at a time without such external influences.
A significant limitation of this research is that the respondents’ choice of a DB plan or a DC plan in the survey could be impacted by their understanding of the differences between the plan types. While the survey did include an explanation of the basic characteristics of DB plans and DC plans, it may be possible that individuals did not differentiate between the plans correctly. Such inaccuracies have been evident when individuals did not know the type of pension plan in which they were participating (Mitchell, 1988) and when they could not determine if they currently were participating in a DB plan or a DC plan (Gustman & Steinmeier, 2004). In future research, it would be possible to address this concern by adding a knowledge question to the survey to verify that respondents read and understood the explanation of both retirement plan types as listed in the survey.
Another significant limitation of this research is the sample of graduate students, as they are not representative of all U.S. workers. The survey did not ask respondents if they were in the labor force at the time of the survey. Such employment could bias their responses toward one type of retirement plan or the other. Furthermore, more than 40% of the respondents indicated a preference to work in the public sector, which is three times the proportion (13.8%) of the labor force that works in that sector (U.S. Bureau of Labor Statistics, 2020c). However, greater interest in public sector employment was useful in this research as that is the sector in which the majority of employers offer DB plans. A broader and more representative sample could be informative in future research.
Another limitation of this research was the reliability of the risk tolerance scale. The reliability of the scale may improve in future research if the sample is larger. With regard to the general concept of risk tolerance, our current analysis of the concept focused on portfolio risk, which is relevant to an individual’s choice between a DB plan and a DC plan. However, it is likely that mobility risk is also relevant to this choice. Since DB plans generally feature long vesting periods (Andrietti & Hildebrand, 2016), an individual who selected a DB plan and then left their position before the vesting period ends effectively forfeits all or part of the employer contributions to their retirement plans. Thus, individuals who enroll in DB plans are likely to incur greater mobility risk than those who enroll in DC plans, which generally have shorter vesting periods (Burke et al., 2017). Future research that combines analysis of portfolio risk with mobility risk would be beneficial.
The current study contributes to the understanding of the factors that shape preferences for DC plans versus DB plans with a focus on the roles of financial literacy, risk tolerance, and time orientation in determining plan choice. Previous research about retirement plan preference included a specific focus on mobility risk (Clark & Pitts, 2002; Coco & Lopes, 2011), market conditions (Brown & Weisbenner, 2014; Chingos & West, 2015), and demographic factors (Ali & Frank, 2019; Gerrans & Clark, 2013). The current study adds to the literature by noting the influence of financial skill, risk tolerance, and time orientation on retirement plan choice.
Supplemental Material
Supplemental Material - Factors that Influence Preferences for Defined Benefit Plans Versus Defined Contribution Plans
Supplemental Material for Factors that Influence Preferences for Defined Benefit Plans Versus Defined Contribution Plans by Michael P. Ryan, and Brenda J. Cude in The American Economist.
Footnotes
Authors’ Note
This paper is applied research.
Declaration of Conflicting Interests
The author(s) declared no potential conflicts of interest with respect to the research, authorship, and/or publication of this article.
Funding
The author(s) received no financial support for the research, authorship, and/or publication of this article.
Supplemental Material
Supplementary material for this article is available online.
Author Biographies
References
Supplementary Material
Please find the following supplemental material available below.
For Open Access articles published under a Creative Commons License, all supplemental material carries the same license as the article it is associated with.
For non-Open Access articles published, all supplemental material carries a non-exclusive license, and permission requests for re-use of supplemental material or any part of supplemental material shall be sent directly to the copyright owner as specified in the copyright notice associated with the article.