
Abstract
An individual’s financial risk tolerance (FRT) has an important role in their financial decisions. Hence, it is a recent topic of interest. Research shows a strong relationship between financial literacy and risk aversion. Little research, however, has been done investigating the correlation between financial education and FRT. In this paper, it is proposed that financial education and FRT may be positively correlated. Since risk preferences are an innate characteristic and can also be motivated by personal and psychological attributes, the relationship between financial education and FRT may not be causal. Results obtained from analyzing data from the 2021 NFCS dataset through multivariate analysis show that financial education courses are positively correlated with reporting higher measures of financial risk tolerance for college educated individuals and for financially low literate individuals who have not attended college. These results hold even after controlling for financial literacy and a myriad of other background variables.
An individual’s financial risk tolerance has an important role in their financial decisions. Hence, it is a recent topic of interest. Research shows a strong relationship between financial literacy and risk aversion. Little research, however, has been done investigating the correlation between financial education and FRT. In this paper, it is proposed that financial education and FRT may be positively correlated. Since risk preferences are an innate characteristic and can also be motivated by personal and psychological attributes, the relationship between financial education and FRT may not be causal. Results obtained from analyzing data from the 2021 NFCS dataset through multivariate analysis show that financial education courses are positively correlated with reporting higher measures of financial risk tolerance for college educated individuals and for financially low literate individuals who have not attended college. These results hold even after controlling for financial literacy and a myriad of other background variables.
Literature Review
There are two bodies of literature dealing with risk—studies examining financial risk tolerance and studies dealing with risk aversion. FRT captures the amount of uncertainty or risk that an individual is willing to accept when making a financial decision. A risk averse individual has a concave utility function and prefers to have an expected value of wealth rather than face a gamble. The two approaches to analyzing a decision-making under uncertainty are strongly aligned. Risk aversion and FRT, in theory, have an inverse relationship (Grable, 2016). A strong statistical correlation between measures of FRT and risk aversion was empirically reported by Faff et al. (2008). FRT and risk aversion have both been used to determine risk preferences.
In empirical research, risk preferences have been measured by looking at actual investment behavior (e.g.,Schooley & Worden, 1996), looking at choices in an experimental setting (e.g., Holt & Laury, 2002), and through survey questionnaires (e.g., Faff et al., 2008). Subjective survey questionnaires are widely accepted measures of determining FRT. Various organizations and studies have developed their own instruments for measuring FRT. One of the more widely regarded FRT instruments is produced by an Australian company named FinaMetric Ltd. The FinaMetrica Personal Financial Profiling system is a commercial FRT metric that contains a 25-question standardized test. 1 For this psychometrically validated test, scores are reported on a 1 to 100 scale, with higher measures indicating higher levels of FRT. Numerous studies have utilized the FinaMetrica instrument to measure FRT. 1
While Barsky et al. (1997) advise using a series of hypothetical choices between uncertain streams of income, Kapteyn and Teppa (2011) show that using a scale of subjective measures of risk aversion is better than other instruments to measure FRT. van Rooij et al. (2012) use 1–7 scaled responses to the question:“ Investing in stocks is something I don’t do, since it is too risky” to create a risk aversion measure. Similarly, van Rooij et. al (2011b) use 1–7 scaled agreements to the question: “I think it is more important to have safe investments and guaranteed returns than to take risk to have a chance to get the highest possible returns” to obtain risk preferences. Lusardi (2000) uses subjective data on the probability of job loss in the future as a measure of risk aversion.
Various studies have investigated decision making in the context of the “two systems” theory (Benjamin et al., 2013; Dohmen et al., 2010; Frederick, 2005; Fudenberg & Levine, 2006; Bernheim & Rangel, 2004). According to this dual systems theory—which was developed after considering research in neuroscience, biology, and economics—for every individual, decision-making results from an interaction between a deliberative system and an affective system. The deliberative system utilizes ability and cognitive tools to ensure long term considerations. The affective system, however, is impulsive and fearful of risks. In the context of risk preferences, researchers assert that fear and reluctance towards risk taking behaviors can be overcome by a stronger deliberative system. To test this hypothesis, studies have tried to discern whether higher cognitive ability is related to less risk aversion (Benjamin et al., 2013; Dohmen et al., 2010; Frederick, 2005; Fudenberg & Levine, 2006; Bernheim & Rangel, 2004).
Such studies find a positive effect of cognitive ability on FRT. Benjamin et al. (2013) investigate the effect of cognitive ability on preference anomalies, including small scale risk aversion. The study is conducted in a laboratory setting with Chilean high school students. Results show that a one standard deviation increase in measured mathematical ability is associated with an increase in about 8 percentage points in the likelihood of behaving in a less risk averse fashion over small stakes. This result holds even after including parental education and demographic controls. When math ability is accounted for in the model, verbal ability is shown to significantly decrease risk aversion by less than 2 percentage points. In the second part of this study Benjamin et al. (2013) perform cognitive load manipulation exercises while measuring risk preferences. Cognitive load manipulation is intended to reduce the working memory of participants of the study. Citing research in psychology, the authors of this study contend that working memory is perfectly correlated with general cognitive ability. Thus, by decreasing the working memory, and thereby the cognitive ability of participants, researchers were able to view the effect of this treatment on risk preferences. Results show that a decrease in cognitive ability leads to a statistically significant decrease in the risk preferences of participants.
Although Benjamin et al. (2013) report fairly robust findings across different data analyzes, the study is not without some major drawbacks. First, the instrument used to capture risk aversion of the Chilean high school students cannot measure risk seeking behavior. The risk aversion questionnaire is formatted with options for only risk averse or risk neutral responses. Second, the sample of Chilean high school students is not representative in its sample design. The results of this study are hence, not generalizable.
A study that investigates the effects of cognitive ability on a representative sample of adults living in Germany shows that an increase in cognitive ability decreases risk aversion (Dohmen et al., 2010). This study measures cognitive ability using two tests—the Wechsler Adult Intelligence Scale (WAIS) and a symbol digit correspondence test. Dohmen et al. (2010) show that an increase in cognitive ability decreases risk aversion. The experimental set up of this study also allows for viewing risk seeking behavior. Increases in cognitive ability significantly increased risk preference measures, even after controlling for various background variables.
Furthermore, Donkers et al. (2001) find that more educated respondents are more risk tolerant in hypothetical gambles. Another study uses a number of risk preference measures utilizing hypothetical gambles to find a positive association between cognitive ability tests and FRT (Frederick, 2005). Though this study examines cross sections of the sample by gender, no other controls are considered.
In the economics and finance literature, examples of risk tolerant (or less risk averse) behaviors include participating in financial markets. Benjamin et al. (2006) use the NLSY 1979 to show that cognitive ability could predict the likelihood of participating in financial markets. In this study, cognitive ability is measured using the Armed Forces Qualifying Test (AFQT). Financial market participation is defined as ownership of stocks, bonds, mutual funds, etc., outside of retirement accounts. Results show that an increase of 10 percentile points in AFQT score is associated with an increase of two percentage points in the likelihood of participating in the financial market, as defined in this study. Further, Christelis et al. (2010) find that three different measures of cognitive ability (numeracy, verbal fluency, and memory) all affect the likelihood of stock ownership, even after controlling for educational attainment. This study was conducted with data collected from 11 different European countries (SHARE data) and included multiple controls in their models. The results from this study also show that cognitive impairments reduced the likelihood to have stocks, all other things equal.
Financial literacy is a specific type of cognitive ability, dealing particularly with understanding of financial topics. The importance of financial literacy in determining positive economic and financial behaviors is well noted in the literature (Kaiser et al., 2022). Financial literacy has also been found by numerous studies to increase the likelihood of more risk tolerant behavior, such as stock market participation (van Rooij et al., 2012). Financial education is defined as any initiative intended to raise financial literacy. Financial education can be imparted through schools, colleges, workplaces, and through community platforms (Lusardi, 2019). Participating in financial education programs can have a positive correlation with accepting more financial risks, through different channels.
First, financial education can increase financial literacy, thereby affecting risk preferences. Financial education programs have shown to increase financial literacy of participants (Lusardi, 2019). As mentioned in previous sections of this paper, there are numerous studies examining the impact of financial literacy and cognitive ability on risk preferences. Kimball and Shumway (2006) utilize a 15-question financial sophistication index to show that investor sophistication is significantly related to participation in the stock market. Financial sophistication is constructed by gathering information on participant knowledge and attitudes regarding bank accounts, mutual funds, efficiency of financial markets, and portfolio diversification. This study also shows that financial education (received in class, online, or through books) may help investors become more financially sophisticated. Hence, financial education may affect risk preferences through financial literacy and financial sophistication of participants.
Financial education programs can affect risk preferences by decreasing information costs. Individuals who are faced with financial risks must evaluate costs, returns, and risks of their decisions. Information costs can pose significant barriers to entertain financial risks, especially for those who have lower cognitive ability or financial literacy. A large study evaluating financial education in India shows that in this case, the financial education program was able to improve awareness of financial products and services concerning bank accounts, loans, and household budgets (Carpena et al., 2011). If financial education can enhance awareness and familiarity with financial products, it can reduce information costs and may also make households more comfortable with accepting financial risks, especially for those with lower cognitive ability.
The third channel through which financial education can enhance a person’s willingness to take financial risks is by increasing confidence in handling personal financial matters. In the context of retirement planning, various studies have shown a positive association between participating in financial education programs and increases in confidence. Kim et al. (2005) use the 2004 Retirement Confidence Survey to show that those workers who had attended workplace financial education programs had higher levels of retirement confidence than others. Joo and Pauwels (2002) also find that employer-provided financial education had a positive effect on retirement confidence. Financial education programs can thus increase psychological measures such as confidence. Confidence has been positively associated with more risk tolerant financial behaviors, such as stock market trading (Barber & Odean, 2001).
There have only been very few studies that examine the relationship between financial education and FRT. Ryack (2011) finds that college students who have had some financial education in high school are more risk tolerant when compared to college students who have not taken a high school course in personal finance (this paper assumed a causal relationship between FRT and financial education). This study also examined the effects of parent-child and spousal relationships on the FRT of the student. Data for this study was collected from a sample of college freshman during summer orientation at a public university and contained information on 378 students. Results from this study are hence not generalizable. More importantly, since the study does not control for financial literacy, the model could just be picking up the financial literacy of respondents. Further, this study also only examines the effect of high school financial education on FRT.
Data, Sample, and Descriptive Statistics
In 2009, the first National Financial Capability Study (NFCS) of adults in the United States was administered to assess the financial attitudes, financial behaviors, and financial literacy of adults following the 2007 and 2008 financial crisis. It was commissioned by the Financial Industry Regulatory Agency (FINRA) Investor Education Foundation, a non-profit organization. It was prepared in consultation with the U.S. Department of the Treasury and the President Bush’s Advisory Council on Financial Literacy. The surveying and data collection was done using scientific sampling procedure by Applied Research and Consulting (ARC), an independent survey research firm.
The NFCS was conducted again in 2012, 2015, 2018, and 2021. The 2021 NFCS was also funded by the Financial Investor Regulatory Agency (FINRA) Investor Education Foundation and is used for this analysis. All NFCS survey instruments are similar, except for minor changes made after consultations with policy makers, academics, and researchers.
The primary data set used for this paper came from the 2021 state by state survey. The NFCS survey contains questions that provide information on financial capabilities, financial literacy measures, financial behaviors, financial attitudes, and standard demographic characteristics. The survey begins by collecting demographic and other background information from participants. The following sections in the survey gather information pertaining to financial attitudes and behaviors, financial advisors, money management, retirement accounts, sources of income, home and mortgages, credit cards, other debt, insurance, and self-assessment and literacy, respectively.
The 2021 survey was self-administered online through a Web site. Panels of data were developed by Dynata and EMI Online Research Solutions. The respondents for the sample were drawn using non probability quota sample from the online panels. Fielding for this particular dataset was conducted between June and October, 2021. As with previous NFCS surveys, the 2021 survey did not target the head of the household. 2
One of the general advantages in using the 2021 NFCS dataset is the large sample size. The dataset collects information on individuals older than 18 years of age, yielding approximately 500 observations per state, in addition to observations from the District of Columbia. Further benefits of using the 2021 NFCS dataset are the national, regional, and state level weights provided. Results for the studies can thus be weighted to provide reliable representation at the national, regional, or state level. The representative weights for each Census distribution utilize data from the American Community Survey. This paper used the national weights for NFCS to weight the data.
The questionnaire also contains five financial literacy questions, which are collectively referred to as the “Big Five” questions in financial literacy by previous research (Hastings et al., 2013). The financial literacy questions used in the survey can be found in appendix section A.1. These financial literacy questions were used to create a five-score financial literacy measure indicating respondents’ level of financial knowledge. Respondents are “scored” based on the number of financial literacy questions that they answer correctly (scores hence, range from 0–5).
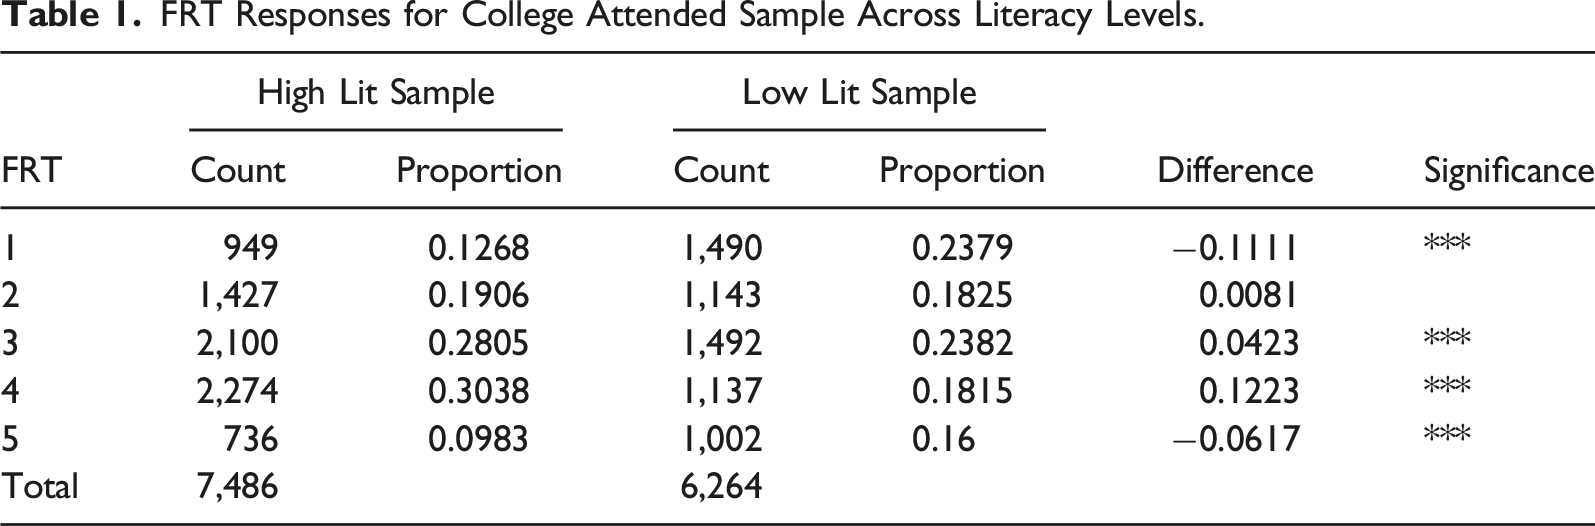
The NFCS dataset collects information on financial education received by participants. Respondents can indicate whether they obtained financial education in high school, college, the workplace, or through an employer. Those who refused to answer the question about receiving financial education or who have missing values for this item were dropped from the analysis. The financial education variable was recoded into a binary variable indicating whether the responded had received any type of financial education. Further, the NFCS dataset records a subjective measure of FRT that records the respondent’s willingness to take risks when thinking of financial investments. The original responses are recorded using a 1–10 likert scale. Since some response categories had fewer observations, the risk tolerance variable is recoded to a 1–5 scale. “1” and “2” responses of the original question are recoded to “1”; “3” and “4” responses of the original question are recoded as “2”, etc. With the new designations, 23.8% of the sample reported an FRT measure of “1”, 18.3% of the sample reported an FRT measure of “2”, 23.8% of the sample reported an FRT measure of “3”, 18.15% of the sample reported an FRT measure of “4”, and 16% reported an FRT measure of “5”.
Two categorical variables in the analysis, income and age, have been transformed to continuous variables. The categorical variables for age (18–24, 25–34, 35–44, 45–54, 55–64, and 65+) were transformed by setting age at the mid-point age of each range. For respondents in the last age category, the age was set to 70. The categories for income were similarly transformed by setting each income level to the midpoint of each category. For the lowest and highest income categories, income was set to $15,000 and $150,000, respectively (this procedure mimics variable conversions by Walstad and Allgood, 2012).
The sample is initially divided by highest education level completed—those who’ve had at least some college education are placed in the “College attended” sample and those who have not gone to college are placed in the “High School or less sample.” Division of the sample in this way was done to ensure that individuals in both samples had “equal opportunities” to obtain financial education. It would be unreasonable, for example, to place a person who did not attend college in the same sample as a person who did go to college as college attendees could have had the opportunity to take a financial education course in college.
Next, the samples divided by education level are further cross-sectioned by financial literacy level. Those who scored a 0, 1, or 2 on the five-question financial literacy test were placed in the low financial literacy group and those who earned a 4 or 5 on the quiz were placed in a high financial literacy group. Finally, both education levels are examined at the median financial literacy level (i.e., those who answered 3 questions correctly are only included in these samples). Thus, six different subsamples were obtained from the original dataset to answer the research question: (1) College attended sample with low financial literacy; (2) High School or less educated sample with low financial literacy; (3) College attended sample with high financial literacy; (4) High School or less educated sample with high financial literacy; (5) College attended sample with median level financial literacy; and (6) High school or less educated sample with median level financial literacy.
FRT Responses for College Attended Sample Across Literacy Levels.
FRT Responses for HS or Less Educated Sample Across Literacy Levels.
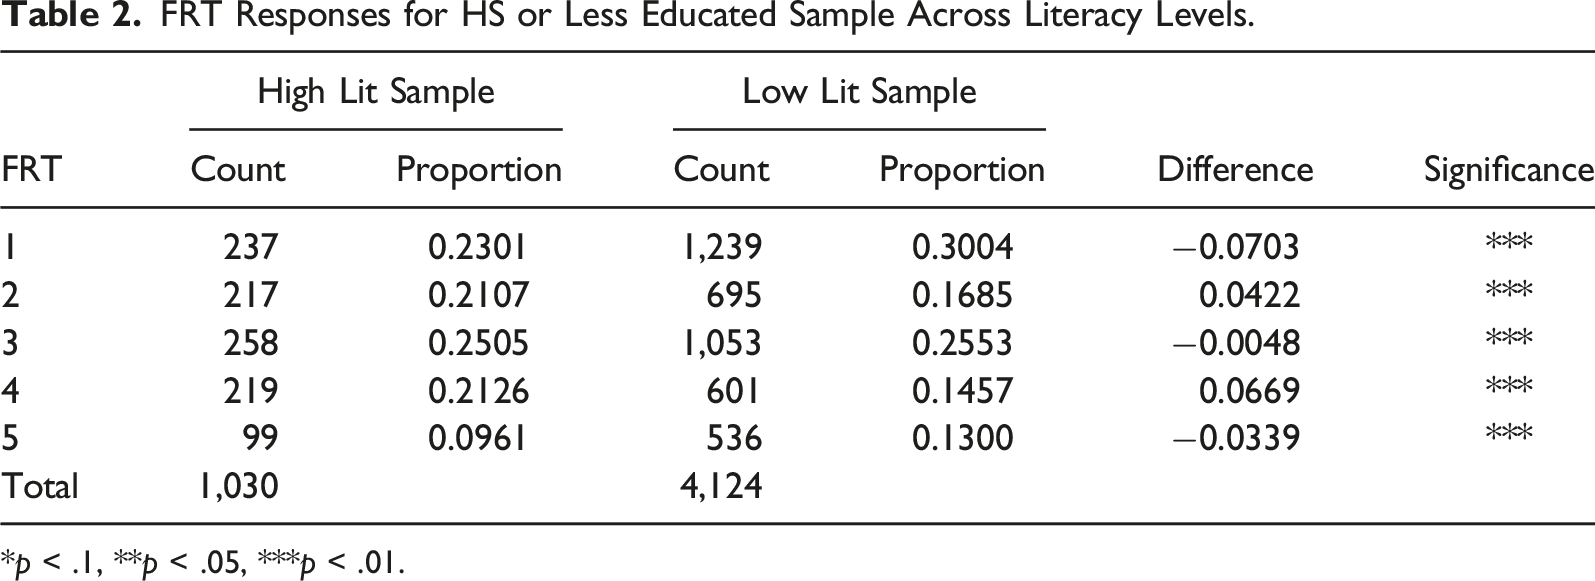
*p < .1, **p < .05, ***p < .01.
Ordered Probit Model and Results
The FRT questions can take upon subjective values ranging from 1 to 5. An ordered probit model can be used when the dependent variable is ordinal and takes upon discrete, qualitative values. Like ordinary least square analysis, an ordered probit model can identify significant relationships between explanatory variables and the dependent variable. Unlike ordinary least squares, ordered probit models identify unequal differences between ordinal categories in the dependent variable (Greene, 2007). For example, the model does not assume that the difference between responding with a “1” or “2” to the FRT question is the same as difference between responding with a “4” or “5”, given a unit change in explanatory variables. Hence, the ordered probit model captures qualitative differences between the different FRT measures.
Ordered probit models assume that there is a latent function with an unobservable dependent variable that is driving the observable dependent variables. For this paper, the unobservable dependent variable affects each respondent’s financial risk tolerance measure.
Latent Variable Model

Financial Education on Financial Risk Tolerance, by Level of Education and by Level of Financial Literacy
Ordered Probit Model Weighted Marginal Effects for Low Financial Literacy Sample of College Attendees; FRT is Dependent Variable.
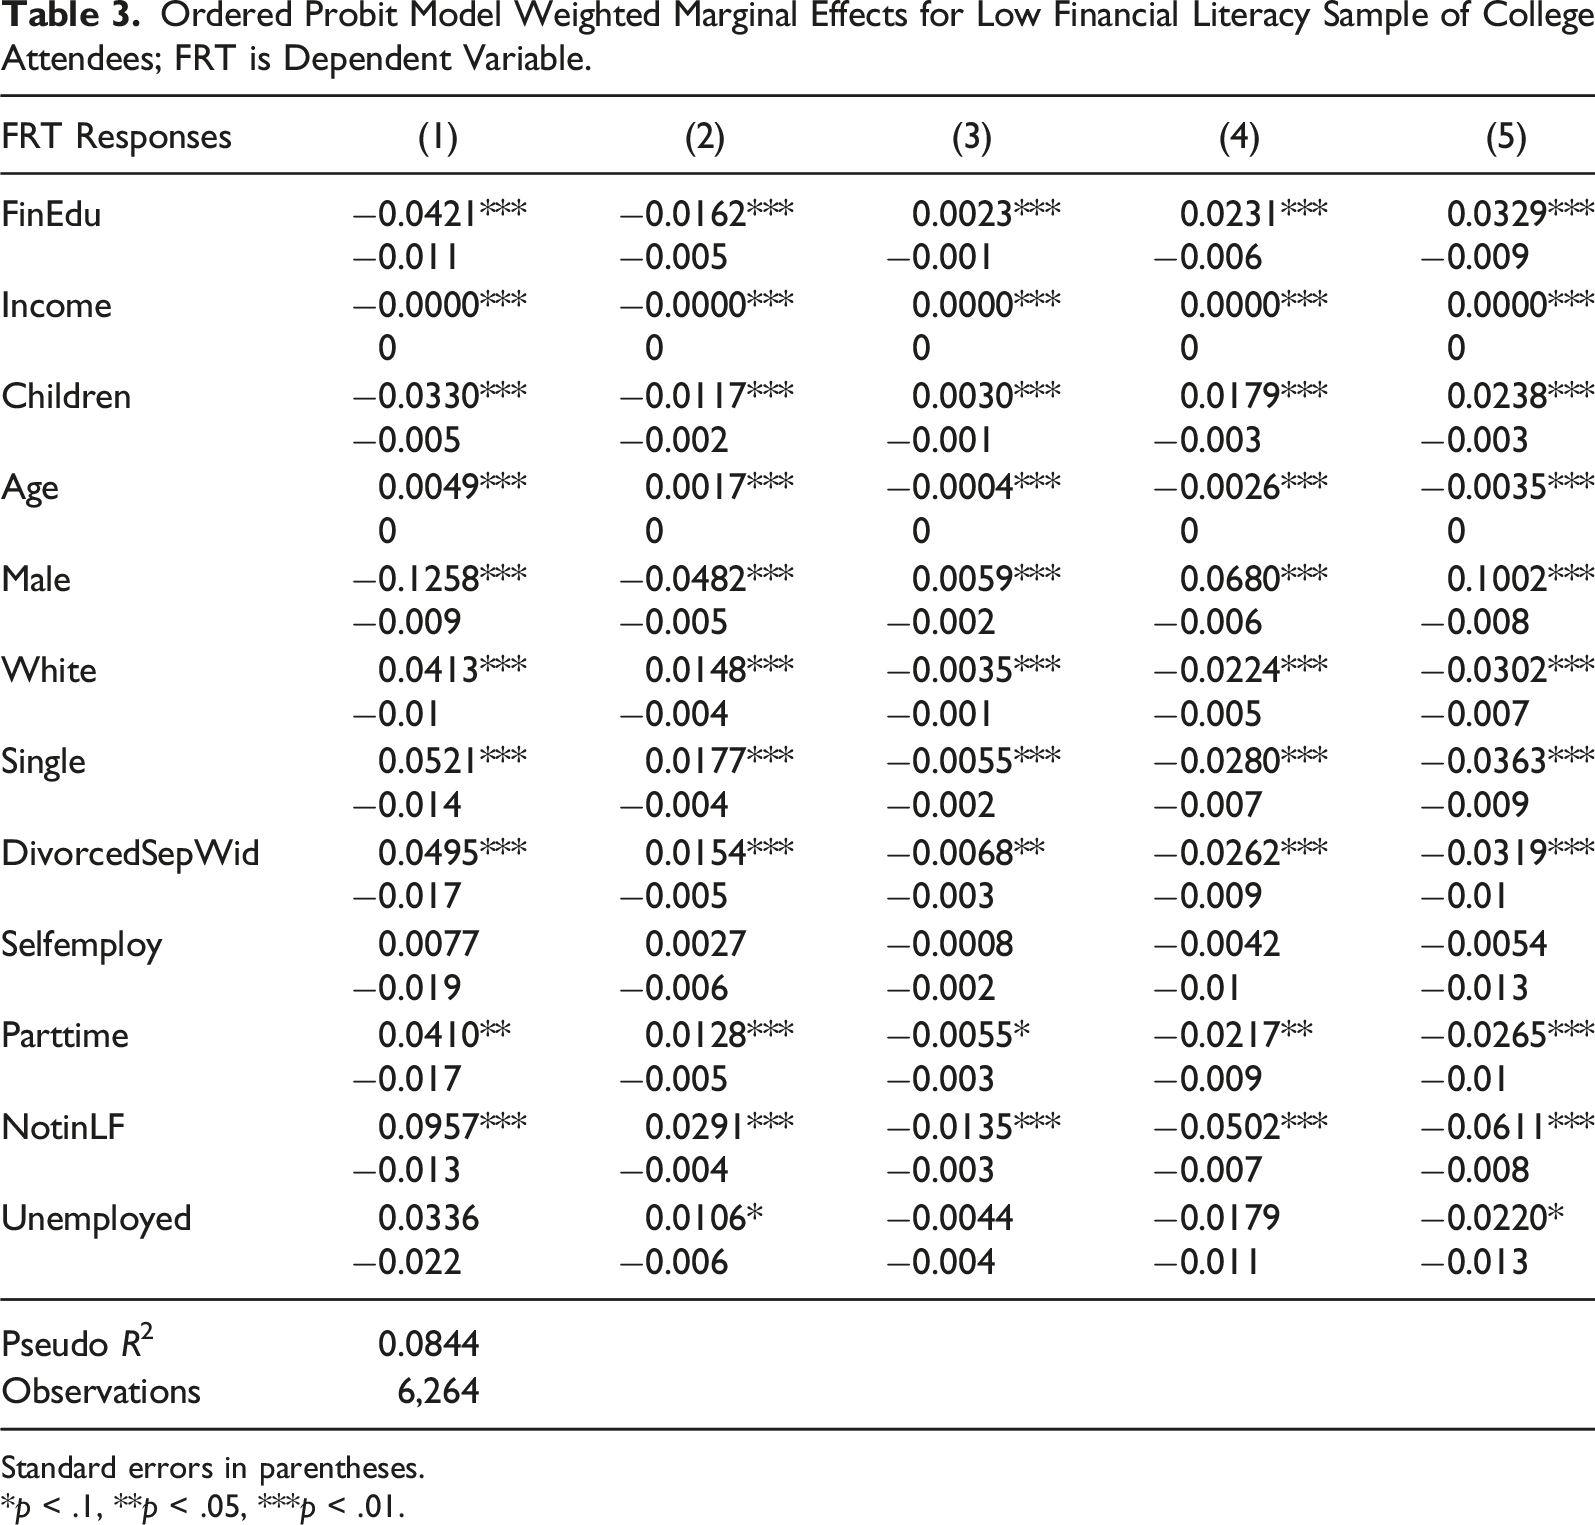
Standard errors in parentheses.
*p < .1, **p < .05, ***p < .01.
Ordered Probit Model Weighted Marginal Effects for Low Financial Literacy Sample of High School or Less Educated Sample; FRT is Dependent Variable.
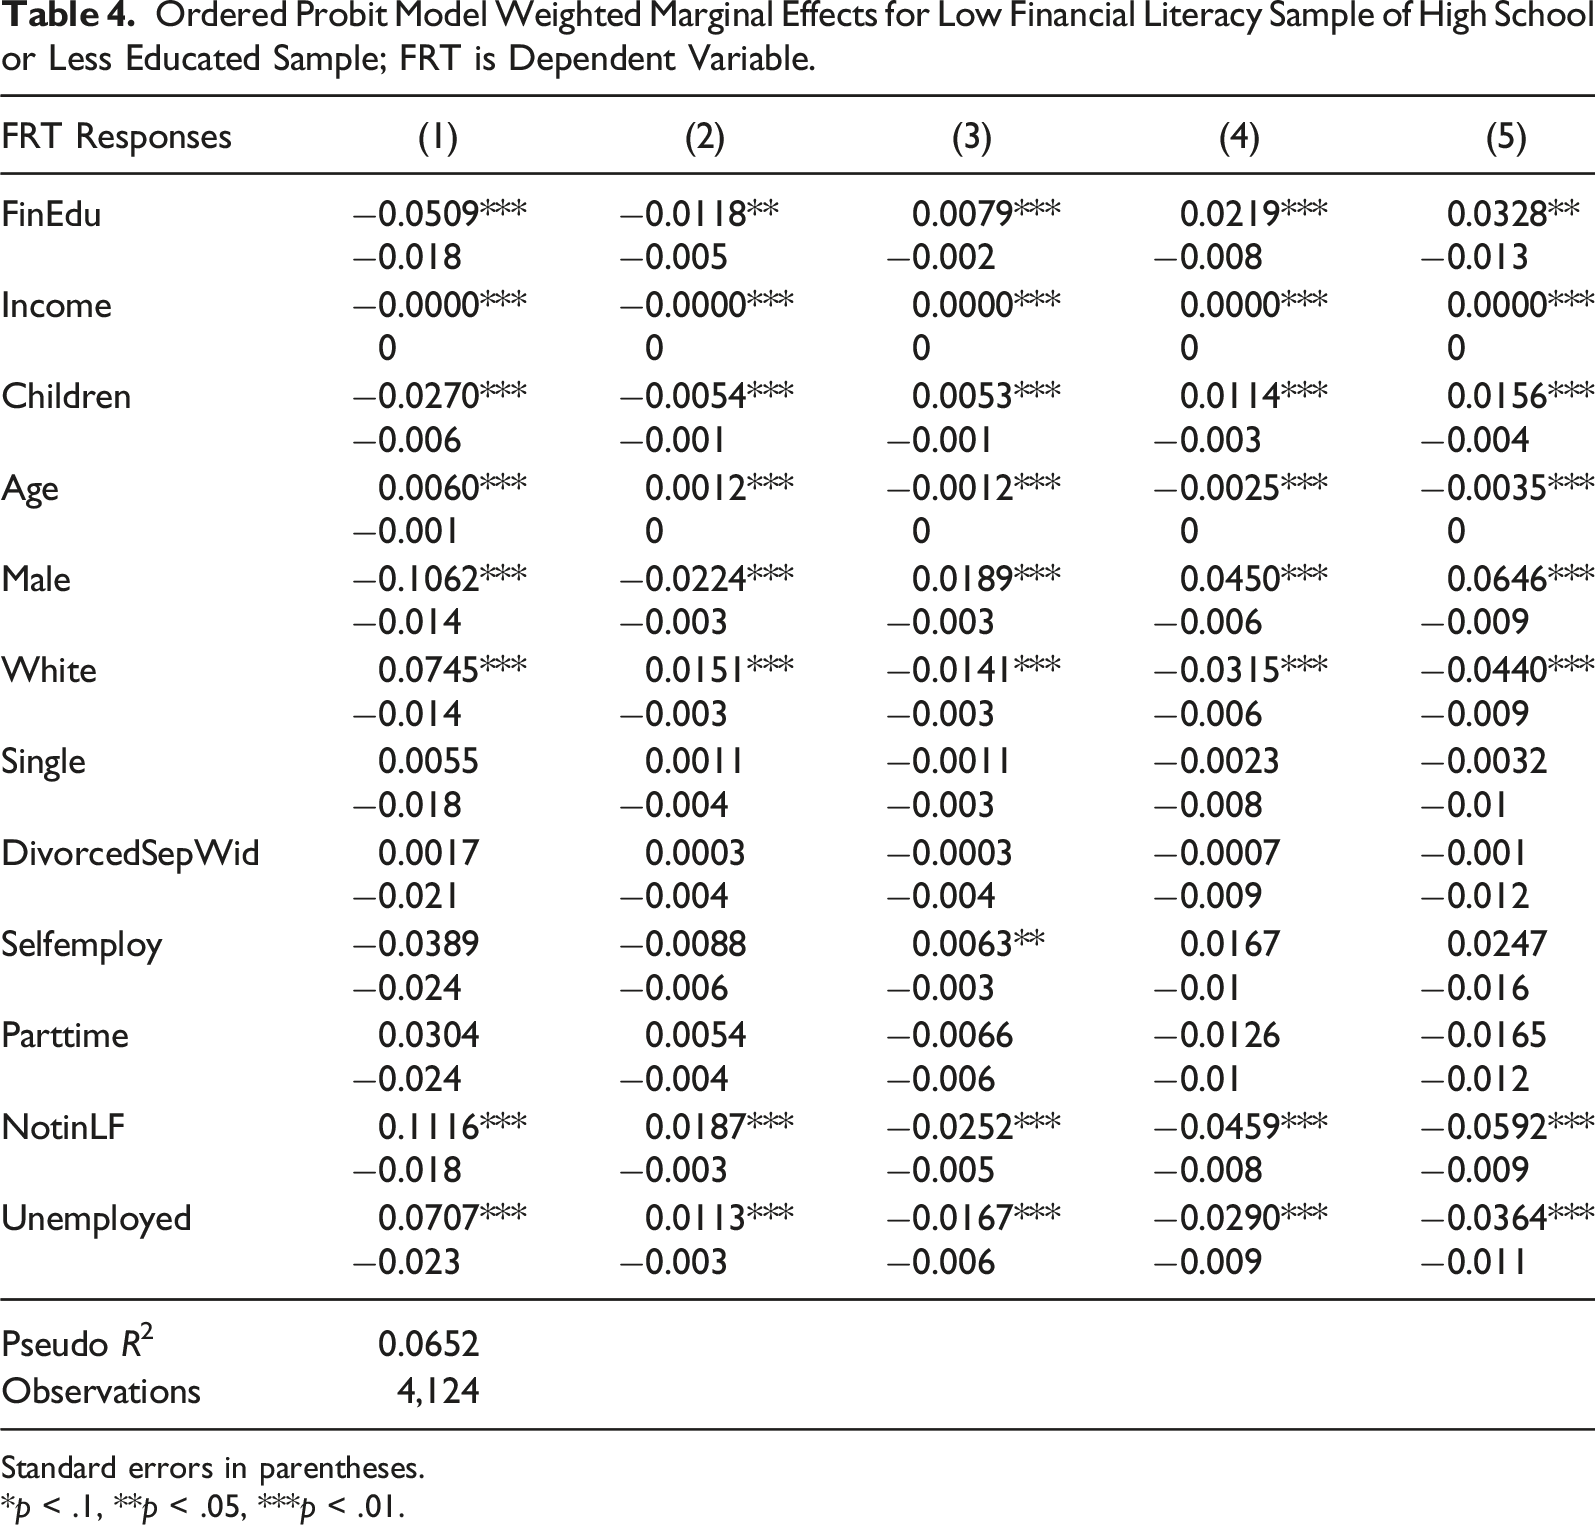
Standard errors in parentheses.
*p < .1, **p < .05, ***p < .01.
Ordered Probit Model Weighted Marginal Effects for High Financial Literacy Sample of College Attendees; FRT is Dependent Variable.
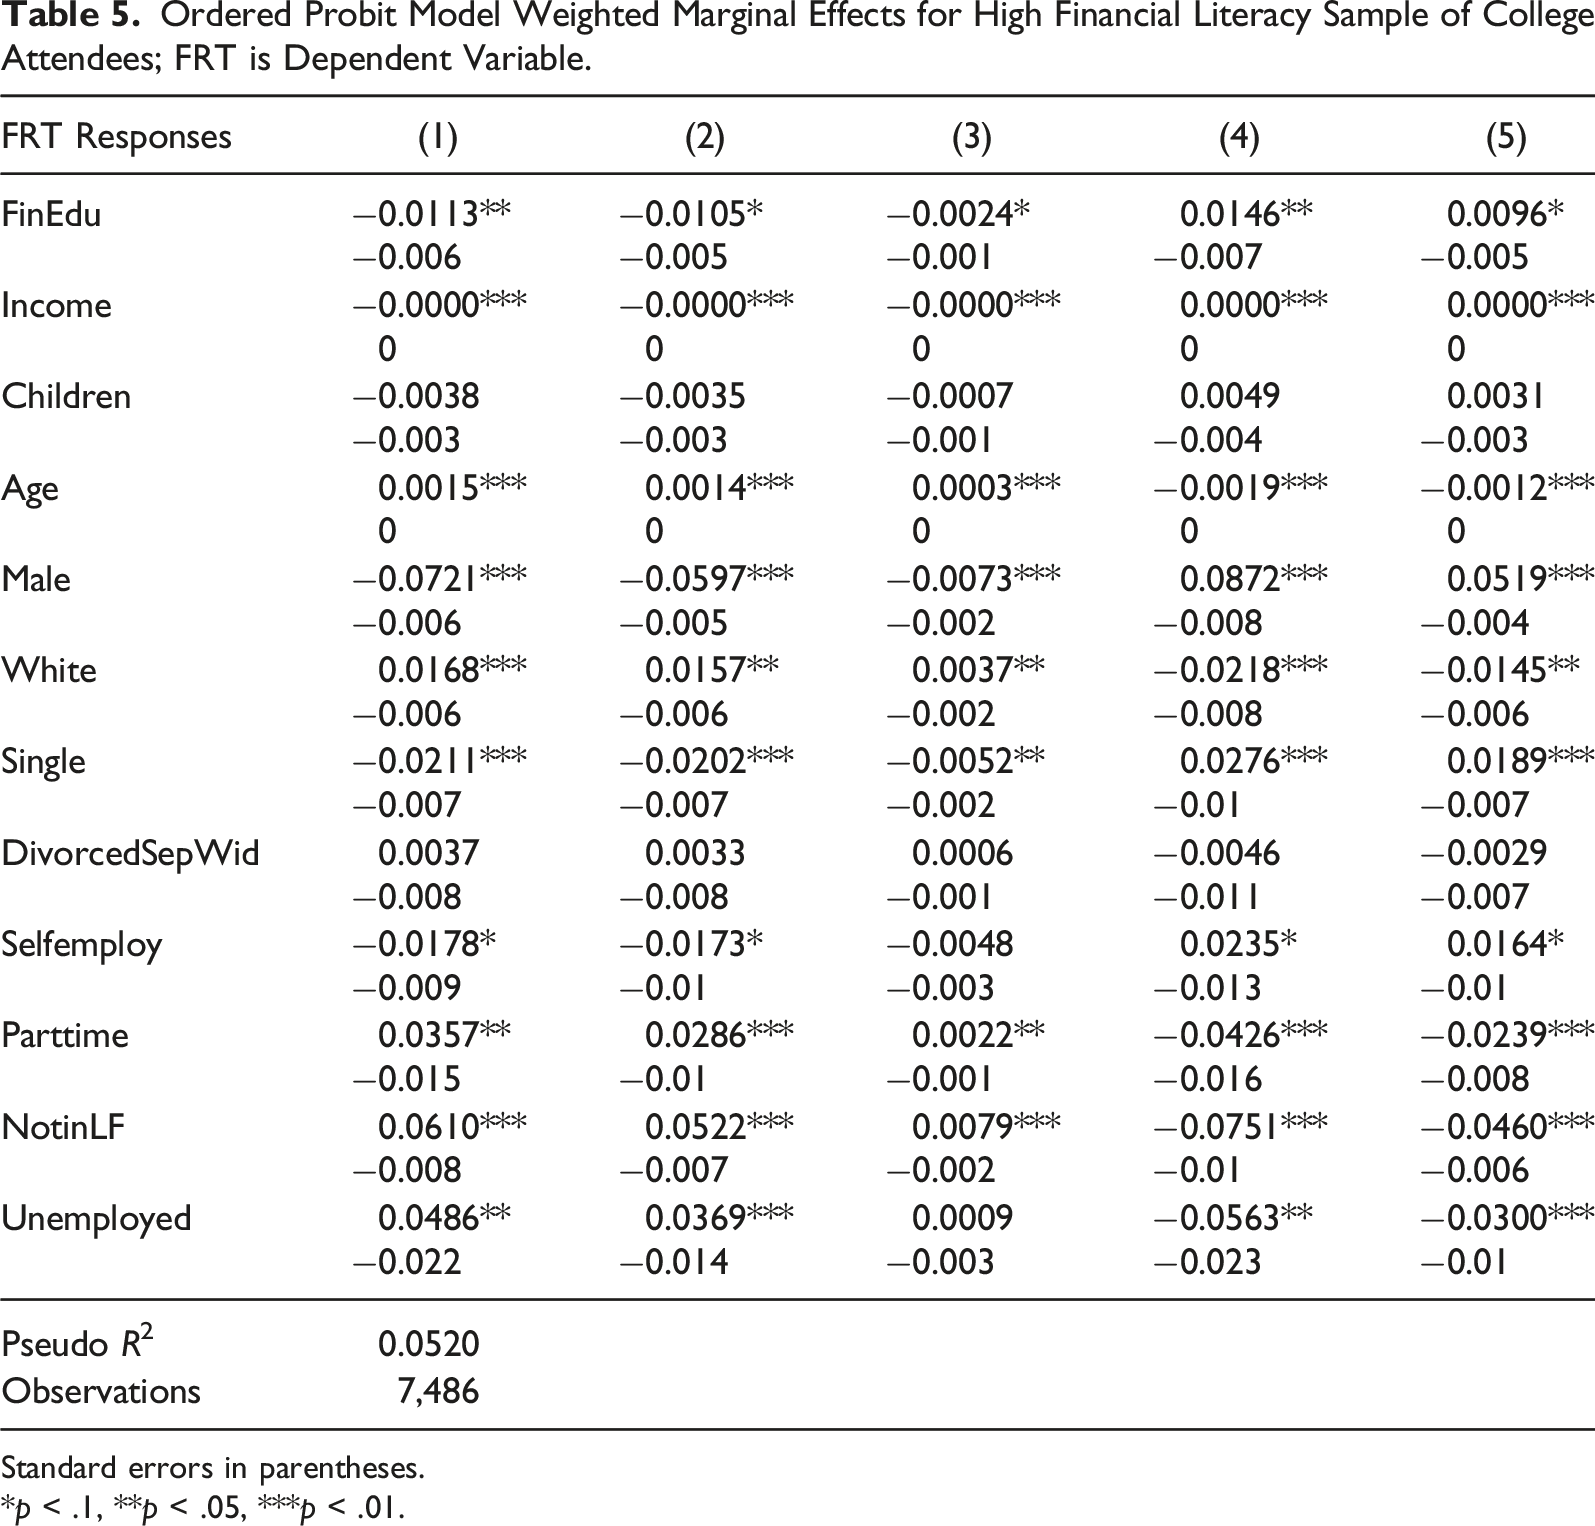
Standard errors in parentheses.
*p < .1, **p < .05, ***p < .01.
Ordered Probit Model Weighted Marginal Effects for High Financial Literacy Sample of High School or Less Educated Sample; FRT is Dependent Variable.
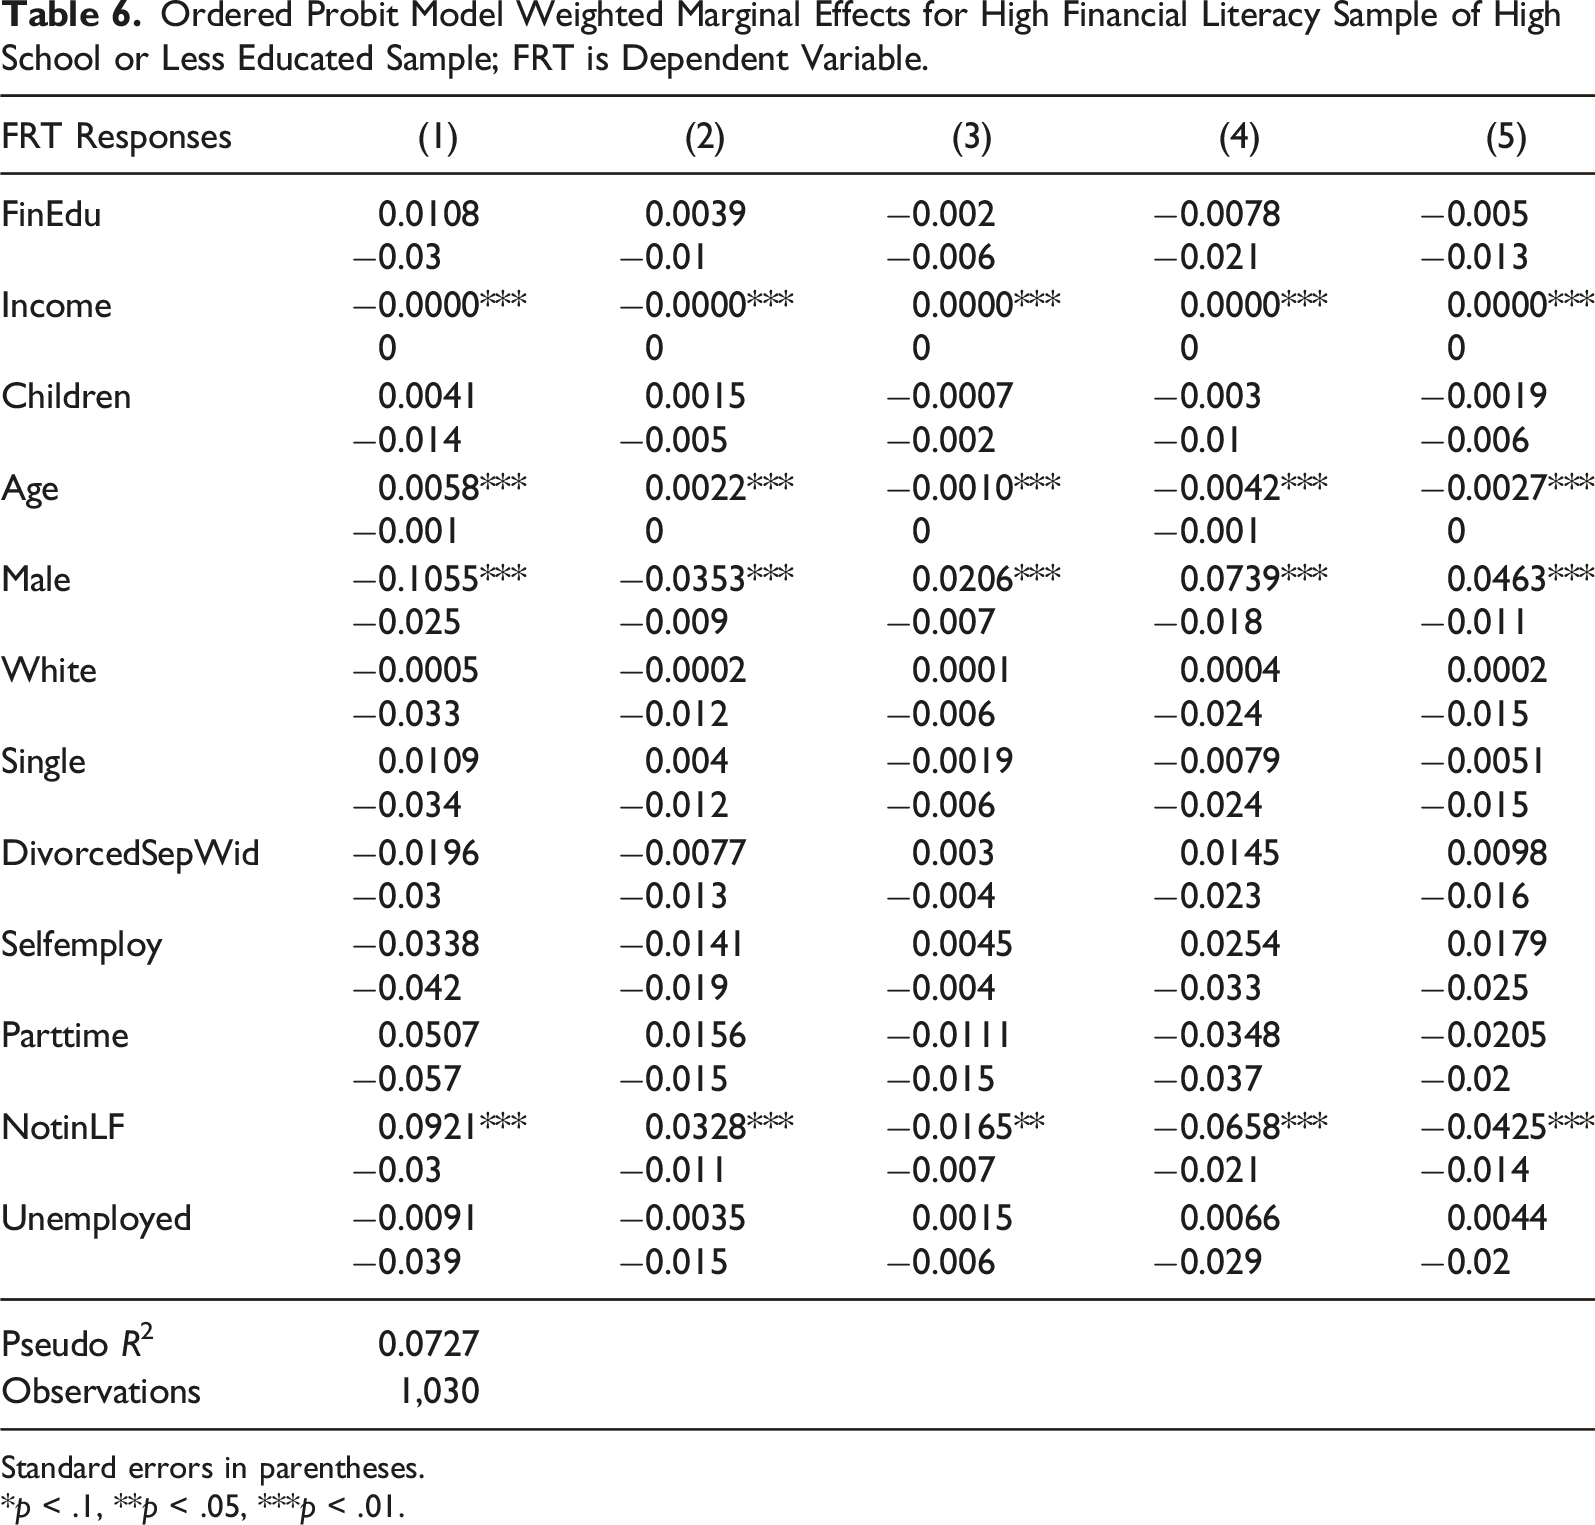
Standard errors in parentheses.
*p < .1, **p < .05, ***p < .01.
Ordered Probit Model Weighted Marginal Effects for Median Financial Literacy Sample of College Attended Sample; FRT is Dependent Variable.
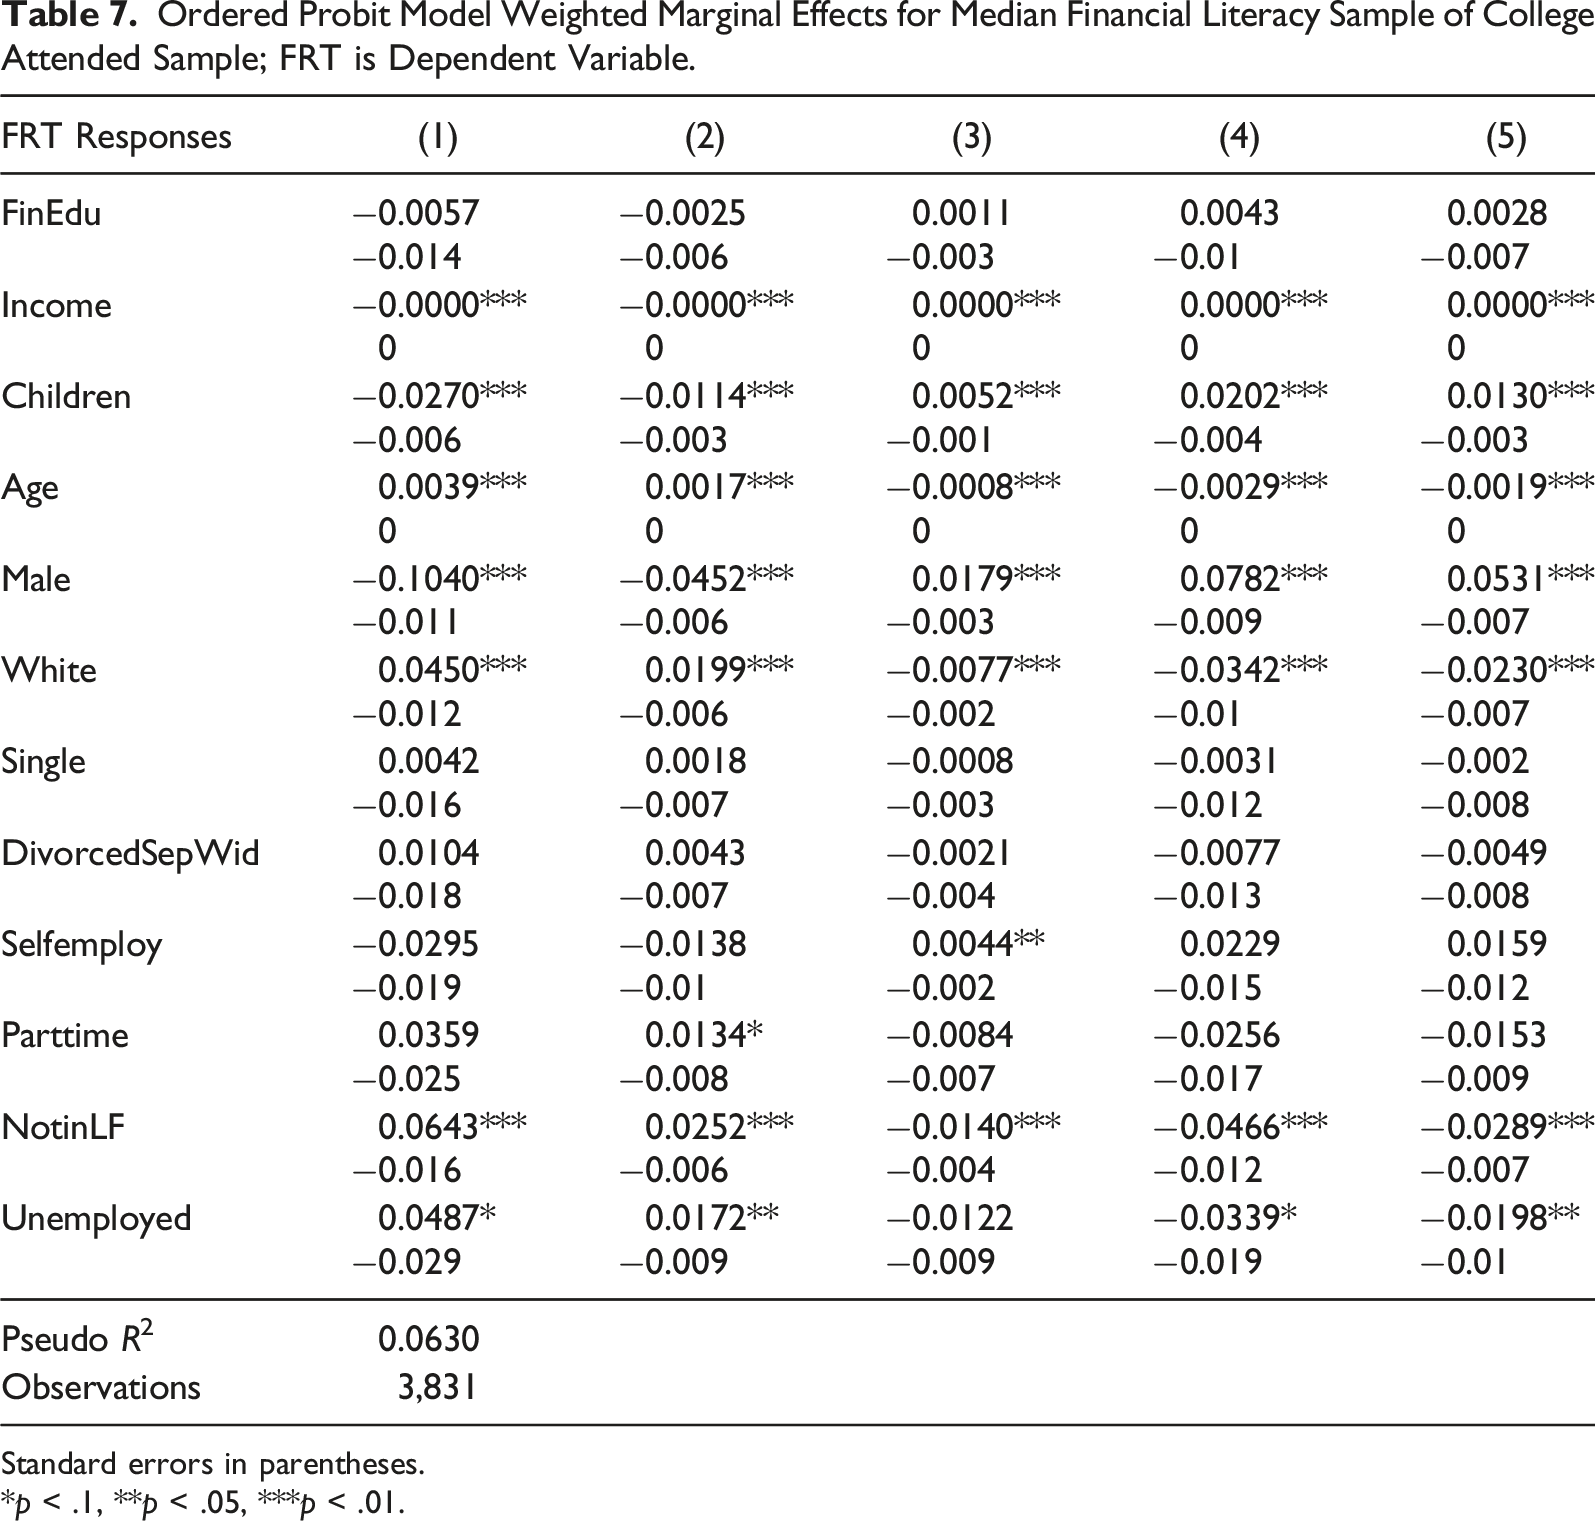
Standard errors in parentheses.
*p < .1, **p < .05, ***p < .01.
Ordered Probit Model Weighted Marginal Effects for Median Financial Literacy Sample of High School or Less Educated Sample; FRT is Dependent Variable.
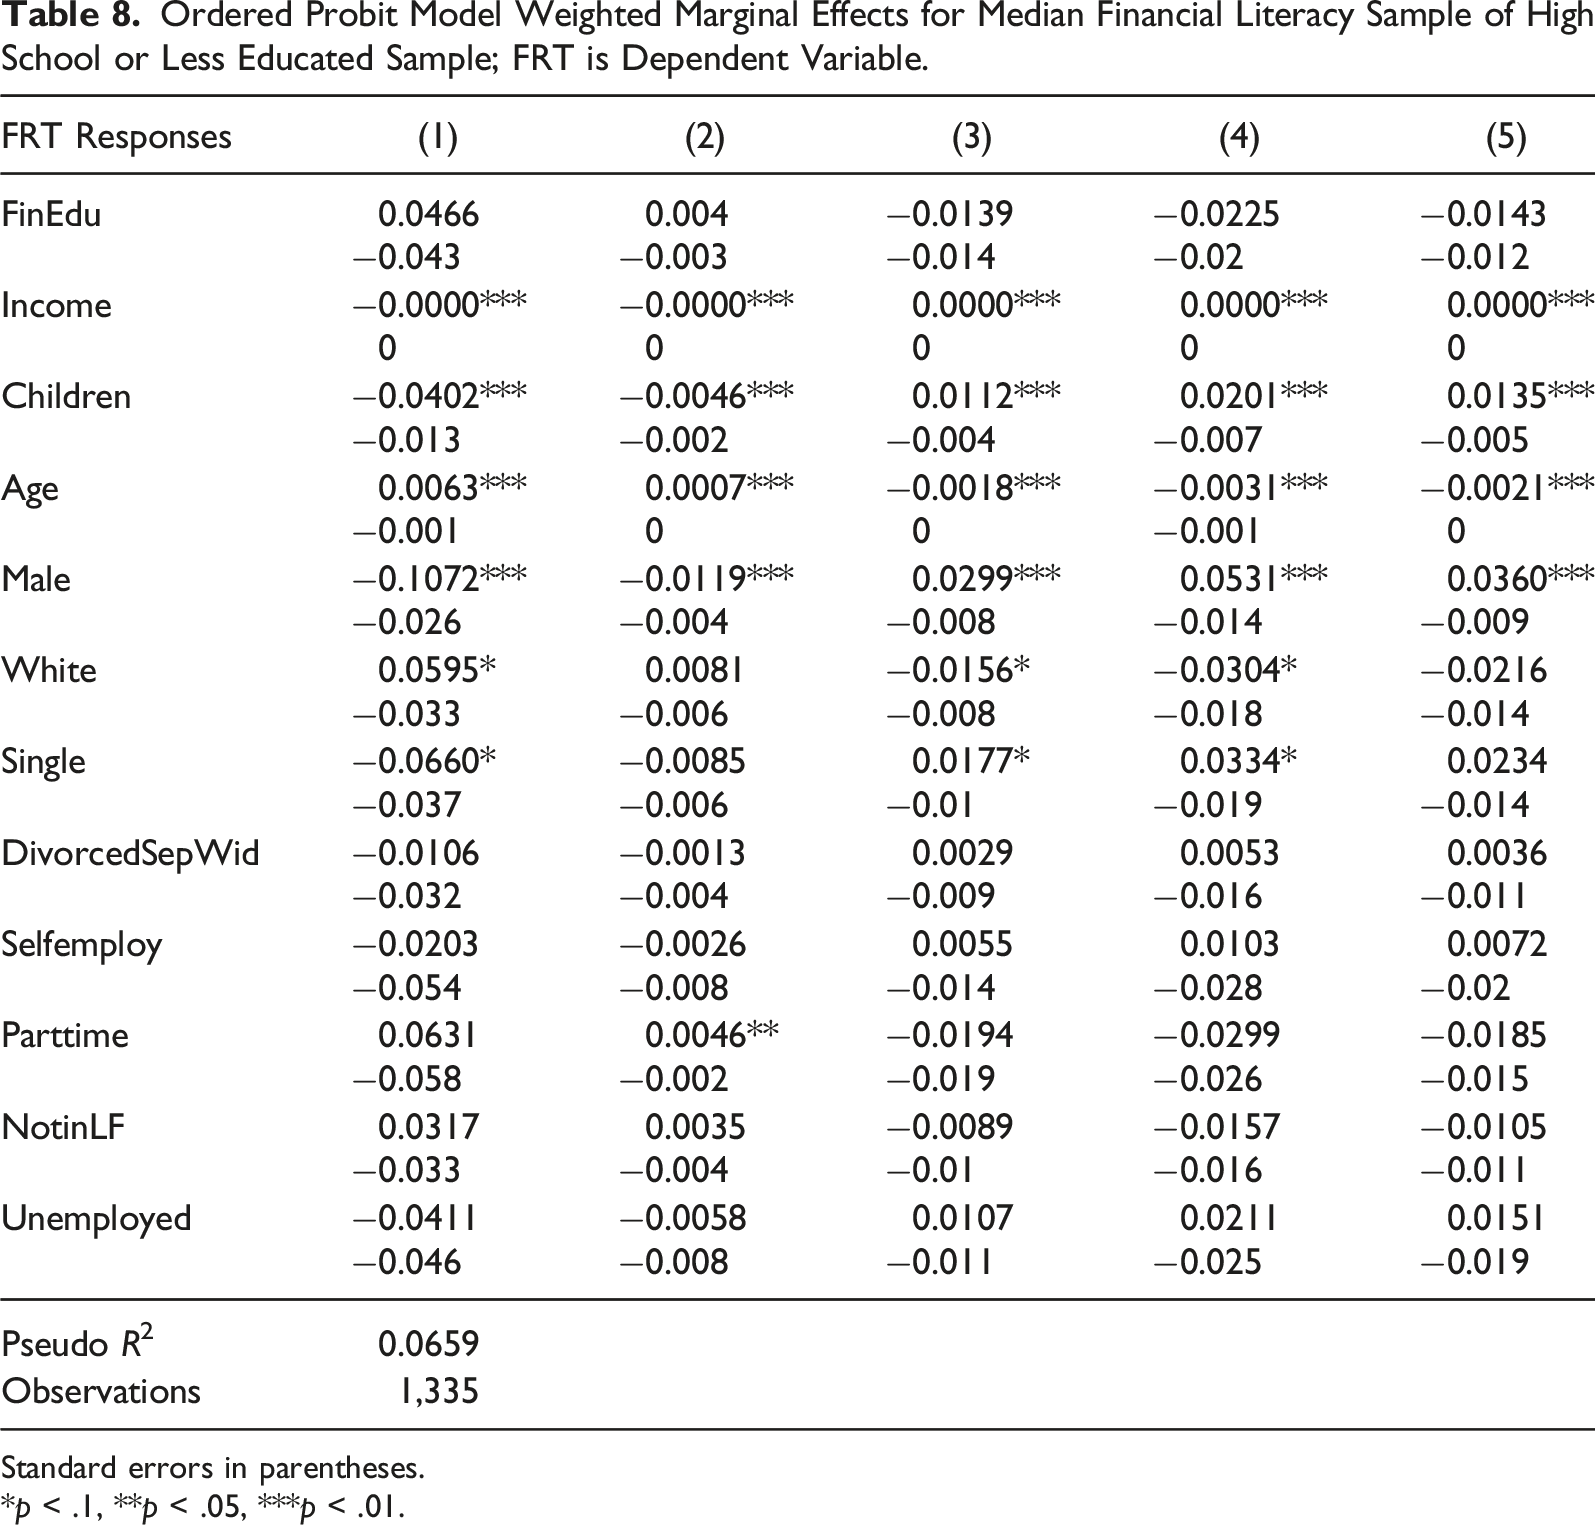
Standard errors in parentheses.
*p < .1, **p < .05, ***p < .01.
As seen through Tables 3 and 4, for the low financial literacy samples of both education levels, marginal effects of the financial education variable are negative and significant for lower FRT responses, and positive and significant for higher measures of FRT. This result indicates that those who have participated in financial education courses are less likely to report FRT measures of 1 and 2, but more likely to report FRT scores of 3–5, compared to those who have not participated in any financial education courses. Additionally, in these same tables, as the number of children and the income of the household increases, the likelihood of reporting higher levels of FRT also increases significantly. The marginal coefficients of the income variable are significant but are very small in all of the samples. Income is included in the model to ensure that ability to engage in more/less risky financial behaviors through household finances, is controlled in the model. Since risk preferences are personal characteristics, it makes sense that though access to income is significant, it has a very minimal effect on reporting any FRT response. Further, in Tables 3 and 4, men are significantly more likely than woman to report higher values of FRT measures. In contrast, marginal effects are positive and significant for lower values of risk tolerance and negative and significant for higher values of FRT for the age and for those participants who identify as White, relative those who identify as nonwhite. This indicates an inverse relationship between these variables and FRT.
Additionally, in Table 3, individuals who work part time, individuals who are not in the labor force, and individuals who were not married, were less likely to be report higher values of FRT and more likely to report lower values of FRT, when compared to the omitted groups of those who work full time and those who are married, respectively. These results could be explained perhaps by these groups having less access to financial resources relative to the omitted groups. In Table 4, though the same results are true for the individuals who are not in the labor force and those unemployed, other employment variables are not significant.
When observing Tables 5 and 6, high financial literacy samples separated by level of education, obtaining financial education is significant only in the subsample of college attendees. Similar to the low financial literacy sample, for individuals who have taken some or more college classes, the financial education variable is negative and significant for lower levels of FRT, while being positive and significant for higher levels of FRT (though the marginal effect on FRT outcome of “3” is negative in this case), indicating a positive association with taking financial education classes and reporting higher levels of FRT, when compared to those who have not had any financial education. Similar to previous models, results for both education levels in the high literacy sample as shown in Tables 5 and 6 indicate that higher income is positively linked to higher FRT measures and lower income is linked with lower responses of FRT. Additionally, men are more likely to report higher values of FRT measures relative to women in these high literacy samples as well. Age and not being in the labor force (as compared to full time employees) seems to have an inverse relationship with the self-reported risk preference measures. When cross sectioning both education levels by median financial literacy, none of the financial education variables are significant for any of the FRT outcomes (Tables 7 and 8).
Robustness Check
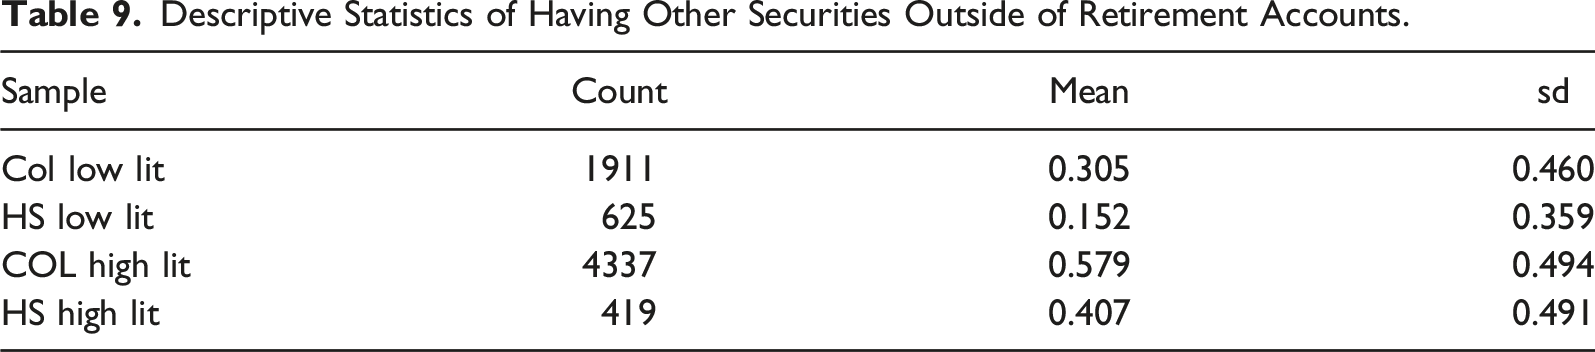
Finally, as a very rudimentary robustness check, it is examined whether financial education has an effect on the likelihood of having other forms of financial securities, outside of retirement accounts. Having securities (especially having stocks) has been linked with more financially risk tolerant behavior. Various studies have found a link between myopic loss aversion and lack of participation in stock markets (Benartzi & Thaler, 1995). Myopic loss aversion is an extension of prospect theory and predicts risk aversion over small stakes (Kai-Ineman & Tversky, 1979; Benjamin et al., 2006).
To check for robustness of results in this manner, the following probit model is estimated:
“OtherSecurities” is a dummy variable indicating whether the respondent has other financial investments outside of retirement accounts, such as investments in stocks, bonds, mutual funds or other such securities. “F” is the normal Cumulative Distribution Function (CDF) for the probit model and “β” is the vector of coefficients to be estimated. The definition of “x” is the same as in Model 1 of this paper.
Descriptive Statistics of Having Other Securities Outside of Retirement Accounts.
Probit model weighted marginal effects across samples; financial market participation is dependent variable.
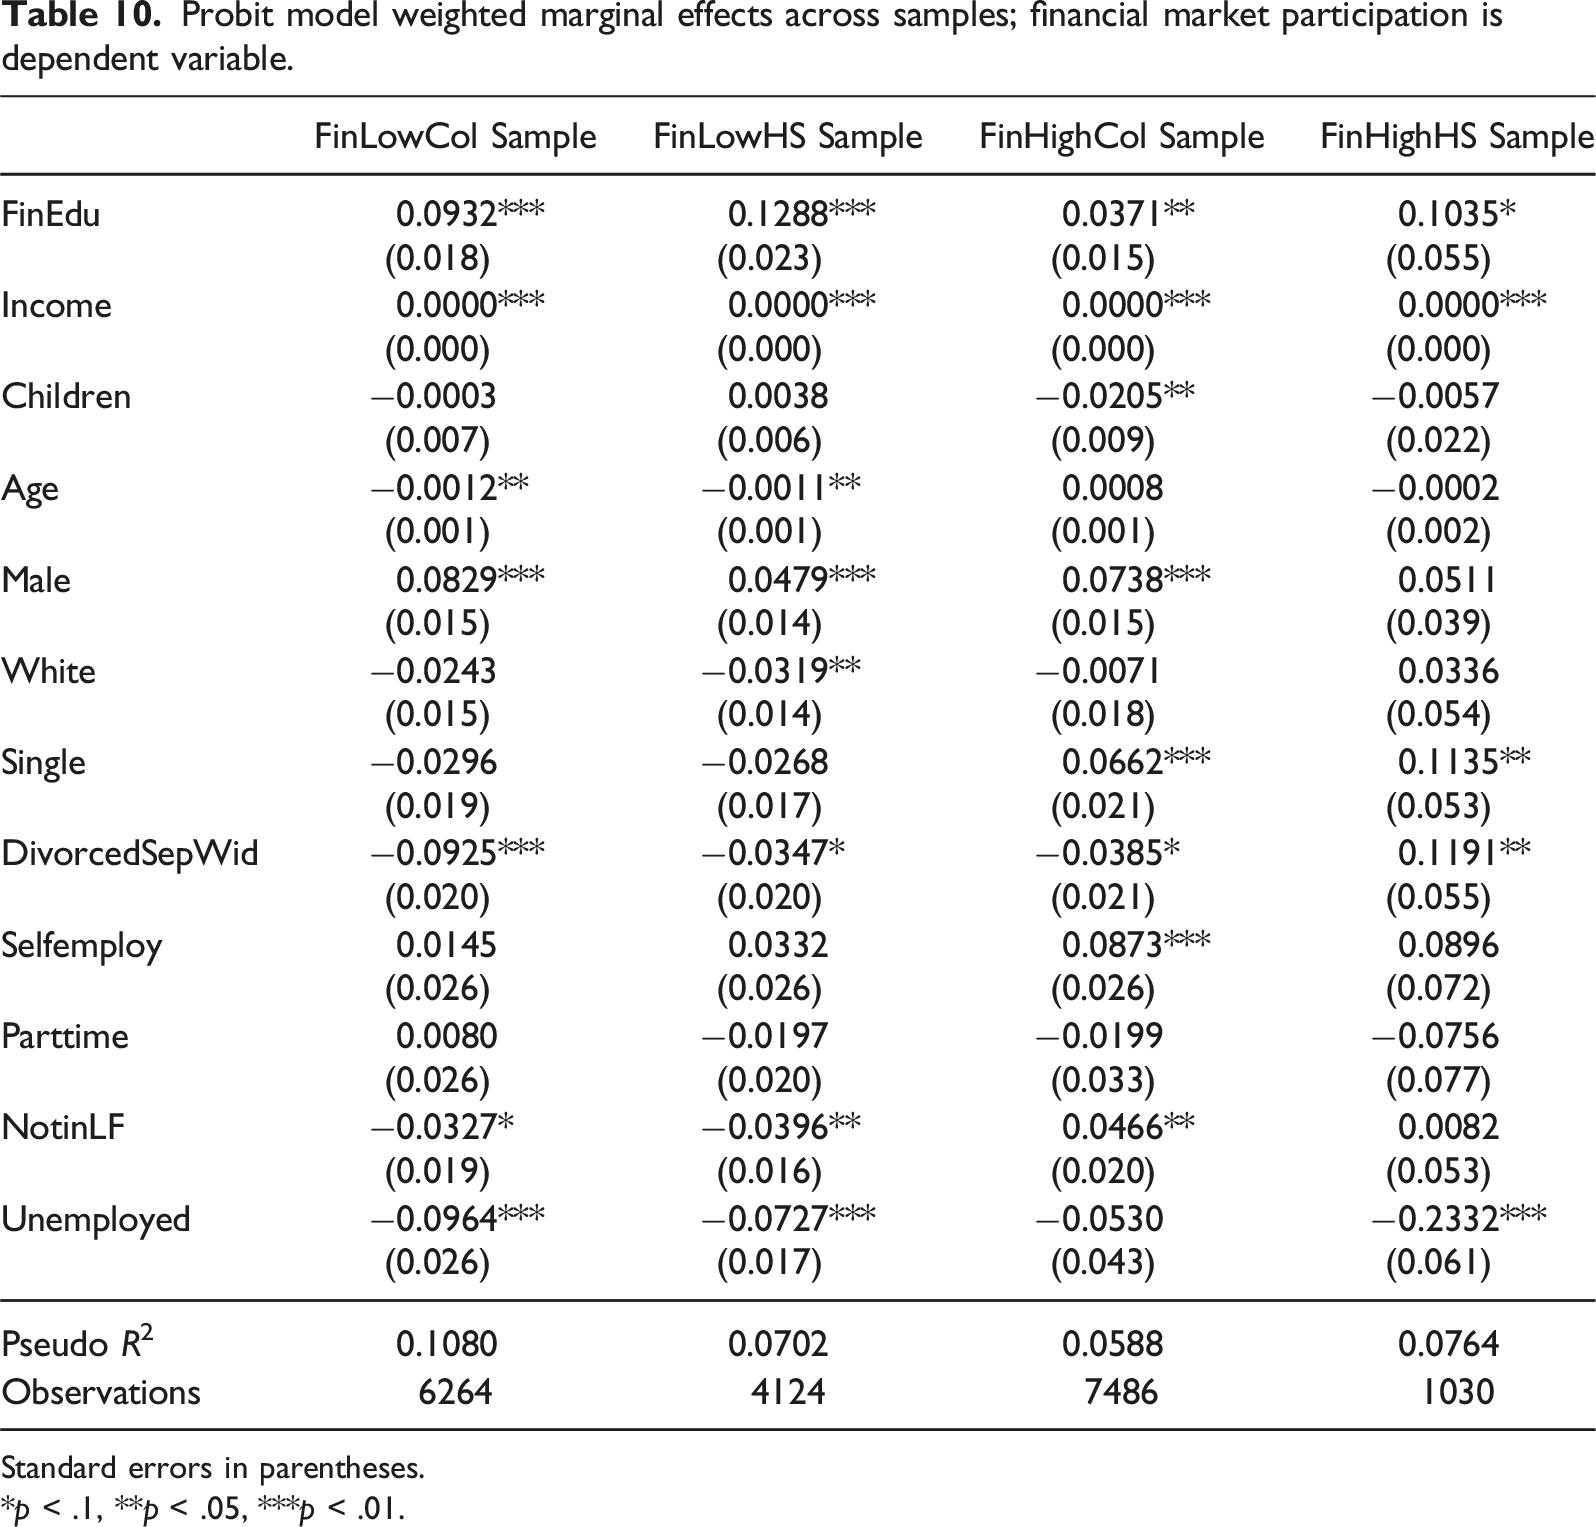
Standard errors in parentheses.
*p < .1, **p < .05, ***p < .01.
Conclusions, Limitations, and Implications
After controlling for financial literacy, this study finds that those who participate in financial education courses are more likely to report higher levels of FRT measures and less likely to report lower levels of FRT. These results are consistent in both high literacy and low literacy samples of those who have attended college and in the low literacy sample of individuals who have not participated in college level classes. A rudimentary robustness check evaluating the relationship between receiving financial education and having access to other securities further confirms that receiving financial education may be correlated with FRT.
Financial risk taking is not particularly a “good” or “bad” financial practice. Individuals have their own attitudes and proclivities towards risk. Extreme risk aversion however, excludes individuals from numerous advantageous financial opportunities like participating in the stock market. The results of this study are consistent with studies such as Ryack (2011), noting a positive association between receiving financial education and FRT measures. This study adds to the literature as it observes the effects of financial education on FRT, while controlling for financial literacy.
This analysis however, has limitations. First, the financial education variable may capture a variety of different programs. Financial education programs can vary in content, methodology, and focus. Further, selection bias cannot be ignored as participants who voluntarily attend personal financial education classes may have behavior proclivities making them seek out these courses and hence, making them different from individuals who do not do so. This becomes especially applicable for those obtaining financial education when they do not have to; like high school students taking financial education courses in states with no mandates and college students taking financial education courses when they do not have to do so. Workplace financial education courses could also be remedial in nature, adding to the selection bias problem in the model. Further, FRT is a psychological attribute that may not be completely explained by all of the variables included in the model. Variables such as past experiences and general attitudes towards financial instruments could also affect personal FRT measures and are omitted in the model.
With these limitations in mind, it may be beneficial to replicate this analysis using a different dataset to check for robustness. It is hard to obtain, however, datasets including both financial education variables and FRT measures. In addition, for future consideration, it may be interesting to replicate this analysis for a specific risk tolerant behavior (such as participating in the stock market, having stocks over bonds, etc.). Regardless, this study offers a first step in evaluating the relationship between financial education and FRT, while also considering financial literacy.
Footnotes
Declaration of Conflicting Interests
The author(s) declared no potential conflicts of interest with respect to the research, authorship, and/or publication of this article.
Funding
The author(s) received no financial support for the research, authorship, and/or publication of this article.
Notes
Appendix
Financial literacy questions used to construct the financial literacy score.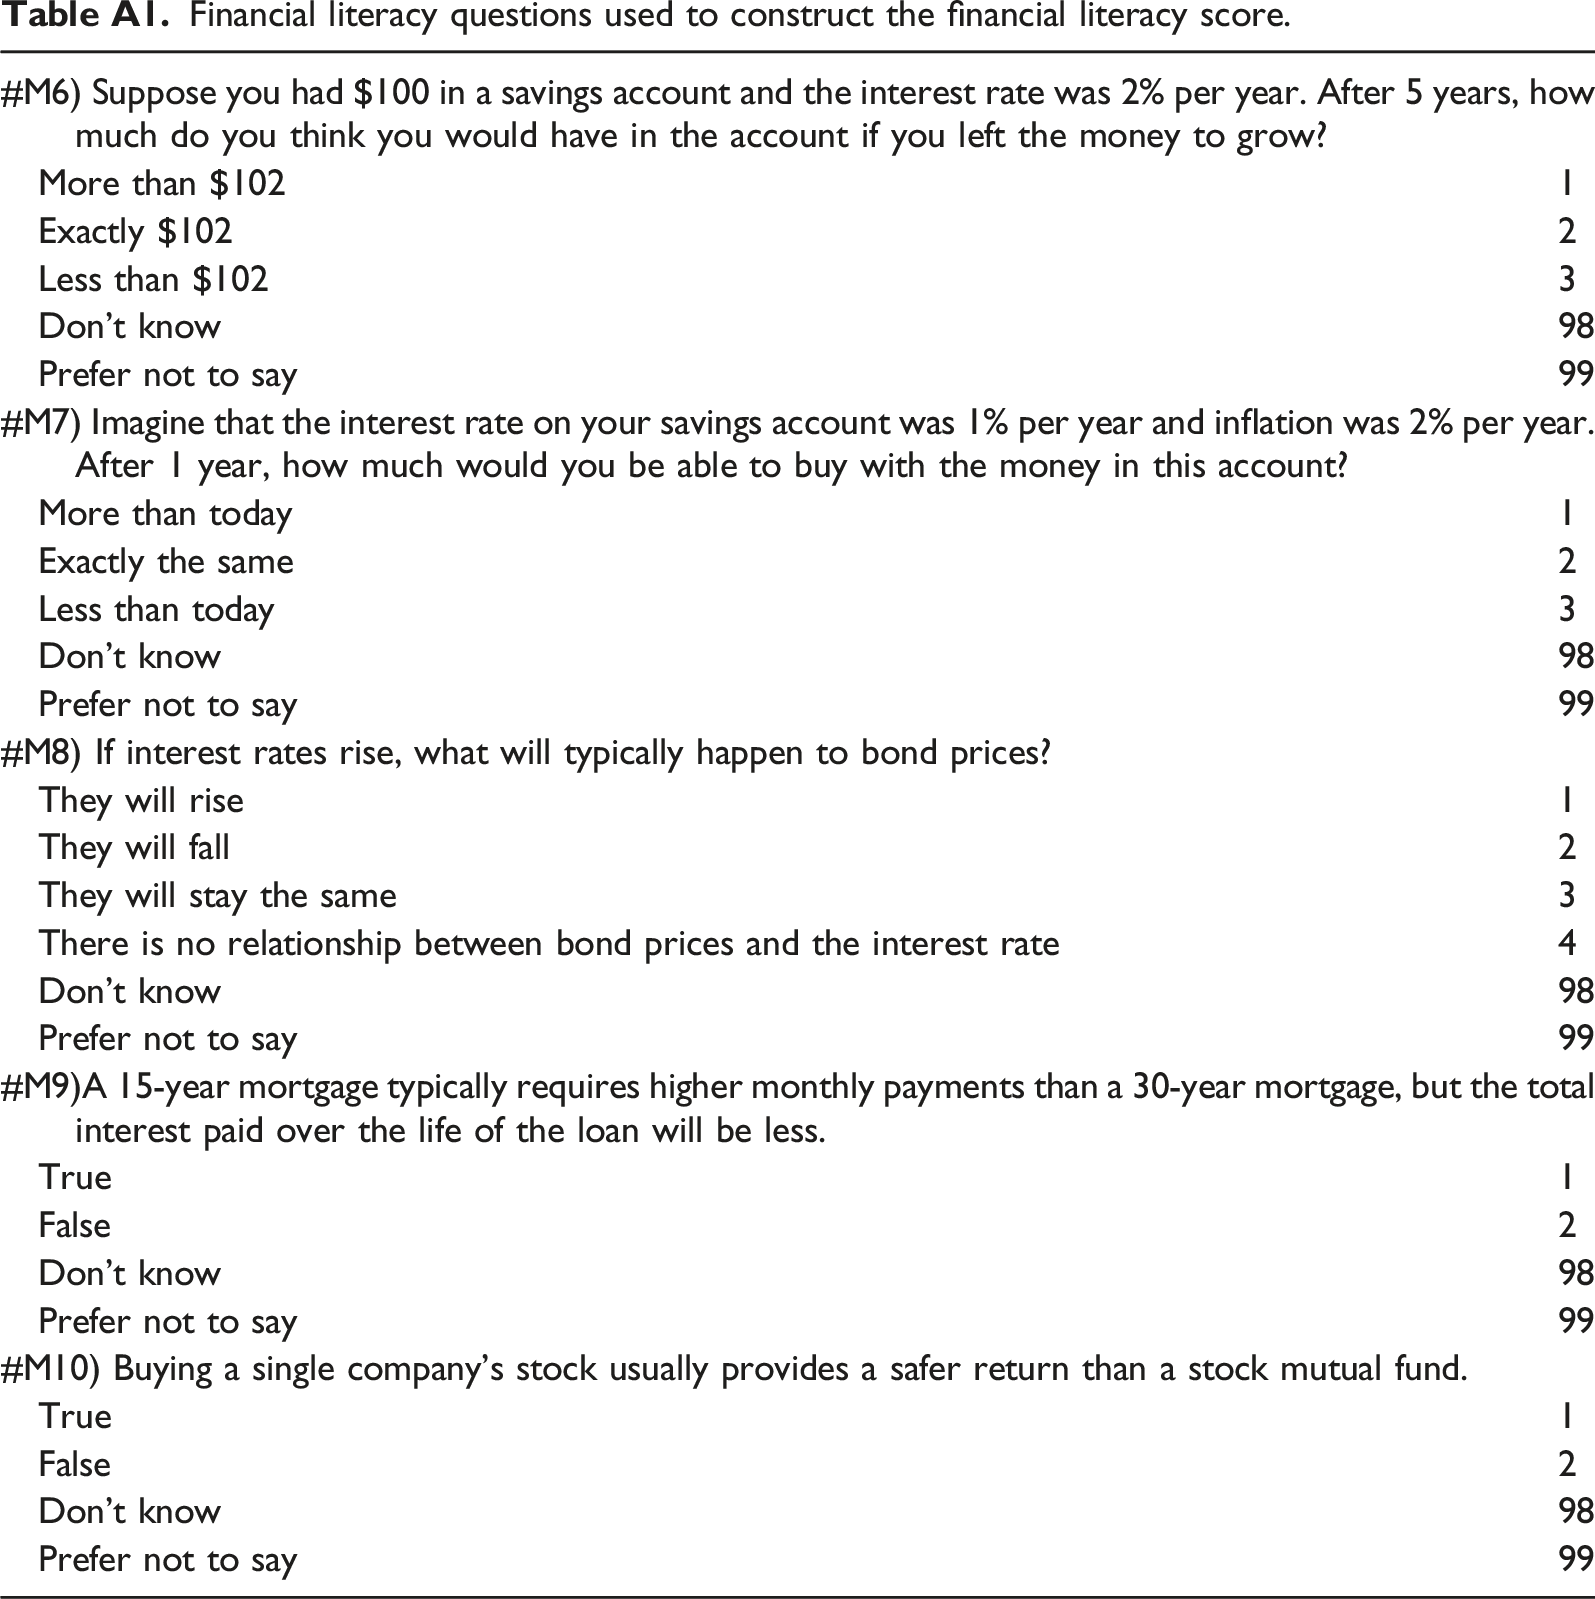
#M6) Suppose you had $100 in a savings account and the interest rate was 2% per year. After 5 years, how much do you think you would have in the account if you left the money to grow?
More than $102
1
Exactly $102
2
Less than $102
3
Don’t know
98
Prefer not to say
99
#M7) Imagine that the interest rate on your savings account was 1% per year and inflation was 2% per year. After 1 year, how much would you be able to buy with the money in this account?
More than today
1
Exactly the same
2
Less than today
3
Don’t know
98
Prefer not to say
99
#M8) If interest rates rise, what will typically happen to bond prices?
They will rise
1
They will fall
2
They will stay the same
3
There is no relationship between bond prices and the interest rate
4
Don’t know
98
Prefer not to say
99
#M9)A 15-year mortgage typically requires higher monthly payments than a 30-year mortgage, but the total interest paid over the life of the loan will be less.
True
1
False
2
Don’t know
98
Prefer not to say
99
#M10) Buying a single company’s stock usually provides a safer return than a stock mutual fund.
True
1
False
2
Don’t know
98
Prefer not to say
99
Financial literacy variables were recoded into binary variables that took on a value of 1 if the respondent answered the question correctly. These binary variables were added up to generate a financial literacy score for each participant in the study.
Weighted Descriptive Statistics for college attended sample with low literacy.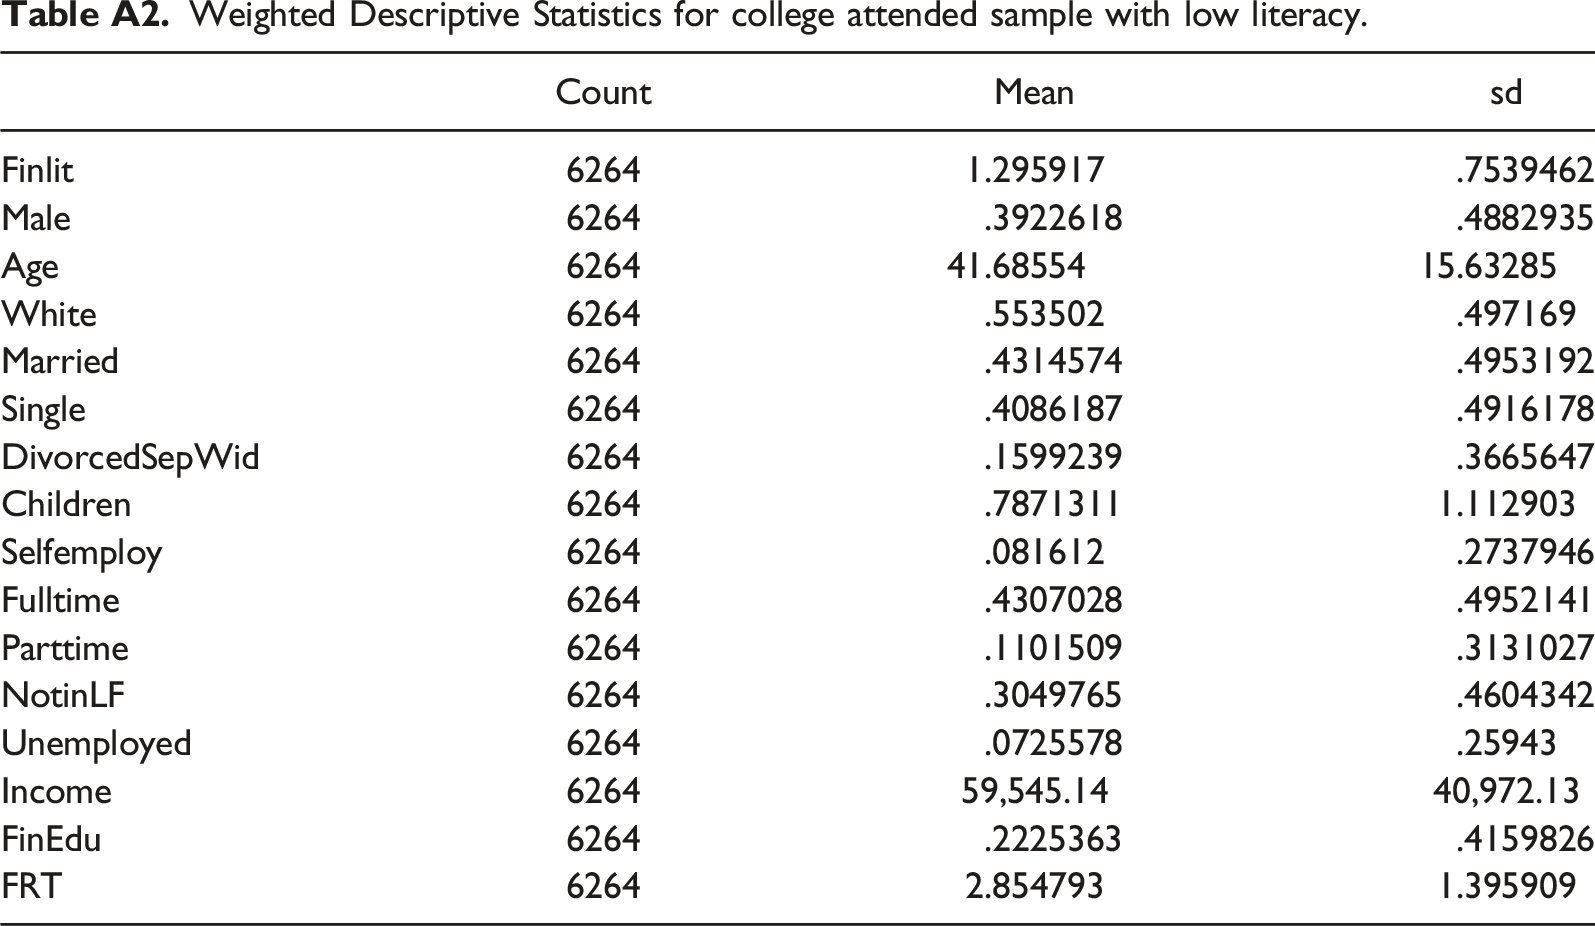
Count
Mean
sd
Finlit
6264
1.295917
.7539462
Male
6264
.3922618
.4882935
Age
6264
41.68554
15.63285
White
6264
.553502
.497169
Married
6264
.4314574
.4953192
Single
6264
.4086187
.4916178
DivorcedSepWid
6264
.1599239
.3665647
Children
6264
.7871311
1.112903
Selfemploy
6264
.081612
.2737946
Fulltime
6264
.4307028
.4952141
Parttime
6264
.1101509
.3131027
NotinLF
6264
.3049765
.4604342
Unemployed
6264
.0725578
.25943
Income
6264
59,545.14
40,972.13
FinEdu
6264
.2225363
.4159826
FRT
6264
2.854793
1.395909
Weighted descriptive statistics for HS OR LESS educated sample with low literacy.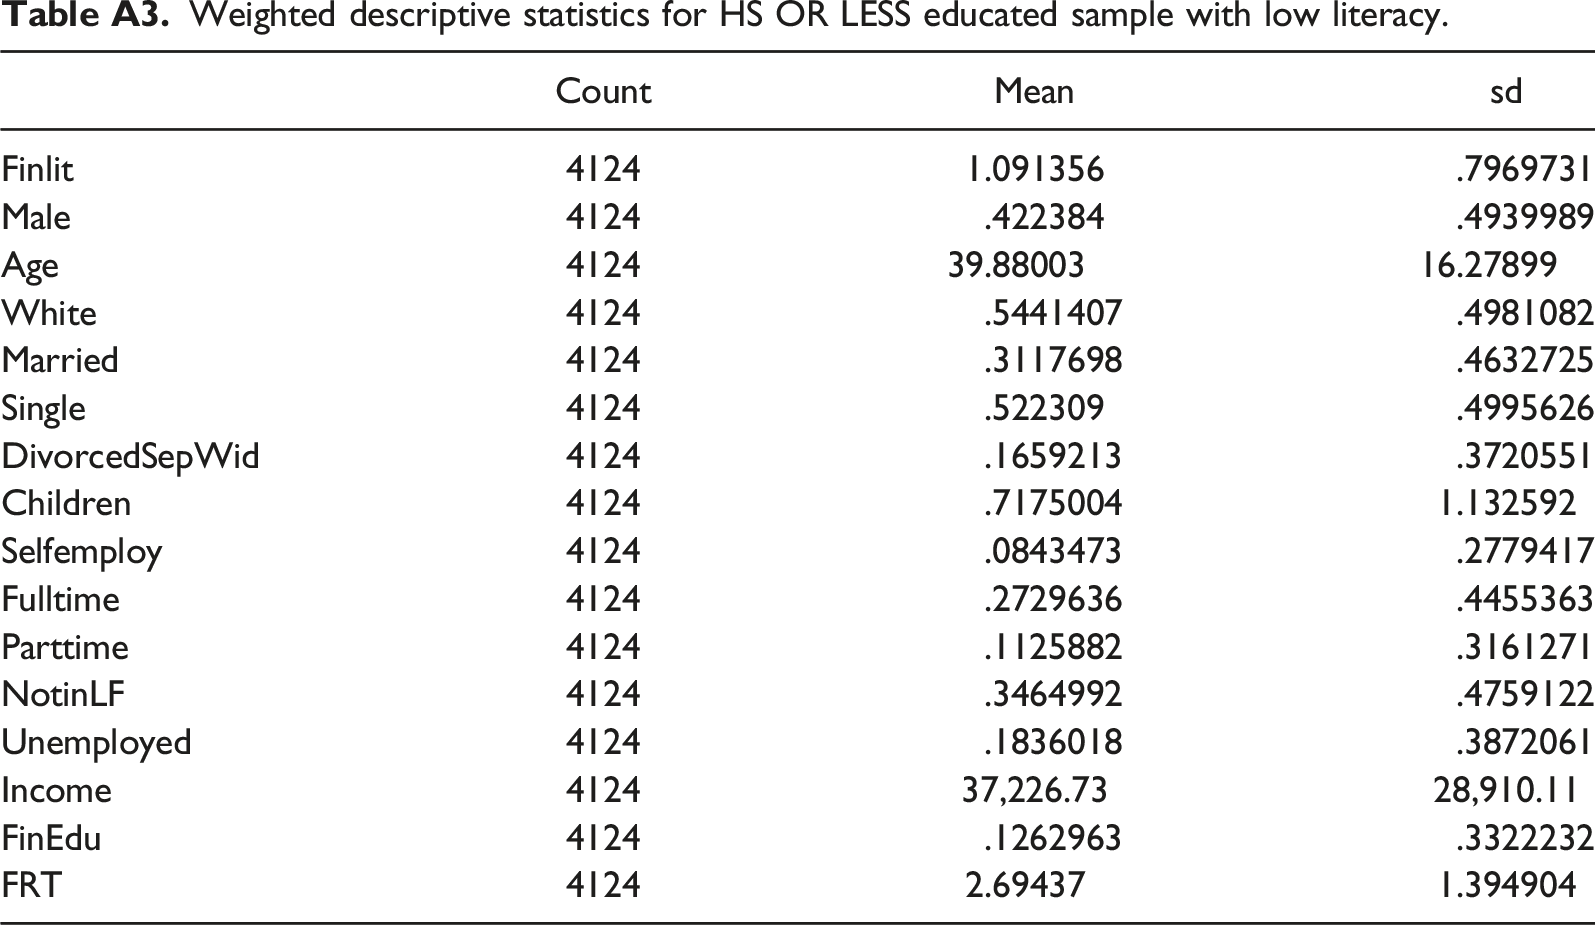
Count
Mean
sd
Finlit
4124
1.091356
.7969731
Male
4124
.422384
.4939989
Age
4124
39.88003
16.27899
White
4124
.5441407
.4981082
Married
4124
.3117698
.4632725
Single
4124
.522309
.4995626
DivorcedSepWid
4124
.1659213
.3720551
Children
4124
.7175004
1.132592
Selfemploy
4124
.0843473
.2779417
Fulltime
4124
.2729636
.4455363
Parttime
4124
.1125882
.3161271
NotinLF
4124
.3464992
.4759122
Unemployed
4124
.1836018
.3872061
Income
4124
37,226.73
28,910.11
FinEdu
4124
.1262963
.3322232
FRT
4124
2.69437
1.394904
Weighted Descriptive Statistics for college attended sample with high literacy.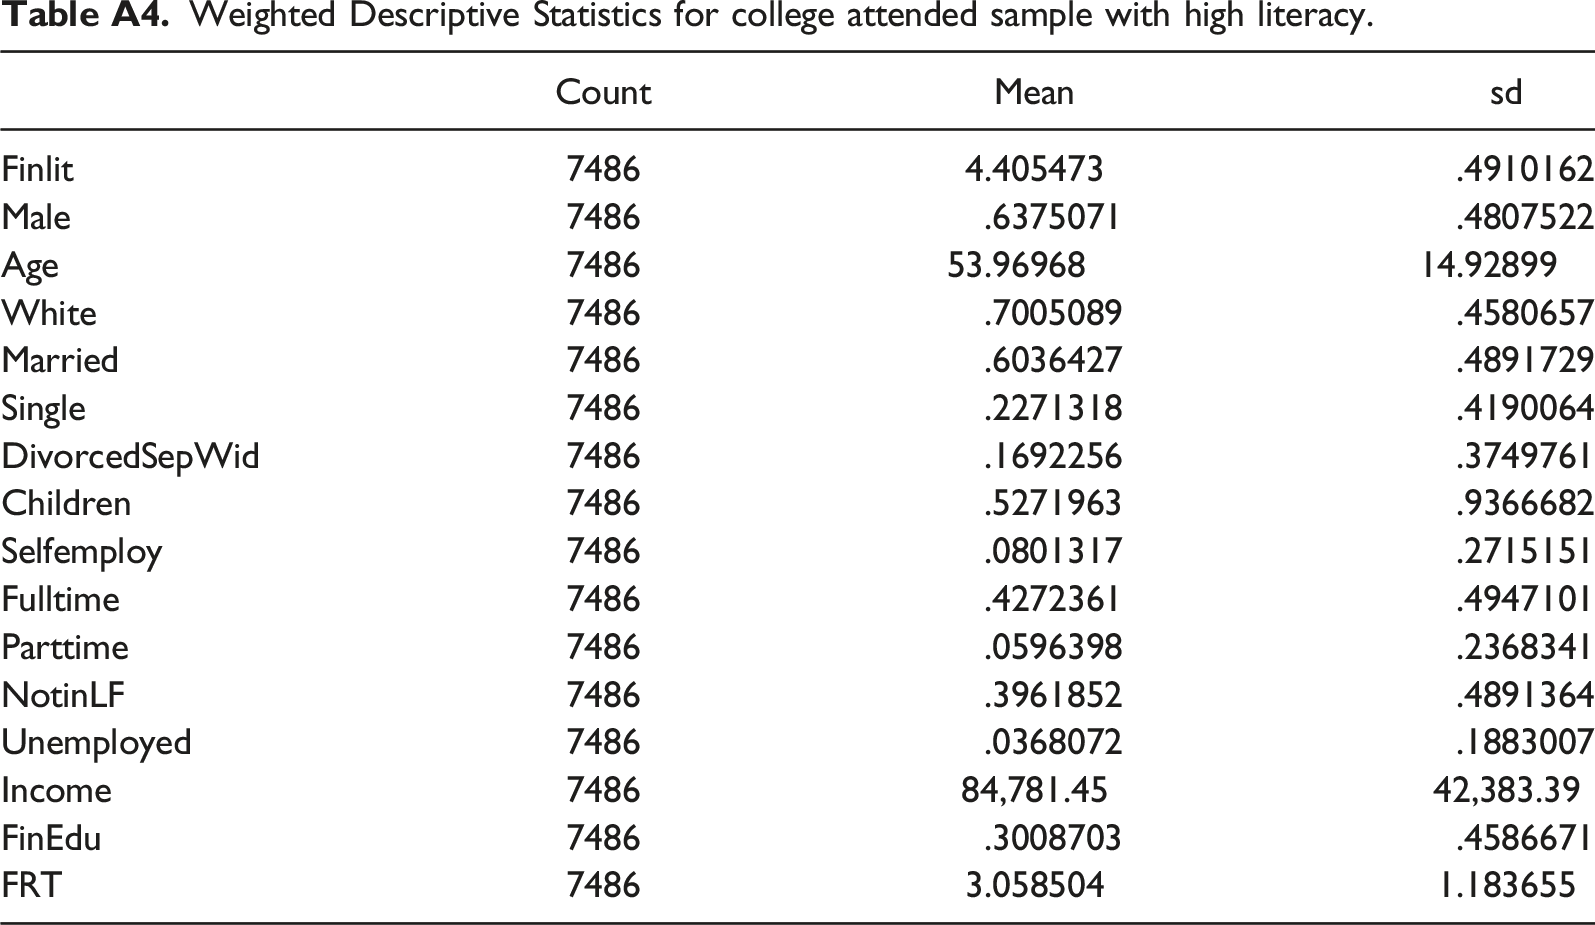
Count
Mean
sd
Finlit
7486
4.405473
.4910162
Male
7486
.6375071
.4807522
Age
7486
53.96968
14.92899
White
7486
.7005089
.4580657
Married
7486
.6036427
.4891729
Single
7486
.2271318
.4190064
DivorcedSepWid
7486
.1692256
.3749761
Children
7486
.5271963
.9366682
Selfemploy
7486
.0801317
.2715151
Fulltime
7486
.4272361
.4947101
Parttime
7486
.0596398
.2368341
NotinLF
7486
.3961852
.4891364
Unemployed
7486
.0368072
.1883007
Income
7486
84,781.45
42,383.39
FinEdu
7486
.3008703
.4586671
FRT
7486
3.058504
1.183655
Weighted descriptive statistics for HS OR LESS educated sample with high literacy.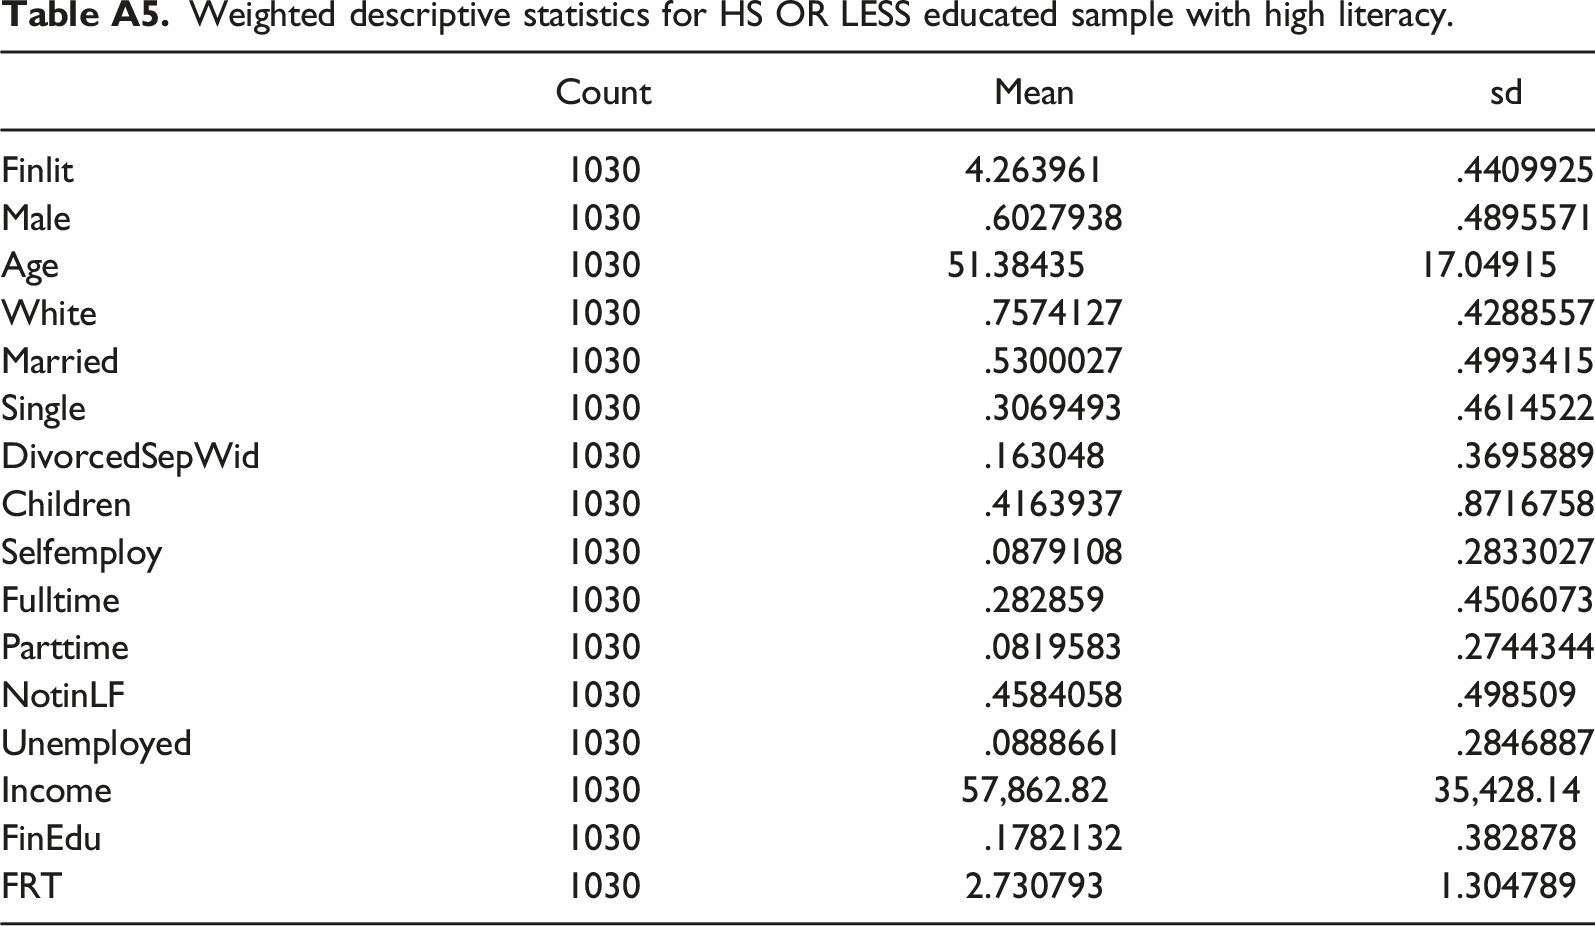
Count
Mean
sd
Finlit
1030
4.263961
.4409925
Male
1030
.6027938
.4895571
Age
1030
51.38435
17.04915
White
1030
.7574127
.4288557
Married
1030
.5300027
.4993415
Single
1030
.3069493
.4614522
DivorcedSepWid
1030
.163048
.3695889
Children
1030
.4163937
.8716758
Selfemploy
1030
.0879108
.2833027
Fulltime
1030
.282859
.4506073
Parttime
1030
.0819583
.2744344
NotinLF
1030
.4584058
.498509
Unemployed
1030
.0888661
.2846887
Income
1030
57,862.82
35,428.14
FinEdu
1030
.1782132
.382878
FRT
1030
2.730793
1.304789
Weighted Descriptive Statistics for college attended sample with median level literacy.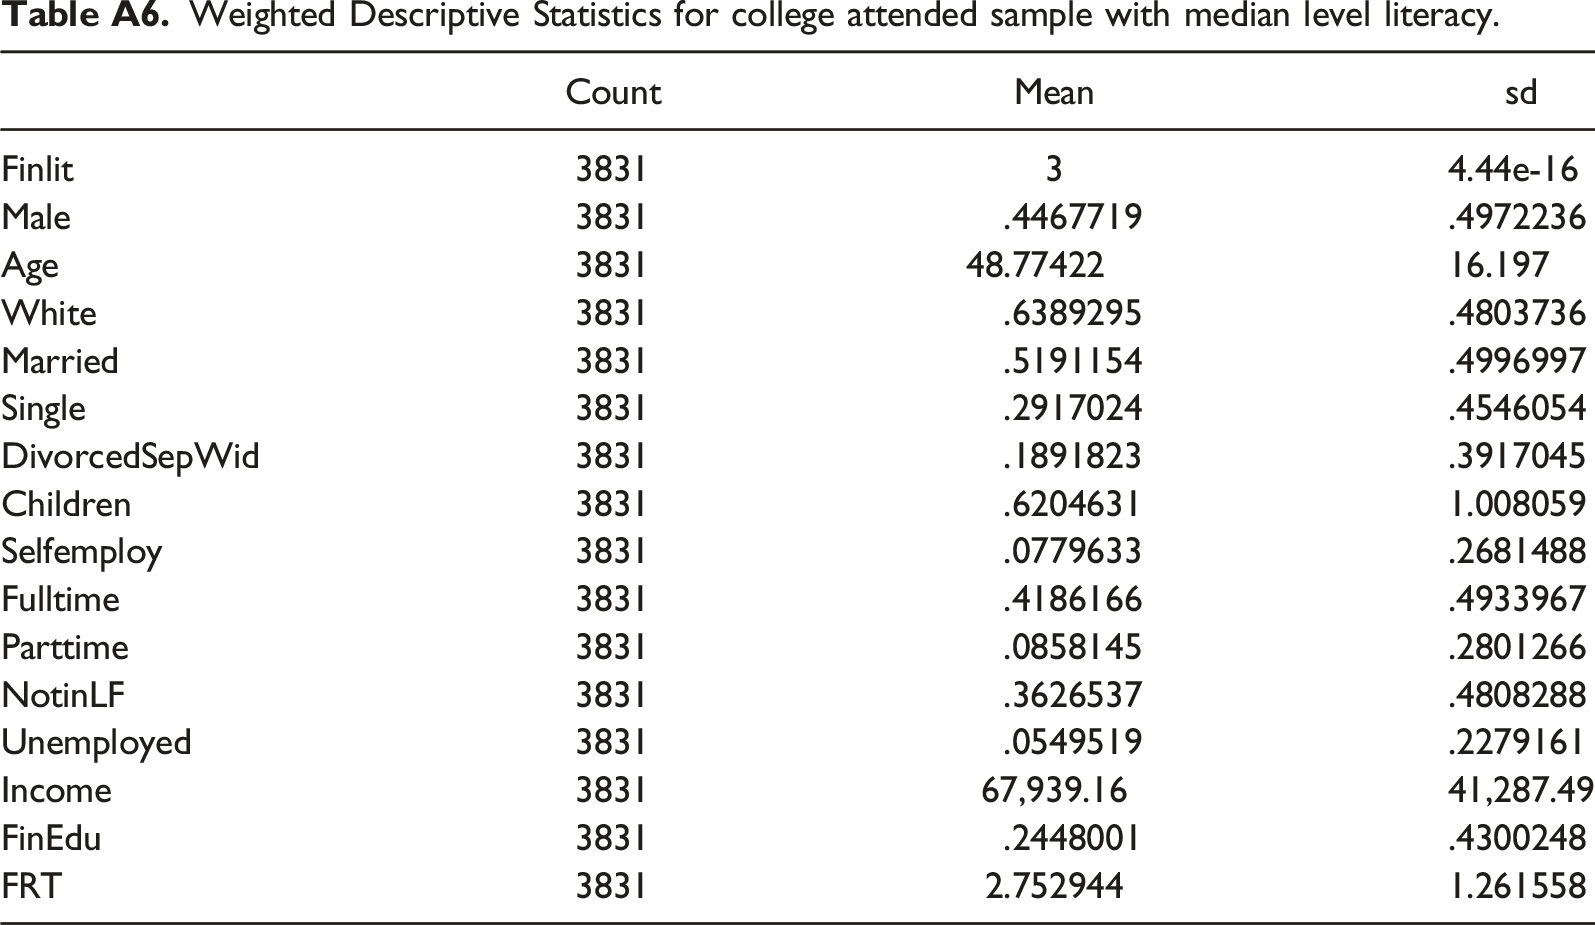
Count
Mean
sd
Finlit
3831
3
4.44e-16
Male
3831
.4467719
.4972236
Age
3831
48.77422
16.197
White
3831
.6389295
.4803736
Married
3831
.5191154
.4996997
Single
3831
.2917024
.4546054
DivorcedSepWid
3831
.1891823
.3917045
Children
3831
.6204631
1.008059
Selfemploy
3831
.0779633
.2681488
Fulltime
3831
.4186166
.4933967
Parttime
3831
.0858145
.2801266
NotinLF
3831
.3626537
.4808288
Unemployed
3831
.0549519
.2279161
Income
3831
67,939.16
41,287.49
FinEdu
3831
.2448001
.4300248
FRT
3831
2.752944
1.261558
Weighted descriptive statistics for HS OR LESS educated sample with median level.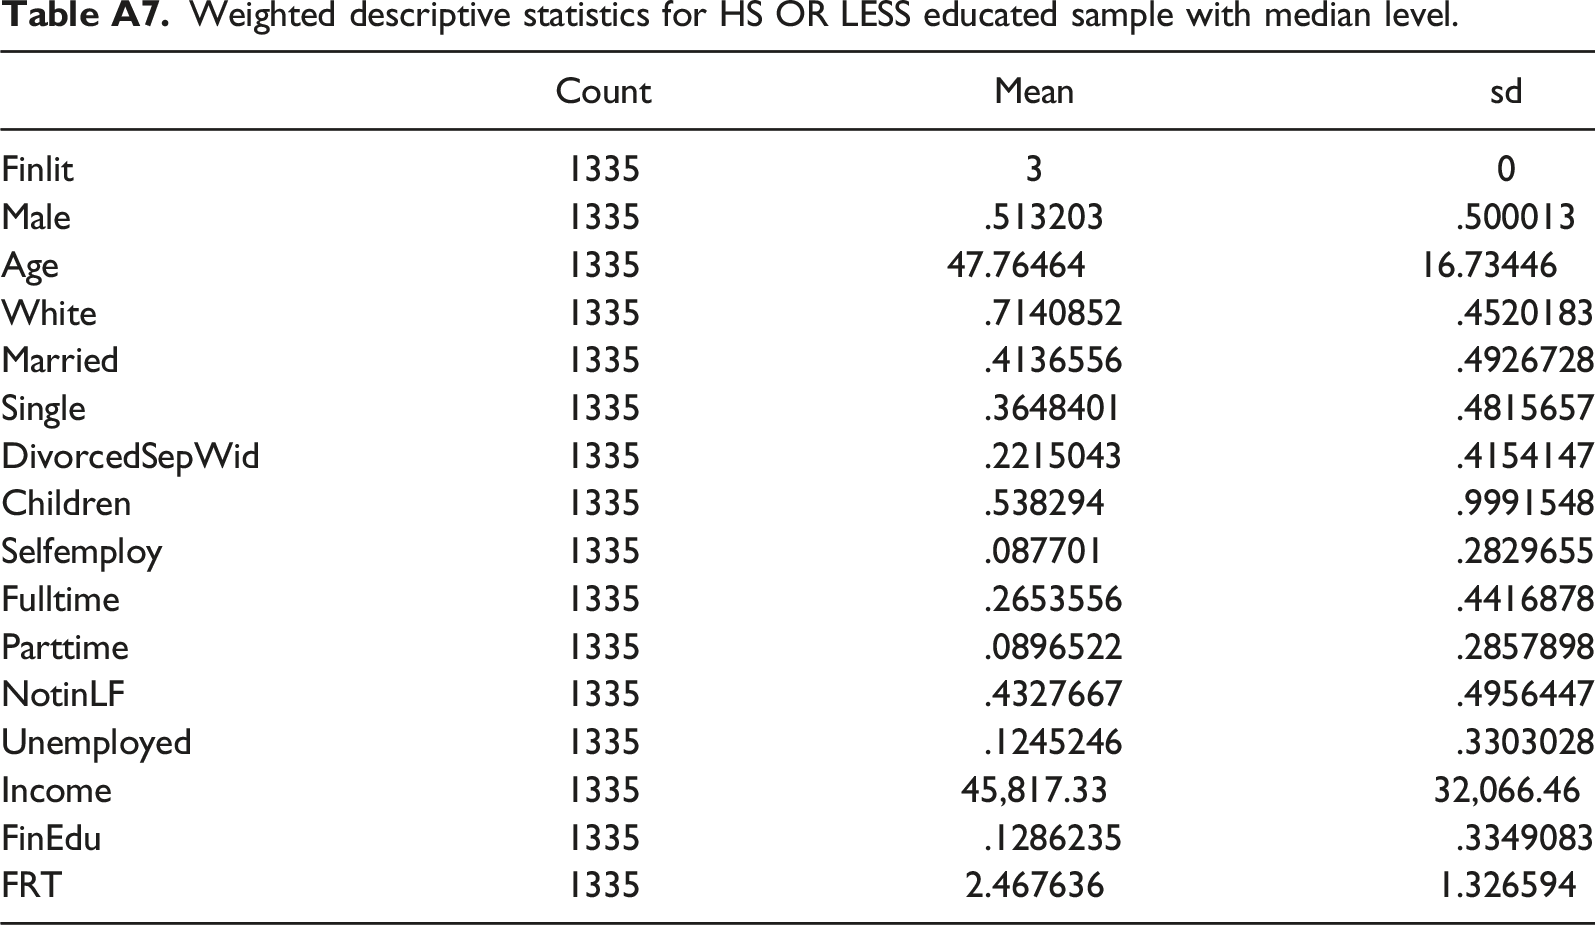
Count
Mean
sd
Finlit
1335
3
0
Male
1335
.513203
.500013
Age
1335
47.76464
16.73446
White
1335
.7140852
.4520183
Married
1335
.4136556
.4926728
Single
1335
.3648401
.4815657
DivorcedSepWid
1335
.2215043
.4154147
Children
1335
.538294
.9991548
Selfemploy
1335
.087701
.2829655
Fulltime
1335
.2653556
.4416878
Parttime
1335
.0896522
.2857898
NotinLF
1335
.4327667
.4956447
Unemployed
1335
.1245246
.3303028
Income
1335
45,817.33
32,066.46
FinEdu
1335
.1286235
.3349083
FRT
1335
2.467636
1.326594