
Abstract
Background
Venous-arterial CO2 difference (Pv-aCO2) is a valuable marker that can identify a subset of patients in shock with inadequate cardiac output to meet tissue metabolic requirements. Some authors have found that Pv-aCO2 levels calculated from mixed vs central venous blood demonstrate a linear relationship. The purpose of this study is to determine whether there is a linear relationship between Pv-aCO2 obtained with peripheral venous blood (Pv-aCO2p) and with mixed venous blood, and the agreement between the 2 measures.
Methods
This was a prospective, single-center, observational clinical study enrolling mechanically ventilated patients in septic shock during the first 24 hours following admission to the intensive care unit.
Results
The Bravais–Pearson r-coefficient between Pv-aCO2 and Pv-aCO2p was .70 in 38 determinations (95%CI .48-.83; P-value = 1.25 x 10^-6). The Bland–Altman bias was 4.11 mmHg (95%CI 2.82–5.39), and the repeatability coefficient was 11.05. Using the Taffe approach, the differential and proportional biases were 2.81 (95%CI .52–5.11) and 1.29 (95%CI .86–1.72), respectively.
Conclusion
There was linear correlation between Pv-aCO2p and Pv-aCO2 in mechanically ventilated patients with septic shock. The bias showed a gradual increase in high Pv-aCO2 values in an upward trend.
Introduction
The clinical significance of Pv-aCO2 (also called CO2 gap) is its ability to distinguish between a low or high cardiac output condition.1-3 According to Bakker et al, a Pv-aCO2 of more than 6 mmHg can identify a subgroup of septic patients who have low cardiac output. 4 In this study, there was no substantial difference in arterial lactate between the 2 subgroups of patients. Several studies have confirmed the role of Pv-aCO2 in identifying septic patients who present with a cardiac output inadequate for tissue metabolic demands.5-7 The clinical implications of this data are substantial and can impact the treatment approach at the bedside, for example, it may suggest the use of inotropic agents instead of additional fluids. 8
A linear correlation has been established between Pv-aCO2 obtained from mixed venous blood and Pv-aCO2 obtained from central venous blood.9-11 The aim of this study was to establish if there is a linear correlation between Pv-aCO2 obtained with peripheral venous blood (Pv-aCO2p) and Pv-aCO2 obtained with mixed venous blood, as a reference standard. Moreover, we evaluated the measurement bias and repeatability of Pv-aCO2p compared to conventional mixed venous blood Pv-aCO2. Finally, the correlation between Pv-aCO2p and the cardiac index as determined by a pulmonary artery catheter (PAC) was investigated.
Methods
This was a prospective, single-center, observational clinical study. We included consecutive patients admitted to the Clinical Intensive Care Unit of ASUFC University Hospital of Udine from November 10th, 2022 to May 30th, 2023. We enrolled mechanically ventilated patients with septic shock according to literature definitions (e.g., sepsis with hypotension unresponsive to a fluid load of at least 2000 mL of crystalloid; and requiring the administration of vasopressor drugs) in need for invasive monitoring via PAC, invasive monitoring of arterial blood pressure, and with at least 1 site of peripheral venous access. We excluded patients who received extracorporeal membrane oxygenation (ECMO) or were aged less than 18 years.
The primary aim was the evaluation of the linear correlation and agreement between the Pv-aCO2 measured with peripheral venous and mixed venous blood. The secondary aim was the assessment of the correlation between the Pv-aCO2 value measured with peripheral blood and cardiac index using PAC. We also evaluated the repeatability of the measurement.
All measurements took place within the first 24 hours of eligible patients being admitted to the intensive care unit (ICU). Peripheral blood samples were taken using a needle cannula inserted into one of the patient’s 2 upper limbs (usually already inserted in the hospital ward or emergency department) and with the use of a tourniquet. The mixed venous blood samples were taken after inserting a PAC in the jugular vein (the catheter position was confirmed by measuring the arterial pulmonary occlusion pressure and chest radiograph). Each patient had 2 or more separate measurements taken for each type of venous blood sample (peripheral and mixed). According to the internal protocol, the cardiac index was routinely established using an average of at least 3 measurements obtained by thermodilution technique.
The study did not involve treating physicians in any way. Despite not withholding any data from treating physicians, the measurements made did not directly influence therapeutic decisions, except for the data required by treating colleagues for patient management purposes.
Each patient’s consent was requested for the clinical management of the hospital, consistent with clinical conditions. The data were collected anonymously in secure databases, which could only be accessed by investigators described in the protocol. The CEUR Regional Ethical Committee of Friuli Venezia Giulia approved the study protocol on agenda 5.7 of 08/11/2022. The study followed international and national regulations following the Declaration of Helsinki.
Statistical Analysis
A regression analysis was applied to verify the correlation between the study variables, such as Pv-aCO2p and Pv-aCO2 obtained with mixed venous blood (as a reference standard). We evaluated the Bravais–Pearson Index to determine the degree of correlation. The Bland–Altman test was used to analyze the agreement of the 2 measurements. Through the Bland–Altman test we calculated the bias for approximately how much the value of Pv-aCO2p differs from the reference value of Pv-aCO2. We also calculated the coefficient of repeatability that is the value under which the difference between any 2 repeated measurements of Pv-aCO2p, acquired under repeatable conditions (i.e., identical conditions), should fall within 95% probability.
We also applied the Taffé method, which consists of estimating the regression model through the marginal maximum likelihood (regardless of the variance) and estimating the posterior distribution through the Bayesian approach, to calculate the Best Linear Unbiased Prediction (BLUP) for the variables included in the study. 12 The second step of the Taffé method consists of estimating the bias value employing a regression equation using the Ordinary Least Squares (OLS) method and Wald's test to estimate the confidence interval. Finally, the variance of the error measurement is re-calibrated by removing the estimated differential and proportional biases. Taffé method has the main advantage of being more reliable than the classic Bland–Altman method when the variances of the measurement errors of the 2 methods are not constant (i.e., a heteroscedastic distribution). This situation can cause the regression line to have an upward or downward trend (when there is no bias) or a zero slope (if there is a bias). The Taffé method works better when there are repeating measurements on the same subject (preferable with the reference method, but it works properly when both the reference method and the new method are repeated, as well). For the purpose of estimating the agreement, each measurement on the same patient was considered independent.
Secondary analyses were the correlation between the cardiac index and the variables studied and the parameters derived from oxygen (i.e., SvO2). An alpha error not exceeding 5% (P-value ≤.05) was retained in the statistical analysis. Non-parametric regression with smoothing was used for data visualizations with smoothed conditional spread. The loess smoother was used for smoothing the conditional mean and variance. The variance smooth is calculated by smoothing the squared positive and negative residuals from the mean smooth separately, using the same type of smoother. These curves are calculated by adding the mean smooth plus the square root of the fit to positive squared residuals. The mean fit is reduced by subtracting the square root of the smooth of the negative squared residuals. Thus, the lines represent the conditional variance at every value on the horizontal axis.
Considering a target statistical power of 90%, an alpha error of .05, and a two-tail distribution, and based on a linear regression coefficient of .51 (i.e., pessimistic estimate), we estimated the necessary sample size of 36 measurements.
Statistical analysis was performed using the R-Cran open-source platform [R Core Team (2022). R: A language and environment for statistical computing. R Foundation for Statistical Computing, Vienna, Austria. URL: https://www.R-project.org/. V 4.2.2], implementing the following packages: readODS; MethodCompare; car; ggplot2; tidyverse; SimplyAgree; mcr.
Results
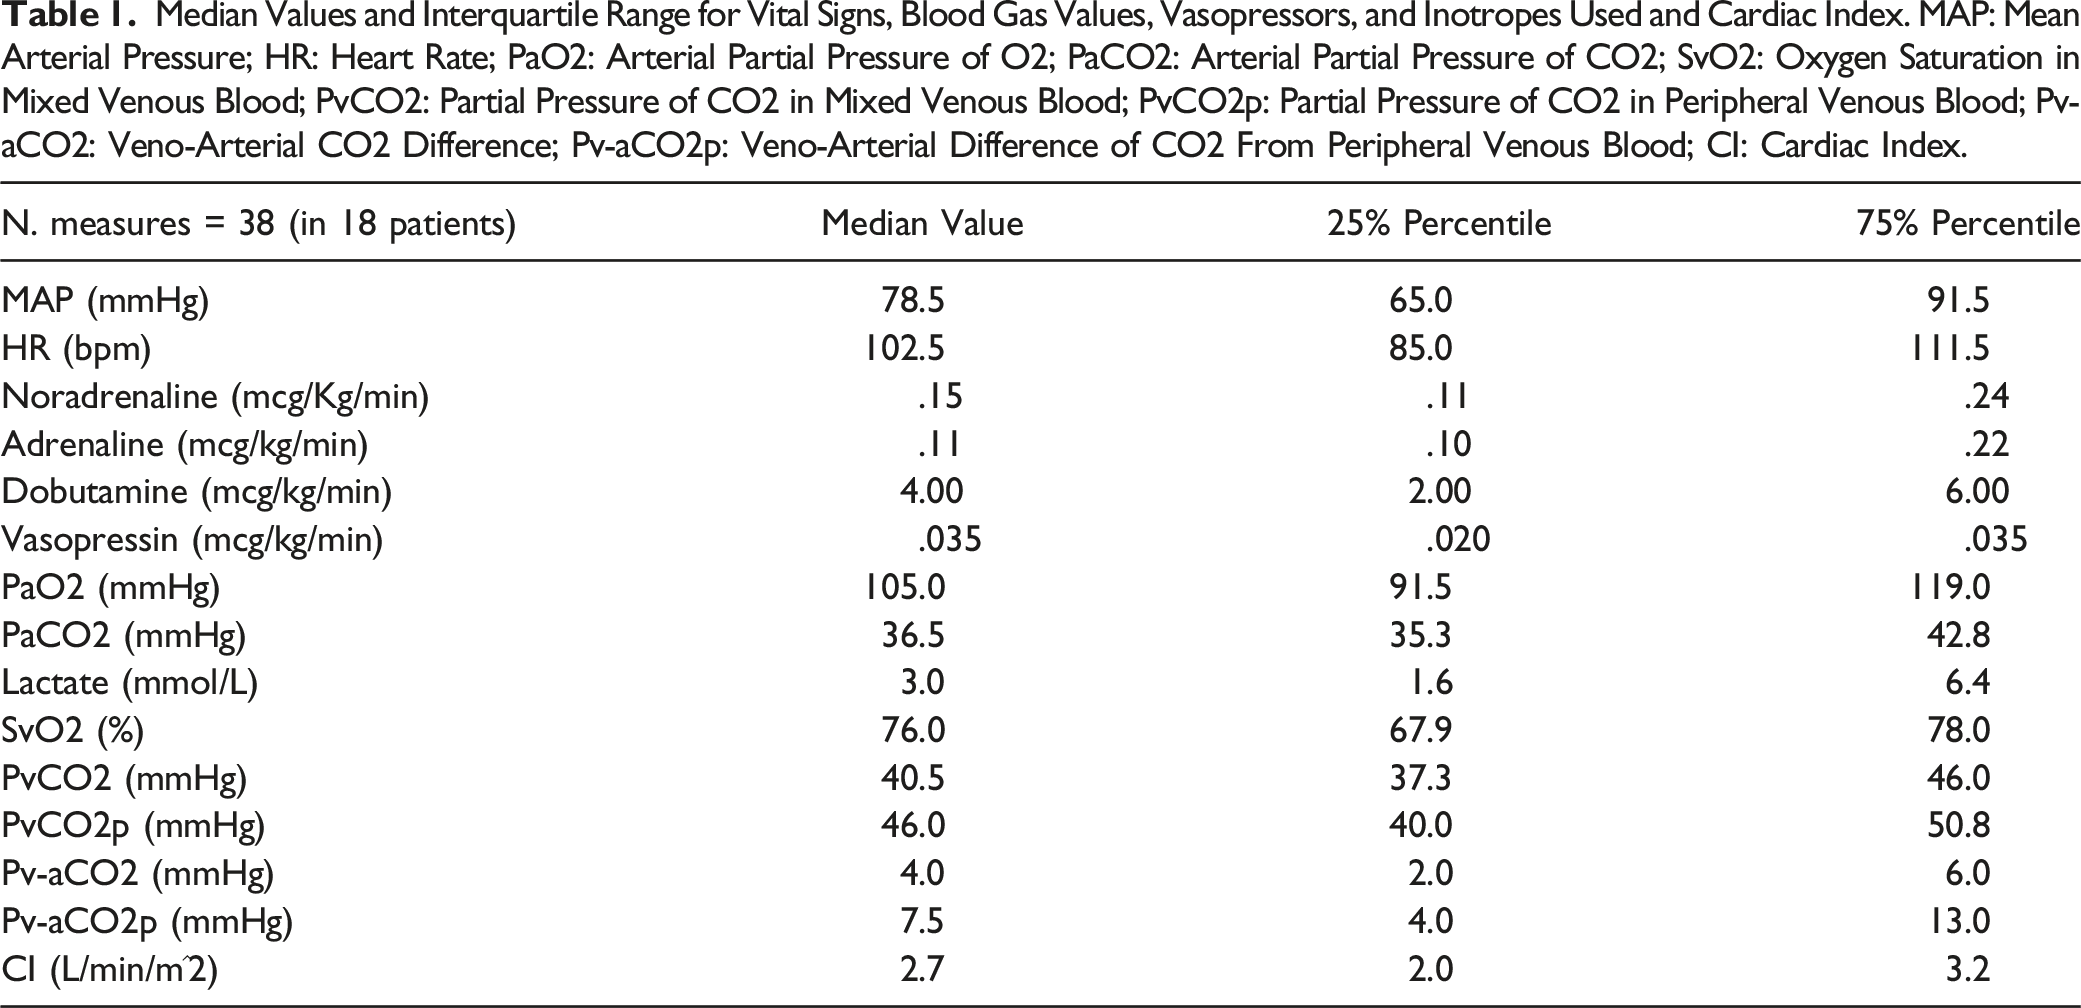
Median Values and Interquartile Range for Vital Signs, Blood Gas Values, Vasopressors, and Inotropes Used and Cardiac Index. MAP: Mean Arterial Pressure; HR: Heart Rate; PaO2: Arterial Partial Pressure of O2; PaCO2: Arterial Partial Pressure of CO2; SvO2: Oxygen Saturation in Mixed Venous Blood; PvCO2: Partial Pressure of CO2 in Mixed Venous Blood; PvCO2p: Partial Pressure of CO2 in Peripheral Venous Blood; Pv-aCO2: Veno-Arterial CO2 Difference; Pv-aCO2p: Veno-Arterial Difference of CO2 From Peripheral Venous Blood; CI: Cardiac Index.
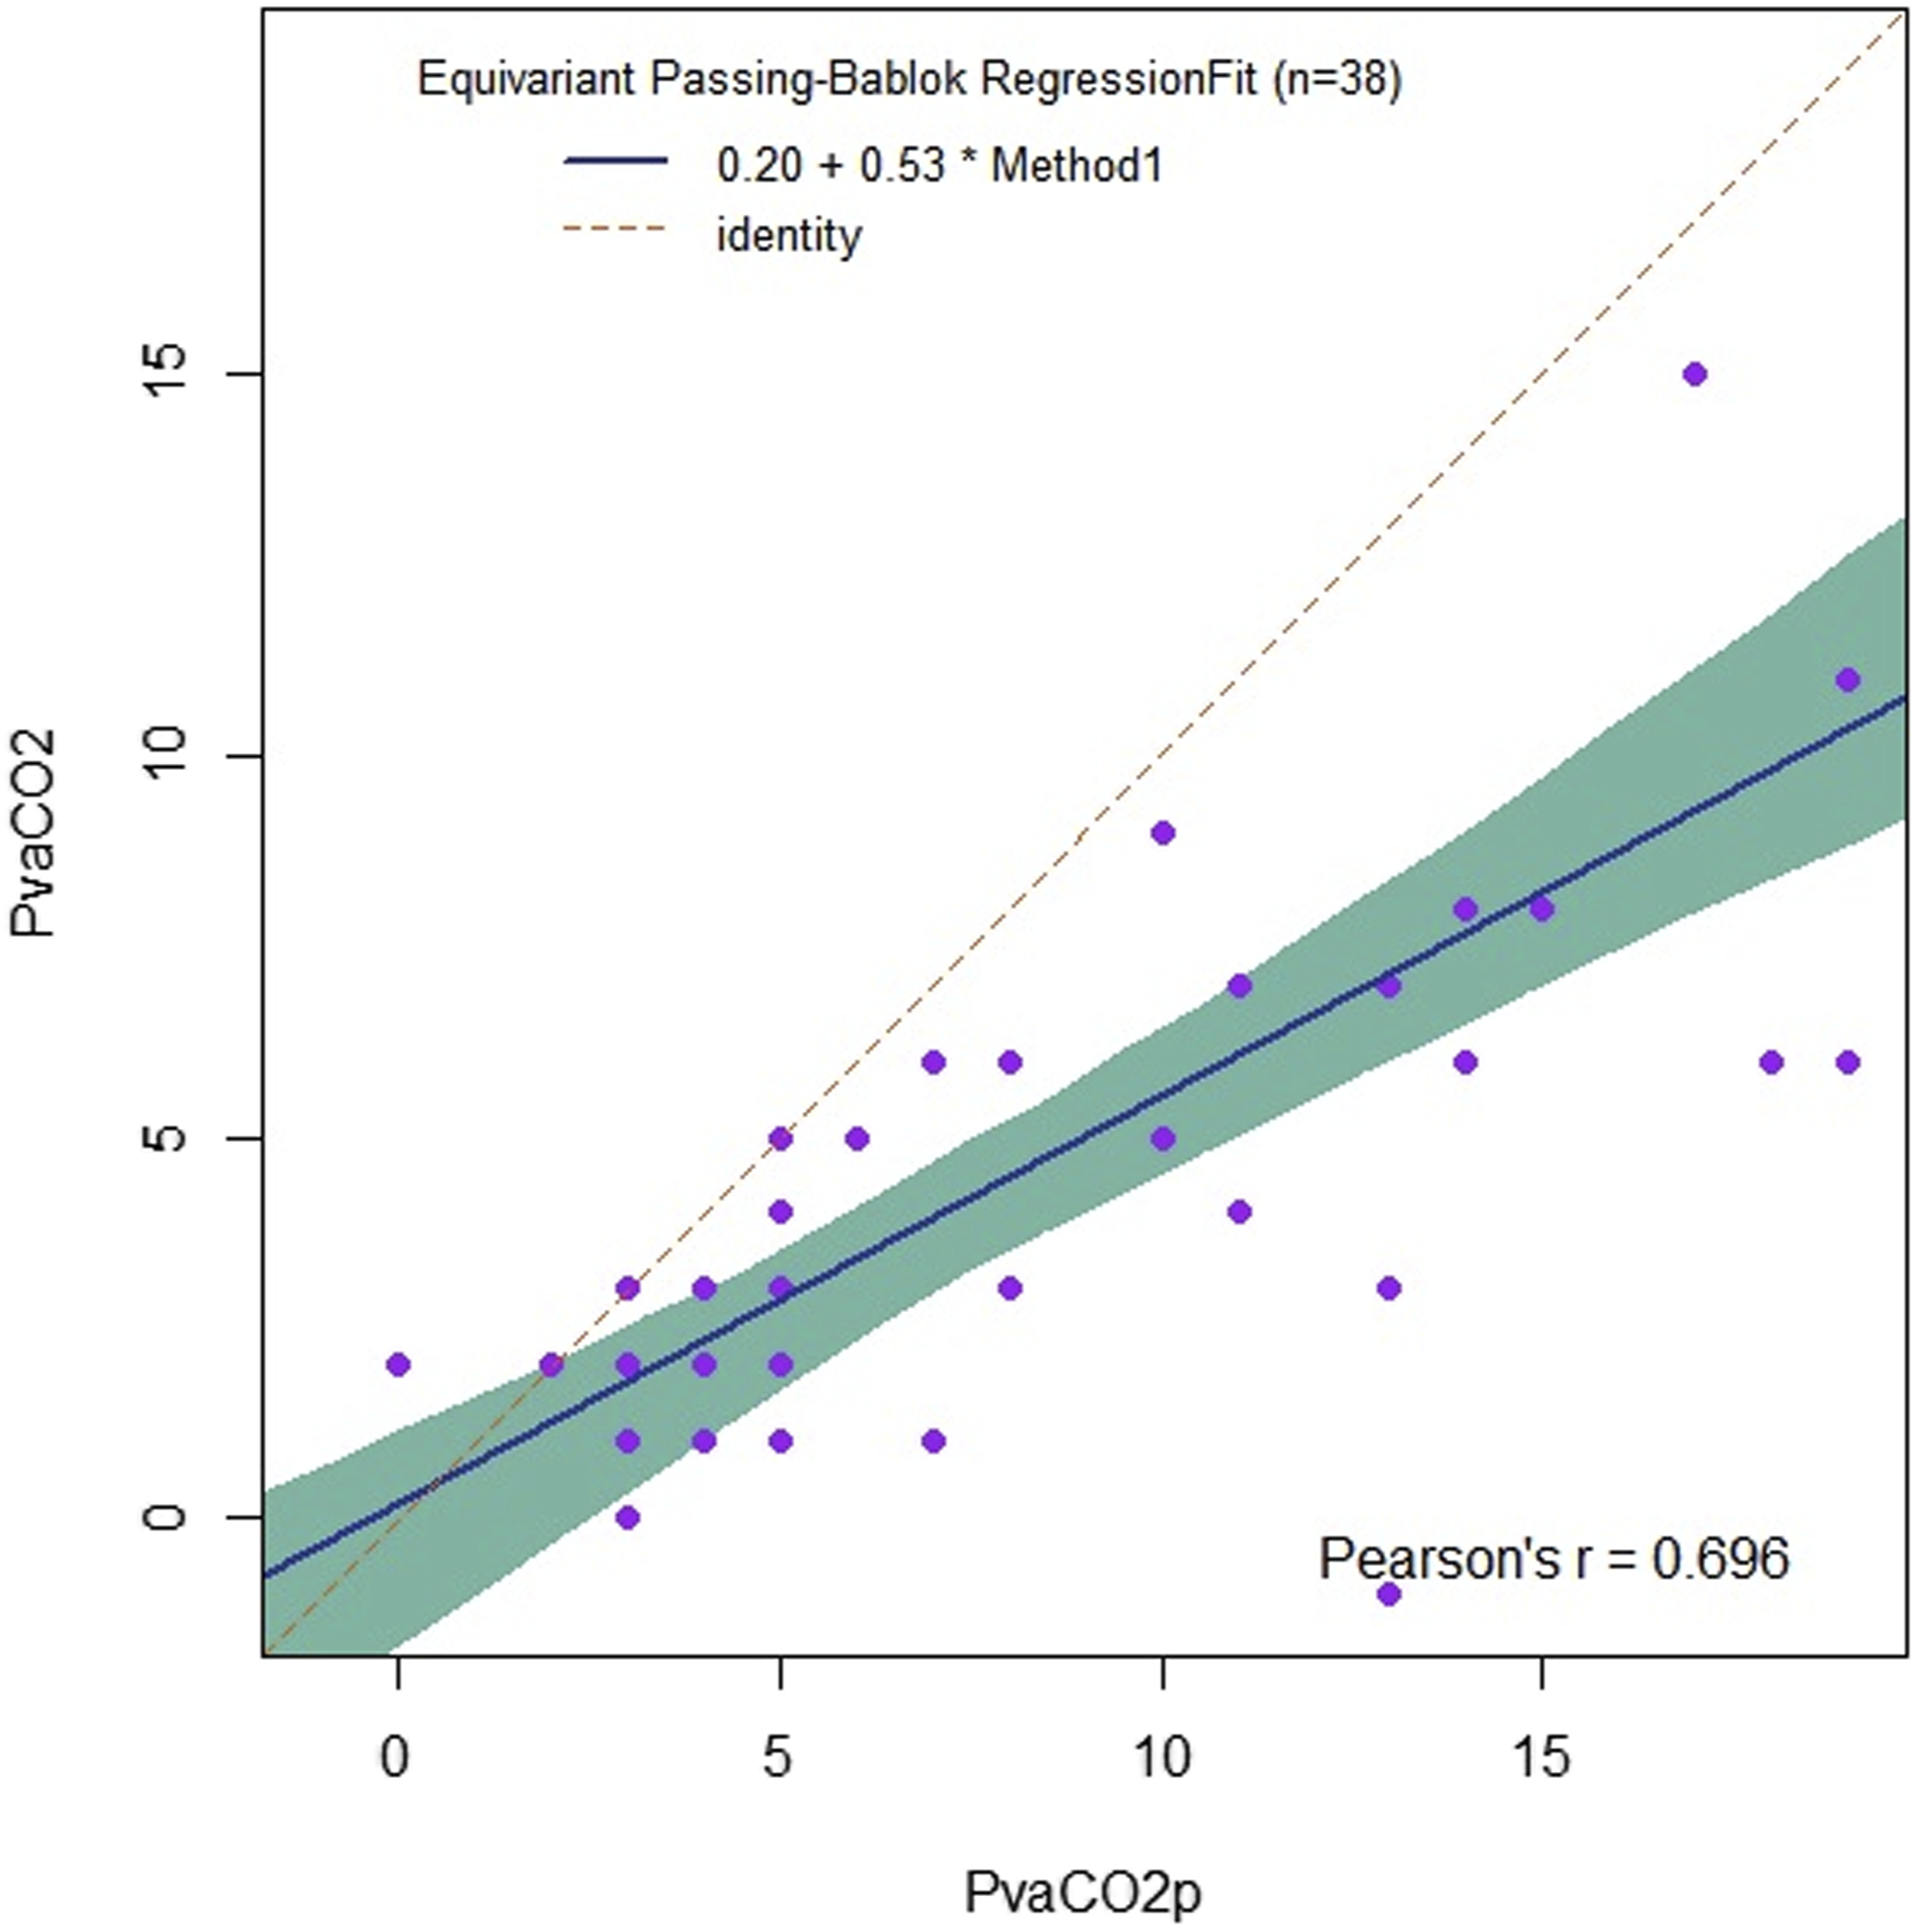
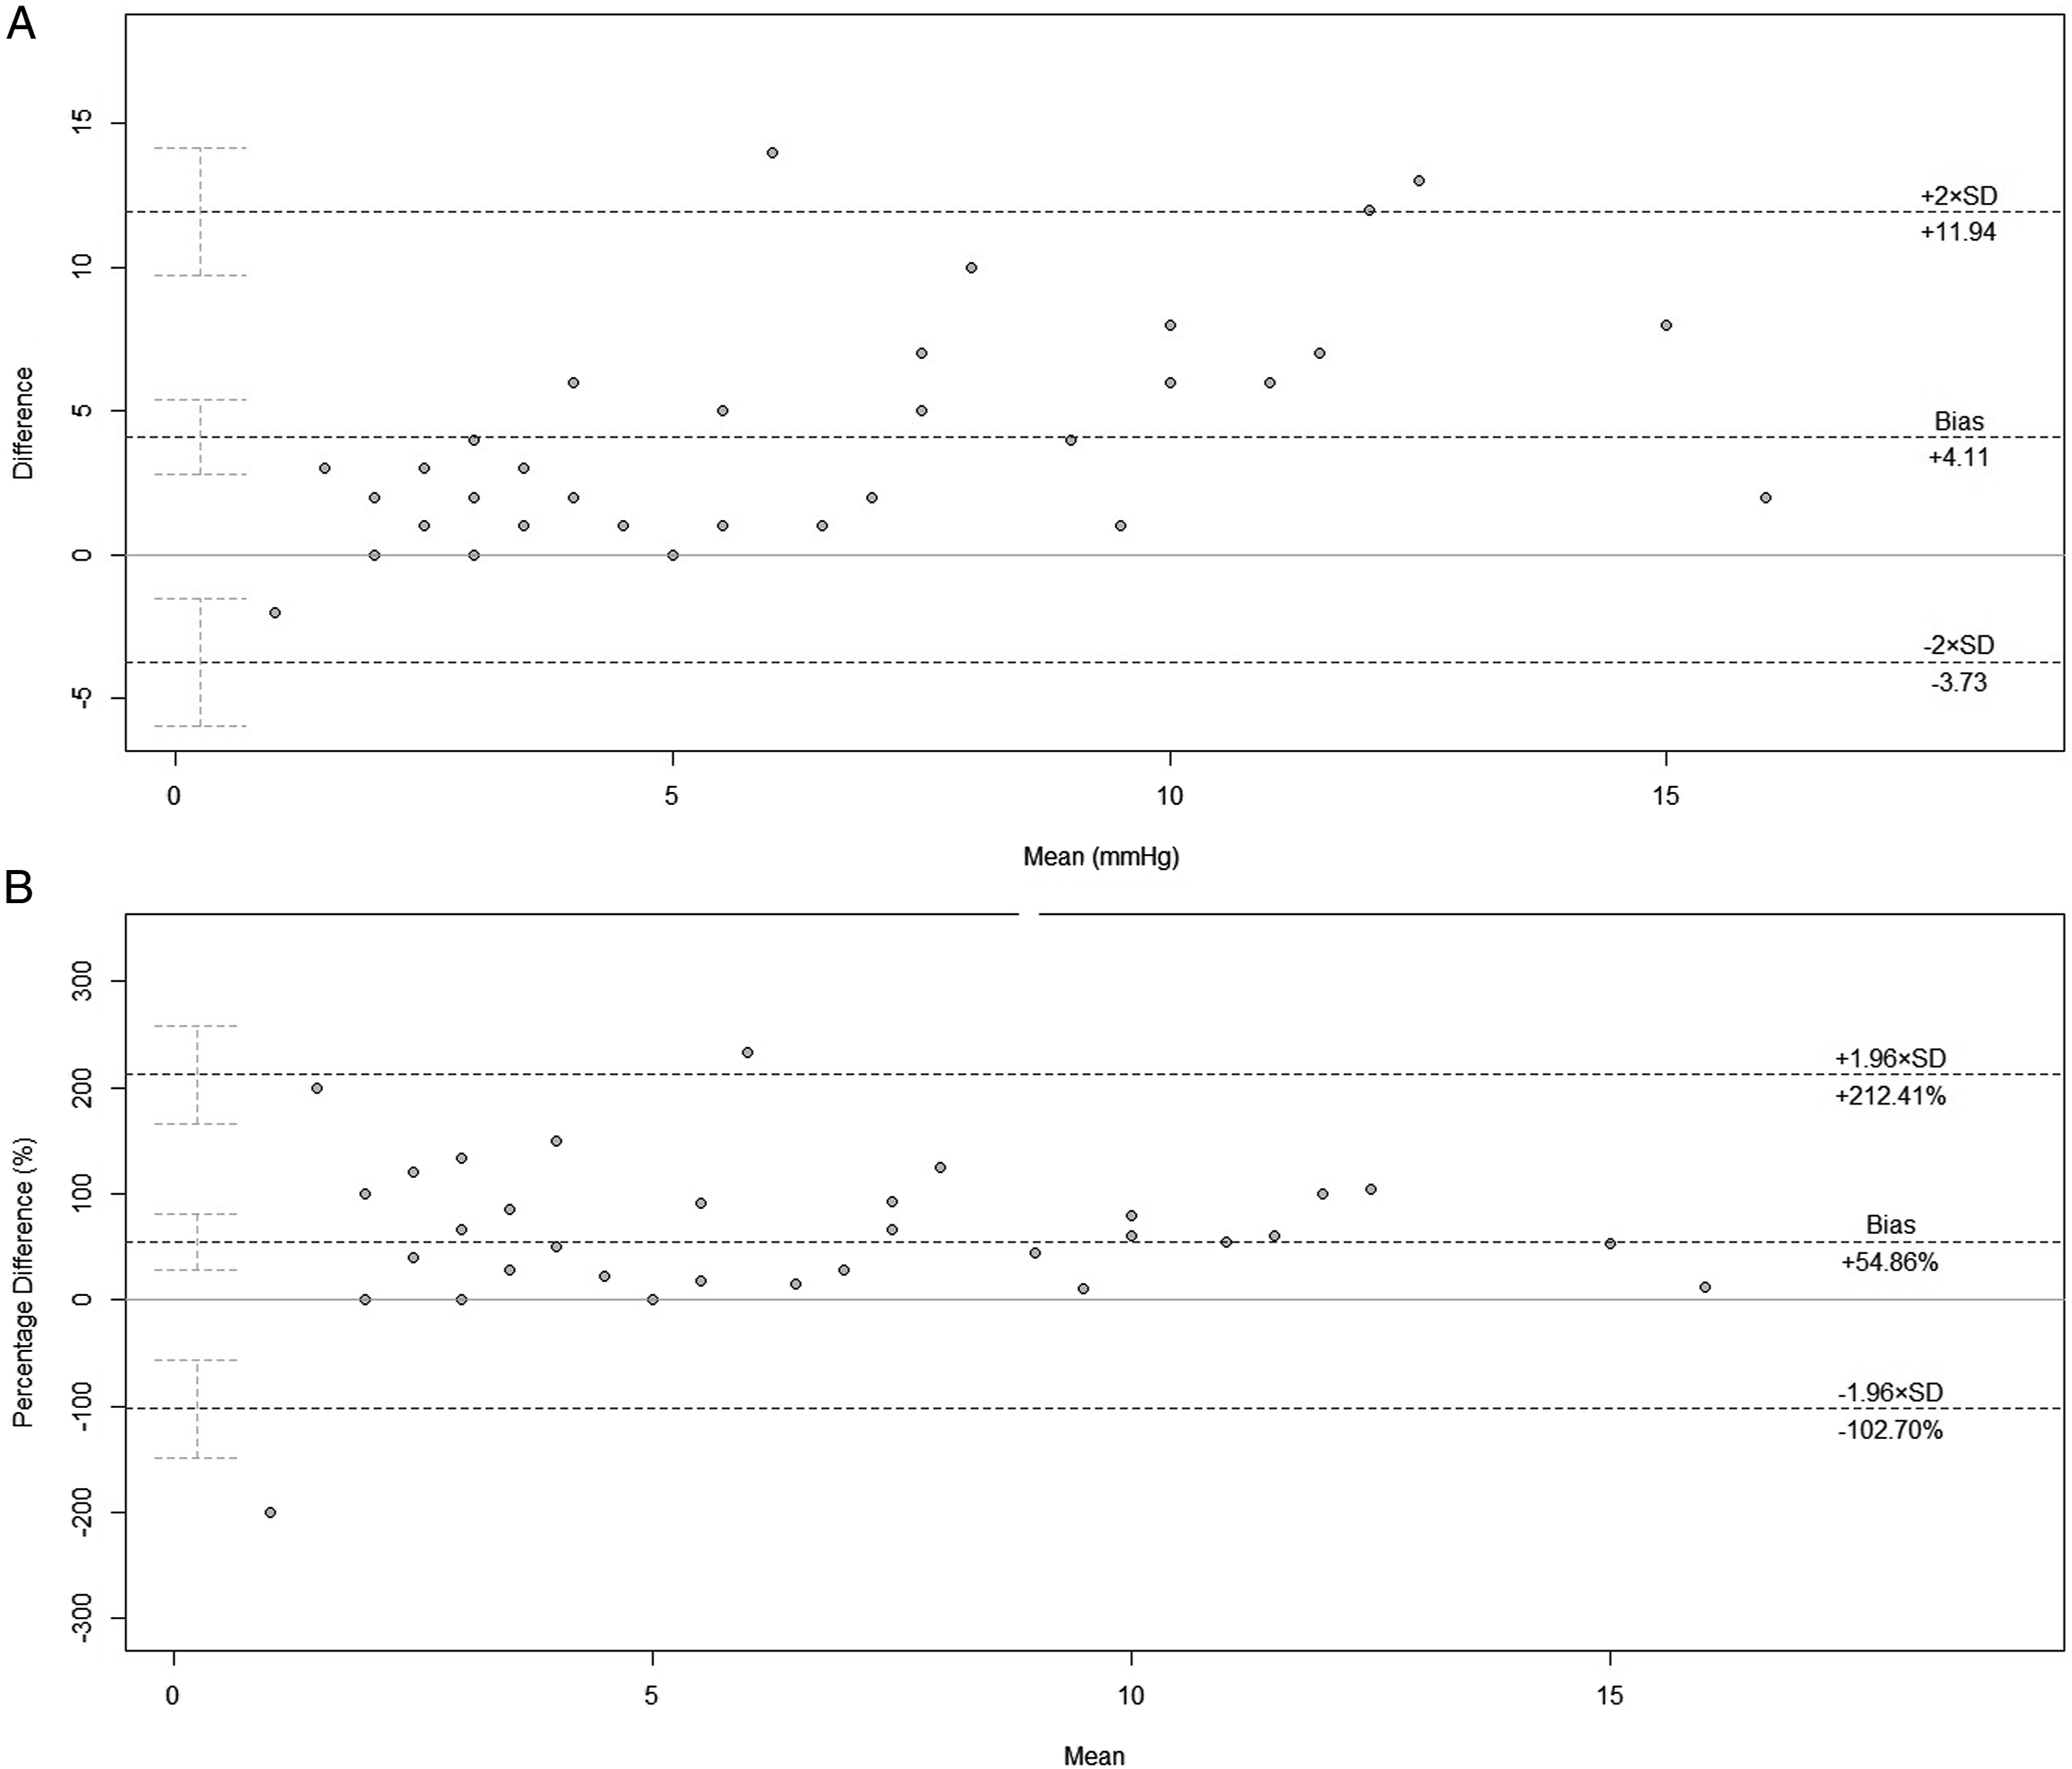
The distribution of Pv-aCO2P values in relation to Pv-aCO2 values is depicted in Figure 1. The Bravais–Pearson'r correlation coefficient between Pv-aCO2 and Pv-aCO2p was .70 (95% CI .48–.83; P-value = 1.25 x 10^-6) (Figure 2). For the Bland-Altman test, the mean bias was 4.11 mmHg (95% CI 2.82–5.39; Giavarina test = +54.86%; LoA +212.41% to −102.70%), with a lower LoA of −3.47 (95% CI −5.80 to −1.34) and a higher LoA of 11.69 (95% CI 9.55–14.01); the repeatability coefficient was 11.05 (Figure 3). Four-quadrant plot. In this plot, pairs of each difference of 2 testing values at sequential time points are plotted. The values of Pv-aCO2p are arranged on the x-axis; while the values of Pv-aCO2 with mixed venous blood are arranged on the y-axis. Several Pv-aCO2P values are high (e.g., >5 mmHg), but the corresponding Pv-aCO2 values are lower than 5 mmHg. Linear correlation plot (via equivariant Passing-Bablok regression) between Pv-aCO2p and Pv-aCO2: P-value = 1.25 x 10^-6; R^2 = .48 and adjusted R^2 = .47 (Breusch–Pagan test = 4.78, P-value = .029). The Bravais-Pearson r = .70 (95% CI .48 - .83; P-value = 1.25 x 10^-6). (A) Bland–Altman plot. The mean bias was 4.11 mmHg (95% CI 2.82–5.39), with a lower limit of agreement (LoA) of −3.47 (95% CI –5.80 to −1.34) and a higher LoA of 11.69 (95% CI 9.55–14.01); the repeatability coefficient was 11.05. (B) Giavarina plot. The plot expresses the LoAs and bias in percentage terms. The mean bias is + 54.86% (LoA +212.41% to −102.70%).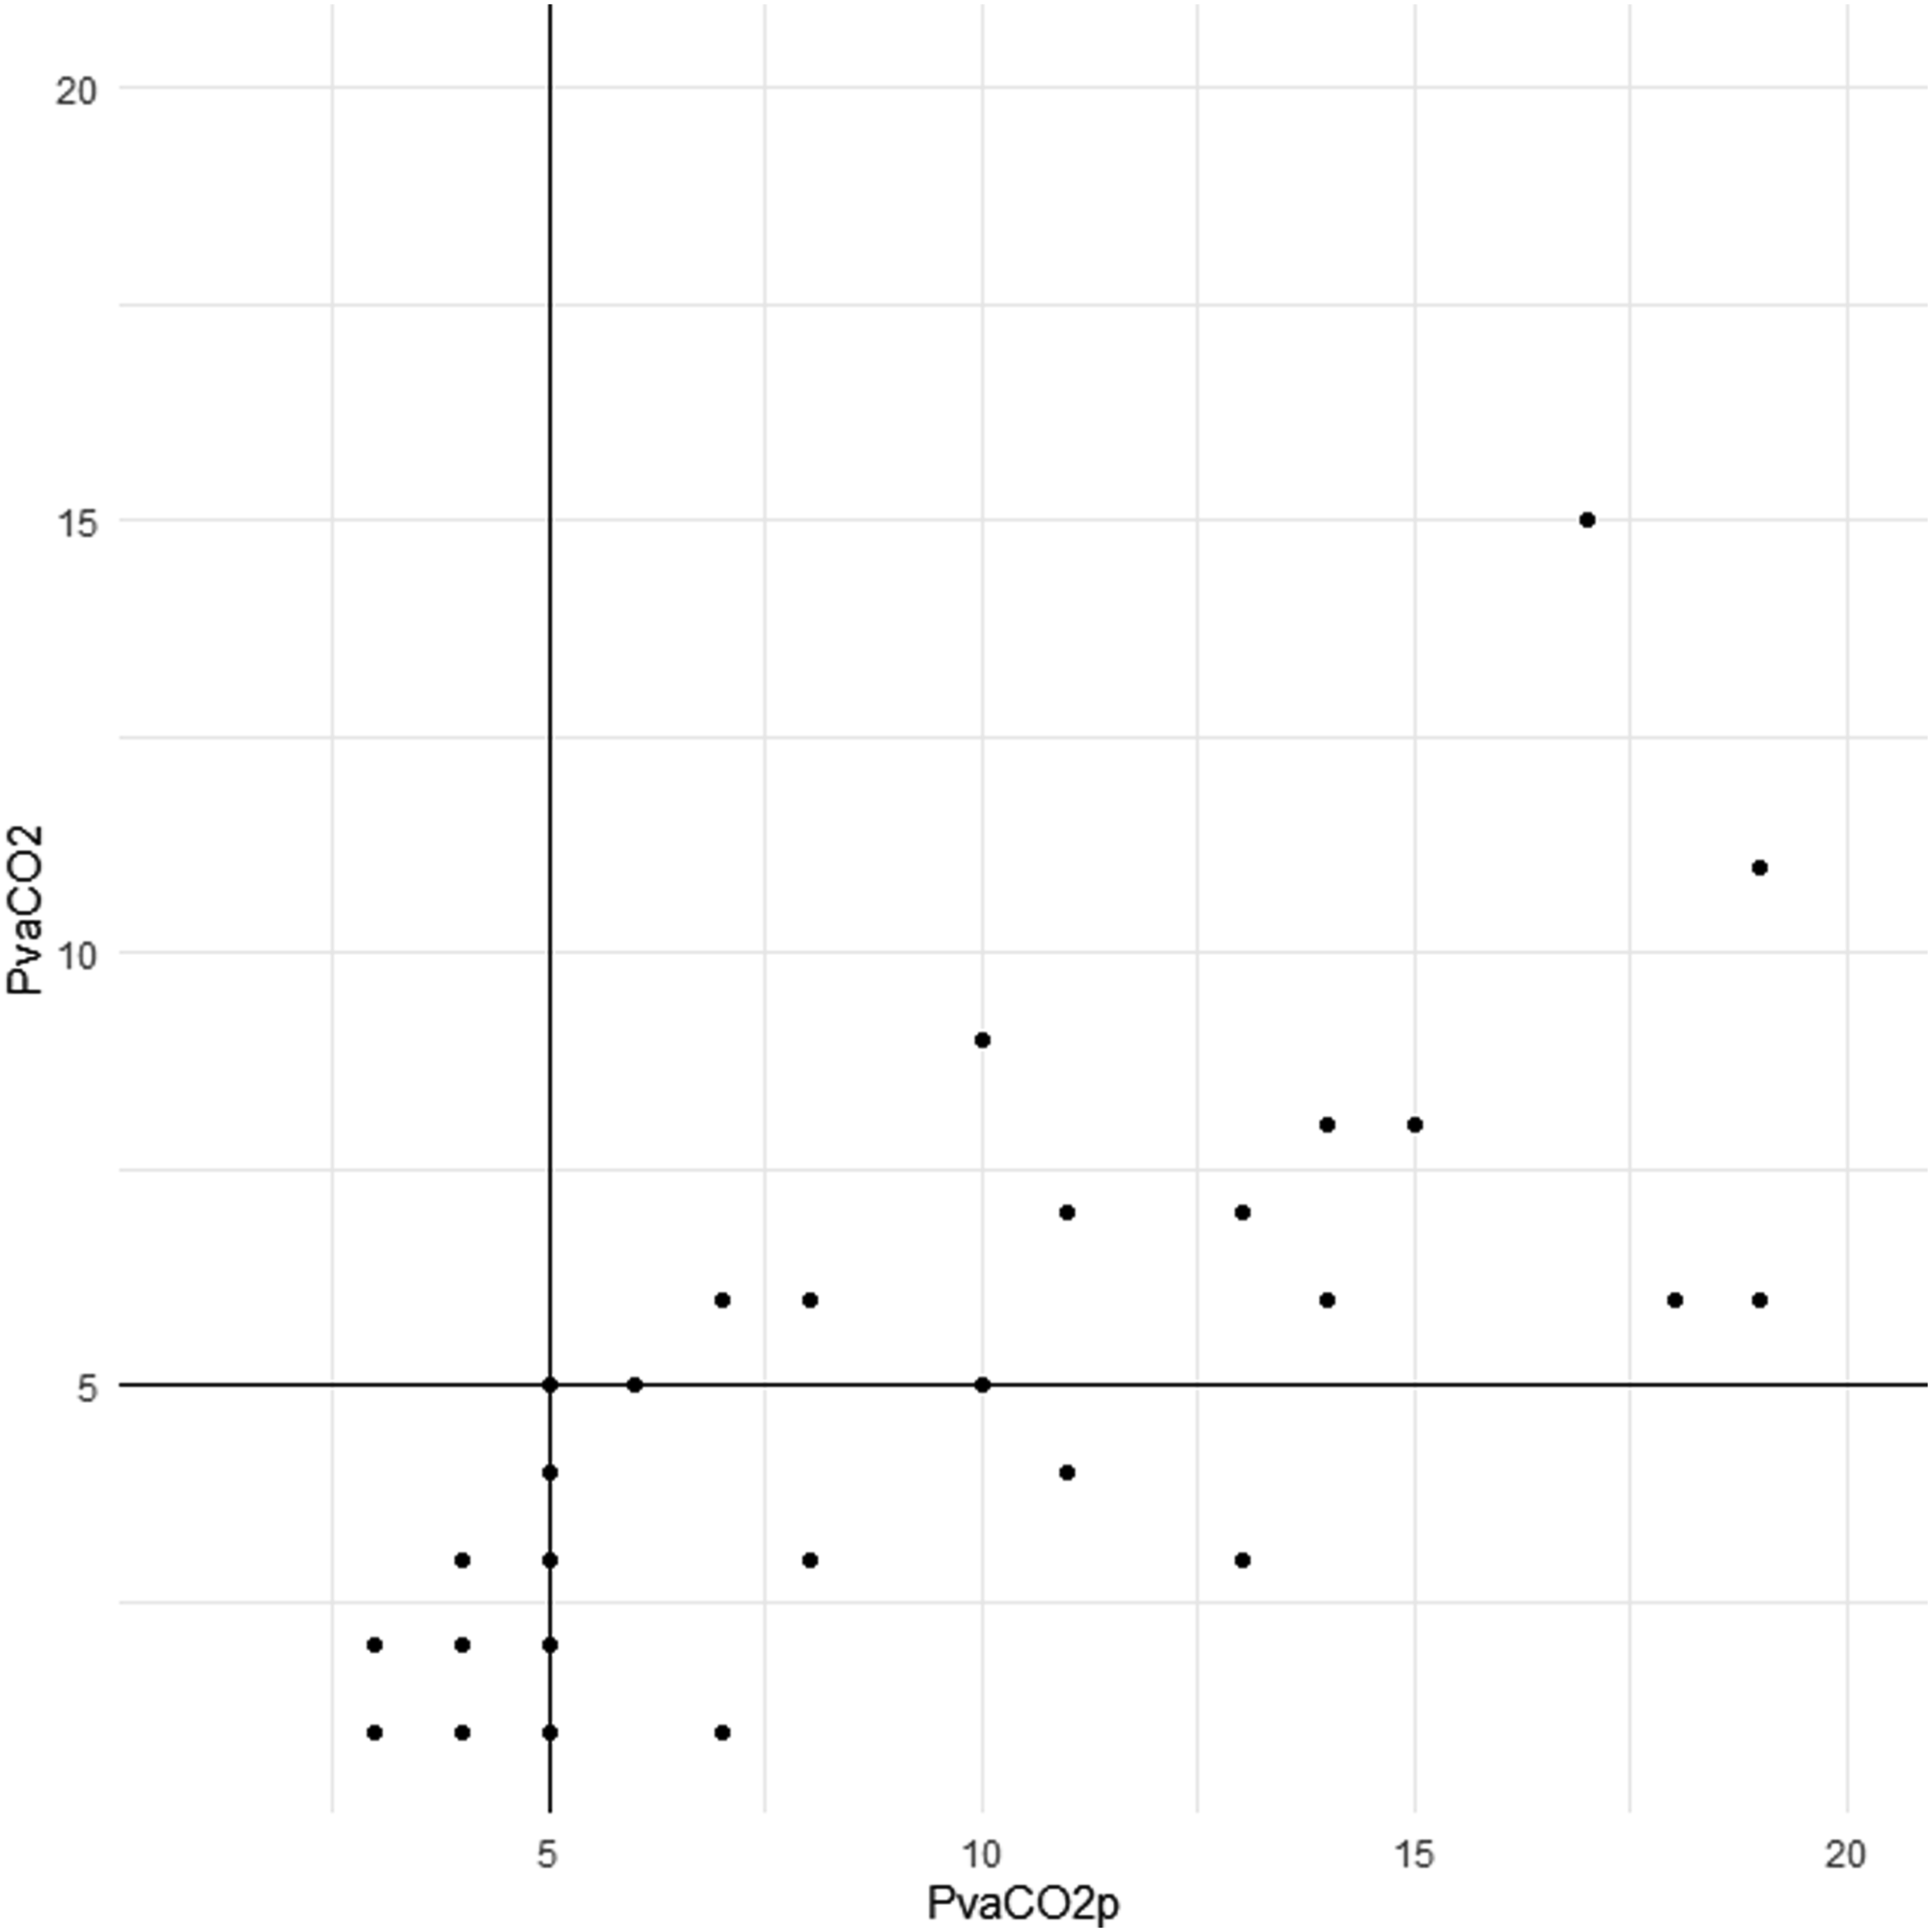
Comparing the distribution of Pv-aCO2p vs Pv-aCO2 in the polar plot demonstrated that the accuracy and precision were very high for small values. However, as the veno-arterial difference increased, the bias became greater (Figure 4). (A) Polar plot for Pv-aCO2p (Pv-aCO2 as reference). Note that for the smaller values of Pv-aCO2 both the accuracy (i.e., distance from the center) and the precision (i.e., stability in the reproduction of measurements) are very high; as the CO2 gap increases, the distance from the center of the Pv-aCO2P values also increases. (B) Polar plot for Pv-aCO2P values corrected for the bias found in the Bland–Altman test (+4.11 mmhg). Despite the bias correction, the trend in Pv-aCO2P values shows an upward trend as the CO2 gap value increases.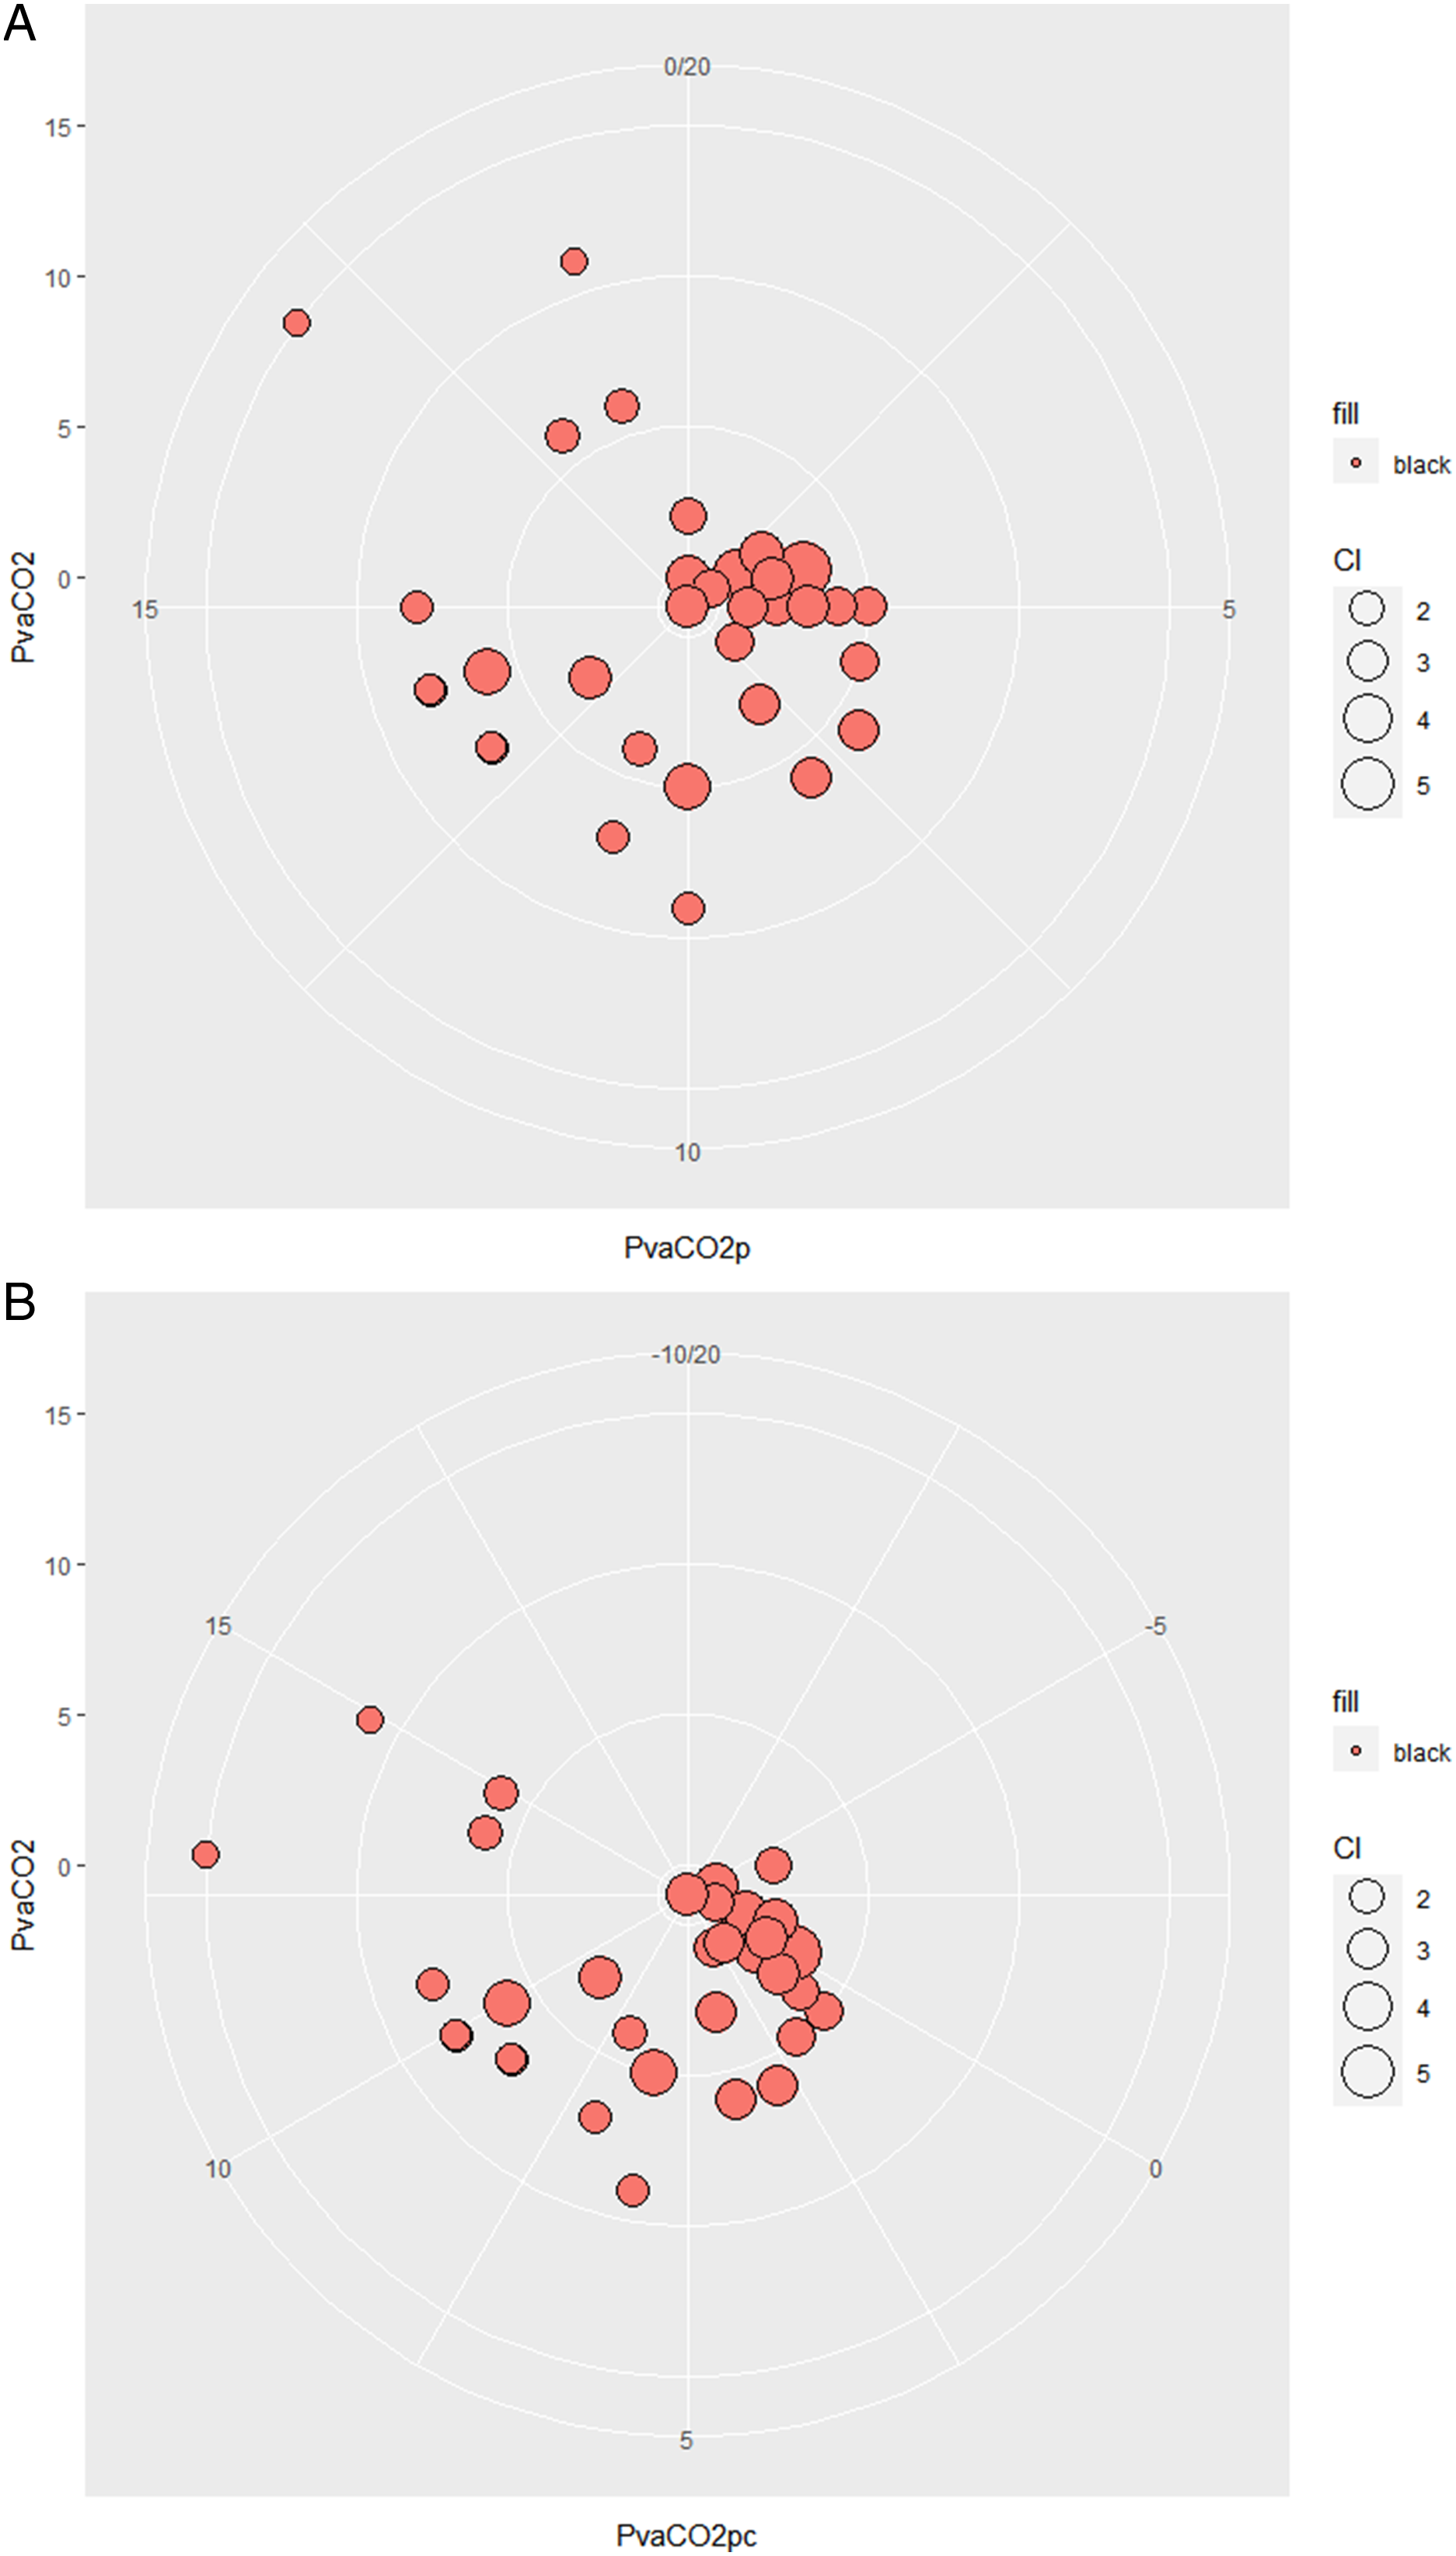
Based on the Breusch–Pagan test, the tailings distribution was not homoscedastic, so the Bland–Altman test did not completely fit. Using the Taffé method, we estimated the differential and proportional bias to be 2.81 (95% CI .52–5.11) and 1.29 (95% CI .86–1.72), respectively (Figure 5). Estimation of the differential bias and the proportional bias (2.81; 95% CI .52-5.11 and 1.29; 95% CI .86–1.72, respectively) using the Taffé method. Figure 5(A) represents the Bland–Altman plot according to Taffé's method (in blue, the regression line; dashed lines represent LoAs). Figure 5(B) shows the bias with respect to the BLUP (the red line represents the bias that shows an upward trend for gradually larger values of CO2 gap; while for small values, the bias becomes negative). Figure 5(C) illustrates the precision of the new method compared to the reference standard (Pv-aCO2p’s imprecision is greater than the reference standard, as evidenced by the trend of standard deviation of measurement errors). Figure 5(D) shows the recalibration of the new method once the proportional and differential bias has been removed (once the detected bias has been removed, the red line representing Pv-aCO2p is superimposed on the reference standard. In blue, the trend of Pv-aCO2 is not corrected for any bias).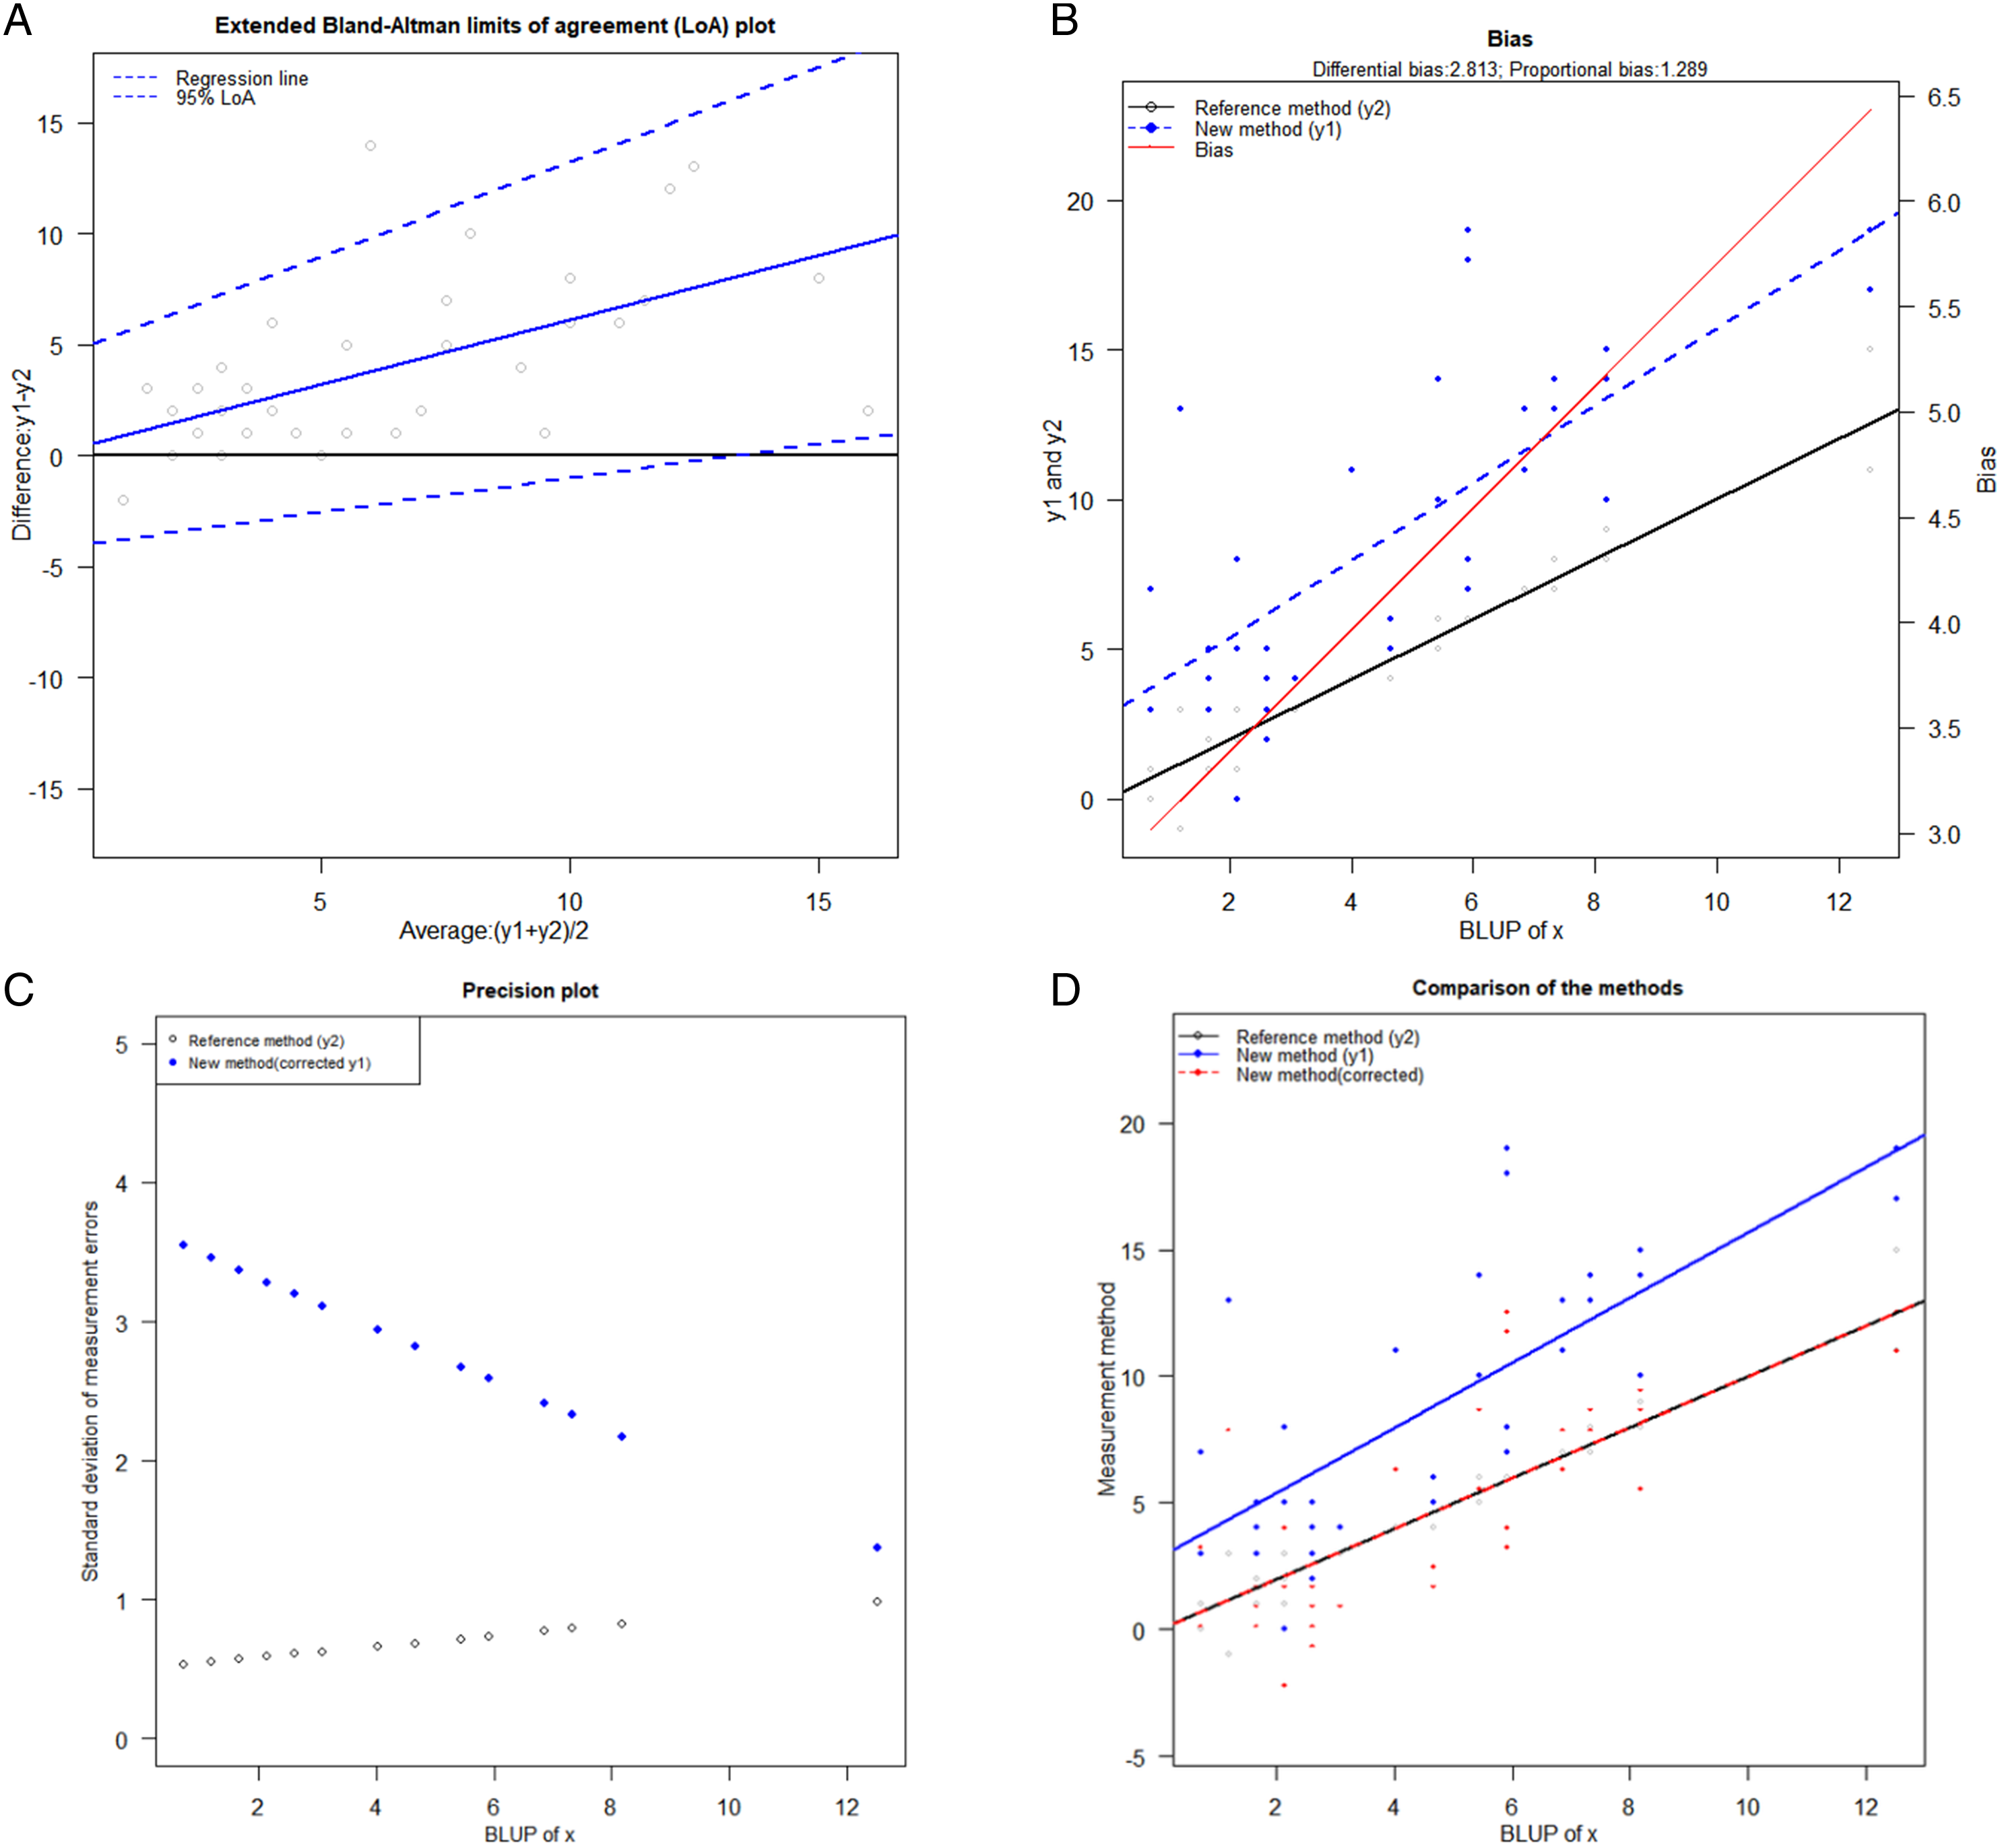
Regarding the correlation between CI and Pv-aCO2, the Pearson’s r coefficient was −.52 (95% CI –.72 to −.24; P-value .0009; BP test = .45; P-value = .500), while for the correlation between CI and Pv-aCO2p, Pearson’s r coefficient was −.49 (95% CI –.70 to −.21; P-value = .002; BP = .90; P-value = .344) (Figure 6). For the correlation between CI and SvO2, Pearson’s r coefficient was .37 (95% CI: .06–.62; P-value = .021; BP test = .49, P-value = .482) (Figure 6). No statistically significant correlation was observed between Pv-aCO2 and SvO2 or lactate or between Pv-aCO2p, SvO2, and lactate. Figure 6(A) Correlation between cardiac index (CI) and Pv-aCO2. The x-axis shows the values of Pv-aCO2, while the y-axis shows the values of the CI. The graph displays the regression line (in blue), smooth non-parametric regression (blue dashed line), and smoothed conditional spread (light blue area). Pearson's r = −.52: 95% CI –.72 to −.24; P-value .0009; BP test = .45; P-value = .500. Figure 6(B)) Correlation between CI and Pv-aCO2p. Pearson’s r = −.49; 95% CI –.70 to −.21; P-value = .002; BP = .90; P-value = .344. Figure 6(C)) Correlation between CI and SvO2. Pearson’s r = .37; 95% CI: .06–.62; P-value = .021; BP test = .49, P-value = .482.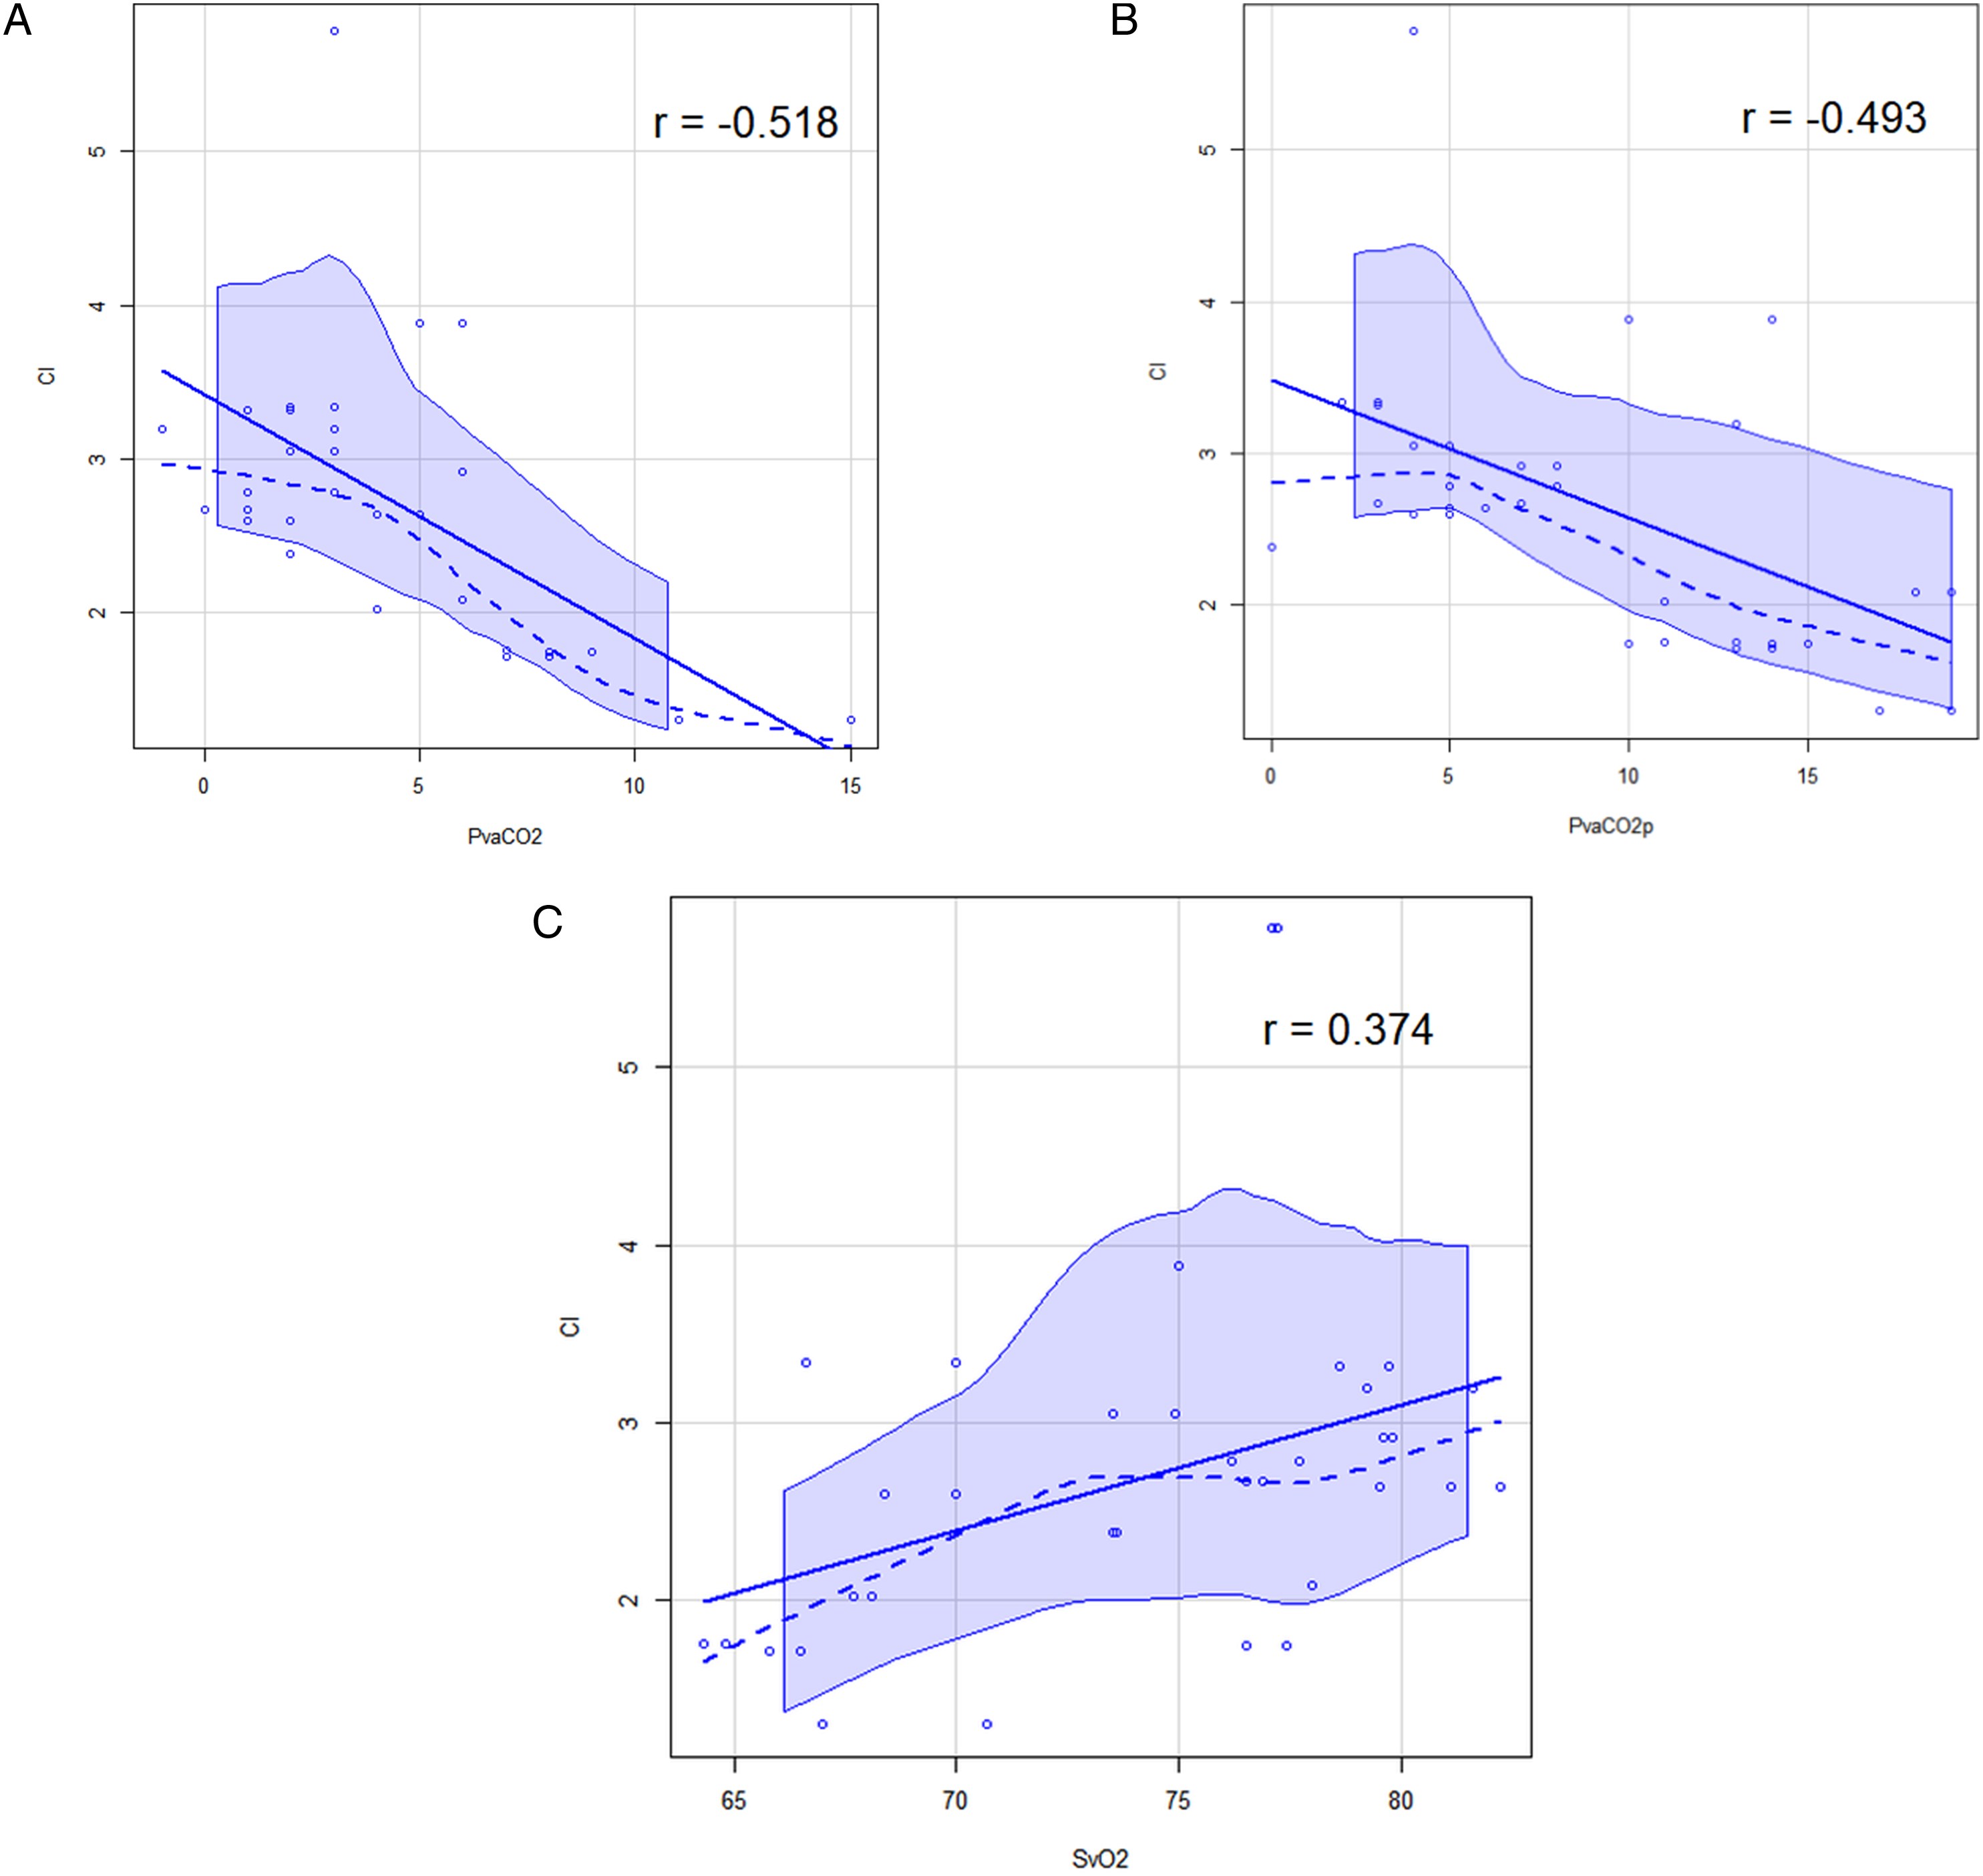
Discussion
Our study demonstrated a linear relationship between Pv-aCO2 measured with peripheral venous blood and Pv-aCO2 measured with mixed venous blood. This correlation was high (about 70%). The significance of this finding lies in the possibility of using Pv-aCO2p as a conventional Pv-aCO2 substitute, although the 2 values are not interchangeable. If confirmed in larger populations, this finding could result in a less invasive, but still individualized, approach to the septic patient. In fact, Pv-aCO2 is determined by cardiac output (in a relationship that is inversely proportional) and metabolic status, and it has been taken as an indicator of the adequacy of venous blood flow in removing CO2 produced by peripheral tissues. Bakker et al. demonstrated that a net decrease in cardiac output is consistent with CO2 gap values that exceed 6 mmHg. 4 Ospina-Tascón et al. demonstrated that mortality in patients with septic shock increases exponentially above this value. 13 Al Duhailib et al. summarizing the results of 21 studies (2155 patients) in a meta-analysis, found that a Pv-aCO2 greater than 6 mmHg is a predictor of mortality in the ICU (OR 2.22; 95% CI 1.30–3.82). 14
Several clinical environments deal with the treatment of septic patients, at least in the early stages of the syndrome, such as pre-hospital medicine, emergency medicine, and hospital medicine. In these settings, it may be challenging to have a central venous line. Early preliminary estimates of the CO2 gap could lead to an earlier use of inotropic drugs (the administration of which has been shown to be safe through peripheral venous accesses). 15
To our knowledge, only one other study in the literature has evaluated the relationship between standard Pv-aCO2 and Pv-aCO2p. Gao et al showed a correlation that was significantly higher than ours (90% vs 70%) in a larger population than in our study. 16 In addition, compared to conventional Pv-aCO2, we found that the trend of Pv-aCO2p shows a progressive increase for high veno-arterial difference values. This finding could be due to the local blood circulation via, for example, the phenomena of stagnant hypoxia in a condition of systemic inadequacy of blood circulation.17,18
To apply this measure in clinical practice, it is crucial to evaluate the agreement between the 2 values.
Our analysis showed that the agreement between Pv-aCO2p and conventional Pv-aCO2 was fairly good, but the bias was about +55%. The bias showed a gradual increase in high Pv-aCO2 values in an upward trend (as highlighted by the differential bias of +2.81 and a proportional bias of +1.29). This means that the determination of Pv-aCO2 with peripheral venous blood tends to overestimate the actual CO2 gap. Pv-aCO2p may be able to detect a high CO2 gap but unable to exclude a condition causing an increased CO2 gap.
The use of Pv-aCO2 reported in literature so far, has been dichotomous: on the basis of the studies carried out it has been found that a value of 6 mmHg offers a sufficiently precise discrimination between patients in septic shock with a preserved or insufficient cardiac output. Gao et al. found that this cut-off value has a sensitivity of 86% and a specificity of 67% for a cardiac index value lower than 2.2 L/(min x m^2). 19 Therefore, for the “dichotomous” and not quantitative use of Pv-aCO2, the considerable divergence between Pv-aCOp and conventional mixed venous blood-derived Pv-aCO2 at high values, may not affect clinical applicability. As long as a corresponding cutoff value is found (which from the results of our study could be around 10 mmHg), the significance of an increased Pv-aCO2 (even when determined with peripheral blood) could be similar to the current conventional determination and indicate a condition of inadequate blood circulation (and reduced cardiac output).
However, the correlation we found is limited to patients in septic shock, receiving invasive mechanical ventilation, and within the first 24 hours of admission to the ICU (and therefore with an established diagnosis of overt hemodynamic shock). A study conducted by Shastri et al. in an animal model in which hyper- and hypoventilation conditions were produced found that during hyperventilation, Pv-aCO2 increased rapidly, while conversely, during hypoventilation, Pv-aCO2 decreased. 20 The rapid variation in PaCO2 during changing respiratory rates led to this finding. The authors suggest that the Pv-aCO2 values and the prognostic significance of this variable could be affected by changes in the ventilator settings.
Therefore, the Pv-aCO2 can be influenced by several factors, such as ventilator settings, the use of inotropic or vasopressor drugs, and local blood circulation conditions. For instance, Ospina-Tascòn et al, in a clinical study of 60 patients admitted to the ICU, found a poor correlation (r^2 = .08–.22) between Pv-aCO2 and cardiac index. 21 The correlation between cardiac output and Pv-aCO2 is greater for low blood flow conditions, and consequently for increased venous-arterial difference. However, as cardiac output increases, other factors may come into play, such as increased tissue metabolism induced by a condition of systemic inflammatory response syndrome (i.e., SIRS), which could influence the microcirculation and the tissue oxygen extraction capability.17,18
Limitations
The purpose of our study was to identify a linear relationship between Pv-aCO2 and Pv-aCO2p. It is difficult to establish how the different doses of inotropic drugs or sedatives may have influenced our results.
Despite taking all the measurements and samples in a short amount of time, we cannot predict how any temporal differences within this period may have altered the data obtained. Moreover, 3 patients were treated with CRRT techniques. Determining the extent to which this can reduce highly diffusible CO2 through dialytic membranes is difficult. In addition, the cardiac index was determined by thermodilution instead of Fick's equation. Although this may limit secondary analyses, it does not affect the primary aim.
Furthermore, we are unable to determine how procedural difficulties during the withdrawal of peripheral blood (and the different duration of tourniquet time) may have affected the obtained data.
Despite being adequate for estimating the agreement, we performed repeated measurements on the same subjects. This methodological strategy—although in accordance with Taffé method for assessing differential and proportional bias as regards the agreement—may cause secondary results to be insufficiently reliable, and may also have led to overestimation of the degree of correlation between measures.
Our study is limited to pre-clinical purposes. The clinical applications of the results obtained should be validated through specific clinical studies.
Conclusion
There was linear correlation between Pv-aCO2p and Pv-aCO2 in mechanically ventilated patients with septic shock. Further controlled clinical trials should be performed to investigate whether Pv-aCO2p could be used in larger clinical environments than intensive care alone to determine if cardiac output meets the metabolic needs of tissue in the early stages of sepsis.
Supplemental Material
Supplemental Material - Correlation and Agreement Between the CO2 Gap Obtained From Peripheral Venous Blood and From Mixed Venous Blood in Mechanically Ventilated Septic Patients
Supplemental Material for Correlation and Agreement Between the CO2 Gap Obtained From Peripheral Venous Blood and From Mixed Venous Blood in Mechanically Ventilated Septic Patients by Daniele Orso, Chiara Molinari, Giacomo Bacchetti, Victor Zanini, Valentina Montanar, Roberto Copetti, Nicola Guglielmo, and Tiziana Bove in Seminars in Cardiothoracic and Vascular Anesthesia
Footnotes
Acknowledgements
The authors would like to express their gratitude to all residents who have contributed to the completion of this study. All the nursing staff are credited with making this study possible. Artificial intelligence (like ChatGPT or any other chatbot) was not used to generate any part of this paper.
Author Contributions
DO designed the study, performed the statistical analysis, wrote the first draft, and supervised the final draft; CM, GB, VZ, and VM collected the data; RC, NG, and TB supervised the final draft. All authors revised and approved the final draft.
Declaration of Conflicting Interests
The author(s) declared no potential conflicts of interest with respect to the research, authorship, and/or publication of this article.
Funding
The author(s) received no financial support for the research, authorship, and/or publication of this article.
Ethical Statement
Supplemental Material
Supplemental material for this article is available online
References
Supplementary Material
Please find the following supplemental material available below.
For Open Access articles published under a Creative Commons License, all supplemental material carries the same license as the article it is associated with.
For non-Open Access articles published, all supplemental material carries a non-exclusive license, and permission requests for re-use of supplemental material or any part of supplemental material shall be sent directly to the copyright owner as specified in the copyright notice associated with the article.