
Abstract
Zebrafish (Danio rerio) is an important vertebrate model organism in biomedical research, especially suitable for morphological screening due to its transparent body during early development. Deep learning has emerged as a dominant paradigm for data analysis and found a number of applications in computer vision and image analysis. Here we demonstrate the potential of a deep learning approach for accurate high-throughput classification of whole-body zebrafish deformations in multifish microwell plates. Deep learning uses the raw image data as an input, without the need of expert knowledge for feature design or optimization of the segmentation parameters. We trained the deep learning classifier on as few as 84 images (before data augmentation) and achieved a classification accuracy of 92.8% on an unseen test data set that is comparable to the previous state of the art (95%) based on user-specified segmentation and deformation metrics. Ablation studies by digitally removing whole fish or parts of the fish from the images revealed that the classifier learned discriminative features from the image foreground, and we observed that the deformations of the head region, rather than the visually apparent bent tail, were more important for good classification performance.
Introduction
Zebrafish (Danio rerio) is a freshwater fish and an important vertebrate model organism for biomedical research due to factors such as their transparency at birth (enabling observation of the development of their internal organs under brightfield microscopy), their rapid development (i.e., developing as much in a day as a human embryo develops in 1 month), and short generation times. 1 Zebrafish, a vertebrate, has major organs and tissues similar to those in humans. In addition, 70% of human genes have at least one obvious zebrafish orthologue, and its full genome was sequenced in 2013. 2 Furthermore, zebrafish are cheaper to maintain than mice, and human disease models have been for many different fields of research such as cancer and neurobiology.3,4
The recent development of more precise and predictable genome editing with the CRISPR/Cas9 techniques5,6 has moved the bottleneck in high-throughput zebrafish screening from molecular manipulation to analysis of the resulting phenotype and morphology. Zebrafish morphology can be imaged by advanced 3D techniques in relatively high throughput,7,8 but more commonly, zebrafish are placed in multiwell plates and imaged in 2D, with multiple fish in each well to increase the statistical value of the screen while limiting the use of valuable chemical libraries.
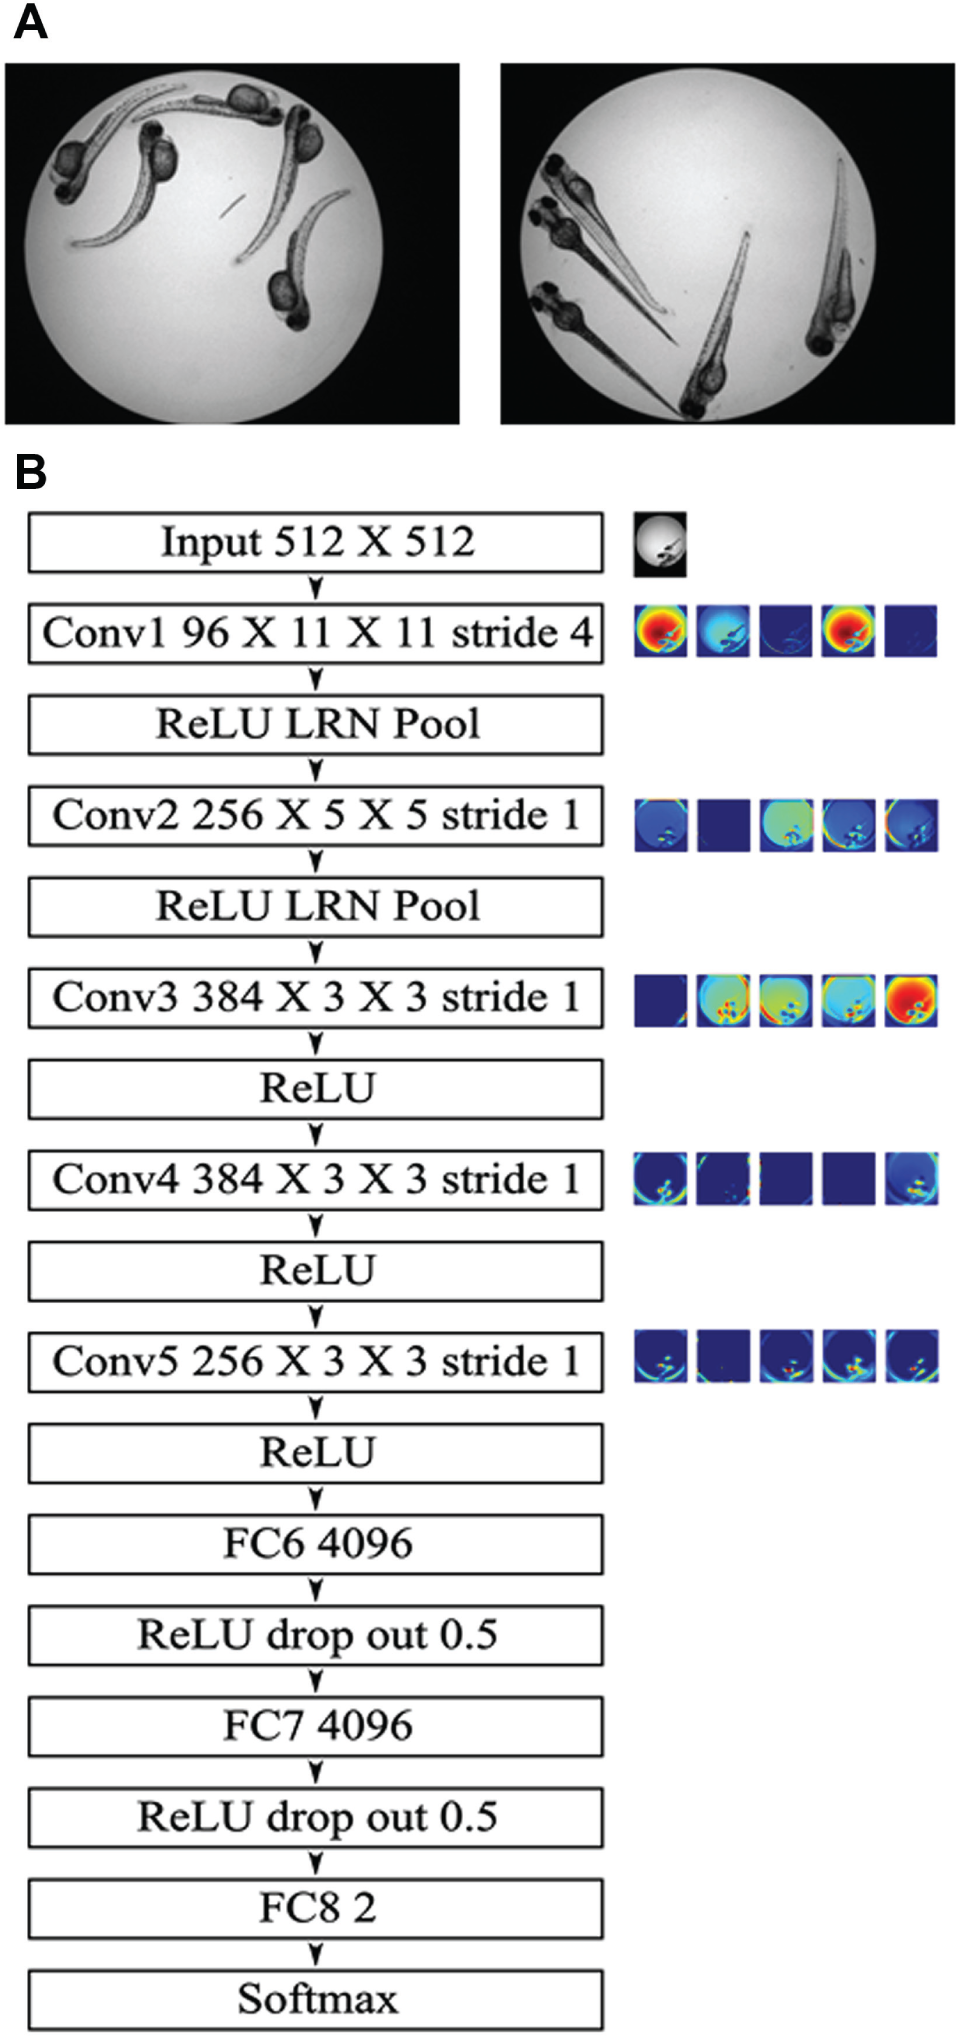
In this study, we focus on the analysis of zebrafish deformation due to drug-induced neuronal damage in response to camptothecin, a chemical compound known for inhibiting certain DNA enzymes, thus impeding DNA repair. 9 The resulting effect appears as a shape deformation of the zebrafish, as shown in Figure 1A . The task of image-based quantification of the deformation of individual zebrafish, as well as its subsequent use for classifying entire wells as containing fish either responding or not responding to treatment, is confounded by the varying orientations of the zebrafish embryos and the presence of multiple (sometimes overlapping) fish in each well. Our previous method for analysis of overlapping fish in multifish wells used zebrafish tail curvature as a metric for deformation 10 and employed a complex image analysis pipeline comprising steps such as noise reduction, illumination correction, foreground segmentation, branch-free skeletonization, zebrafish tail identification, fusion of disjoint tail sections, tail curvature estimation, feature generation, and finally classification of wells as containing treated or untreated fish by classification through a support vector machine (SVM). In other words, design of the analysis pipeline required expert knowledge in digital image processing and analysis.
(
In this work, we address the problem of classification of morphological changes in zebrafish, residing in multifish wells containing overlapping fish, through a deep learning approach. Deep learning is a data-driven method where the training of both the discriminative features and the classifier takes place simultaneously 11 (i.e., representation learning). Deep convolutional neural networks have previously been shown to be successful for binary classification of cultured cells in a screening setting. 12 However, the presented classification of cells relies on accurate segmentation of individual cells prior to feature extraction based on deep learning. Here we present an end-to-end deep learning solution where all steps of the analysis, including the detection of individual objects, are performed by the deep network. This means that the user input is limited to selecting training samples; no additional a priori information is needed. We show that instead of employing a user-specified metric of zebrafish deformation (e.g., tail curvature in Ishaq et al. 10 ), the deep learning approach automatically selects the most relevant features for the binary classification problem. Moreover, the use of end-to-end deep learning solutions can eliminate the need to handcraft traditional image-processing pipelines and significantly reduce the need to perform preprocessing steps, thus minimizing the need for extensive expert input. More specifically, for the presented deep network, the preprocessing was restricted to data augmentation (to increase the number of training samples) by simple operations such as image rotations and horizontal flips/inversions. Furthermore, we performed ablation/saliency experiments to show that the performance of the deep network is due to it actually learning features from the fish (i.e., from the foreground), rather than it being affected by the image background or debris in the well.
Materials and Methods
Image Data
The image data consist of two independent data sets acquired through brightfield microscopy imaging of 96-well plates with typically five zebrafish per well, image 3 days postfertilization. In the first data set, 24 wells contained no drug (untreated; i.e., negative control). The remaining groups of 19 and 24 wells were treated with 100-nM and 200-nM camptothecin, respectively. The second data set comprised 36 untreated wells and 36 wells treated with 100 nM camptothecin. Images representing fish treated with 100-nM and 200-nM camptothecin across the two data sets were combined to yield a single cohort comprising 79 images of treated fish. Similarly, images representing untreated fish across the two data sets were combined to yield a unified control cohort of 60 images representing untreated fish. Fish in all wells were handled the same way, apart from the exposure to camptothecin. Any deformations by other environmental factors should affect all fish in a similar way and not influence the deep learning approach. Subsequently, the images were randomly partitioned into training, validation, and test image sets, using a 5-fold partitioning scheme as described below, while ensuring that the ratio of treated to untreated wells was kept the same for each partition. Two sample images of treated and untreated fish are shown in Figure 1A .
Data Partitioning and Augmentation
Typically, most machine learning methods benefit from availability of large training data sets. We employed data augmentation and sampling to generate more data for the purpose of training the deep network. We used a 5-fold validation scheme where the input images were randomly selected, without replacement, and partitioned into five data blocks. The ratio of the number of treated wells to untreated wells was kept the same in each block. At any time, three of the blocks were used for training, one block was used as a validation set for selecting the hyperparameters of the deep network, and the final block was used for testing purposes. This process was repeated five times, thus ensuring that each data partition was used for testing exactly one time. We also used data augmentation to generate more data for our validation data blocks, while no augmentation was done for the test data blocks. We created a fully automated script to rotate each image through clockwise rotations of 90, 180, and 270 degrees. Then, the same image was flipped horizontally and again rotated through 90, 180, and 270 degrees, thus resulting in eight times as much data as before. The script is provided as part of the online supplementary material. The augmentation takes place separately for each partition, thus ensuring that the training set is separate from validation and test sets. Apart from increasing the number of images in the training set, the augmentation also infers to the system that image orientation is noninformative (as compared with, e.g., images of natural scenes).
Deep Network
We chose a well-known deep neural network architecture, known as AlexNet, for classification. 13 The choice was motivated by multiple factors: (1) AlexNet has been widely used and evaluated in the deep learning community, yielding generally impressive results, and (2) the network is relatively less deep and less complex than other contemporary architectures such as the GoogLeNet, 14 thereby making the network convergence computationally more tractable. The structure of the AlexNet follows a classic convolution architecture that comprises five successive convolution layers of filters with sizes 11 × 11, 5 × 5, 3 × 3, 3 × 3, and 3 × 3, respectively, followed by three fully connected layers (including the output layer). The convolution layers are interleaved by subsampling layers. A softmax loss layer 13 forms the final output layer of the network, with two outputs representing the treated and untreated class probabilities. Typically, the five convolution layers are repeated in two parallel columns, but for our study, we employed only one column of convolution layers for simplicity, tractability, and availability of enough memory in a single GPU (graphics processing unit) to hold the network. A schematic representation of the network is shown in Figure 1B along with five feature maps from each convolution layer. We used an Nvidia Titan X (Nvidia, Santa Clara, CA, USA) GPU for training our neural network. A detailed description of used tools and parameter settings is provided in the supplemental material.
Network Training
For training, we used a minibatch gradient descent scheme with a minibatch size of 50 images. We observed that the training loss plateaued after 1000 iterations; therefore, we set the maximum training iterations to 2000 for each training run. The learning rate was set at 0.001, and we reduced it to one-tenth of the current value after every 500 iterations. The momentum was set at 0.9. The experiments were performed using the Caffe framework for building deep neural networks. 15
Ablation Study
We foresaw that a potential criticism of our approach could be that the deep architecture may have learned imperceptible variations from the well background (resulting from small changes in the image acquisition conditions) rather than features from the zebrafish, that is, the image foreground. Therefore, in addition to the standard training and testing runs over the original data set to measure classification accuracy, we conducted ablation studies using modified test image sets generated by either completely or partially masking the zebrafish. We masked the zebrafish with pixel intensities similar to the immediate background around the fish. To assess that the classifier actually learnt features from the zebrafish, we performed three ablation experiments.
In the first experiment, we randomly selected five images from both treated and untreated wells (each containing multiple fish) from the test set and found the baseline (i.e., without any ablation) probability of finding a deformed fish. We thereafter completely masked all fish in these selected images and obtained the probability of observing a deformed fish using the deep network, under the assumption that masking the fish should result in large variations in the resulting class probabilities. Such a change would validate our hypothesis that the zebrafish were responsible for the provision of the most discriminative features. In the second experiment, to evaluate which part of the fish had a higher discriminative value for classification, we manually masked the upper part (head and yolk sac) of the fish in the test images. In the third and final study, we similarly masked the lower regions (tail) of fish for the same test images. The resulting changes in class probabilities were recorded under the assumption that significant changes in class probabilities would indicate that the upper or lower part was a dominant discriminative feature.
Results and Discussion
Network Training
We observed that typically with 2000 iterations, the loss gets stabilized and the accuracy reaches above 98% accuracy on the validation set. The changes in loss and accuracy for both training and validation sets as the training progresses are shown in Figure 2 . The plotted lines represent the mean scores, and the confidence intervals represent the maximum and the minimum scores. The network needed less than 30 min for each training run. This means that the network can easily be retrained if ported to a new microscope system or if other experimental parameters are changed. The portability is therefore most likely much faster than it would be for an approach based on user-specified segmentation and deformation metrics.
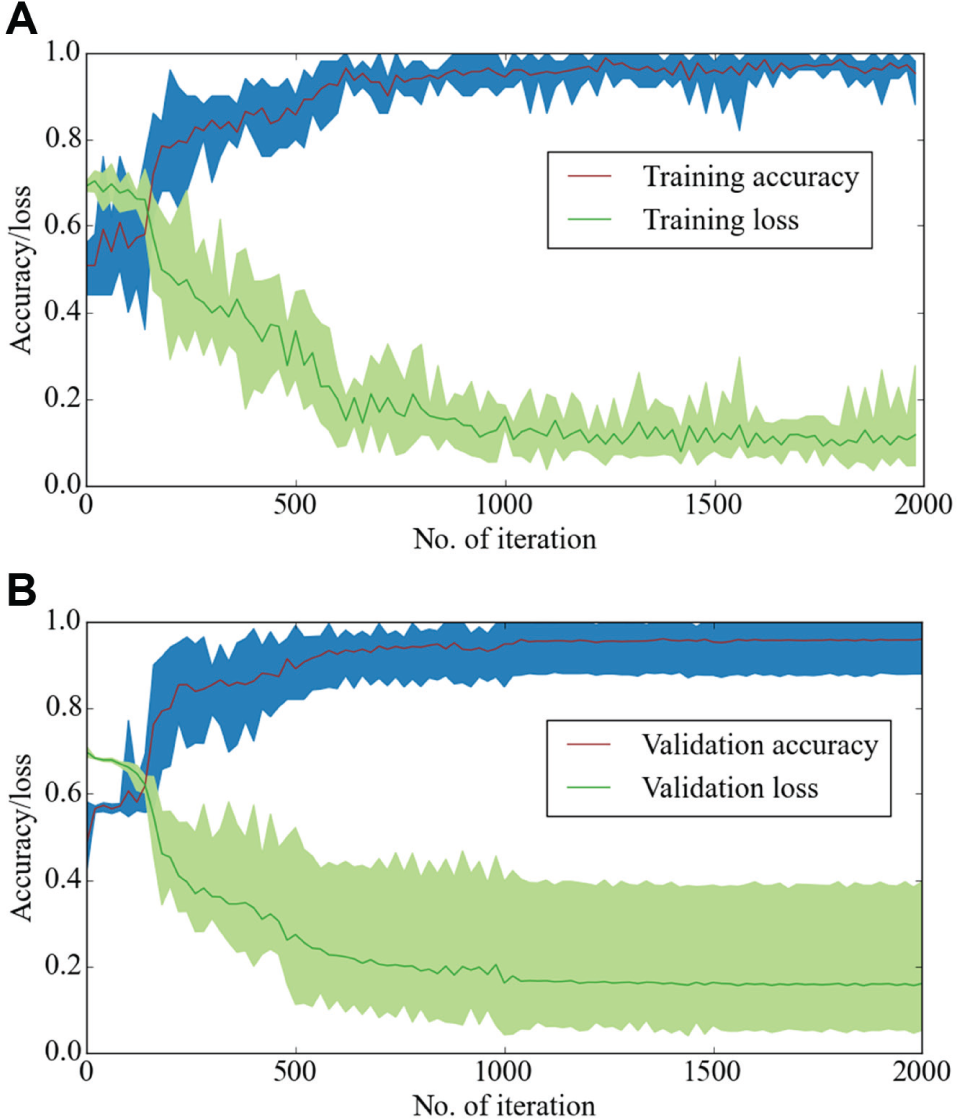
Accuracy and loss plots for training (
Classification
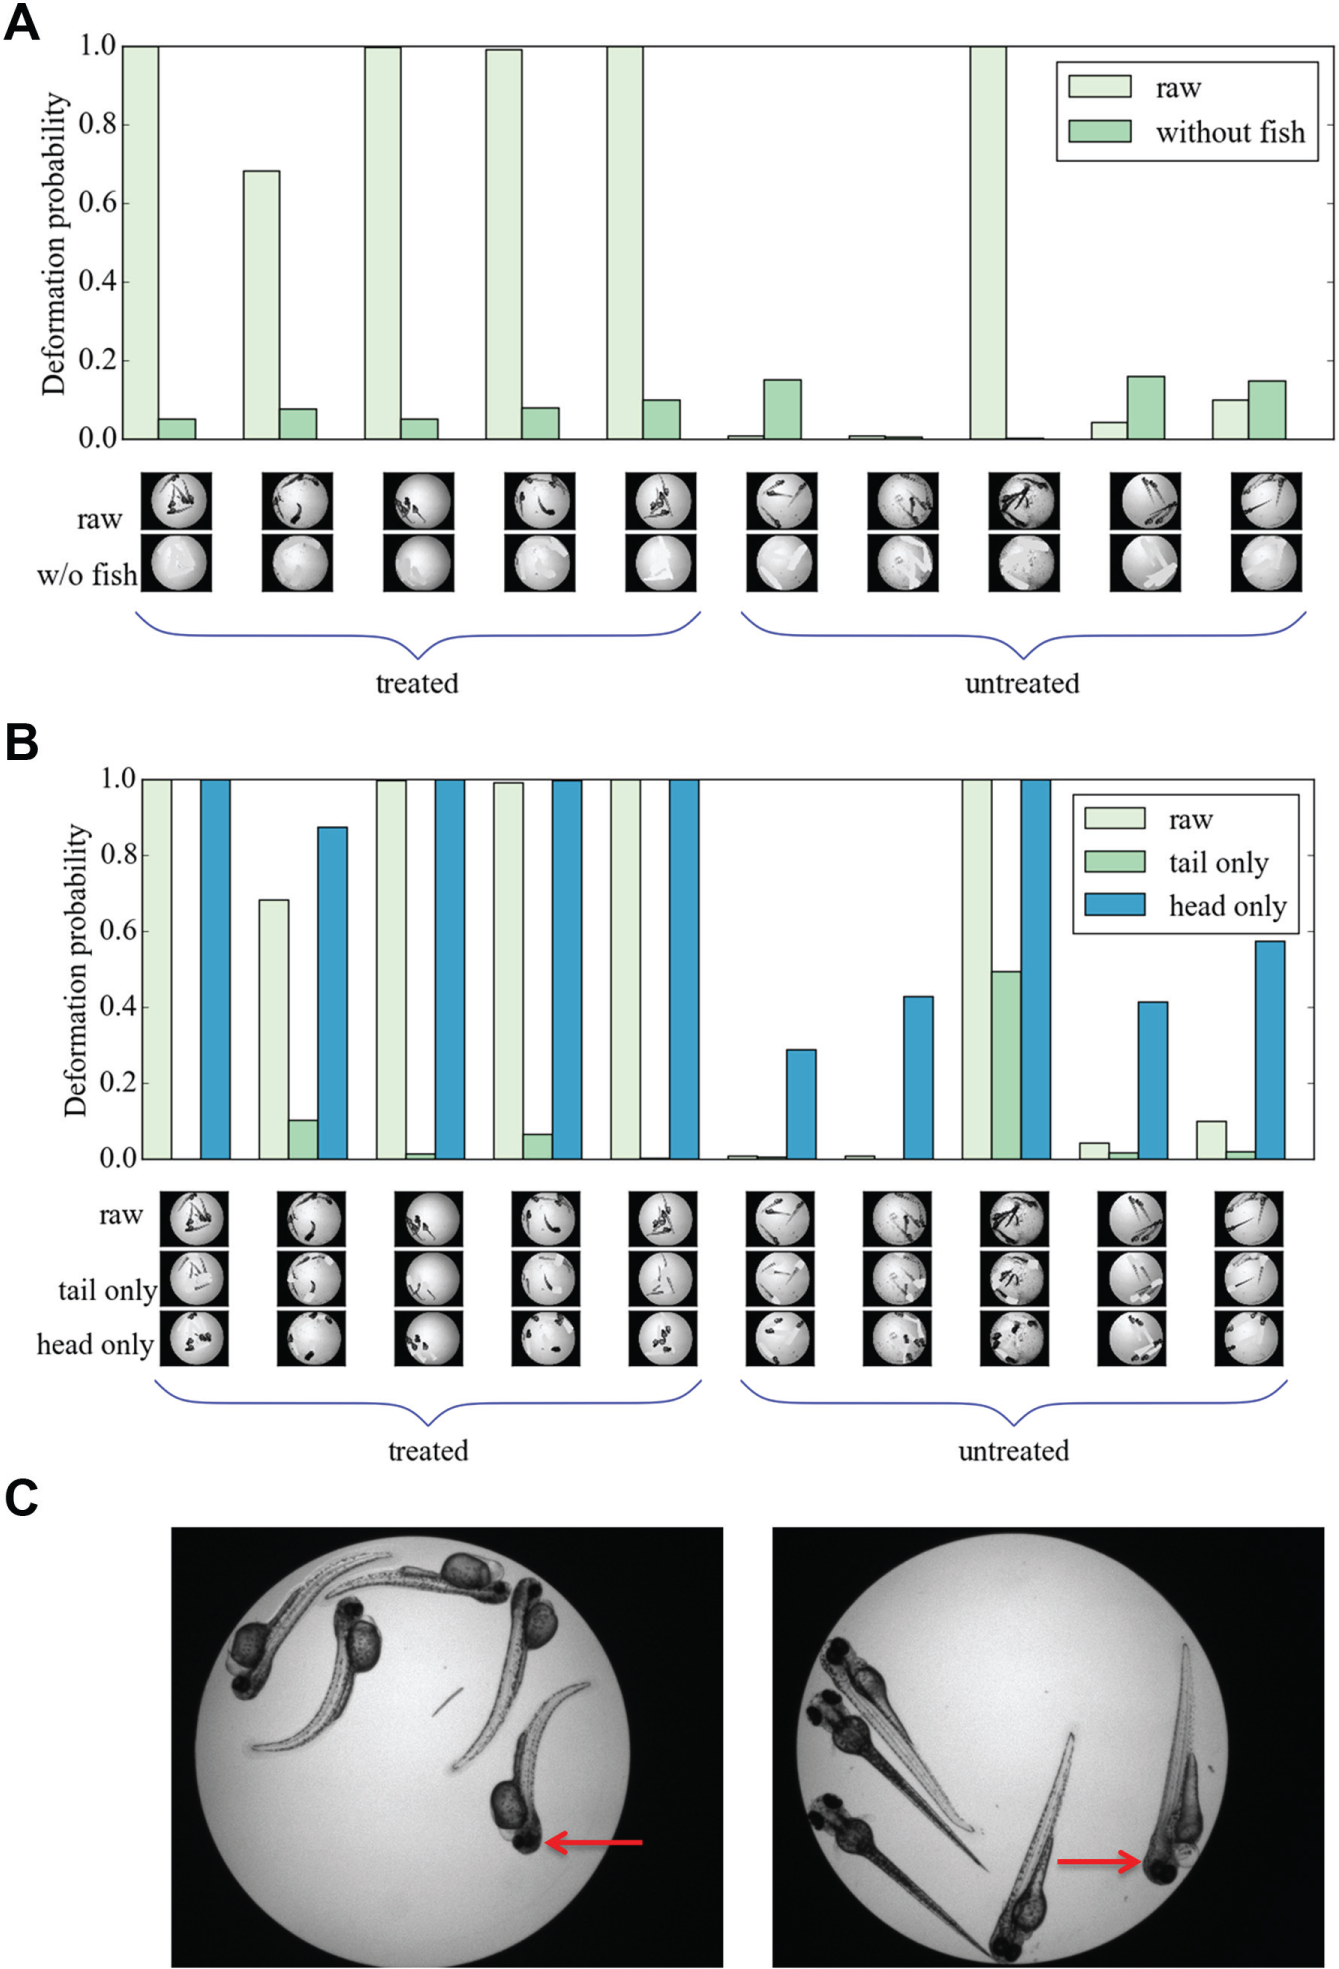
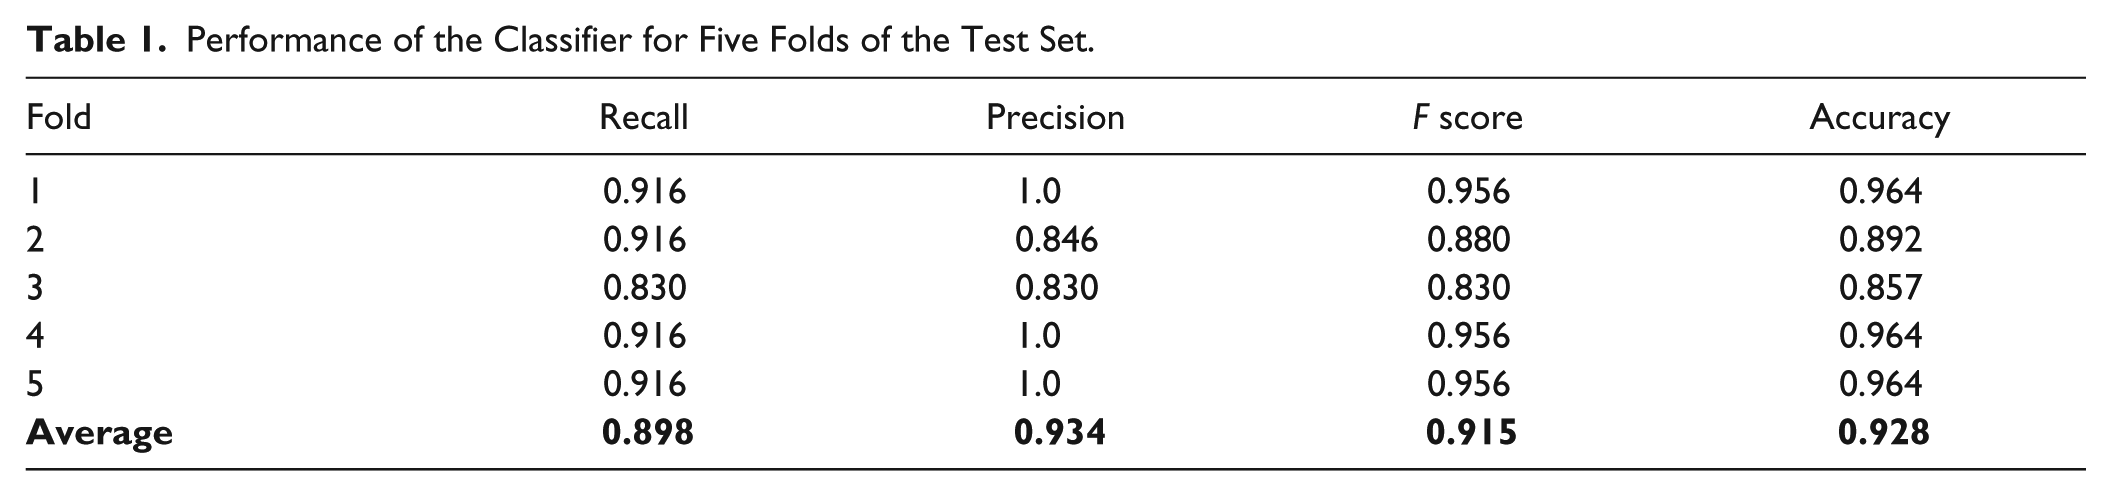
The performance of the classifier was evaluated on independent test sets from five data folds/partitions. We found that the average accuracy was 92.8%, average recall was 89.8%, average precision was 93.4%, and average F score was 91.5%. The result on one of the five test folds is shown in Figure 3A , where the light green columns represent the classifier output (in the form of deformation probability) in the case of treated (five columns to the left) and untreated fish (five columns to the right). The input images are shown at low magnification below each bar. Note that the one image results in a classification error (eighth well from the left in Figure 3A , discussed below). The detailed performance of the classifier on all the testing folds is shown in Table 1 . The results are comparable to the previous results in Ishaq et al. 10 of an accuracy reaching 95% using traditional image analysis techniques. The network needed 0.36 s to classify 28 test images, which clearly indicates the potential usage of the system for high-throughput experiments.
Deformation probabilities for different input images. (
Performance of the Classifier for Five Folds of the Test Set.
Ablation Study
We evaluated the performance of the classifier under varying degrees of foreground ablation. The deformation probabilities of five treated and five untreated microwells (i.e. the baseline) are shown in Figure 3A (i.e., the probabilities are shown by the light green colored bars, and the corresponding images are shown in the first row of wells along the horizontal axis). The result of our first ablation study, when no fish is present, is shown in Figure 3A (i.e., light compared with dark green bars and images with fish removed in the second row under the figure). Observe that the probabilities for deformation are less than 20% for all the cases when the fish are removed. This shows that foreground has a significant influence on the predictions. The eighth well from the left appears to contain dead fish with deformed heads, as well as debris. The deformation probability drops to close to zero when the fish are removed, illustrating that the deformation detected by the deep network is a response to a true deformation (caused by experimental factors unknown to the authors) and not by debris in the well.
In the second ablation study ( Fig. 3B ), the upper part of each fish was removed from the test images. The results, represented as dark green colored bars, show that the upper parts of the fish significantly affect the deformation probability; when the upper part of every fish is removed, the deformation probability falls below 20% for all cases, except for image 8 in Figure 3B , as mentioned above. In the third and final experiment, the lower part of the fish, including the tail region, was removed from the test images, and the resulting deformation probability is shown as blue colored bars in Figure 3B (corresponding wells shown in the third row beneath the bar plot). In this case, the deformation probability does not change much for the treated wells, but the deformation probability of the untreated wells increases. The difference between treated and untreated fish is still significant, both when it comes to sensitivity and specificity. This shows that the head region alone conveys sufficient information to classify fish as treated or untreated, while the tail regions alone do not show a significant difference with the current network. A darkening of the tissues in the head region has previously been reported in zebrafish treated with camptothecin 9 (see arrows in Fig. 3C ). We believe this is one of the features detected by the network, resulting in similar deformation probability for both raw images and images with the lower fish regions removed. The deep network learns features independent of the orientation of fish if both orientations are presented in the training set. We did not observe any impact on classification related to fish orientation. However, if a treatment consistently results in a specific fish orientation, this feature will most likely be picked up by the network.
In this work, we show the potential of deep neural networks for classification of morphological changes in a high-throughput screening setting. No preprocessing of the input data, apart from augmentation by flipping and rotation, was required prior to network training. Furthermore, no handcrafted segmentation approaches or feature measurements had to be tuned, as the network learned features directly from the raw data. Even with a very limited data set, we report competitive classification results at low computational cost. To our surprise, our ablation studies showed that in this screen, the morphology of the head region of the fish is more important as a discriminating feature than the visually apparent bend of the tail region. A closer visual examination of the head regions verified that the morphology of this part of the fish changes in response to drug treatment, indicating that deep learning approaches have the potential to point us to morphological changes not initially obvious by visual inspection. We believe deep learning has the potential to discriminate between wild-type morphology and response to drug treatment for a range of phenotypes in larger screening settings, with little need for manual feature design and parameter tuning.
Footnotes
Acknowledgements
We thank our collaborator, Joseph Negri, for providing us with the images of zebrafish.
Declaration of Conflicting Interests
The authors declared no potential conflicts of interest with respect to the research, authorship, and/or publication of this article.
Funding
The authors disclosed receipt of the following financial support for the research, authorship, and/or publication of this article: Financial support was provided by the Swedish research council grant 2012-4968 and Swedish research program, eSSENCE, to Carolina Wählby.
References
Supplementary Material
Please find the following supplemental material available below.
For Open Access articles published under a Creative Commons License, all supplemental material carries the same license as the article it is associated with.
For non-Open Access articles published, all supplemental material carries a non-exclusive license, and permission requests for re-use of supplemental material or any part of supplemental material shall be sent directly to the copyright owner as specified in the copyright notice associated with the article.