
Abstract
Protein interaction networks are the basis for human metabolic and signaling systems. Interaction studies often use bimolecular fluorescence complementation (BiFC) to reveal the formation and cellular localization of protein complexes. However, large-scale studies were either far from native conditions in human cells or limited by laborious restriction/ligation cloning techniques. Here, we describe a new tool for protein interaction screening based on Gateway-compatible BiFC vectors. We made a set of four new vectors that permit fusion of candidate proteins to the N or C fragment of Venus in all fusion positions. We have validated the vectors and confirmed self-association of AHCY, AHCYL1, and galectin-3. In a high-throughput BiFC screen, we identified new AHCY interaction partners: galectin-3 and PUS7L. We also describe additional steps in protein interaction analysis, applied for AHCY–galectin-3 interaction. First, we classified the interaction in intracellular vesicles using CellCognition, machine learning free software. Then we identified the vesicles as endosomal pathway compartments, in line with known galectin-3 trafficking route. This offers a platform to rapidly identify and localize new protein interactions inside living cells, a prerequisite to validate in silico interactome data, and ultimately decode complex protein networks.
Introduction
Interactome—a map of all the interactions in a living organism—is today what genome was 20 years ago. Difficulties to construct a mammalian system for large-scale screening results in a poorly charted human interactome. Common high-throughput screening approaches, like yeast two-hybrid, coimmunoprecipitation (co-IP), and cofractionation, produce large amounts of data but have certain drawbacks: they are far from the biological context of a human cell, identify only stable protein interactions, 1 or depend on restriction/ligation cloning for library preparation. 2 Bimolecular fluorescence complementation (BiFC) emerged recently as a powerful and sensitive tool to discover new protein–protein interactions (PPIs) in plants, yeast, and mammals. 3 It enables PPIs to be visualized and localized in living cells, indicating possible protein functions. To rapidly chart interaction networks of thousands of newly identified proteins, thanks to extensive genome sequencing studies, we needed a flexible high-throughput cloning method. Gateway cloning technology was satisfying our requirements. Gateway cloning relies on a recombination event that naturally occurs in Escherichia coli, and it allows fast shuttling of the open reading frame (ORF) for the gene of interest into any expression system. 4 Our aim was to construct a new set of vectors for mammalian protein expression that couples Gateway cloning and BiFC. Vectors should be suitable for human protein expression, and the system should not require viral cell transfection, satisfying major aspects lacking in similar systems. We have chosen Venus for fluorescence complementation and made vectors that cover all fusion combinations, so-called topologies, to increase our chances to detect PPIs. 5 Complementation occurs when two nonfluorescent Venus fragments, C and N, reunite and regain fluorescence. The only way for Venus fragments to come together in a living cell is if their fusion proteins interact, which can be observed less than a day after cell transfection. An important aspect that differentiates BiFC from various pull-down assays is that complementation is practically irreversible; thus, it can capture even weak and transient interactions. 6
We focus our research on a recently discovered, potentially lethal, human metabolic disease: S-adenosyl homocysteine hydrolase (AHCY) deficiency. AHCY is an important ubiquitous enzyme that removes S-adenosyl homocysteine (SAH)—a by-product in cellular methylation reactions. 7 AHCY controls the methylation potential of the cell, thereby ensuring the efficient methylation of DNA, mRNA, tRNA, lipid, and protein. Thus, we thought it was essential to explore AHCY interactome.
After designing Gateway-compatible BiFC vectors, we had to validate the new vectors by confirming some already described PPIs, for example, AHCY self-association. 8 After, we could perform a high-throughput screen for AHCY interaction partners within a collection of human ORFs, a set of nearly 20,000 human cDNA clones. Since the BiFC technique relies on overexpressing fusion proteins inside a cell, there was a risk for protein complex misfolding and mislocalization. Misfolded complex can be retained in endoplasmic reticulum, mistargeted from Golgi apparatus, or it can precipitate inside the cell.9,10 To discriminate between functional and misfolded interactions, we used CellCognition, supervised machine learning free software developed to recognize structures in living cells. Based on the software classification of interactions, we could take a step further and identify specific intracellular compartments hosting the interaction complex.
This pipeline could be used for any Gateway-compatible gene of interest, whether in high-throughput screen or detailed interaction analysis.
Materials and Methods
Plasmids and Mutagenesis
Using mutagenic primers (
Modified HA-N and HA-C destination vectors, and StrataClone blunt vectors containing Venus fragments underwent sequential digest with MluI and AgeI, followed by the GeneElute Gel Extraction kit (Sigma, St. Louis, MO), before Quick Ligation (New England Biolabs, Ipswich, MA) of the corresponding fragments, all according to manufacturer’s protocols.
To create a negative control for AHCY self-association, we introduced a STOP codon toward the AHCY C-terminus by restriction (BstEII) and religation (T4 DNA ligase, New England Biolabs), for all AHCY Venus clones. This caused the expression of AHCY lacking its C-terminus. We named these mutants nAHCY NfC/NfN (or nNfC and nNfN).
To create a negative control for galectin-3 self-association, we introduced a point mutation in the C-terminal binding site of galectin-3 using the mutagenic primers described before. 11 This led to a dramatic loss of affinity for N-acetyl lactosamine, and rendered the protein unable to bind its common ligands. We mutated all galectin-3 Venus fusion combinations and named the mutants R186S NfN/NfC/CfN and CfC.
All restriction enzymes were purchased from New England Biolabs. Described Gateway BiFC Venus vectors are freely available for academic use and can be requested from the authors.
Sequencing
The resulting Gateway-compatible BiFC vectors, N-fusion Venus C and Venus N (NfC and NfN), and C-fusion Venus N and Venus C (CfN and CfC), were sequenced using universal sequencing primers: pEGFP-N, pEGFP-FP, and M13F for N-fusion, and CMV-F and T7 for C-fusion. All Venus fusion clones after recombination reaction (LR reaction) were also sequenced with the corresponding universal primers. Sequencing was carried out at a commercial provider (Macrogen, Amsterdam, Netherlands).
ORFeome Gateway Cloning
From ORFeome library v3.1, we used Gateway entry clones AHCY (hORFeome, internal ID: 5896), S-adenosyl homocysteine hydrolase-like 1 (AHCYL1) (hORFeome, internal ID: 8593), galectin-3 (hORFeome, internal ID: 6743), galectin-3-binding protein (hORFeome, internal ID: 7635), TLR7 (hORFeome, internal ID: 10091), and SLC38A1 (hORFeome, internal ID: 3013) and recombined them into Venus destination vectors to obtain all possible Venus fusion combinations/topologies in separate LR reactions using Gateway LR clonase II enzyme mix (Invitrogen), according to the manufacturer’s protocol. After recombination and selection of ampicillin-resistant positive DH5α clones, we extracted the plasmid DNAs with PureYield Plasmid Midiprep System (Promega, Madison, WI).
For high-throughput screening, we pooled one ORFeome entry plate (#11071) that contains 94 ORFs (two wells are empty) and performed four multiplex LR reactions to recombine the gene pool into four different Venus destination vectors for mammalian expression ( Fig. 1 ). After recombination and clone selection, we cultured further 96 clones from each of 4 different Venus fusion bacteria plates. Subsequently, we combined clones from the C-fusion plate with those from the N-fusion plate for both Venus N and Venus C clones (e.g., CfN clone from well A1 with NfN clone from well A1).
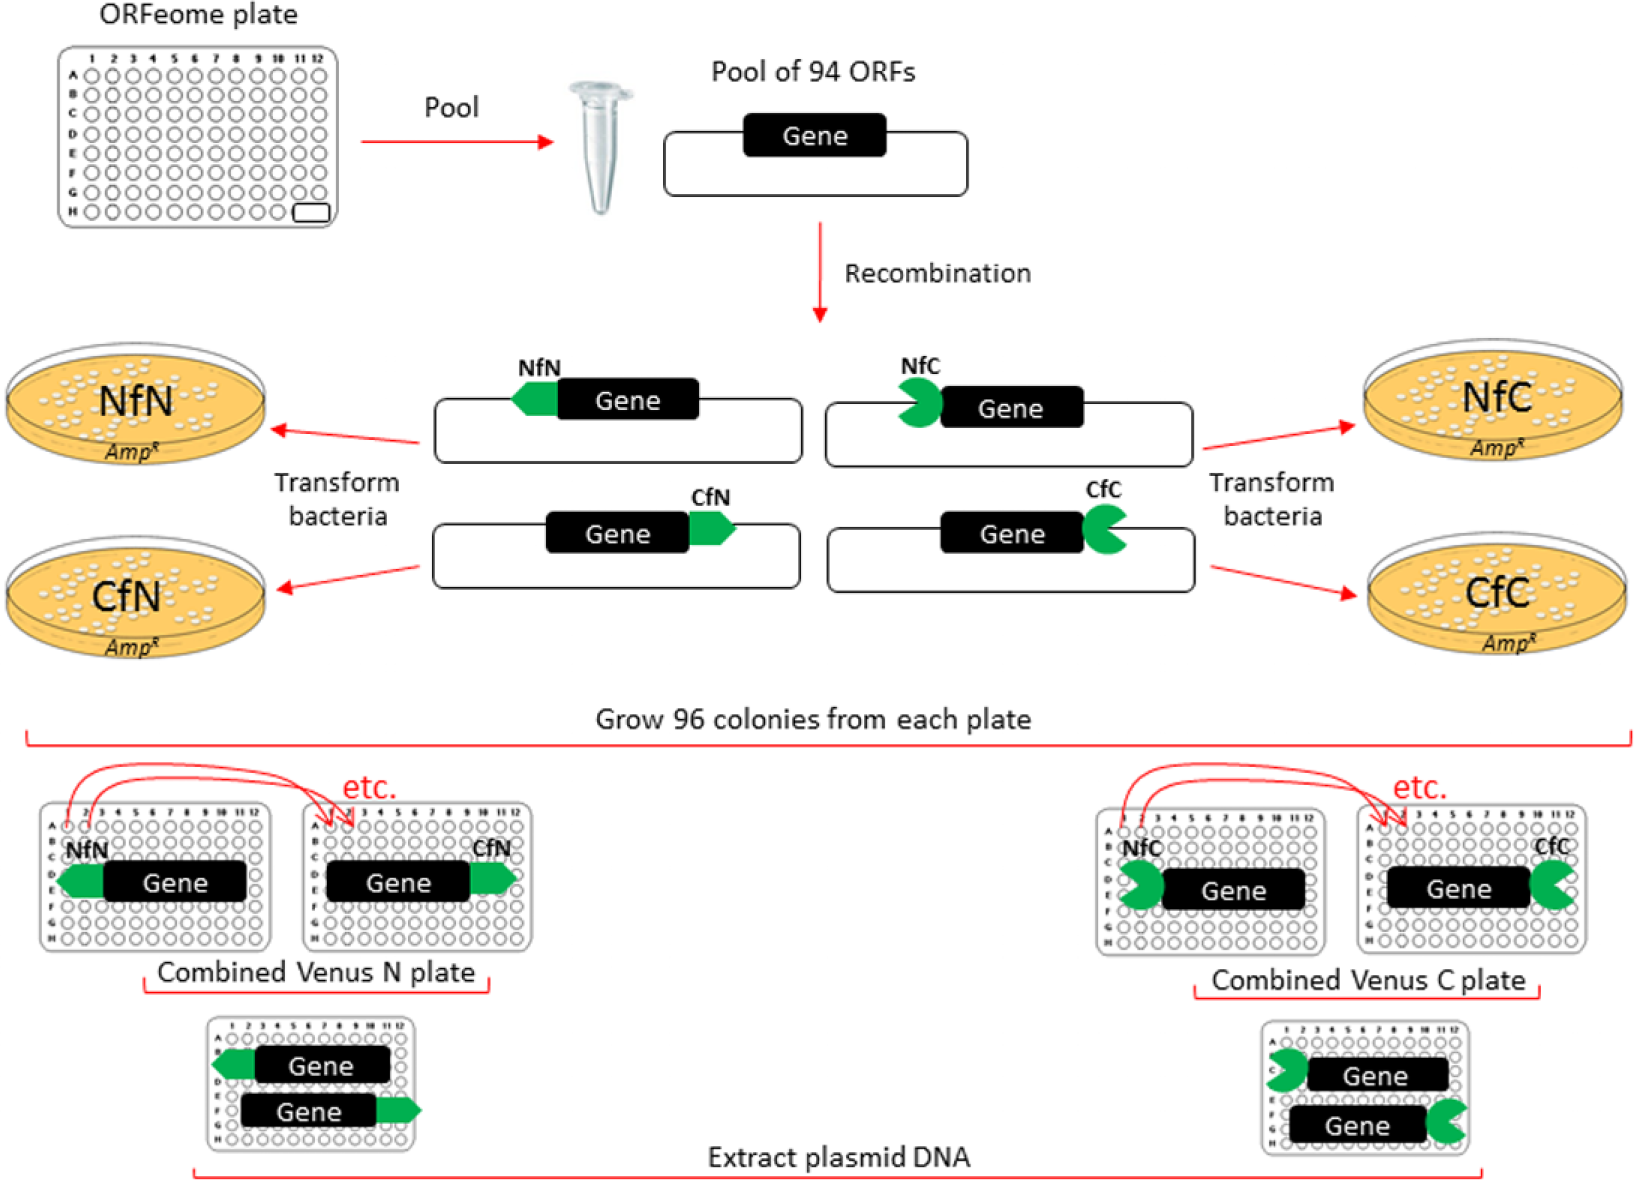
ORF pooling strategy. We pooled ON cultures from ORFeome plate (#11071) and extracted plasmid DNA. We performed four separate LR reactions to move ORFs into BiFC destination vectors. After recombination and selection of positive, ampicillin-resistant clones, we further cultured 96 clones from each plate. Next, we combined plates with cultures containing Venus N (well-to-well mixing of C-fusion with N-fusion plate) and Venus C plates, and extracted plasmid DNA for high-throughput cell transfection.
Cell Culture and Transfection
Hek293T (ATCC) cells (293T) grew in Dulbecco’s modified Eagle’s medium (DMEM) with 10% fetal calf serum (Sigma) and were transiently transfected with Venus constructs using ViaFect transfection reagent (Promega) according to the manufacturer’s instructions. The cell density ranged from 4000 in 386-well to 80,000 in 24-well plates, in a total volume of 50 and 500 μL, respectively. Cells were cultured for 24 or 48 h after transfection before analyses. Humidified 37 °C incubators with 5% CO2 were used for all cell incubations.
BiFC Assay
For protein interaction analysis, 80,000 293T cells were seeded on duplicate coverslips in a 24-well plate and transfected with a total of 300 ng of DNA containing equal amounts of BiFC constructs encoding N- and C-terminal Venus fused to genes of interest in various combinations, with positive and negative controls transfected in parallel. Twenty-four-hour posttransfection cells were washed, fixed with 2% paraformaldehyde (PFA), and observed under a fluorescence microscope (Olympus BXS1) at 400× magnification or a confocal microscope (Olympus FV1000) at 600× magnification.
For high-throughput screening, 5000 293T cells were seeded in four replicates in a 384-well black plate with clear bottom (Corning) and reverse transfected with 25 ng total of DNA: 12.5 ng AHCY in CfC + NfC, or CfN + NfN Venus fusion, and 12.5 ng of combined CfN + NfN 96-gene pool or combined CfC + NfC 96-gene pool ( Fig. 1 ). The positive control was AHCY self-association, and a negative control was truncated nAHCY NfC or NfN interaction with wild-type AHCY. Both were transfected in parallel. Forty-eight-hour posttransfection, cells were fixed, washed, and left in 50 μL of phosphate-buffered saline (PBS) for scanning on an Infinite M200 fluorometer (Tecan, Männedorf, Switzerland) with 500 nm excitation and 530 nm emission wavelengths, top reading option, 3 flashes, and manual gain 100.
To collect images for CellCognition software classification of protein interactions, 4000 293T cells were seeded as above in 384-well plates, in five replicates, including positive and negative controls. Cells were reverse transfected with 7 ng of each plasmid (14 ng of DNA in total). Twenty-four-hour posttransfection cells were fixed and washed, and nuclei were stained with Hoechst. Plates were scanned, capturing from one to six subwell positions, with a ScanR screening microscope (Olympus) for automated microscopy, with reflection-based laser autofocus with a 10 × 0.5 numerical aperture (NA) at 10× magnification.
Software-Based Classification of Interactions
CellCognition is free software first developed to measure morphological changes in live cells. 12 It is based on object detection, multivariate feature extraction, and supervised machine learning; hence, we could apply it to classify protein interaction complexes based on their fluorescence pattern inside the cell. Here, we describe our classification pipeline. First, we segmented the cells (primary objects) using built-in local adaptive thresholding (with “split-and-merge” option) based on Hoechst nuclear stain; then, we defined the cell area (secondary object) by propagating the nuclear region to a fixed radius, constrained by spatial distance of neighboring cells and the gray-level information of the secondary channel (Otsu factor 1). Next, we trained the software by manually annotating 887 sample cells in nine different classes: (1) Golgi, (2) Golgi + dots, (3) dots, (4) diffuse, (5) diffuse + Golgi, (6) diffuse + Golgi + dots, (7) diffuse + dots, (8) other, and (9) no interaction ( Fig. 2A , B ). “No interaction” means no fluorescence, and “other” could not fit in either of the distinct cell classes. “Golgi” resembled known intracellular Golgi staining, while “dots” indicated localization in any of the dotlike intracellular compartments, like early endosomes and lysosomes. “Diffuse” means that there was equal fluorescence throughout the cytoplasm, regardless of fluorescence intensity. For this type of intracellular structure analysis, we disregarded the fluorescence intensity information. After training, software generated a confusion matrix ( Fig. 2C ) and reported the accuracy as class precision (%PR) and class sensitivity (%SE). Reported accuracy was close to 70%, meaning there was a 70% chance a cell would be placed in a correct class, and 70% chance no cells from other classes would be placed in that particular class by mistake. The confusion matrix depicts which classes could be misclassified. In our case, those were classes with the same structure (Golgi, dots) but mixed with “diffuse” staining. This was not the problem for our analysis, since we additionally merged all the classes containing dots into a single class. Overall, 333,218 objects were classified from 4237 images, and the classification results served as a guideline for a subsequent intracellular compartment immunostaining.
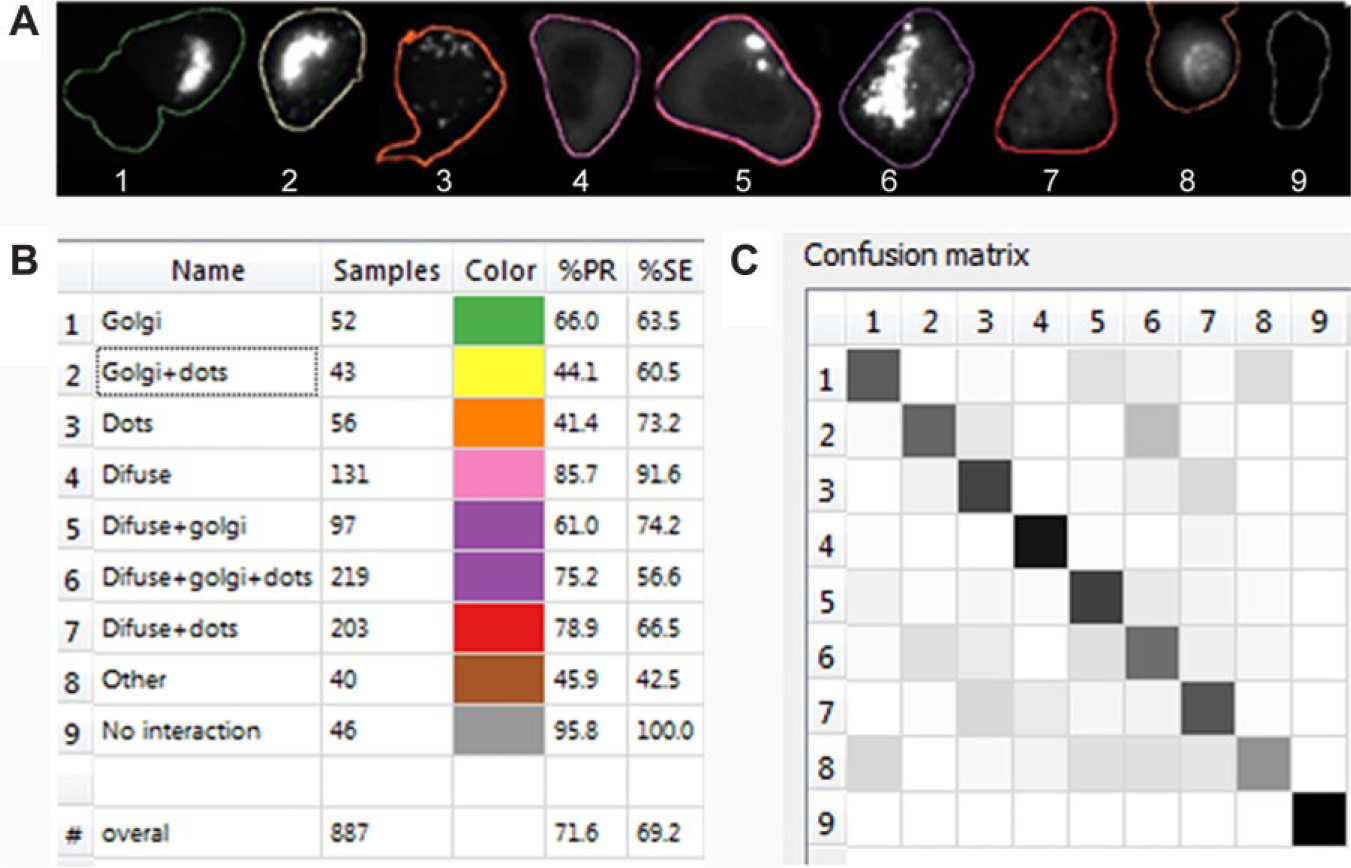
CellCognition classification of interactions. We used free machine learning software, CellCognition, to classify different fluorescent patterns inside the cell. (
Immunofluorescence
For immunofluorescence experiments, cells were fixed with 2% PFA and permeabilized with 0.1% Tween-20 in PBS. Unspecific antibody binding was prevented by blocking with 5% fetal bovine serum (FBS) in PBS/0.1% Tween for 10 min at ambient temperature (RT). To assess native protein expression, we used primary antibodies (all diluted 1:100): monoclonal produced in mouse (Santa Cruz Biotechnology, Santa Cruz, CA) or rabbit (Abcam, Cambridge, UK), and polyclonal produced in goat (Santa Cruz Biotechnology) for AHCY; monoclonal produced in mouse for AHCYL1 (Abcam); and monoclonal produced in rat for galectin-3 (anti-Mac-2 13 ). After washing with PBS, the cells were incubated with corresponding secondary antibody: goat anti-mouse Alexa Fluor594, goat anti-rabbit Alexa Fluor488 (Invitrogen, Carlsbad, CA), or goat anti-rat fluorescein (R&D Systems, Minneapolis, MN). Antibodies for intracellular compartments used to assess localization of interacting protein complexes were mouse anti-human early-endosome-specific protein (EEA1, BD Transduction, San Jose, CA), rabbit anti-human lysosome-specific protein (LAMP1, Sigma Aldrich), mouse anti-human transferrin receptor (TfR, Zymed, South San Francisco, CA), and mouse anti-human late-endosome lysobisphosphatidic acid (LBPA) clone 6C4. All antibodies were diluted in blocking buffer and incubated for 1 h at RT in a moist chamber. As a marker for Golgi apparatus, we used expression plasmid PS-ECFP-Golgi (Addgene, Cambridge, MA). For colocalization analysis, we used FIJI (ImageJ) plugins Coloc2 and Colocalization Threshold. First, we adjusted the threshold for 16-bit images, and then we selected a region of interest (ROI) where the protein complex is expressed. Data are presented as Manders coefficient, a suitable overlap measure of objects with different fluorescent intensities. 14 Manders coefficient 1 was the most informative in our case, as it gives the percent of protein complex overlapping with a specific cell compartment.
Western Blotting
One million to two million Hek293T cells were diluted in lysis buffer (0.9% NaCl, 2.4% Tris, 0.08% EDTA, 0.01% NP-40) with the addition of protease inhibitors cocktail (Roche, Mannheim, Germany). Proteins were separated by denaturating 5%–10% sodium dodecyl sulfate–polyacrylamide gel electrophoresis (SDS-PAGE), and transferred to a polyvinylidene fluoride (PVDF) membrane using Trans-Blot Turbo Transfer Packs and the Trans-Blot Turbo Transfer System (Bio-Rad, Hercules, CA). Membrane was blocked with 5% dry milk in PBS + 1% Tween (PBS-T) for 1 h at RT. Primary antibodies were the same as used for immunofluorescence, diluted 1:1000 in blocking buffer and incubated overnight (ON) at 4 °C. After washing three times (10 min) with PBS-T, corresponding horseradish peroxidase (HRP)–conjugated secondary antibodies (1:5000) in blocking buffer were added for 1 h at RT. Proteins were detected using Clarity Western Blotting Substrate (Bio-Rad) for 5 min, membranes were scanned with C-DiGit Blot Scanner (LI-COR, Lincoln, NE), and images were analyzed with ImageJ software.
mRNA Levels of Venus Constructs
A half-million Hek293T cells were transfected with 1 μg of either AHCY or mutant nAHCY in NfN or NfC Venus fusion, or their combinations. Forty-eight-hour posttransfection total RNA was extracted using trizol reagent (Life Technologies, Waltham, MA), treated with Turbo DNAse (Ambion), and reverse transcribed (ProtoScript II First Strand cDNA Synthesis Kit, New England Biolabs) as per the manufacturer’s instructions. PCRs containing SYBR qPCR Mastermix (Biotool, Munich, Germany) were set up as recommended in the product’s manual. AHCY or nAHCY Venus fusion cDNA was amplified in a TProfessional Thermocycler (Biometra, Goettingen, Germany). The forward primer for Venus C constructs was EGFP-Cf: 5′-gcatggacgagctgtacaag-3′. For Venus N constructs, it was primer N1: 5′-atctgcctaccggtatggtgagcaagggcgagga-3′. For all constructs, we used AHCY-specific reverse primer ahhg3: 5′-cggaatgccagccttggcaat-3′. An additional set of reactions with primers amplifying h18S rRNA from the housekeeping commercial primer set (MCLAB, San Francisco, CA) was used to evaluate the initial mRNA input.
Coimmunoprecipitation
Immunoprecipitation was done with a Direct Magnetic IP/Co-IP kit (Pierce), following the manufacturer’s instructions. GFP-AHCY expressing 293T cells were grown in 10 cm plates for 24 h and lysed with IP kit buffer (Pierce), and cleared lysates were incubated with magnetic beads conjugated with an anti-GFP antibody (orb66649, Biorbyt). After 2 h of incubation at RT and washing of unbound proteins, the bound fraction was either eluted or boiled with SDS loading buffer for Western blot analysis. For detection, we used antibodies as above, goat polyclonal for AHCY and rat monoclonal for galectin-3.
Results
New Gateway-Compatible Vectors for BiFC
Before starting our analysis pipeline, all plasmids were sequenced to confirm that the reading frame was preserved and no mutations were introduced.
To test the sensitivity and specificity of Venus complementation, we first adopted the method for proteins that are known to self-associate: AHCY and galectin-3. AHCY forms hydrolytically active tetramers, and galectin-3 forms dimers to multimers, depending on its localization and function. We made four Venus fusion combinations for both proteins, and transfected 293T cells with complementary fusion pairs, and we could see a gain of fluorescence in all combinations for protein self-association (
Fig. 3A
). In parallel, under the same transfection conditions, we used a set of controls to evaluate background fluorescence: empty Venus destination vectors (no protein fused to Venus fragments) or a combination of empty Venus vector with a corresponding Venus-fused AHCY or galectin-3 (
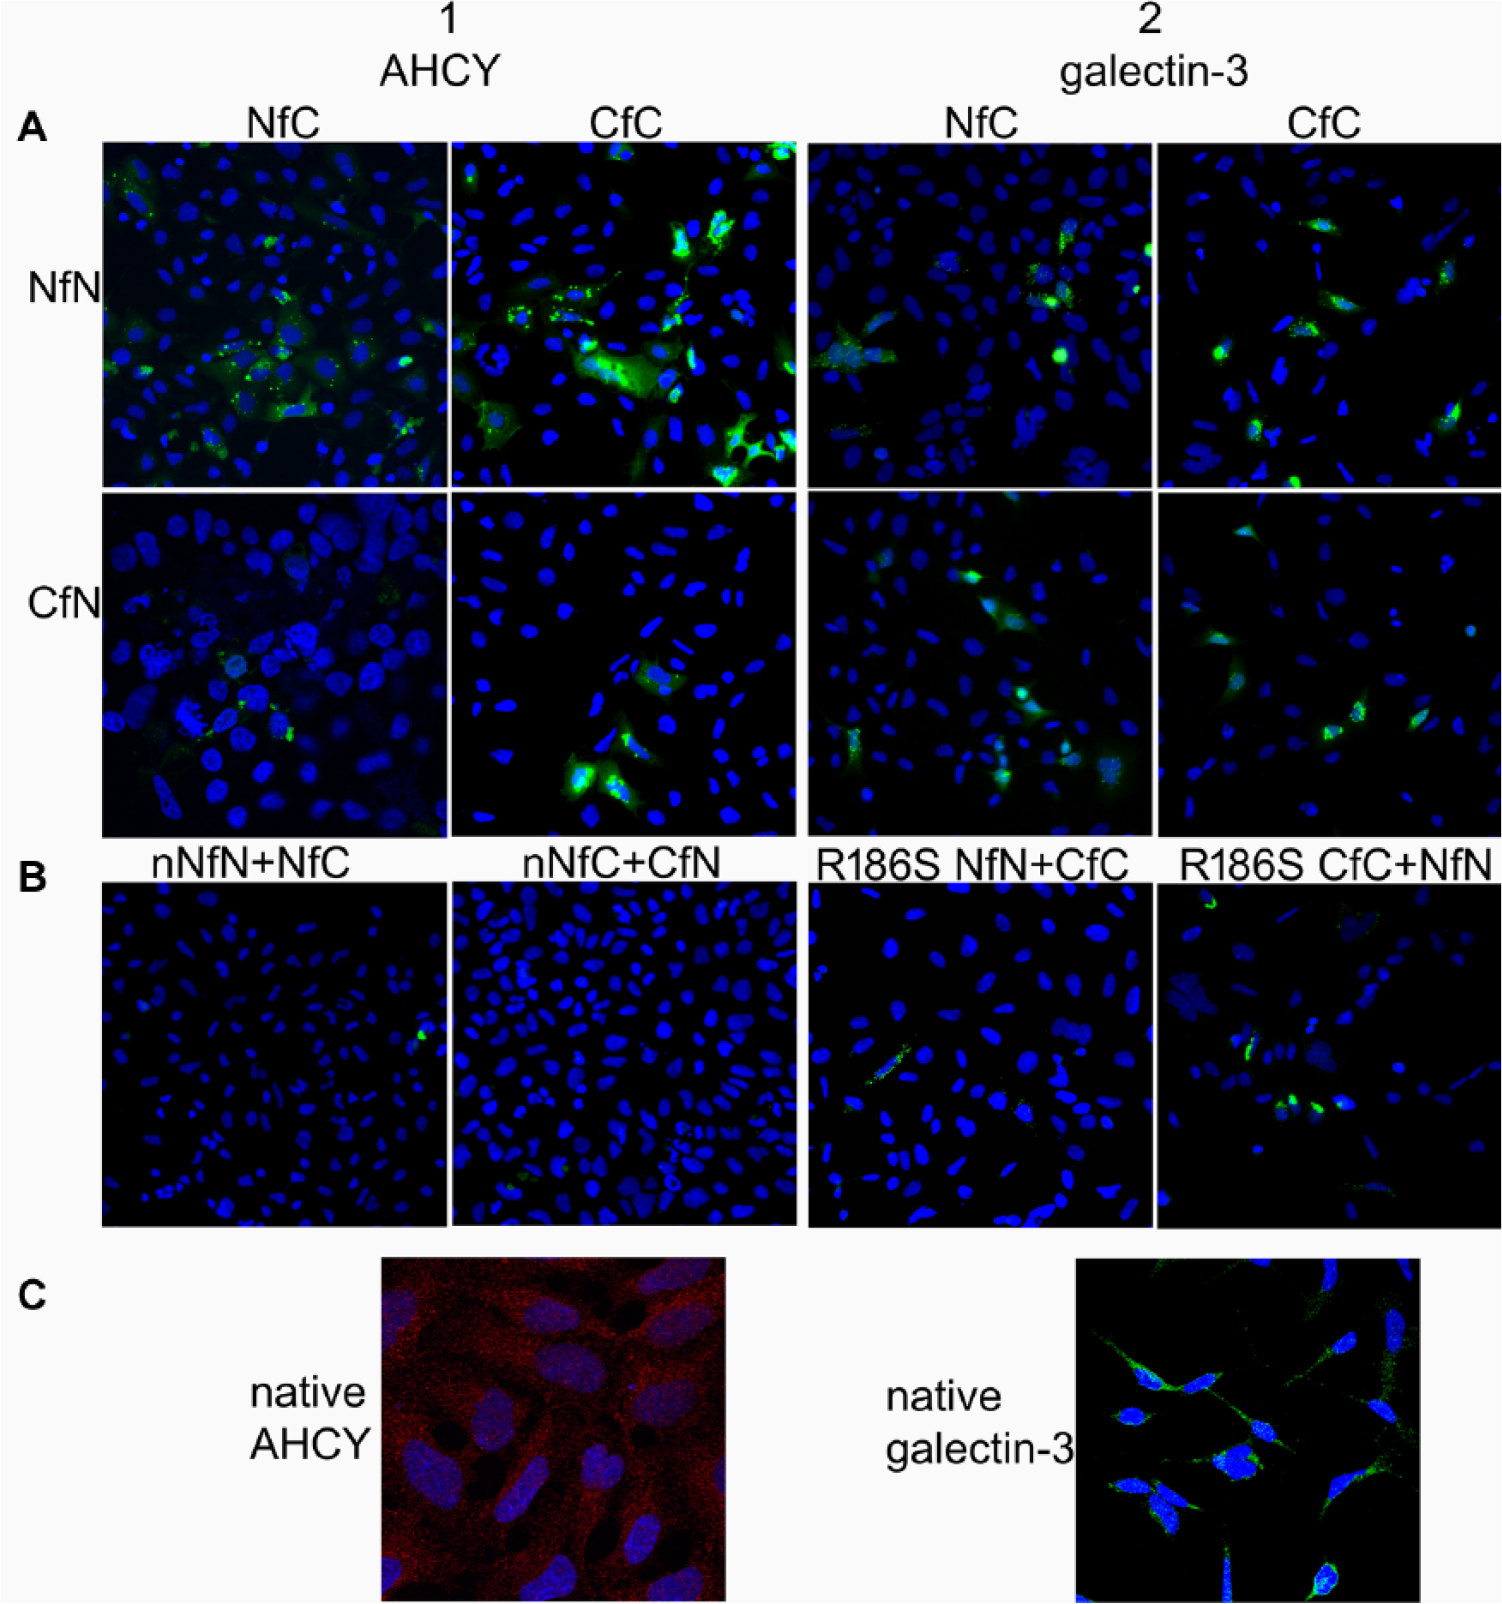
Gateway-compatible BiFC vectors used to visualize self-association of AHCY and galectin-3. (
AHCY Self-Association
After validating our new BiFC vectors, we analyzed AHCY self-association in more detail. We wanted to see how fusing Venus fragments on a protein amino or carboxyl terminus could influence self-association, and also binding to other proteins. We also tested if there is a bias resulting from Venus fragment size, since Venus C has 82 and Venus N 158 amino acids. As inferred from the crystal structure,
15
AHCY self-associates through its C-terminal domain and any protein fusion system that produces a C-terminal tag could abolish both AHCY self-association and activity.
16
However, we observed AHCY self-association even when the interacting AHCY pairs had Venus fused to their C-termini, but self-association appeared to be much less efficient, especially if the fused fragment was bigger, Venus N (
Fig. 3
,
1A
). It is possible that AHCY with a C-terminal Venus tag loses its activity, while a flexible Venus linker allows AHCY to self-associate, perhaps not as an active tetramer, but a dimer. Buildup of protein inside the cell in a plasmid expression system could theoretically lead to unspecific and irreversible Venus reconstitution, but we did not see Venus fluorescence higher than the background in a control experiment with a truncated AHCY mutant (nAHCY) expressed under the same conditions (same incubation time after cell transfection) as the wild type (
Fig. 3
,
1B
Galectin-3 Self-Association
A plethora of published data about galectin-3 binding and self-association make this protein a great validation tool for our new BiFC system. Galectin-3 can self-associate through both its N- and C-terminal domains;
18
thus, we could test if the fused Venus parts interfere with both types of self-association. We observed galectin-3 self-association in all fusion combinations, and compared the fluorescent images with galectin-3 native expression in 293T cells (
Fig. 3
,
2A
). Galectin-3 showed vesicular expression throughout the cell (
Fig. 3
,
2C
), as it is known to reside in cells’ endosomal compartments
19
with a substantial nuclear portion, also reported before.
20
CellCognition analysis revealed that interaction between galectin-3 NfN and CfC had the most dot-containing structures (
High-Throughput Screening for AHCY PPIs
Gateway technology allows fast shuttling of any gene into any expression system. For our screening assay, we have transferred a pool of genes into a BiFC expression system to enable fast visualization of new protein interactions. To demonstrate the interaction screening procedure, we have chosen AHCY as bait, but the same could be applied for any protein of interest. We made a pool of pray from an arbitrary ORFeome library plate (#11071) containing 94 different ORFs. We also added the known clones prepared before: AHCYL1, galectin-3, galectin-3-binding protein, TLR7, and SLC38A1 (solute carrier transporter family member), including positive (AHCY self-association) and negative (nAHCY binding to wild-type AHCY) control. The present consensus on the BiFC assay is to test all possible fusion topologies when probing PPIs. 21 The orientation of the Venus fusion to either the N-terminus or the C-terminus of the protein of interest must not disturb the protein binding, or block the targeting signals for protein localization (e.g., C-terminal signals for nuclear or ER localization, or N-terminal mitochondria targeting peptides). 22 Considering these facts, we prepared four gene pool versions: NfN, CfN, NfC, and CfC. Then we made a second round of pooling, combining NfN with CfN and NfC with CfC plates—to obtain pools of either only Venus C–tagged or only Venus N–tagged clones ( Fig. 1 ). We screened the pools of unknown Venus N and Venus C clones against AHCY, accordingly tagged with either Venus C or Venus N. In parallel, we tested the known clones in the same way. The screening included positive control (AHCY self-association) and negative control (nAHCY association to wild-type AHCY) to verify signal-to-noise ratio and to normalize the scale of fluorescence intensities. This was done in four replicates in 384-well plate format (AHCY N + 11071 C and AHCY C + 11071 N). Dunnett’s multiple comparison test (p < 0.05) revealed three positive hits: pseudouridylate synthase 7-like (PUS7L, clone ID: 9679), AHCYL1, and galectin-3. PUS7L was identified by sequence alignment against standard nucleotide collection (NCBI Blast). Interaction with AHCYL1 was suggested earlier, 23 and was a subject of our previous work as one of the top 10 positive interactors from a co-IP/mass spectrometry study (unpublished results). SLC38A1 and the galectin-3-binding protein were also among those top 10 positive hits, but in the BiFC assay, they were not significantly different from the negative control ( Fig. 4 ). On the other hand, interactions with galectin-3 and PUS7L were not captured by our co-IP/mass spectrometry study, but were identified here by the BiFC assay as the AHCY interacting partners. TLR7 was included in the screen as an additional known ORF, and it did not interact with AHCY. We have chosen AHCY interaction with galectin-3 for the following steps in our interaction screening pipeline, and used already studied interaction with AHCYL1 as a point of reference.
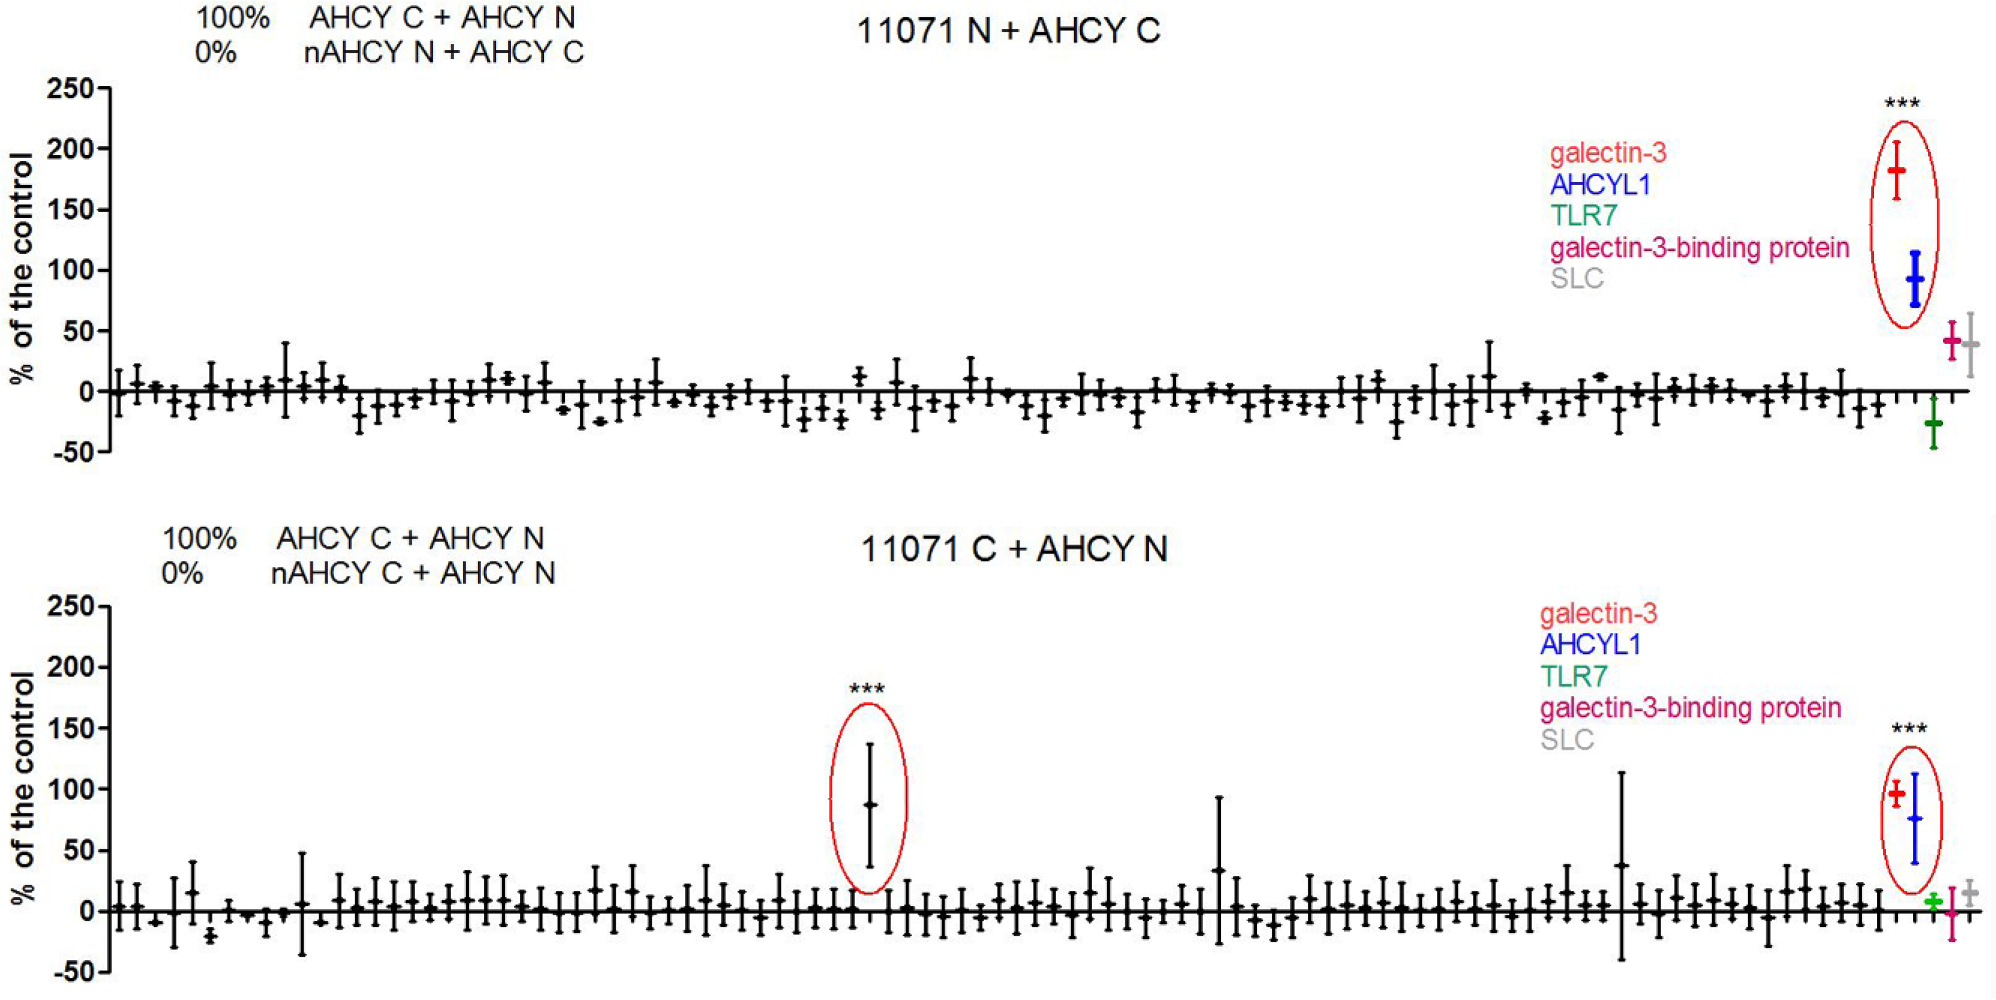
High-throughput screening for AHCY interacting partners. Four replicates of 293T cells were transfected with Venus clones: AHCY against 96 unknown clones from the pool of ORFs, and 5 known clones. Venus complementation was allowed for 48 h before measuring the fluorescence. Data (mean ± SD) are presented as a percent of positive control (AHCY self-association). AHCY association with nAHCY mutant served as a negative control and represented 0%. Dunnett’s multiple comparison test (***p < 0.05) was used to identify positive hits, i.e., samples with higher fluorescence than the negative control.
AHCY Interaction with Galectin-3
Interaction of AHCY and AHCYL1 was first suggested based on their sequence similarity and then confirmed in our previous study. We also confirmed that both proteins form oligomers, and nAHCY mutant cannot bind to any of them. AHCY self-associates through its C-terminus; thus, structurally similar AHCY and AHCYL1 may well interact through their C-termini. Indeed, we have seen that if AHCY had Venus N fused to its C-terminus, it bound less efficiently to AHCYL1 (
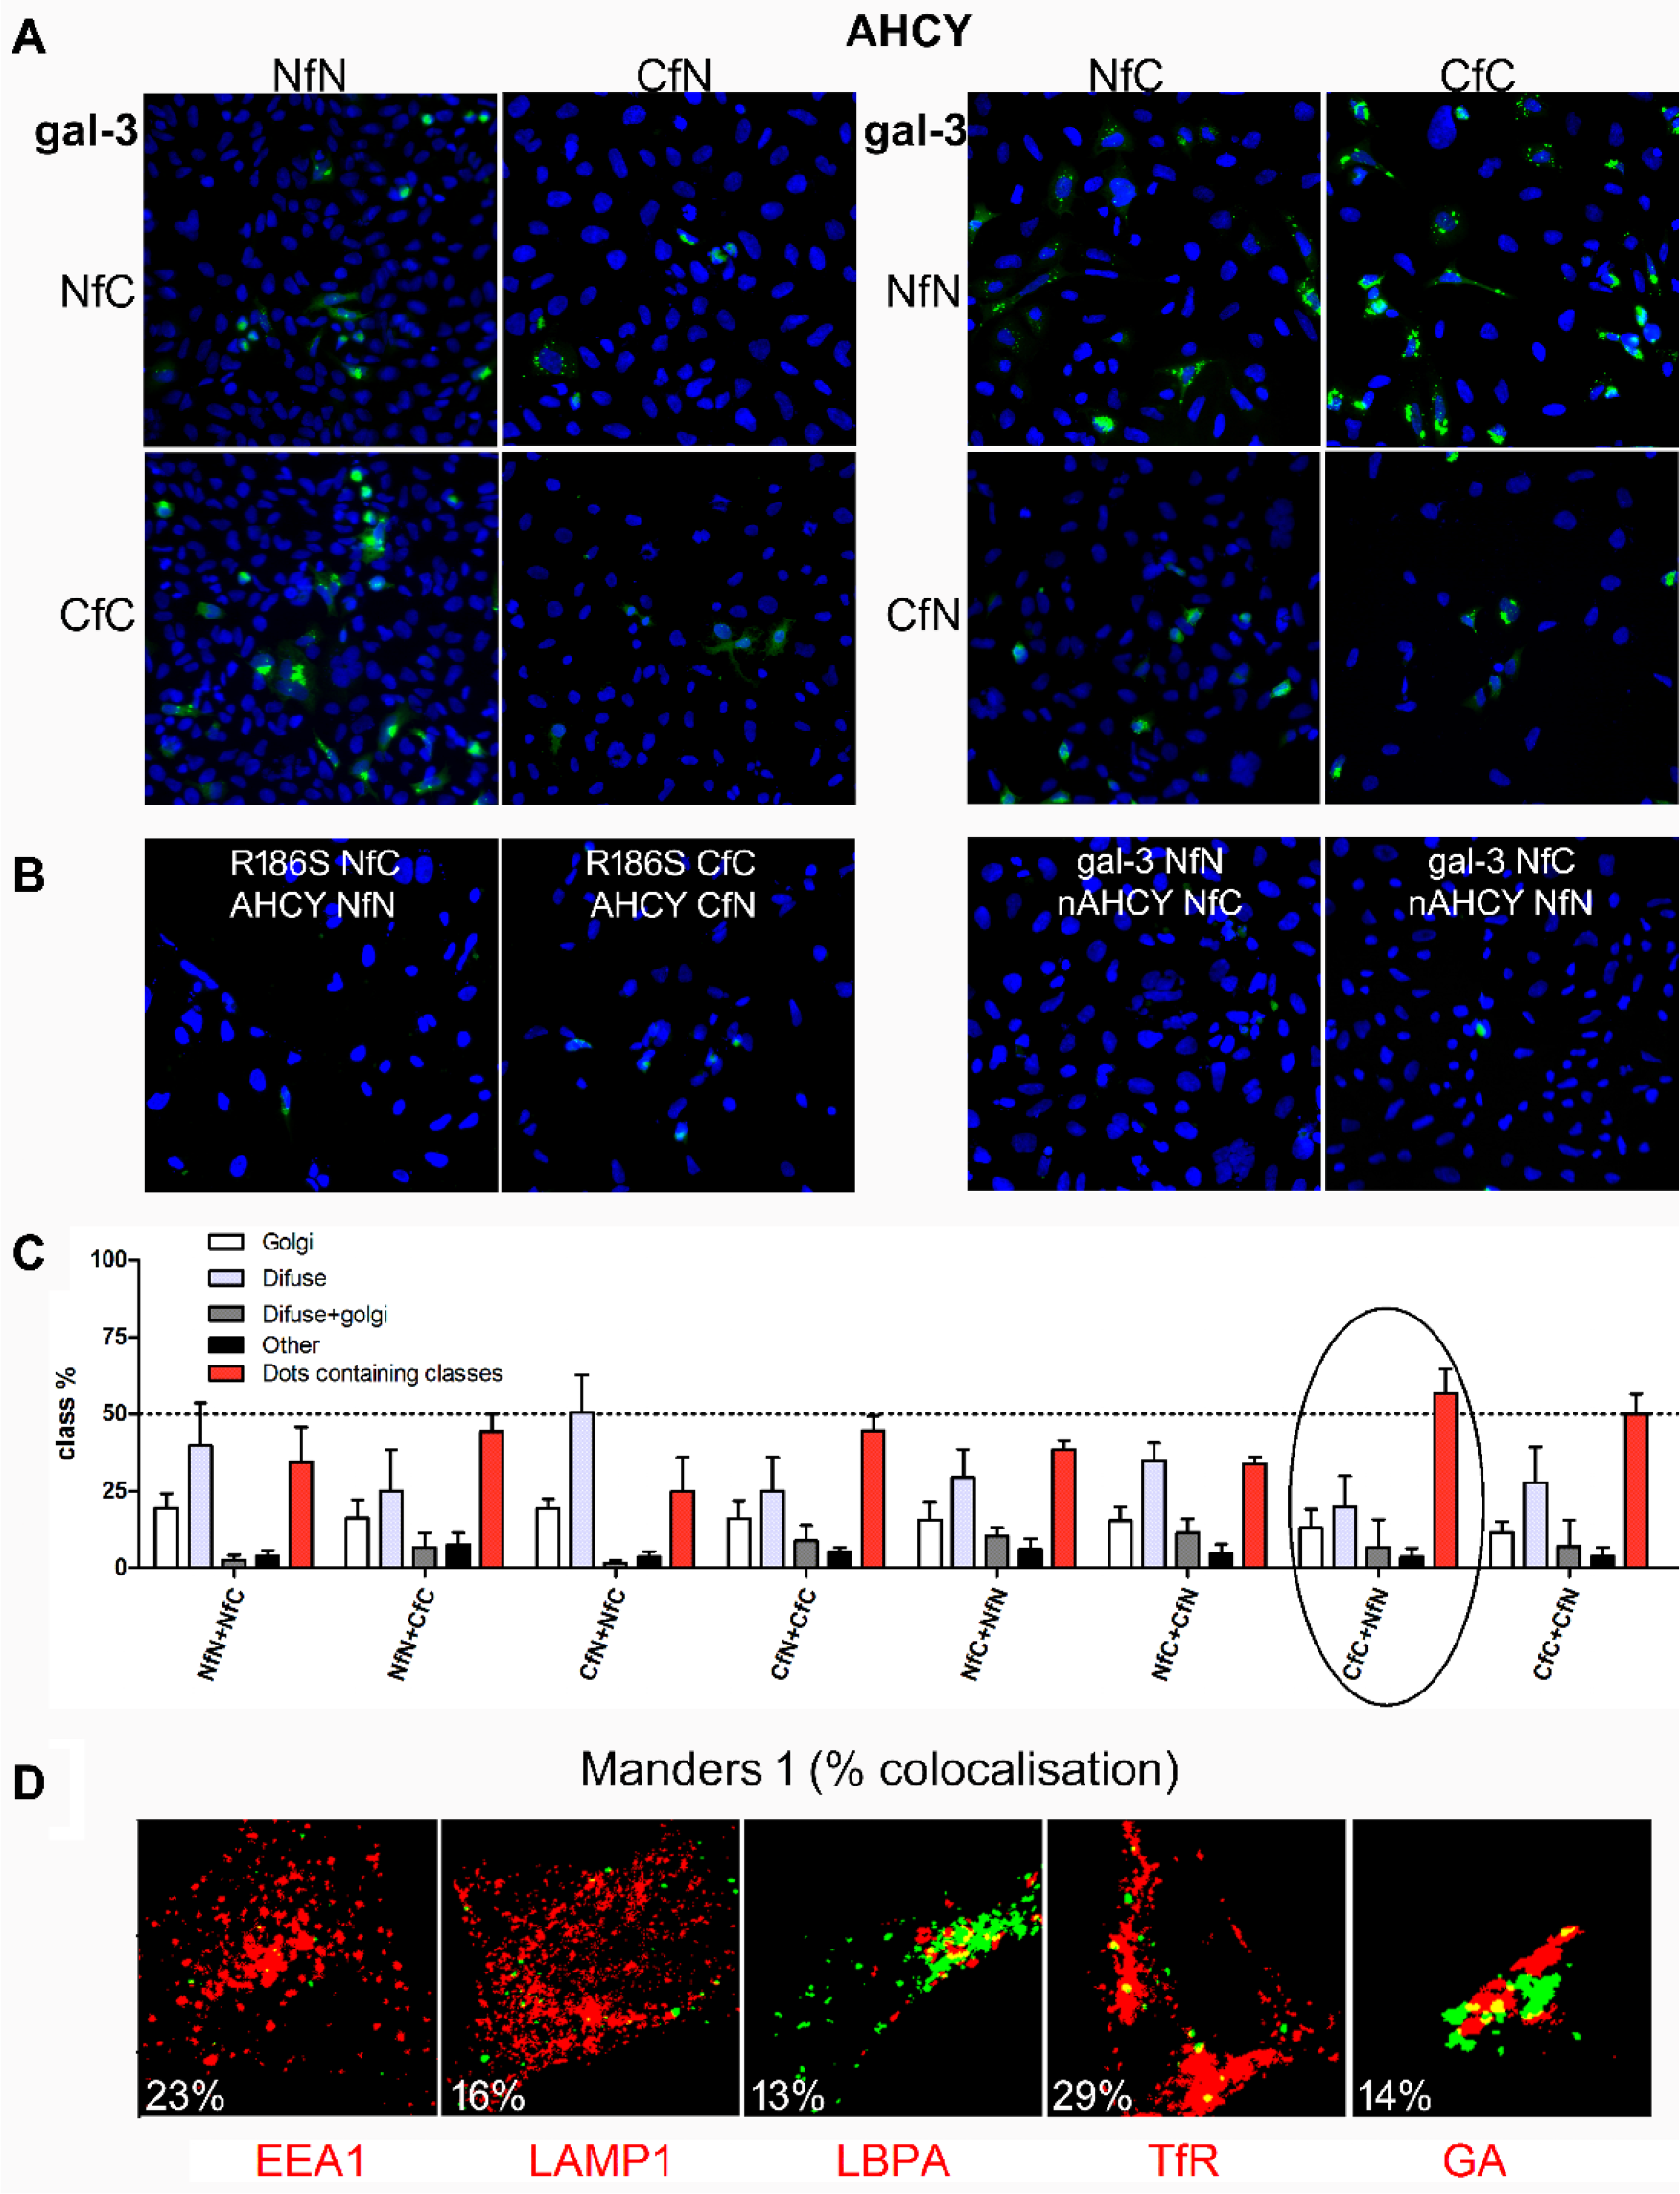
Analysis of AHCY–galectin-3 interaction. (
Classifying Protein Interactions Based on Intracellular Fluorescence
Besides focusing on fast screening of PPIs, here we describe an additional step in interaction analysis: classification of novel interactions based on the intracellular fluorescent pattern. Different patterns are put into classes that serve as a checkpoint before identifying a specific intracellular compartment by immunostaining. In the BiFC interaction assay between two different proteins, there are eight possible interaction combinations/topologies depending on the Venus fusion position and fused Venus fragment. Initially, we observed that different combinations show different intracellular fluorescent patterns. We classified different patterns in eight classes and named them as they appeared, for example, “Golgi,” similar to Golgi apparatus (GA); “dots,” similar to different endosomes; “diffuse,” similar to diffuse cytoplasmic localizations, and so on (
Fig. 2A
). Our idea was to restrict further analysis and disregard possible aggregates and mislocalized complexes by comparing BiFC fluorescence to native expression and by software-based fluorescence classification. In our cell model—human kidney 293T cells—AHCY shows a predominantly vesicular intracellular staining pattern, similar to galectin-3, while, for example, AHCYL1 shows predominantly diffuse cytoplasmic staining (
Intracellular Localization of AHCY and Galectin-3 Complex
A final step in our analysis pipeline was to identify intracellular compartments hosting the interaction. Based on native expression of both AHCY and galectin-3 and classification analysis, we chose the AHCY CfC + galectin-3 NfN combination, and mapped its intracellular path. To test if the BiFC signal was localized to a specific subcellular compartment, we performed immunofluorescence analysis 24 h after transfection using markers for the endocytic pathway, previously identified as colocalizing with galectin-3 in several studies ( Fig. 5D ).19,27 Plasmid expressing the ECFP-Golgi marker was coexpressed together with our BiFC constructs. We found that 23% AHCY + galectin-3 complex localized in early endosomes (EEA1), and 29% in recycling endosomes (TfR). Less was localized in lysosomes (16%, Lamp1) and late endosomes (13%, LBPA). A fraction of 14% was found colocalized with Golgi apparatus. These experiments demonstrate that our BiFC system is also suitable for mapping the subcellular locations of the proteins in interaction.
Discussion
We have constructed a new set of mammalian Gateway-compatible vectors for BiFC, in four different versions, to permit fusion of candidate proteins to the N or C fragment of Venus in all fusion positions, so-called topologies. Despite its superiority to test PPIs, 28 only a few studies tried to adopt BiFC for mammalian expression. Similar vectors either required a tedious retroviral infection of human cells 29 or offered only C-terminal fusion vectors with an inferior Venus ancestor. 30 Venus fusion orientation can disturb protein binding or block its localization signal. 22 Therefore, a widely accepted consensus is to test all possible fusion topologies in a BiFC assay before concluding whether two proteins interact. 31 To validate our newly designed Gateway-compatible BiFC vectors, we have confirmed some already described interactions: self-association of AHCY, AHCYL1, and galectin-3, 18 and a heterointeraction between closely related AHCY and AHCYL1. 23 In a pilot screen for AHCY interactors, we have identified PUS7L and galectin-3 from a pool of around 100 genes from the human ORFeome library. We have chosen the interaction between AHCY and galectin-3 to demonstrate the steps in our pipeline for identifying and classifying new interactions. We report this interaction here for the first time in a live cell system. In 2014, Carvalho and coworkers 32 marginally reported the interaction captured by tandem affinity purification coupled with mass spectrometry. Galectin-3 is a ubiquitous protein involved in intracellular traffic and transport of nuclear proteins. 33 Like AHCY, it enters the nucleus in an unconventional way, 20 where both proteins are suggested to take part in mRNA modifications—AHCY in mRNA capping 34 and galectin-3 in pre-mRNA splicing. 35 Here, we show that AHCY in complex with galectin-3 partially localizes within compartments of the endocytic pathway, and galectin-3 is known to steer its interaction partners through this pathway toward their next destination. 25 In the present study, we failed to confirm this interaction with an additional method, that is, co-IP. While co-IP and similar pull-down assays capture stable protein interactions, BiFC captures weak and transient protein interactions, and these methods could work in complement. Venus complementation serves as the cross-linker inside the cells, and preserves the interactions that we might not notice otherwise. Surprisingly, our BiFC assay could not capture known interaction between galectin-3 and galectin-3-binding protein. One possible explanation is that galectin-3-binding protein is rapidly excreted outside the cell before it manages to interact with galectin-3; another is that Venus fusion topology prevents protein interaction. This exposes one downside of BiFC assay: occurrence of false-negative results. An upside is that the spontaneous interaction of two proteins that naturally do not interact is not likely. Taken together, it appears that the number of conditions to be satisfied for the interaction to happen exceeds the chance for unspecific Venus complementation. Nevertheless, interaction between AHCY and galectin-3 should be validated further, as any new interaction emerging from this type of screen. Certain ubiquitous proteins, like AHCY and galectin-3, might have an enhanced interaction potential, easily captured by the BiFC assay.
We consider our new BiFC system a worthwhile tool for the interactome research field, offering a near-native environment for fast and reliable visualization of new protein interactions.
Footnotes
Acknowledgements
We thank the Advanced Light Microscopy Facility (ALMF) at the European Molecular Biology Laboratory (EMBL) for support. We thank Lucija Horvat from the imaging facility at Ruđer Bošković Institute. We thank Dr. Tiago Fleming Outeiro for α-synuclein–Venus BiFC plasmids and Dr. Stephan Pusch for Gateway Destination plasmids. We thank Dr. Silva Katušić Hećimović for antibodies for intracellular compartments and Dr. Hakon Leffler for galectin-3 antibody. The research was funded by FP7-REGPOT-2012-2013-1, grant agreement number 316289—InnoMol.
Declaration of Conflicting Interests
The authors declared no potential conflicts of interest with respect to the research, authorship, and/or publication of this article.
Funding
The authors received no financial support for the research, authorship, and/or publication of this article.
References
Supplementary Material
Please find the following supplemental material available below.
For Open Access articles published under a Creative Commons License, all supplemental material carries the same license as the article it is associated with.
For non-Open Access articles published, all supplemental material carries a non-exclusive license, and permission requests for re-use of supplemental material or any part of supplemental material shall be sent directly to the copyright owner as specified in the copyright notice associated with the article.